40
Chapter 5 – Portfolio Management 17 June 2021 © THE INSTITUTE OF CHARTERED ACCOUNTANTS OF INDIA 1

Chapter 5 – Portfolio Management
17 June 2021 © THE INSTITUTE OF CHARTERED ACCOUNTANTS OF INDIA 1

Introduction
Investment in one security provides returns but can be risky.
Portfolio is a collection of securities in which investment is made to get higher returns with lower risk.
Securities are picked up basis the risk return profile and the proportion to be invested is carried out.
Portfolio management is to diversify the risk and invest in securities so as to maximize the return and minimize the risk.
In this topic we would study different types of theories for calculating return and risk as well as evaluating a portfolio.
4 June, 2021 © THE INSTITUTE OF CHARTERED ACCOUNTANTS OF INDIA 2

Objectives of Portfolio Management
Security/Safety of Principal Amount
Stability of Income
Capital Growth
Marketability i.e. the case with which a security can be bought or sold
Liquidity i.e. nearness to money
Diversification
Favourable Tax Status
4 June, 2021 © THE INSTITUTE OF CHARTERED ACCOUNTANTS OF INDIA 3

Return
4 June, 2021 © THE INSTITUTE OF CHARTERED ACCOUNTANTS OF INDIA 4
∑n
1i=
ii )p(X x=X
The expected return of the investment is the probability weighted average of all the possible returns. If the possible
returns are denoted by Xi and the related probabilities are p(Xi) the expected return may be represented as
The possible return are the different possible return for a security or a portfolio.

Risk
4 June, 2021 © THE INSTITUTE OF CHARTERED ACCOUNTANTS OF INDIA 5
Risk is defined as variability in returns of a security or portfolio
The most popular measure of risk is the variance or standard deviation of the probability distribution of possible returns. Variance of each security is generally denoted by σ2 and is calculated by using the following formula: σ2 =
])p(X )X - [(X
n
1i=
i2
i∑
Standard deviation measures the total risk of a security

Types of Risk
4 June, 2021 © THE INSTITUTE OF CHARTERED ACCOUNTANTS OF INDIA 6
Systematic Risk comprises factors that are external to a company (macro in nature)
Unsystematic risk comprises factors that are internal to a company (micro in nature)
Risk can be classified into the following

Systematic Risk
4 June, 2021 © THE INSTITUTE OF CHARTERED ACCOUNTANTS OF INDIA 7
I. Interest Rate Risk: Risk on account of variability in the interest rates from time to time and its impact on security
prices.
II. Purchasing Power Risk: It is also known as inflation risk, as inflation affects the purchasing power adversely.
Inflation rates vary over time and investors are caught unaware when rate of inflation changes unexpectedly
causing erosion in the value of realised rate of return and expected return.
III. Market risk: Risk that affects prices of a share that moves up or down consistently for some time periods in line
with other shares in the market. In other words, the share market moves between the bullish phase and the
bearish phase.

Unsystematic Risk
4 June, 2021 © THE INSTITUTE OF CHARTERED ACCOUNTANTS OF INDIA 8
I. Business Risk: Business risk arises from variability in the operating profits of a company – higher the variability
in the operating profits of a company, higher is the business risk.
II. Financial Risk: Presence of debt in the capital structure of the company leads to financial risk. Excess of debt
vis-à-vis equity in the capital structure indicates that the company is highly geared and more dependence on
borrowings exposes it to the risk of winding-up for its inability to honour its commitments towards
lenders/creditors.

Risk Diversification
4 June, 2021 © THE INSTITUTE OF CHARTERED ACCOUNTANTS OF INDIA 9
The total risk of an individual security consists of two risks systematic risk and unsystematic risk
Unsystematic risk is diversifiable by investing in a combination of securities.

Systematic Risk
4 June, 2021 © THE INSTITUTE OF CHARTERED ACCOUNTANTS OF INDIA 10
Systematic risk is the variability in security returns caused by changes in the economy or the market.
The average effect of a change in the economy can be represented by the change in the stock market index. The systematic risk
of a security can be measured by relating that security’s variability vis-à-vis variability in the stock market index.
The systematic risk of a security is measured by a statistical measure which is called Beta (β)
Correlation method:
rim = Correlation coefficient between the returns of the stock i and the returns of the market index.
= Standard deviation of returns of stock i
= Standard deviation of returns of the market index.
im ii
m
r σβ =
σ
i
mσ
Systematic Risk
4 June, 2021 © THE INSTITUTE OF CHARTERED ACCOUNTANTS OF INDIA 11
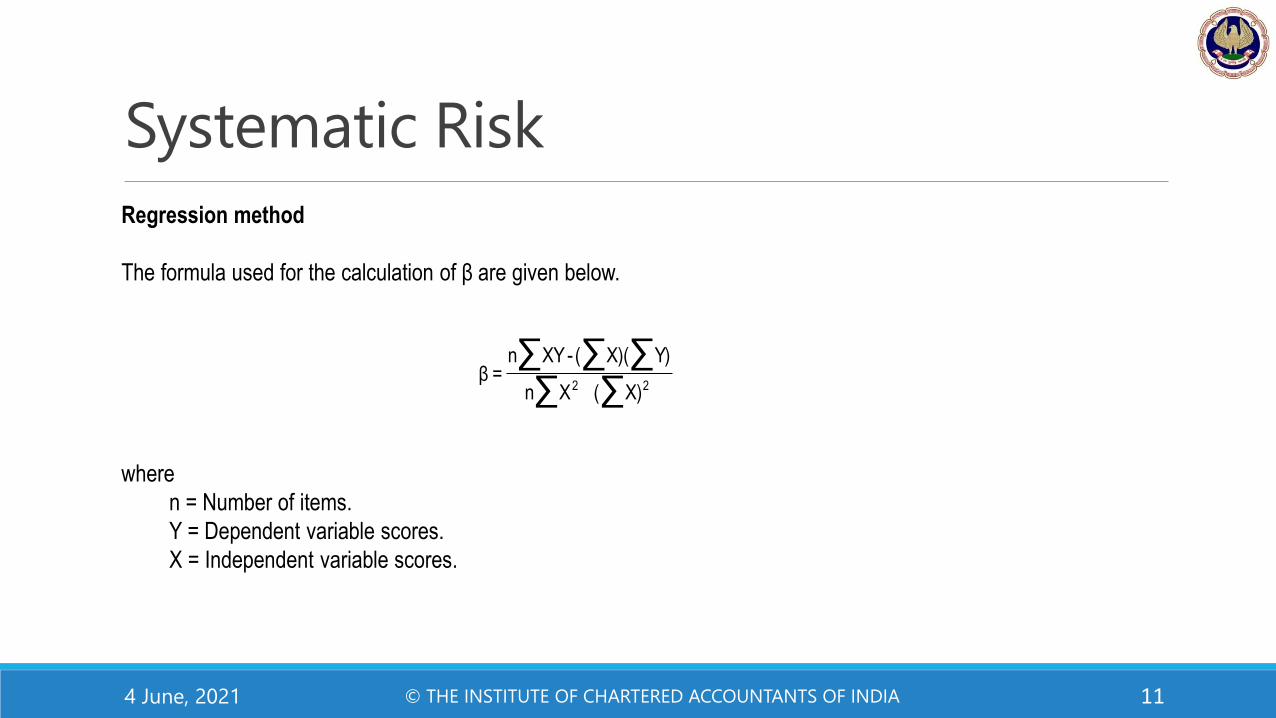
Regression method
The formula used for the calculation of β are given below.
where
n = Number of items.
Y = Dependent variable scores.
X = Independent variable scores.
∑ ∑∑ ∑ ∑
22 X)(Xn
Y)X)((-XYn=β

Portfolio Return
4 June, 2021 © THE INSTITUTE OF CHARTERED ACCOUNTANTS OF INDIA 12
The expected return for the portfolio is expressed as the mean of its rates of return over the time horizon under
consideration
The formula for the calculation of expected portfolio return may be expressed as shown below:
i
n
1=i
ip rx=r ∑
pr = Expected return of the portfolio.
Xi = Proportion of funds invested in security i
ir = Expected return of security i.
n = Number of securities in the portfolio.

Portfolio Risk
4 June, 2021 © THE INSTITUTE OF CHARTERED ACCOUNTANTS OF INDIA 13
We need to understand the concept of Covariance and Coefficient of correlation which are explained as follows:
The covariance between two securities A and B may be calculated using the following formula:
A A B BAB
[R - R ][R - R ]COV =
N
where
COVAB = Covariance between A and B
RA = Return of security A
RB = Return of security B
AR = Expected or mean return of security A
BR = Expected or mean return of security B
N = Number of observations.

Portfolio Risk
4 June, 2021 © THE INSTITUTE OF CHARTERED ACCOUNTANTS OF INDIA 14
The coefficient of correlation is expressed as:
rAB = AB
A B
Cov
where
rAB = Coefficient of correlation between A and B
CovAB = Covariance between A and B
σA= Standard deviation of A
σB = Standard deviation of B
CovAB = σA σB rAB

Portfolio Risk
4 June, 2021 © THE INSTITUTE OF CHARTERED ACCOUNTANTS OF INDIA 15
The variance of a portfolio with only two securities in it can be calculated with the following formula.
211221
2
2
2
2
2
1
2
1
2
p rxx2xx
where
2
p = Portfolio variance.
x1 = Proportion of funds invested in the first security.
x2 = Proportion of funds invested in the second security (x1+x2 = 1).
2
1 = Variance of first security.
2
2 = Variance of second security.
1 = Standard deviation of first security.
2 = Standard deviation of second security.
r12 = Correlation coefficient between the returns of the first and second securities.

Portfolio Risk
4 June, 2021 © THE INSTITUTE OF CHARTERED ACCOUNTANTS OF INDIA 16
The variance of a portfolio with more than two securities in it can be calculated with the following formula.
ji
n
1i
n
1jjiji
2
p rxx
Or
2
p = ji
n
1i=
n
1j=
ji σx x∑∑
where
σp2 = Portfolio variance.
xi = Proportion of funds invested in security i (the first of a pair of securities).
xj = Proportion of funds invested in security j (the second of a pair of securities).
σi = Standard Deviation of security i
σj = Standard Deviation of security j
rij = The co-efficient of correlation between the pair of securities i and j
σij = The covariance between the pair of securities i and j
n = Total number of securities in the portfolio.

Portfolio Risk
4 June, 2021 © THE INSTITUTE OF CHARTERED ACCOUNTANTS OF INDIA 17
The variance of a portfolio with more than two securities in it can be calculated with the following formula.
ji
n
1i
n
1jjiji
2
p rxx
Or
2
p = ji
n
1i=
n
1j=
ji σx x∑∑
where
σp2 = Portfolio variance.
xi = Proportion of funds invested in security i (the first of a pair of securities).
xj = Proportion of funds invested in security j (the second of a pair of securities).
σi = Standard Deviation of security i
σj = Standard Deviation of security j
rij = The co-efficient of correlation between the pair of securities i and j
σij = The covariance between the pair of securities i and j
n = Total number of securities in the portfolio.
Markowitz Model (MPT)
4 June, 2021 © THE INSTITUTE OF CHARTERED ACCOUNTANTS OF INDIA 18
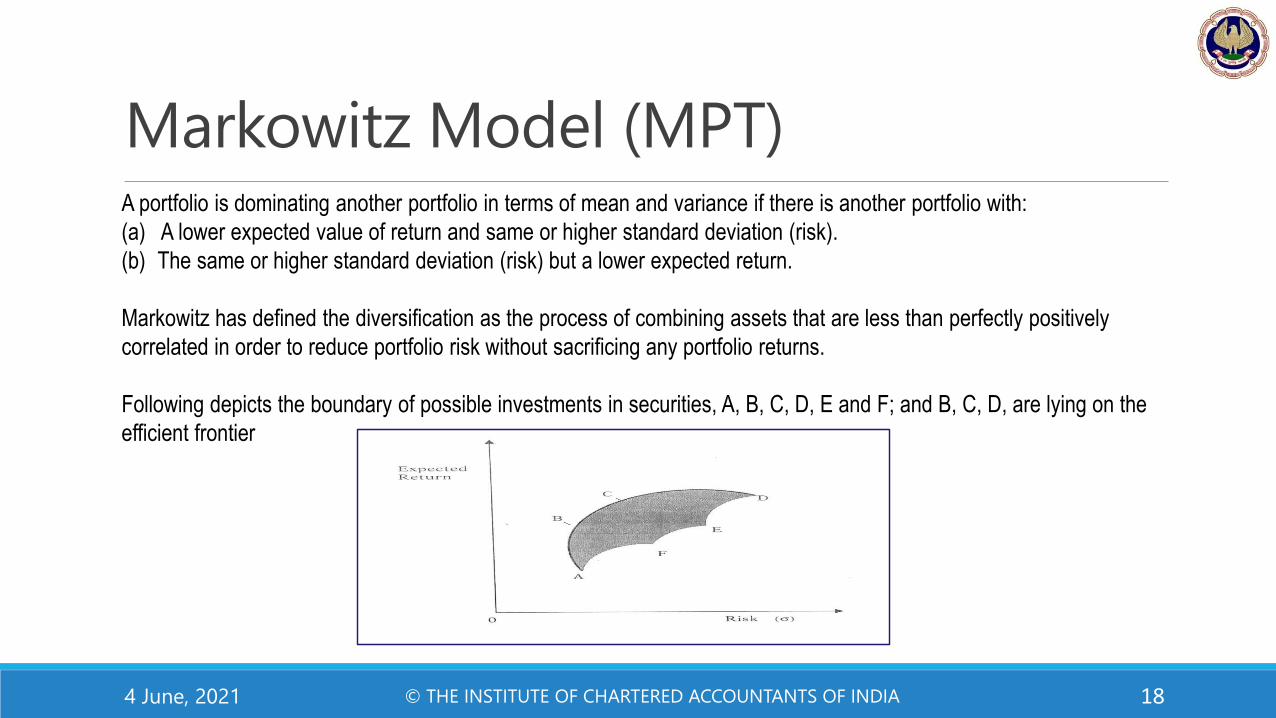
A portfolio is dominating another portfolio in terms of mean and variance if there is another portfolio with:
(a) A lower expected value of return and same or higher standard deviation (risk).
(b) The same or higher standard deviation (risk) but a lower expected return.
Markowitz has defined the diversification as the process of combining assets that are less than perfectly positively
correlated in order to reduce portfolio risk without sacrificing any portfolio returns.
Following depicts the boundary of possible investments in securities, A, B, C, D, E and F; and B, C, D, are lying on the
efficient frontier

Markowitz Model (MPT)
4 June, 2021 © THE INSTITUTE OF CHARTERED ACCOUNTANTS OF INDIA 19
The investor has to select a portfolio from the set of efficient portfolios lying on the efficient frontier. This will depend
upon his risk-return preference.

Sharpe Index Model - Return
4 June, 2021 © THE INSTITUTE OF CHARTERED ACCOUNTANTS OF INDIA 20
This is also known as single index model.
This model assumes that co-movement between stocks is due to change or movement in the market index. For
calculating return following equation can be used
R Ri i i m i
Where,
Ri = expected return on security i
i = intercept of the straight line or alpha co-efficient
i = slope of straight line or beta co-efficient
Rm = the rate of return on market index
i = error term.

Sharpe Index Model - Risk
4 June, 2021 © THE INSTITUTE OF CHARTERED ACCOUNTANTS OF INDIA 21
The variance of security’s return:
2 2 2 2 i m i
The covariance of returns between securities i and j is:
ij i j m 2
The variance of the security has two components namely, systematic risk or market risk and unsystematic risk or
unique risk. The variance explained by the index is referred to systematic risk. The unexplained variance is called
Residual Variance or Unsystematic Risk.

Sharpe Index Model – Portfolio Return
4 June, 2021 © THE INSTITUTE OF CHARTERED ACCOUNTANTS OF INDIA 22
Expected return on the portfolio also can be estimated. For each security αi and βi should be estimated.
R x RP i i i mi
N
( ) 1
iβ = Value of the beta for security i
xi = Proportion of the investment on security i
αi = Value of alpha for security i
N = The number of securities in the portfolio
Portfolio beta and portfolio alpha can also be calculated weighted average technique where weights can be individual
proportion to the securities.

Sharpe Index Model – Portfolio Risk
4 June, 2021 © THE INSTITUTE OF CHARTERED ACCOUNTANTS OF INDIA 23
The portfolio variance can be derived as:
X2
m
2N
1iii
2
p
N
i
iX1
2
2
i
Where,
2p = variance of portfolio
2m = expected variance of index
2i = variation in security’s return not related to the market index
x i = the portion of stock i in the portfolio.
iβ = Beta of stock i in the portfolio
Capital Asset Pricing Model (CAPM)
4 June, 2021 © THE INSTITUTE OF CHARTERED ACCOUNTANTS OF INDIA 24
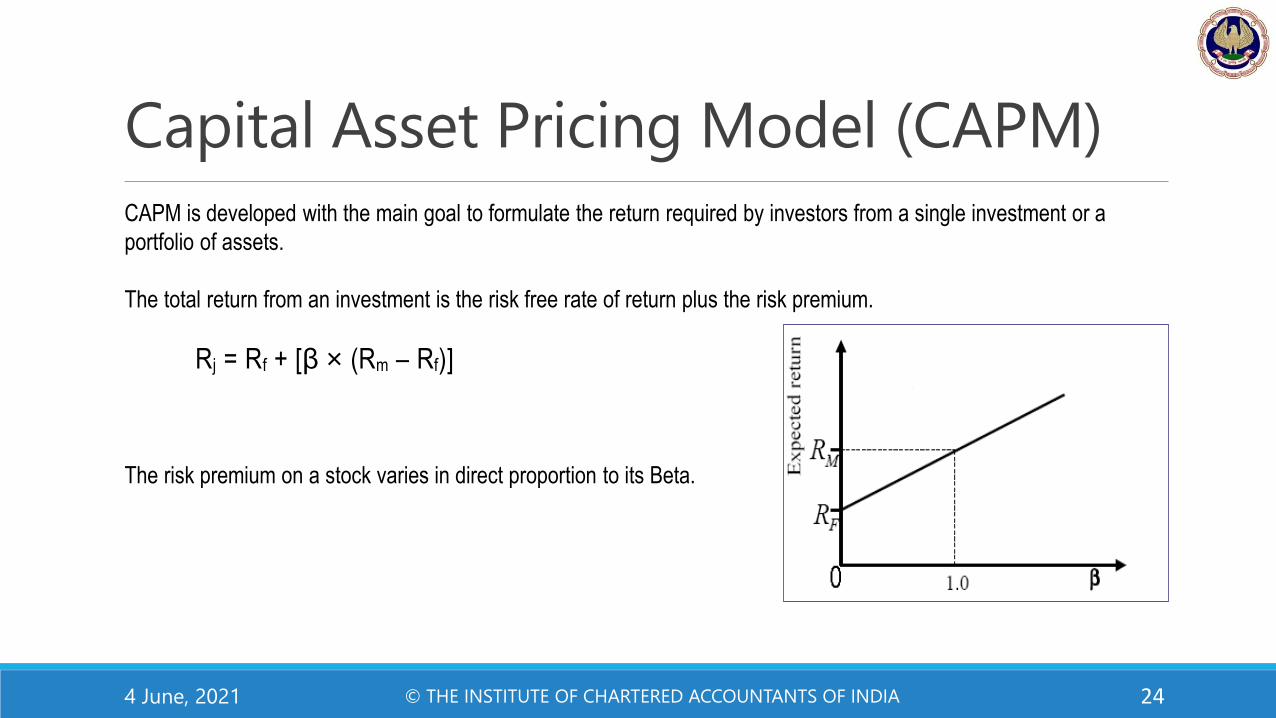
CAPM is developed with the main goal to formulate the return required by investors from a single investment or a
portfolio of assets.
The total return from an investment is the risk free rate of return plus the risk premium.
Rj = Rf + [β × (Rm – Rf)]
The risk premium on a stock varies in direct proportion to its Beta.

Arbitrage Pricing theory (APT)
4 June, 2021 © THE INSTITUTE OF CHARTERED ACCOUNTANTS OF INDIA 25
APT uses the risky asset's expected return and the risk premium of a number of macroeconomic factors.
Thus, the formula for APT is represented as –
E (Ri) = Rf + 1 1 2 2 3 3 n nλ β + λ β + λ β ............λ β
Where,
Rf = Risk Free Rate
λn = nth factor price or risk premium
βn = Sensitivity of the Factor n

Portfolio Evaluation Method
4 June, 2021 © THE INSTITUTE OF CHARTERED ACCOUNTANTS OF INDIA 26
Sharpe Ratio
Sharpe Ratio measures the Risk Premium per unit of Total Risk for a security or a portfolio of securities. The formula is
as follows:
S =
i
fi R-R
Where Ri = Return on Security/portfolio
Rf = Risk Free Rate of Return
σi = Standard Deviation of Return of Security/portfolio
S = Sharpe Ratio

Portfolio Evaluation Method
4 June, 2021 © THE INSTITUTE OF CHARTERED ACCOUNTANTS OF INDIA 27
Treynor Ratio
It measures the Risk Premium per unit of Systematic Risk (β) for a security or a portfolio of securities
T = i f
i
R R
β
Where,
Ri = Expected return on stock i
Rf = Return on a risk less asset
i = Expected change in the rate of return on stock i associated with one unit change in the market return (Beta)
T = Treynor Ratio

Portfolio Evaluation Method
4 June, 2021 © THE INSTITUTE OF CHARTERED ACCOUNTANTS OF INDIA 28
Jensen Alpha
It compares the rate of return given by a security or a portfolio with the expected rate of return using CAPM
Alpha = Return of Portfolio - Expected Return
Alpha is positive : The decision should be buy
Alpha is negative : The decision should be sell
Alpha is 0: The decision should be hold.

Sharpe’s optimal portfolio
4 June, 2021 © THE INSTITUTE OF CHARTERED ACCOUNTANTS OF INDIA 29
The steps for finding out the stocks to be included in the optimal portfolio are given below:
(a) Find out the “excess return to beta” ratio for each stock under consideration.
(b) Rank them from the highest to the lowest.
(c) Proceed to calculate Ci for all the stocks according to the ranked order using the following formula:
R - R βN i f i2σm 2σi=1 eiC = i 2N β2 i1 + σ m 2σi = 1 ei
Where,
m2 variance of the market index
i2
= variance of a stock’s movement that is not associated with the movement of market index i.e. stock’s unsystematic risk.

Sharpe’s optimal portfolio
4 June, 2021 © THE INSTITUTE OF CHARTERED ACCOUNTANTS OF INDIA 30
(d) Compute the cut-off point which the highest value of Ci and is taken as C*. The stock whose excess-return to risk
ratio is above the cut-off ratio are selected and all whose ratios are below are rejected.
Once we came to know which securities are to be included in the optimum portfolio, we shall
calculate the percent to be invested in each security by using the following formula:
Zo iX = i NZi
j=1
where
B R - R o *i iZ = - Ci 2 Bσ iei
The first portion determines the weight each stock and total comes to 1 to ensure that all funds are
invested and second portion determines the relative investment in each security.

Active Portfolio Strategy
4 June, 2021 © THE INSTITUTE OF CHARTERED ACCOUNTANTS OF INDIA 31
Fund managers of “active” funds spend a great deal of time on
researching individual companies
gathering extensive data about financial performance
business strategies
management characteristics.
There are four principles of on active strategy
(a) Market Timing : Market timing is based on an explicit or implicit forecast of general market movement which is
derived with the help of one or more tools and is also subjective to the judgment of the investors.
(b) Sector Rotation: The weighting for various industry sectors is based on their asset outlook. If one thinks that
steel and pharmaceutical would do well as compared to other sectors in the forthcoming period he may overweigh the
sector relative to their position in the market portfolio.

Active Portfolio Strategy
4 June, 2021 © THE INSTITUTE OF CHARTERED ACCOUNTANTS OF INDIA 32
(c) Security Selection: Security selection involves a search for under price or over price security. This is carried out
through fundamental / technical analysis to identify stocks which seems to promise superior return and
concentrate the stock components of portfolio on them.
(d) Use of Specialised Investment Concept: To achieve superior return, one has to employ a specialised
concept/philosophy particularly with respect to investment in stocks. The concept which have been exploited
successfully are growth stock, neglected or out of favour stocks, asset stocks, technology stocks and cyclical
stocks.

Passive Portfolio Strategy
4 June, 2021 © THE INSTITUTE OF CHARTERED ACCOUNTANTS OF INDIA 33
Active strategy was based on the premise that the capital market is characterized by efficiency which can be exploited by
resorting to market timing or sector rotation or security selection or use of special concept or some combination of these
sectors.
Passive strategy, on the other hand, rests on the tenet that the capital market is fairly efficient with respect to the available
information. Hence they search for superior return. Basically, passive strategy involves adhering to two guidelines. They are:
(a) Create a well diversified portfolio at a predetermined level of risk.
(b) Hold the portfolio relatively unchanged over time unless it became adequately diversified or inconsistent with the
investor risk return preference.

Bond Selection
4 June, 2021 © THE INSTITUTE OF CHARTERED ACCOUNTANTS OF INDIA 34
I. Yield to maturity: The yield to maturity for a fixed income avenues represent the rate of return earned by the investor, if
he invests in the fixed income avenues and holds it till its maturity.
II. Risk of Default: To assess such risk on a bond, one has to look at the credit rating of the bond. If no credit rating is
available relevant financial ratios of the firm have to be examined such as debt equity, interest coverage, earning power
etc and the general prospect of the industry to which the firm belongs have to be assessed.
III. Tax Shield: In the past, several fixed income avenues offers tax shields but at present only a few of them do so.
IV. Liquidity: If the fixed income avenues can be converted wholly or substantially into cash at a fairly short notice it
possesses a liquidity of a high order.

Equity Selection
4 June, 2021 © THE INSTITUTE OF CHARTERED ACCOUNTANTS OF INDIA 35
I. Technical analysis looks at price behaviours and volume data to determine whether the share will move up or down
or remain trend less.
II. Fundamental analysis focuses on fundamental factors like earning level, growth prospects and risk exposure to
establish intrinsic value of a share. The recommendation to buy hold or sell is based on comparison of intrinsic value
and prevailing market price.
III. Random selection analysis is based on the premise that the market is efficient and security is properly priced.

Portfolio rebalancing
4 June, 2021 © THE INSTITUTE OF CHARTERED ACCOUNTANTS OF INDIA 36
Buy and hold policy: Under this strategy investors set a limit (floor) below which he does not wish the value of portfolio
should go. Therefore, he invests an amount equal to floor value in non-fluctuating assets (Bonds).
In the below example 50,000 is invested in Bonds and another 50,000 is invested in equity shares priced at 100.
Portfolio rebalancing
4 June, 2021 © THE INSTITUTE OF CHARTERED ACCOUNTANTS OF INDIA 37
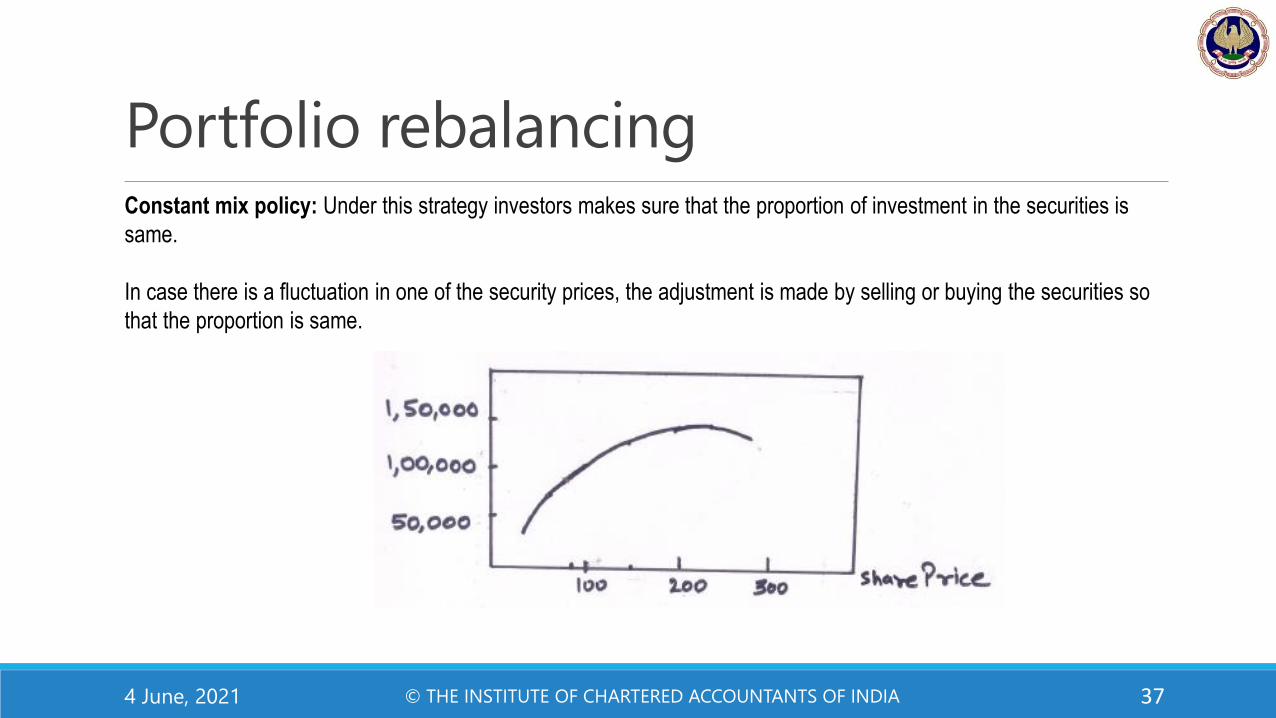
Constant mix policy: Under this strategy investors makes sure that the proportion of investment in the securities is
same.
In case there is a fluctuation in one of the security prices, the adjustment is made by selling or buying the securities so
that the proportion is same.

Portfolio rebalancing
4 June, 2021 © THE INSTITUTE OF CHARTERED ACCOUNTANTS OF INDIA 38
Constant Proportion Insurance Policy : Under this strategy investor sets a floor below which he does not wish his asset
to fall called floor, which is invested in some non-fluctuating assets such as Treasury Bills, Bonds etc. The value of
portfolio under this strategy shall not fall below this specified floor under normal market conditions.
The following equation is used to determine equity allocation:
Target Investment in Shares = Multiplier (Portfolio Value – Floor Value)
Multiplier is a fixed constant whose value shall be more than 1.

Efficient Market Hypothesis
4 June, 2021 © THE INSTITUTE OF CHARTERED ACCOUNTANTS OF INDIA 39
According to this theory no one in the market can earn abnormal return. Market is always adjusting the prices on account
of any information that exists.
There are 4 types of market forms:
1. Inefficient form – This market form implies that an investor is able to estimate the future prices basis historical trend of
the prices.
2. Weak form of Efficient market – This market form implies that the stock prices are already adjusted for the past
movements and hence future value cannot be estimated and technical analysis cannot be used in such type of a
market form.
3. Semi strong form of Efficient market – This market form implies that the stock prices are adjusted for the historical
trend of prices as well as the publicly available information.
4. Strong form of Efficient market – This market form implies that the stock prices are adjusted for all the information
whether available publicly or available as a private information and also the historical prices as well.

4 June, 2021 © THE INSTITUTE OF CHARTERED ACCOUNTANTS OF INDIA 40
THANK YOU


