93
CHAPTER –5 RESULTS AND DISCUSSION

CHAPTER –5
RESULTS
AND
DISCUSSION

CHAPTER-5
Results and Discussion
After data collection and scoring of the quantitative responses elicited
through psychological testing measures, the next important step is to analyze
the quantitative data in accordance with the requirements of the hypothesis
formed with the help of an appropriate statistical device.
In the present study, the role of some psychosocial variables was
investigated in order to predict the level of emotional intelligence among
adolescent sample. The psychosocial variables include aggression, self
concept, extraversion, neuroticism, home environment and social support, sex
and locale. While emotional intelligence along with its different dimensions
was taken as dependent variable. The data was collected from both male and
female subjects, belonging to both urban and rural locales. For the purpose of
data analysis, the whole study was divided into two parts. Part-A deals with
the analysis of obtained data by applying 2x2x2 factorial design which is
further divided into six separate studies as analyzing all the six independent
variables with reference to emotional intelligence, and Part-B of the study
presents the results obtained by employing stepwise multiple regression
analysis. Before processing the data through ANOVA statistic, it was necessary that
the basic assumption of ANOVA should be satisfied. There are two basic
assumptions as under:-
1. Normality of the distribution of criterion measure: This assumption
states that the distribution of the scores within each treatment
population is normal.
2. Homogeneity of variance: under this assumption the variance of the
scores in each of the treatment group should be homogeneous.
So far as the first assumption is concerned, it is satisfied because the
samples are randomly selected from the population and the size of the sample
is relatively large. In this connection, it is worthwhile to mention the
statement of Gravetter and Wallnau (1987) who have suggested that the first
assumption i.e. normality of distribution, is satisfied easily and is not a cause
for concern in most research. When there is a reason to suspect that the
populations are far from normal in shape, it may be compensated by ensuring
that the samples are relatively large i.e. n around 30 or more (p. 347). Testing
the homogeneity of variance is important before processing ANOVA statistic.
Accordingly the data of the different six parts of the studies, the present
research was examined for the homogeneity of variance through Levene’s
test. The summary of all parts of the study and obtained results are shown in
the following table:-
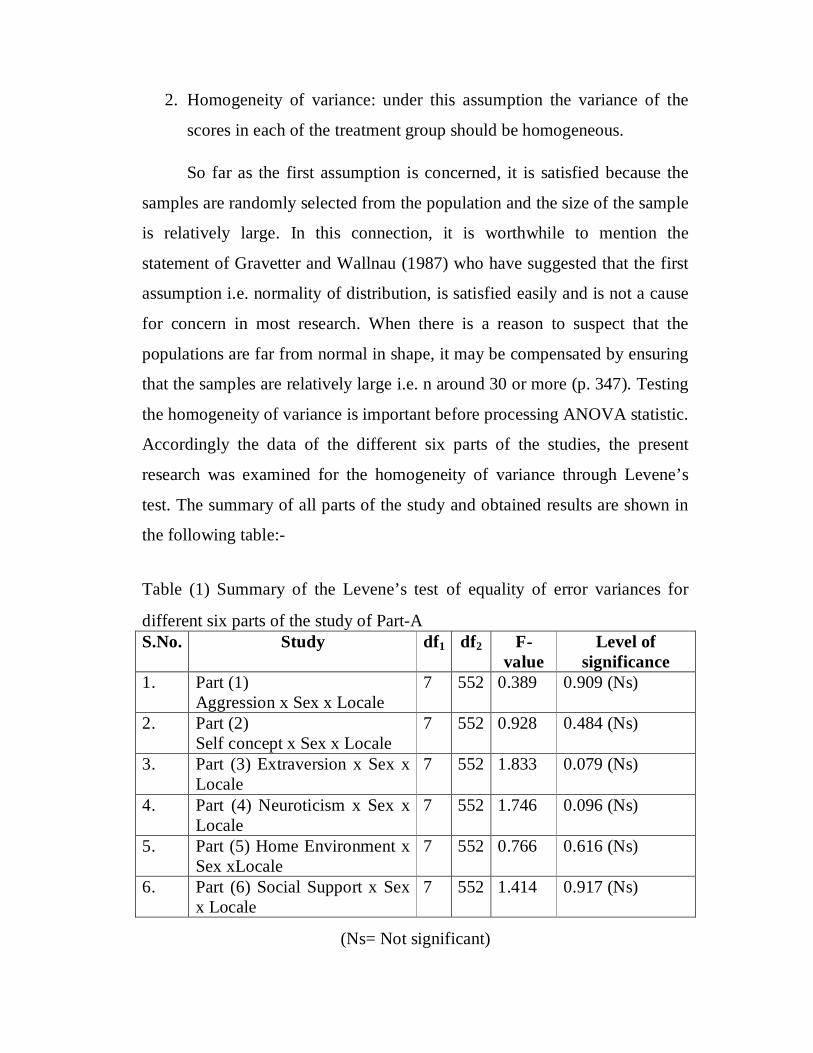
Table (1) Summary of the Levene’s test of equality of error variances for
different six parts of the study of Part-A S.No. Study df1 df2 F-
value Level of
significance 1. Part (1)
Aggression x Sex x Locale 7 552 0.389 0.909 (Ns)
2. Part (2) Self concept x Sex x Locale
7 552 0.928 0.484 (Ns)
3. Part (3) Extraversion x Sex x Locale
7 552 1.833 0.079 (Ns)
4. Part (4) Neuroticism x Sex x Locale
7 552 1.746 0.096 (Ns)
5. Part (5) Home Environment x Sex xLocale
7 552 0.766 0.616 (Ns)
6. Part (6) Social Support x Sex x Locale
7 552 1.414 0.917 (Ns)
(Ns= Not significant)
The observation of the above table (ii) indicates that all of the six
values were insignificant. The insignificant F- value establishes that the
assumption of homogeneity of variance has not been violated. Therefore, it
was thought appropriate to analyze the data through ANOVA statistic.
Results (Part-A)
As per factorial design of 2x2x2, three-way analysis of variance was
performed on the scores of emotional intelligence to ascertain the main and
interaction effects of the independent variables on emotional intelligence. The
obtained data was quantitatively analyzed to test the hypotheses and the
results obtained by the six ANOVAs are presented below as six separate
studies:-
Study (1) Aggression and Emotional Intelligence
In order to examine the role of aggression in predicting emotional
intelligence, the ANOVA statistic was used. Aggression was taken in two
levels i.e. high and low. Subjects were taken from both the sexes and
therefore, sex was also considered as one of the independent variable.
Similarly, as the subjects were taken from two different locales i.e. urban and
rural, therefore locale is also considered as the third independent variable.
For dividing the subjects into low and high ‘aggression’ groups, the
aggression scores of all the subjects (N= 745) were calculated. Afterwards,
37.5% subjects scoring low from the bottom and 37.5% subjects scoring high
from the top (excluding the subjects falling within the semi-interquartile
range) were considered as the subjects of low and high aggression groups
respectively. In this way, the subjects were divided into various sub-groups as
per the requirements of 2x2x2 ANOVA, formed on the basis of aggression,
sex and locale. The average emotional intelligence scores of the subjects
falling in different cells of ANOVA table are presented in table (1.1):-
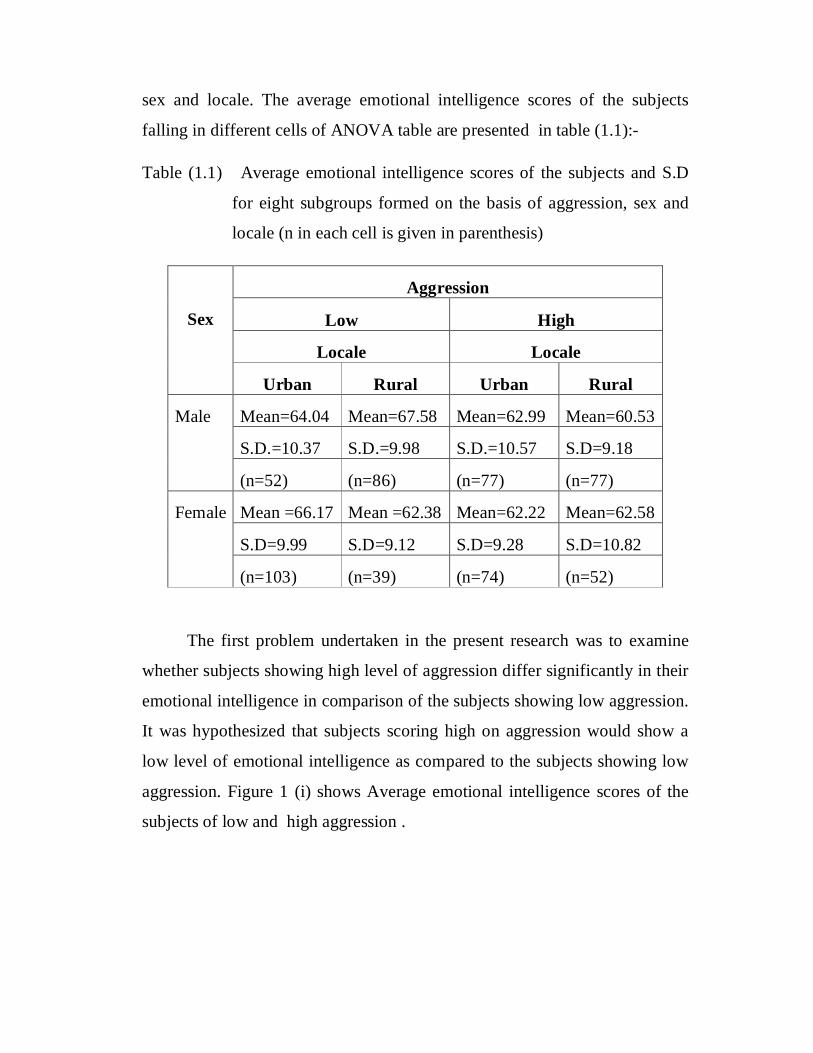
Table (1.1) Average emotional intelligence scores of the subjects and S.D
for eight subgroups formed on the basis of aggression, sex and
locale (n in each cell is given in parenthesis)
Sex
Aggression
Low High
Locale Locale
Urban Rural Urban Rural
Male Mean=64.04 Mean=67.58 Mean=62.99 Mean=60.53
S.D.=10.37 S.D.=9.98 S.D.=10.57 S.D=9.18
(n=52) (n=86) (n=77) (n=77)
Female Mean =66.17 Mean =62.38 Mean=62.22 Mean=62.58
S.D=9.99 S.D=9.12 S.D=9.28 S.D=10.82
(n=103) (n=39) (n=74) (n=52)
The first problem undertaken in the present research was to examine
whether subjects showing high level of aggression differ significantly in their
emotional intelligence in comparison of the subjects showing low aggression.
It was hypothesized that subjects scoring high on aggression would show a
low level of emotional intelligence as compared to the subjects showing low
aggression. Figure 1 (i) shows Average emotional intelligence scores of the
subjects of low and high aggression .
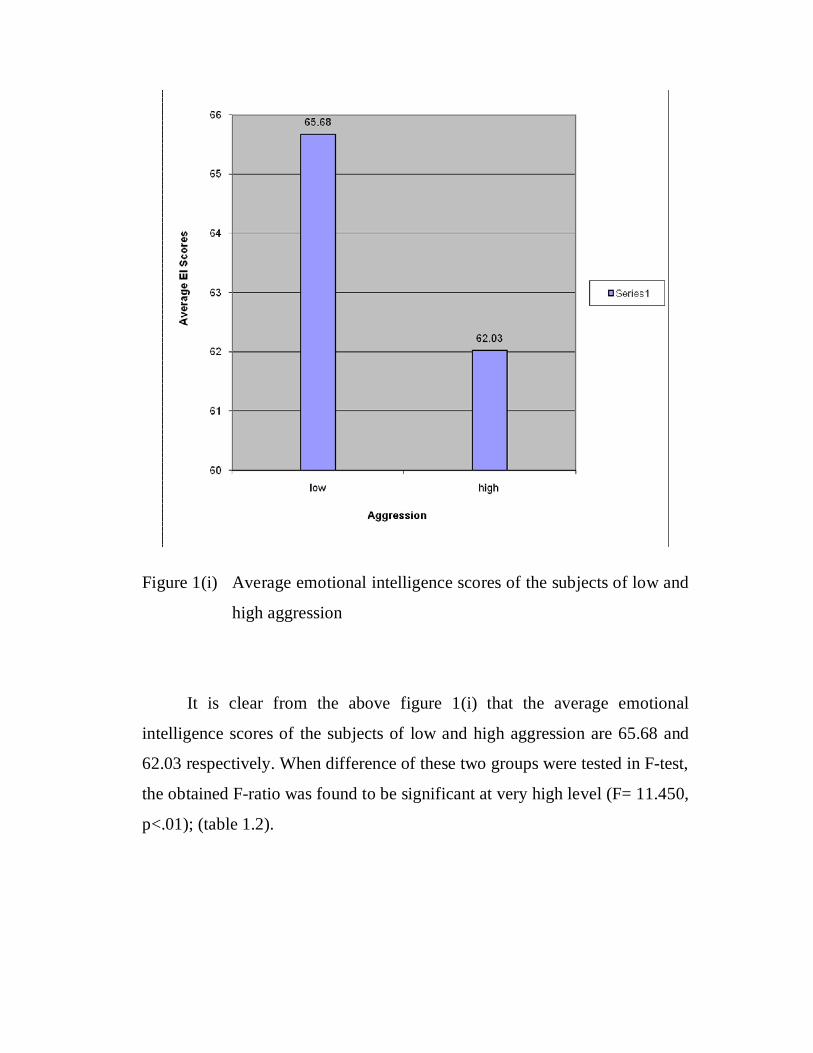
Figure 1(i) Average emotional intelligence scores of the subjects of low and
high aggression
It is clear from the above figure 1(i) that the average emotional
intelligence scores of the subjects of low and high aggression are 65.68 and
62.03 respectively. When difference of these two groups were tested in F-test,
the obtained F-ratio was found to be significant at very high level (F= 11.450,
p<.01); (table 1.2).
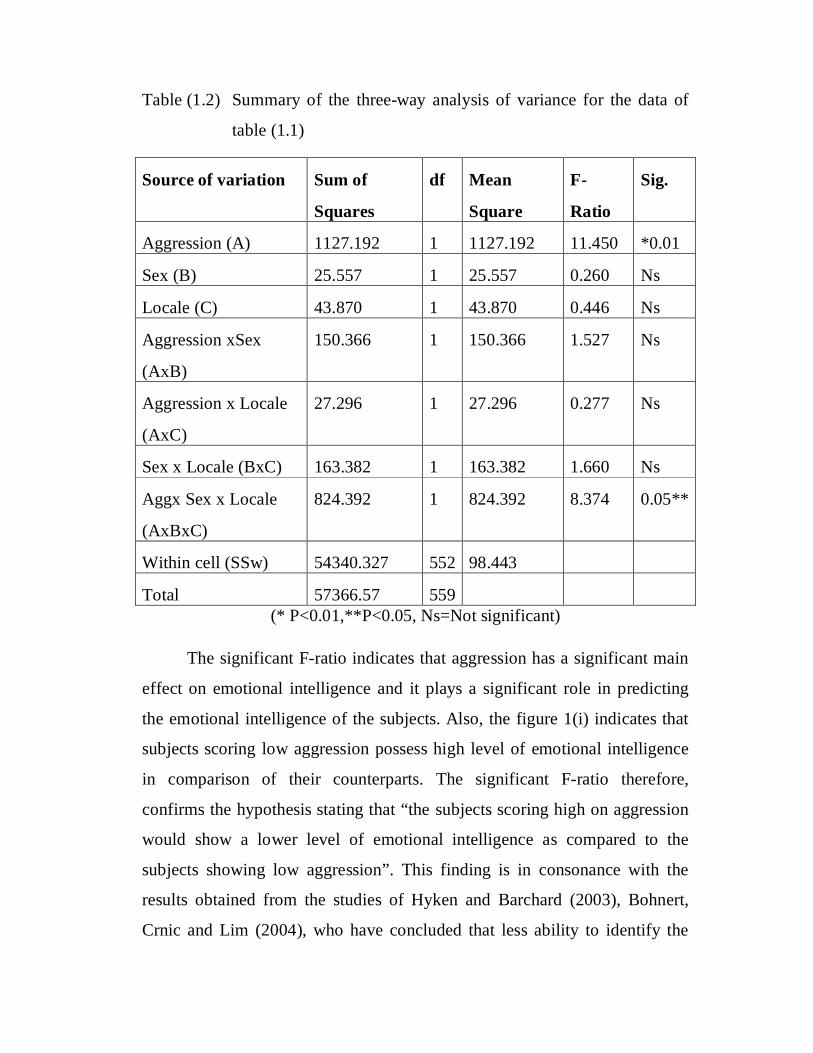
Table (1.2) Summary of the three-way analysis of variance for the data of
table (1.1)
Source of variation Sum of
Squares
df Mean
Square
F-
Ratio
Sig.
Aggression (A) 1127.192 1 1127.192 11.450 *0.01
Sex (B) 25.557 1 25.557 0.260 Ns
Locale (C) 43.870 1 43.870 0.446 Ns
Aggression xSex
(AxB)
150.366 1 150.366 1.527 Ns
Aggression x Locale
(AxC)
27.296 1 27.296 0.277 Ns
Sex x Locale (BxC) 163.382 1 163.382 1.660 Ns
Aggx Sex x Locale
(AxBxC)
824.392 1 824.392 8.374 0.05**
Within cell (SSw) 54340.327 552 98.443
Total 57366.57 559 (* P<0.01,**P<0.05, Ns=Not significant)
The significant F-ratio indicates that aggression has a significant main
effect on emotional intelligence and it plays a significant role in predicting
the emotional intelligence of the subjects. Also, the figure 1(i) indicates that
subjects scoring low aggression possess high level of emotional intelligence
in comparison of their counterparts. The significant F-ratio therefore,
confirms the hypothesis stating that “the subjects scoring high on aggression
would show a lower level of emotional intelligence as compared to the
subjects showing low aggression”. This finding is in consonance with the
results obtained from the studies of Hyken and Barchard (2003), Bohnert,
Crnic and Lim (2004), who have concluded that less ability to identify the
causes of emotion is related with high aggression. In this connection, Leonard
(2005), Mestre et al. (2006) and Burton, Haftez, and Henninger (2007) have
also found that, lower ratings of conflicts and hostility is associated with high
emotional intelligence and higher physical aggression is associated with a
lower emotional intelligence. Furthermore, the conclusions drawn by Singh
and Saini (2007) have also supported the hypothesis, by reporting that,
persons who are self-motivated, emotionally stable and less prone to
aggressive behavior. Those who are better in managing the relations are less
aggressive and hostile; and those persons having emotional stability show
less aggression.
Aggression has been largely associated with maladaptive behavior,
anger, and violence, resulting in various psychosocial problems. Studies have
been represented aggression as a causal factor of major behavioral
dysfunctions. It results into disturbed interpersonal relationships, self-harm,
homicides, violent crimes, workplace violence, youth violence and other sorts
of socially deviant behaviors (Waters et al., 2004). To overcome these
problems a person has to be skilled in managing and regulating his or her
emotions, as aggressive behavior is a result of poor emotional regulation and
impulsiveness. Therefore, a person who possess good emotional intelligence
skills must overcome his impulsiveness and aggression. Various components
of emotional intelligence like, self-regulation, self-management, optimism,
empathy, impulse control, stress tolerance and adaptability, stands for better
adjustment of a person to the society and also with himself. The findings of
the present study indicates the same, that those subjects who have scored a
lower aggression level achieved a higher score of their emotional intelligence
in comparison to those having high aggression. It means that an individual
having low aggression possess better emotional intelligence, that he or she is
capable of being aware of emotions and managing them. Thus it may be
concluded that there is a significant positive relationship between aggression
and emotional intelligence of the individuals. The result is further supported
by the studies reported on empathy and interpersonal aggression (Richardson
et al. 1994). Empathy is one of the important components of emotional
intelligence, as it deals with being aware of emotions of the persons
surrounding us. It is further associated with good social skills. To understand
other’s perspectives and feeling concerned reduces and inhibits the
aggressive behavior. Absence of an adequate amount of emotional
intelligence may lead to aggressiveness and criminality (Sprinthal et al.
1998). Furthermore, Eniola (2007) have also found that emotional
intelligence training show significant improvement in reducing the aggressive
behavior.
The other main effect considered in the present study was to find out
the effect of sex in emotional intelligence.
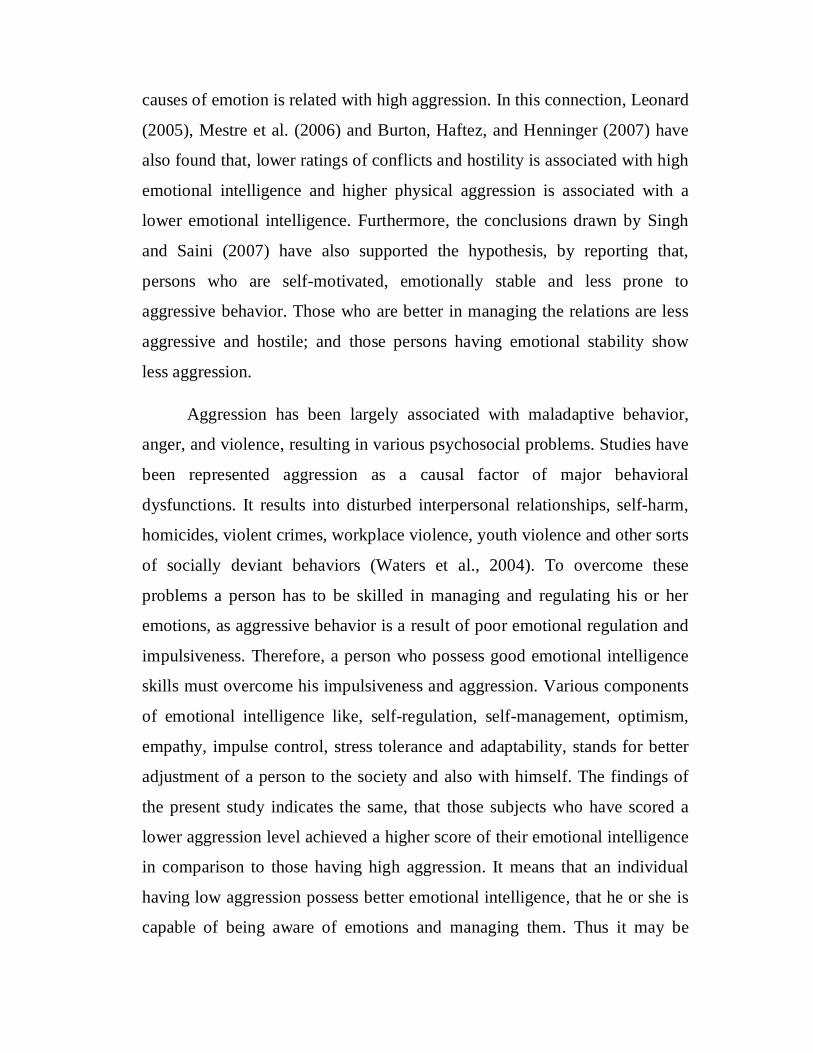
Figure 1(ii) Average emotional intelligence scores of the male and female
subjects
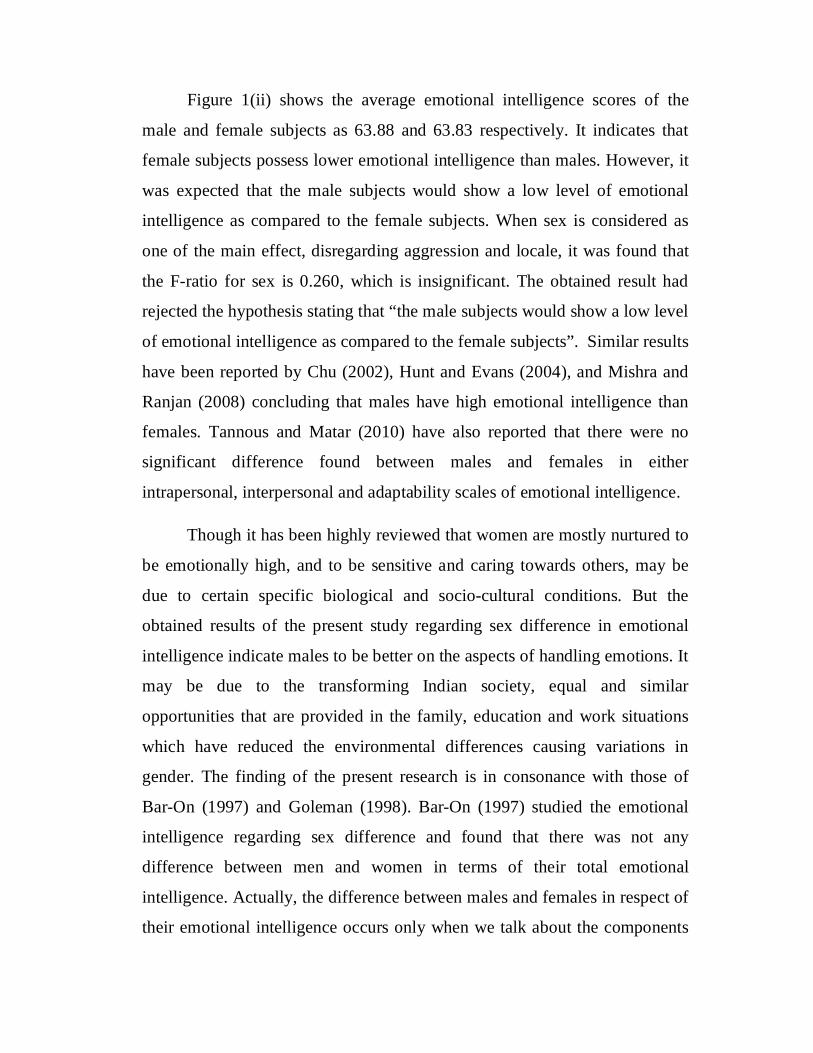
Figure 1(ii) shows the average emotional intelligence scores of the
male and female subjects as 63.88 and 63.83 respectively. It indicates that
female subjects possess lower emotional intelligence than males. However, it
was expected that the male subjects would show a low level of emotional
intelligence as compared to the female subjects. When sex is considered as
one of the main effect, disregarding aggression and locale, it was found that
the F-ratio for sex is 0.260, which is insignificant. The obtained result had
rejected the hypothesis stating that “the male subjects would show a low level
of emotional intelligence as compared to the female subjects”. Similar results
have been reported by Chu (2002), Hunt and Evans (2004), and Mishra and
Ranjan (2008) concluding that males have high emotional intelligence than
females. Tannous and Matar (2010) have also reported that there were no
significant difference found between males and females in either
intrapersonal, interpersonal and adaptability scales of emotional intelligence.
Though it has been highly reviewed that women are mostly nurtured to
be emotionally high, and to be sensitive and caring towards others, may be
due to certain specific biological and socio-cultural conditions. But the
obtained results of the present study regarding sex difference in emotional
intelligence indicate males to be better on the aspects of handling emotions. It
may be due to the transforming Indian society, equal and similar
opportunities that are provided in the family, education and work situations
which have reduced the environmental differences causing variations in
gender. The finding of the present research is in consonance with those of
Bar-On (1997) and Goleman (1998). Bar-On (1997) studied the emotional
intelligence regarding sex difference and found that there was not any
difference between men and women in terms of their total emotional
intelligence. Actually, the difference between males and females in respect of
their emotional intelligence occurs only when we talk about the components
of emotional intelligence, such as women did score significantly higher on
empathy, interpersonal relationships, social responsibility. While men scored
higher on stress tolerance, self-regard, independence, optimism, and problem
solving (Bar-On, 1997). Furthermore Bar-On (2000) theorizes that women
appeared to be more aware of emotions, demonstrate more empathy, relate
better interpersonally and act more socially responsibly than men. Men, on
the other hand, appeared to be able to cope better with stress, sole problems
better, and be more independent, flexible and optimistic than women. Bar-On
also emphasized that, in general when looking at the overall ratings of men
and women, far more similarities exists than differences regarding their
emotional intelligence. Thus in terms of total emotional intelligence, no
gender differences exists (Bar-On, 1998). Goleman (1998) also found that
women were not ‘smarter’ than men in their emotional intelligence, nor are
men superior to women. Each of them had a personal profile of strengths and
weaknesses. Women on average were more aware of their emotions, showed
more empathy and were more adept interpersonally. Some researchers (e.g.
Guastello and Guastello, 2003) have put forth another possible explanation
for gender differences in emotional intelligence having to do with the effect
of generations. Sex roles are currently undergoing change and androgynous
behavior has increased across generations. It would explain why these
differences are being reduced in new generations due to the influence of
culture and education.
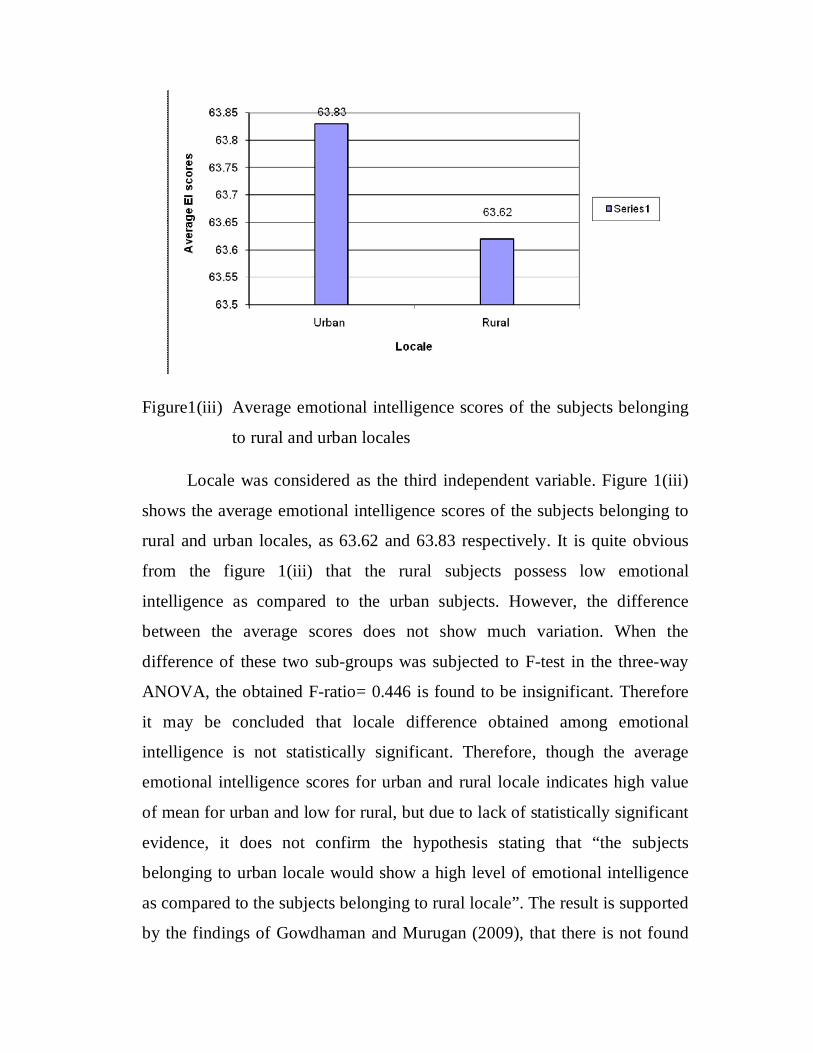
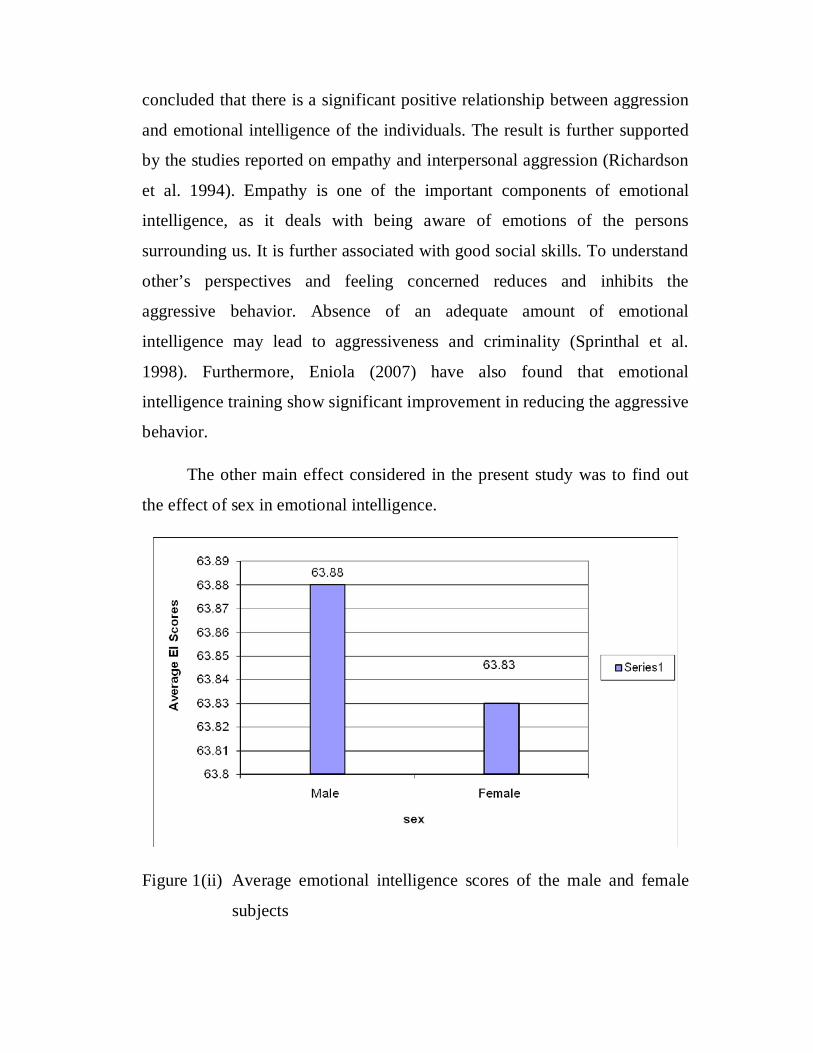
Figure1(iii) Average emotional intelligence scores of the subjects belonging
to rural and urban locales
Locale was considered as the third independent variable. Figure 1(iii)
shows the average emotional intelligence scores of the subjects belonging to
rural and urban locales, as 63.62 and 63.83 respectively. It is quite obvious
from the figure 1(iii) that the rural subjects possess low emotional
intelligence as compared to the urban subjects. However, the difference
between the average scores does not show much variation. When the
difference of these two sub-groups was subjected to F-test in the three-way
ANOVA, the obtained F-ratio= 0.446 is found to be insignificant. Therefore
it may be concluded that locale difference obtained among emotional
intelligence is not statistically significant. Therefore, though the average
emotional intelligence scores for urban and rural locale indicates high value
of mean for urban and low for rural, but due to lack of statistically significant
evidence, it does not confirm the hypothesis stating that “the subjects
belonging to urban locale would show a high level of emotional intelligence
as compared to the subjects belonging to rural locale”. The result is supported
by the findings of Gowdhaman and Murugan (2009), that there is not found
any significant effect of community (locale) on the emotional intelligence.
One of the suitable reasons behind this type of result regarding locale
difference must be attributed to the interaction of the rural and urban societies
and the resultant growth of mutual contacts between peoples of these two
different societies. Moreover, the rural people are slowly but inevitably
influenced by the urban. This results in gradually modifying the mode of life
of the rural people. As many cultural traits are diffused from cities to the rural
areas, ideologies are also diffused from the cities to the rural areas due to
increase in communication via radio, television, newspapers. The urbanism,
which is urban way of life, emerges in the cities and gradually reaches to the
rural areas depending on their proximity to cities. Rural society has been
increasingly urbanized in modern times. With the raise in occupational
diversification, spread of literacy, education, mass communication, continuity
between rural and urban areas has increased. Many modern techniques of
agricultural development and many of the institutional framework for rural
development also generates from the urban centers. The impact of
urbanization and industrialization upon the pattern of rural life, somewhat
bridges the gap between these two different social backgrounds.
In addition to the main effects, the ANOVA technique provides an
advantage to examine the interaction between two or more variables at a
time. These interaction effects are classified as first order interaction and
second order interaction. Hence, in the three-way ANOVA, three first order
interactions between any two factors and one second order interaction among
all the three factors was obtained. Out of the three first order interactions, one
is the interaction between aggression and sex. The average emotional
intelligence scores of four sub-groups formed on the basis of aggression and
sex are shown in table (1.3) and figure 1(iv).
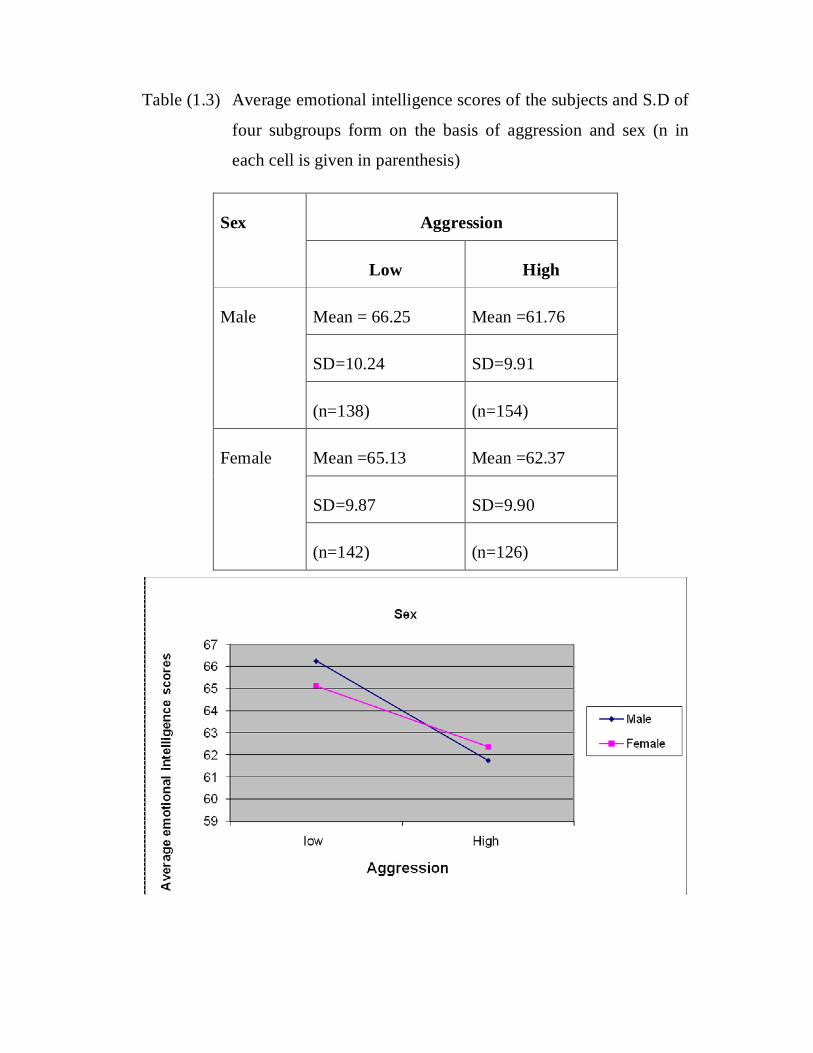
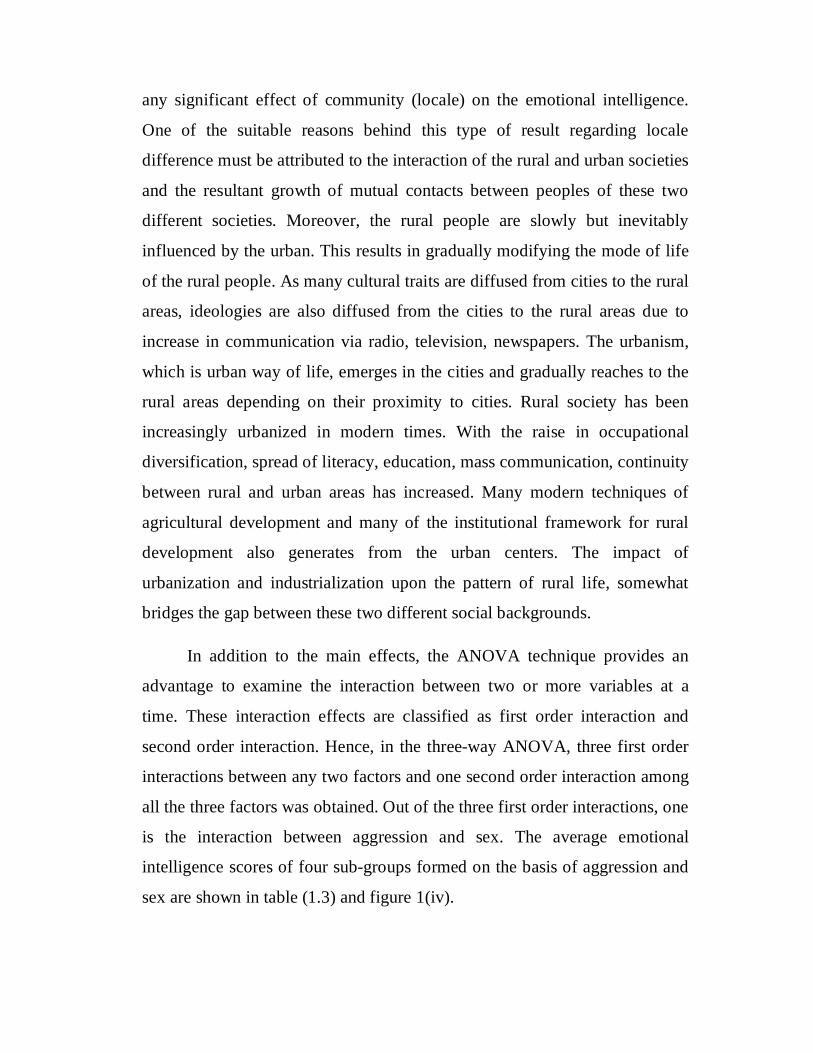
Table (1.3) Average emotional intelligence scores of the subjects and S.D of
four subgroups form on the basis of aggression and sex (n in
each cell is given in parenthesis)
Sex Aggression
Low High
Male Mean = 66.25 Mean =61.76
SD=10.24 SD=9.91
(n=138) (n=154)
Female Mean =65.13 Mean =62.37
SD=9.87 SD=9.90
(n=142) (n=126)

Figure 1(iv) Aggression x sex interaction profile based on the data of table
(1.3)
As shown in table (1.2) (summary of ANOVA) the interaction between
aggression and sex is found to be insignificant (F-value = 1.527, p>.005). It
further reveals that the difference between the means of low aggression and
high aggression for male subjects is statistically not different from the
difference between the means of low aggression and high aggression for
female subjects. Thus, it can be concluded that aggression x sex interaction is
insignificant. This insignificant interaction reveals that the emotional
intelligence scores of the male and female subjects are not dependent on
difference in low and high aggression. It may also be interpreted as, the
emotional intelligence scores of the low and high aggression subjects are not
dependent on different sexes. In other words, the insignificant F-ratio proved
that both the factors i.e. aggression and sex are independent in exerting their
influences on emotional intelligence.
Another interaction is between aggression and locale. The following
table (table 1.4) shows the average emotional intelligence scores of the
subjects of four sub-groups on the basis of aggression and locale.
Table (1.4) Average emotional intelligence scores of the subjects and S.D of
four subgroups on the basis of aggression and locale (n in each
cell is given in parenthesis)
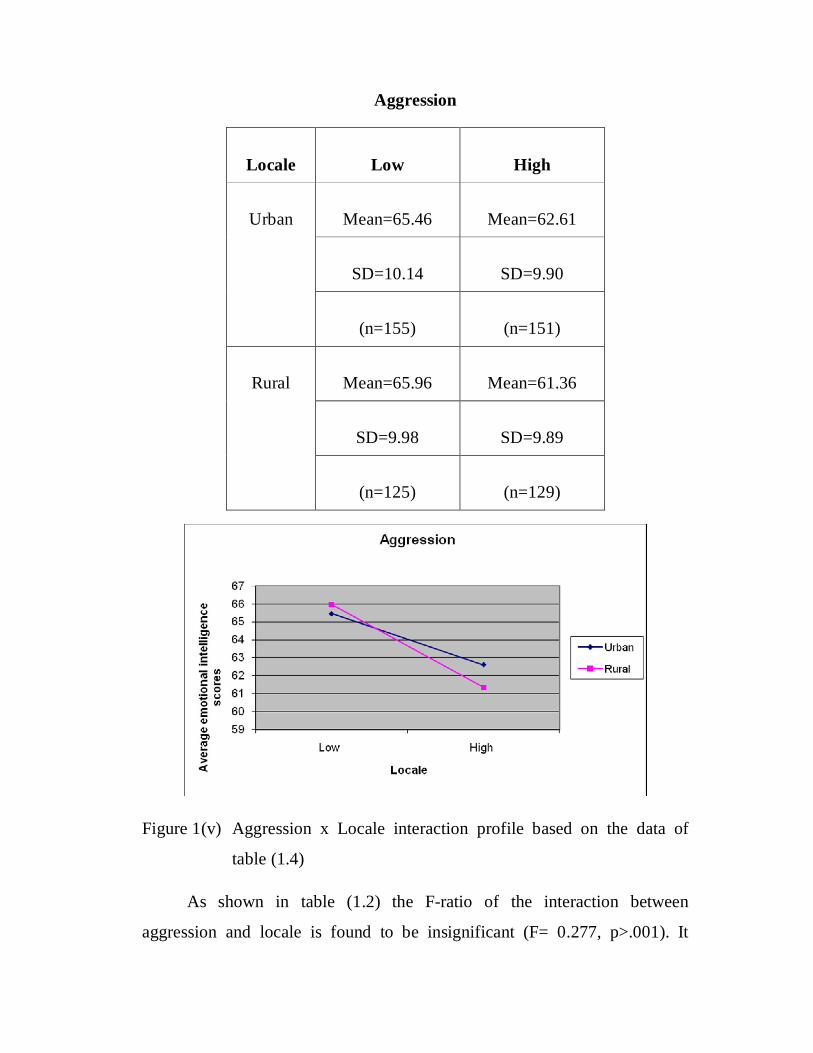
Aggression
Figure 1(v) Aggression x Locale interaction profile based on the data of
table (1.4)
As shown in table (1.2) the F-ratio of the interaction between
aggression and locale is found to be insignificant (F= 0.277, p>.001). It
Locale Low High
Urban Mean=65.46 Mean=62.61
SD=10.14 SD=9.90
(n=155) (n=151)
Rural Mean=65.96 Mean=61.36
SD=9.98 SD=9.89
(n=125) (n=129)
reveals that the difference between the means of low aggression and high
aggression for urban group of subjects is not statistically different from the
difference between the means of low aggression and high aggression for rural
group of subjects. Thus it can be concluded that aggression x locale
interaction is insignificant. This insignificant interaction reveals that the
emotional intelligence scores of the subjects of low and high aggression sub-
groups are nearly the same as for rural and urban locale. It may also be
referred that effect of low and high aggression on emotional intelligence does
not depend on the difference in rural and urban locale; or the effect of rural
and urban locale on emotional intelligence does not depend on difference in
low and high aggression.
The next first order interaction is between sex and locale. The average
emotional intelligence scores of the subjects of four sub-groups formed on
the basis of sex and locale is shown in the table (1.5) and figure 1(vi).
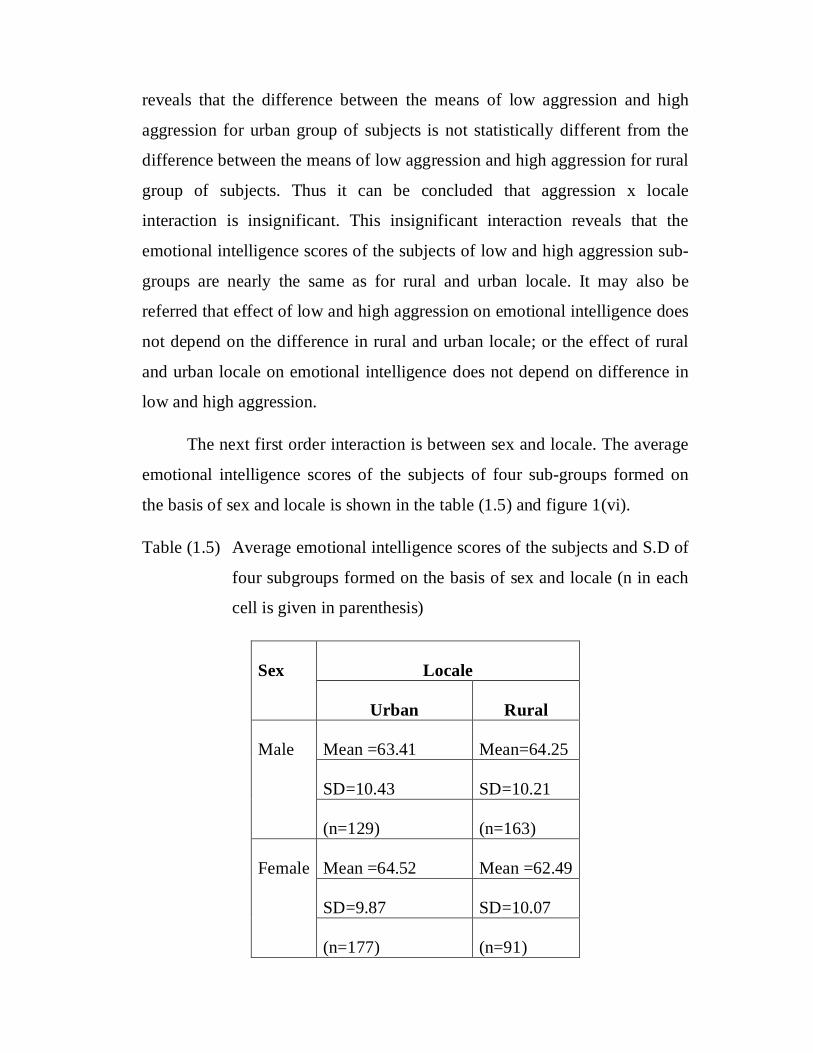
Table (1.5) Average emotional intelligence scores of the subjects and S.D of
four subgroups formed on the basis of sex and locale (n in each
cell is given in parenthesis)
Sex Locale
Urban Rural
Male Mean =63.41 Mean=64.25
SD=10.43 SD=10.21
(n=129) (n=163)
Female Mean =64.52 Mean =62.49
SD=9.87 SD=10.07
(n=177) (n=91)
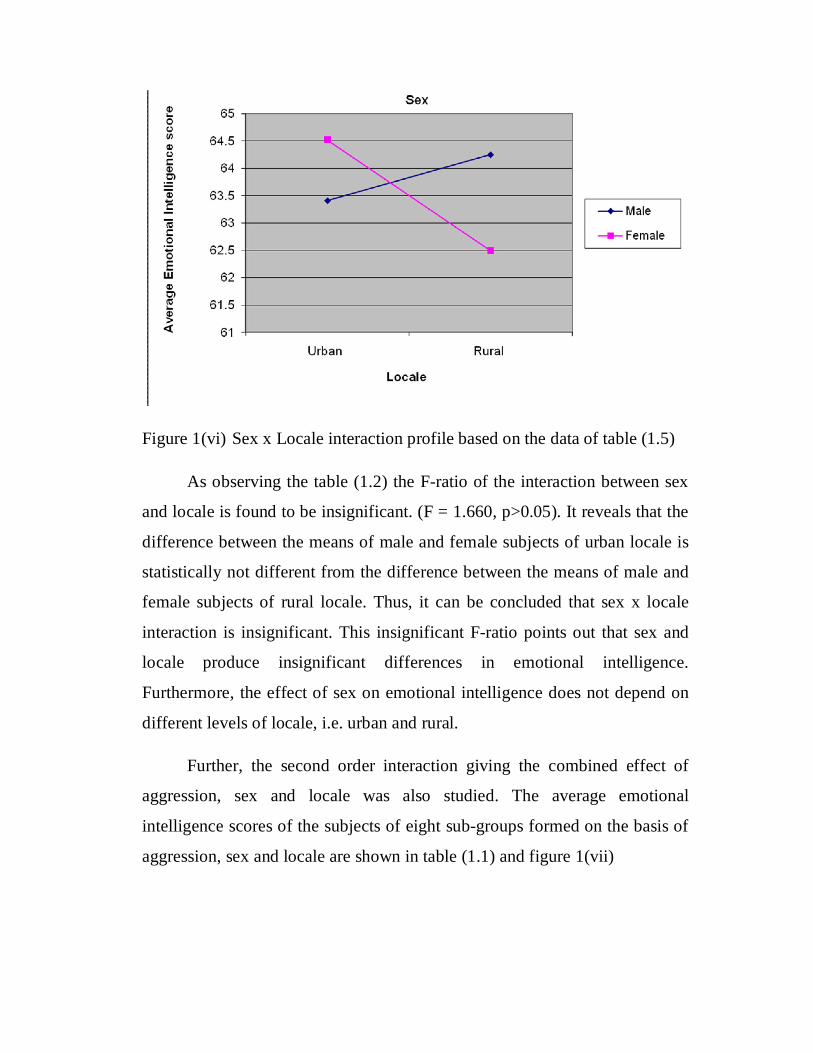
Figure 1(vi) Sex x Locale interaction profile based on the data of table (1.5)
As observing the table (1.2) the F-ratio of the interaction between sex
and locale is found to be insignificant. (F = 1.660, p>0.05). It reveals that the
difference between the means of male and female subjects of urban locale is
statistically not different from the difference between the means of male and
female subjects of rural locale. Thus, it can be concluded that sex x locale
interaction is insignificant. This insignificant F-ratio points out that sex and
locale produce insignificant differences in emotional intelligence.
Furthermore, the effect of sex on emotional intelligence does not depend on
different levels of locale, i.e. urban and rural.
Further, the second order interaction giving the combined effect of
aggression, sex and locale was also studied. The average emotional
intelligence scores of the subjects of eight sub-groups formed on the basis of
aggression, sex and locale are shown in table (1.1) and figure 1(vii)
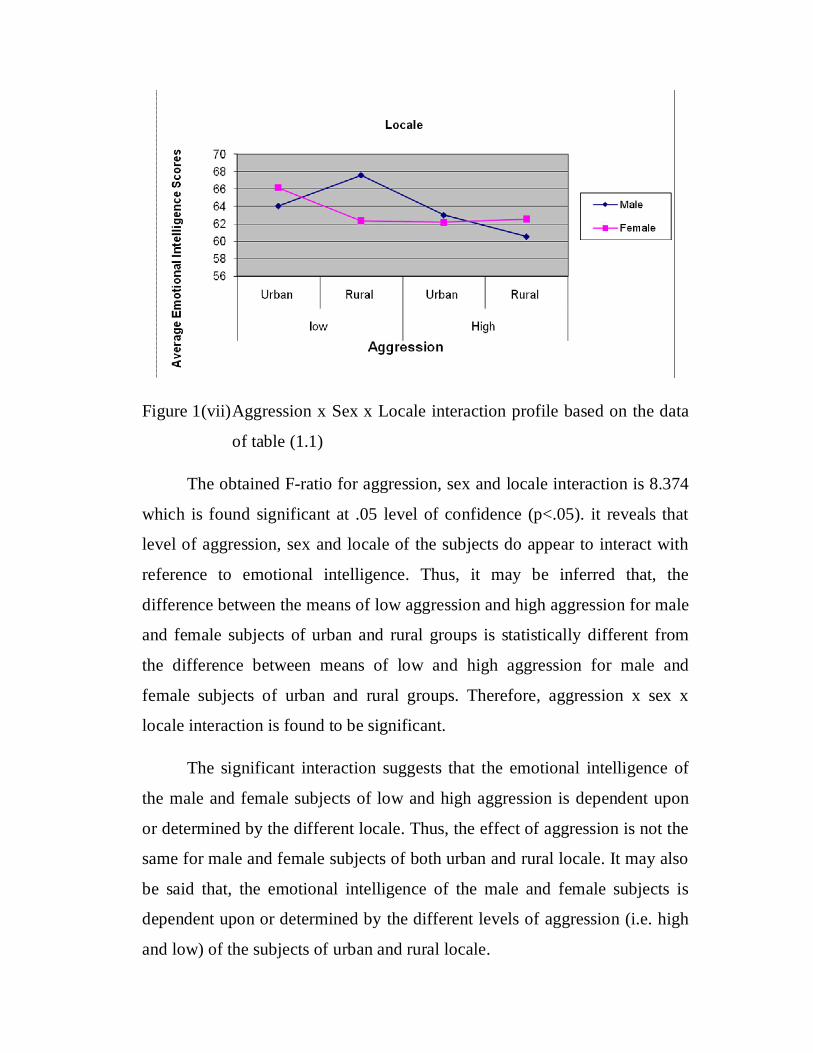
Figure 1(vii) Aggression x Sex x Locale interaction profile based on the data
of table (1.1)
The obtained F-ratio for aggression, sex and locale interaction is 8.374
which is found significant at .05 level of confidence (p<.05). it reveals that
level of aggression, sex and locale of the subjects do appear to interact with
reference to emotional intelligence. Thus, it may be inferred that, the
difference between the means of low aggression and high aggression for male
and female subjects of urban and rural groups is statistically different from
the difference between means of low and high aggression for male and
female subjects of urban and rural groups. Therefore, aggression x sex x
locale interaction is found to be significant.
The significant interaction suggests that the emotional intelligence of
the male and female subjects of low and high aggression is dependent upon
or determined by the different locale. Thus, the effect of aggression is not the
same for male and female subjects of both urban and rural locale. It may also
be said that, the emotional intelligence of the male and female subjects is
dependent upon or determined by the different levels of aggression (i.e. high
and low) of the subjects of urban and rural locale.
Thus, the above discussion shows that among all the three factors i.e.
aggression, sex and locale, only aggression, significantly contributes to the
emotional intelligence. None of their first order interactions were found to be
significant, however the second order interaction is emerged to be significant.
Study (2) Self Concept and Emotional Intelligence
In order to examine the role of self concept in predicting emotional
intelligence by means of ANOVA statistic, self concept was the first
independent variable taken in two levels i.e. bright and poor. Sex and locale
were considered as the other two independent variables with two levels each
i.e. male and female (for sex) and, urban and rural (for locale). For dividing
the subjects into bright and poor ‘self concept’ groups the same process was
applied as mentioned earlier in the interpretation section of aggression and
emotional intelligence. In this way the subjects were divided into various sub-
groups as per the requirements of 2x2x2 ANOVA formed on the basis of self
concept, sex and locale. Then a three-way analysis of variance was computed,
which was expected to give an overall estimate of the differences in
emotional intelligence scores of the subjects due to self concept, sex and
locale. The average emotional intelligence scores of the subjects falling in
different cells of ANOVA table are presented in table (2.1).
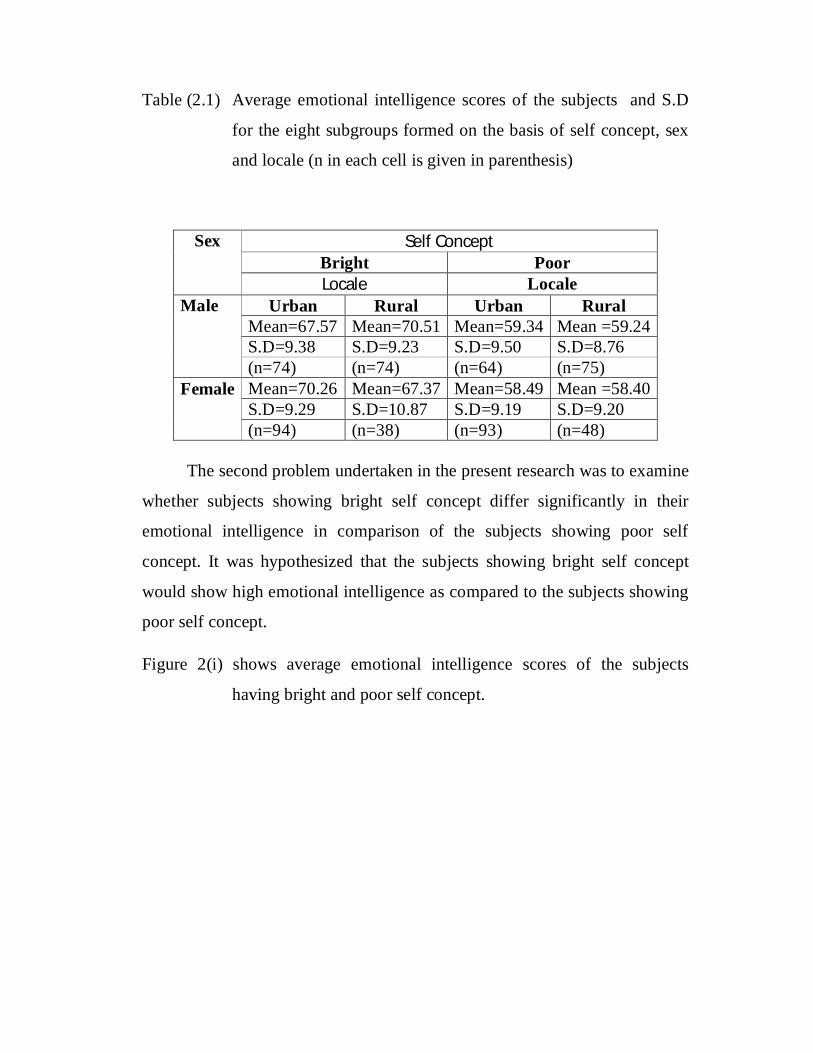
Table (2.1) Average emotional intelligence scores of the subjects and S.D
for the eight subgroups formed on the basis of self concept, sex
and locale (n in each cell is given in parenthesis)
Sex Self Concept Bright Poor Locale Locale
Male Urban Rural Urban Rural Mean=67.57 Mean=70.51 Mean=59.34 Mean =59.24 S.D=9.38 S.D=9.23 S.D=9.50 S.D=8.76 (n=74) (n=74) (n=64) (n=75)
Female Mean=70.26 Mean=67.37 Mean=58.49 Mean =58.40 S.D=9.29 S.D=10.87 S.D=9.19 S.D=9.20 (n=94) (n=38) (n=93) (n=48)
The second problem undertaken in the present research was to examine
whether subjects showing bright self concept differ significantly in their
emotional intelligence in comparison of the subjects showing poor self
concept. It was hypothesized that the subjects showing bright self concept
would show high emotional intelligence as compared to the subjects showing
poor self concept.
Figure 2(i) shows average emotional intelligence scores of the subjects
having bright and poor self concept.
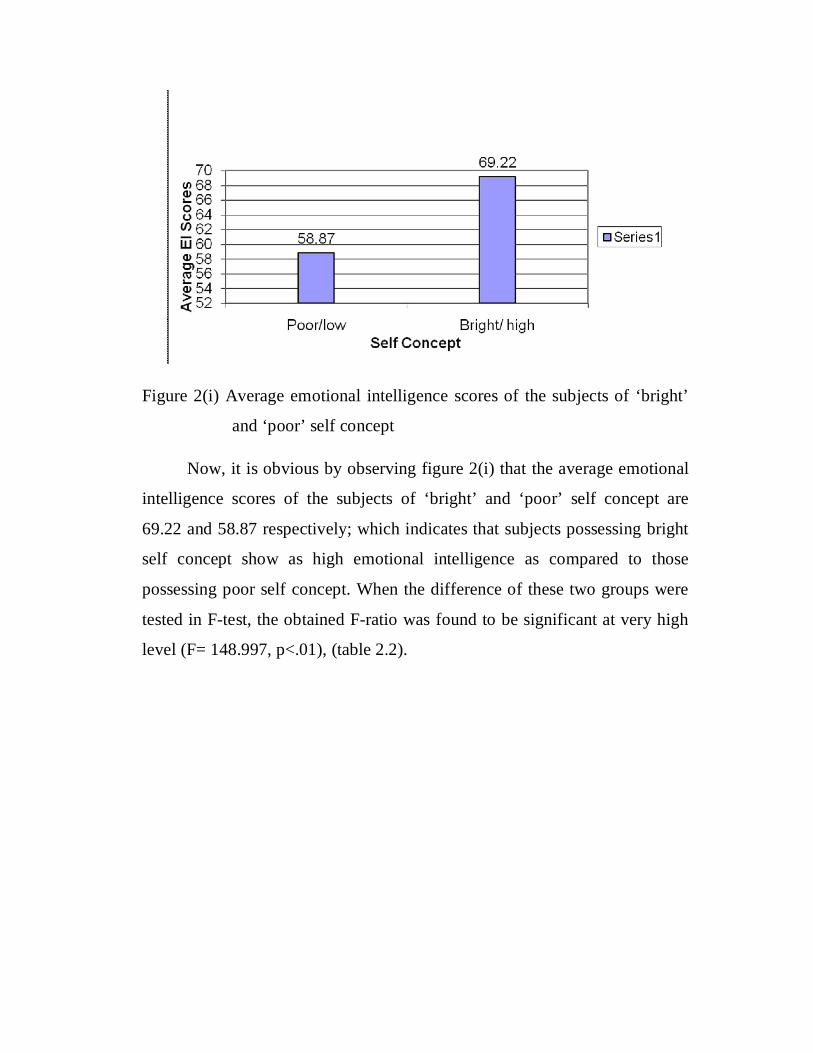
Figure 2(i) Average emotional intelligence scores of the subjects of ‘bright’
and ‘poor’ self concept
Now, it is obvious by observing figure 2(i) that the average emotional
intelligence scores of the subjects of ‘bright’ and ‘poor’ self concept are
69.22 and 58.87 respectively; which indicates that subjects possessing bright
self concept show as high emotional intelligence as compared to those
possessing poor self concept. When the difference of these two groups were
tested in F-test, the obtained F-ratio was found to be significant at very high
level (F= 148.997, p<.01), (table 2.2).
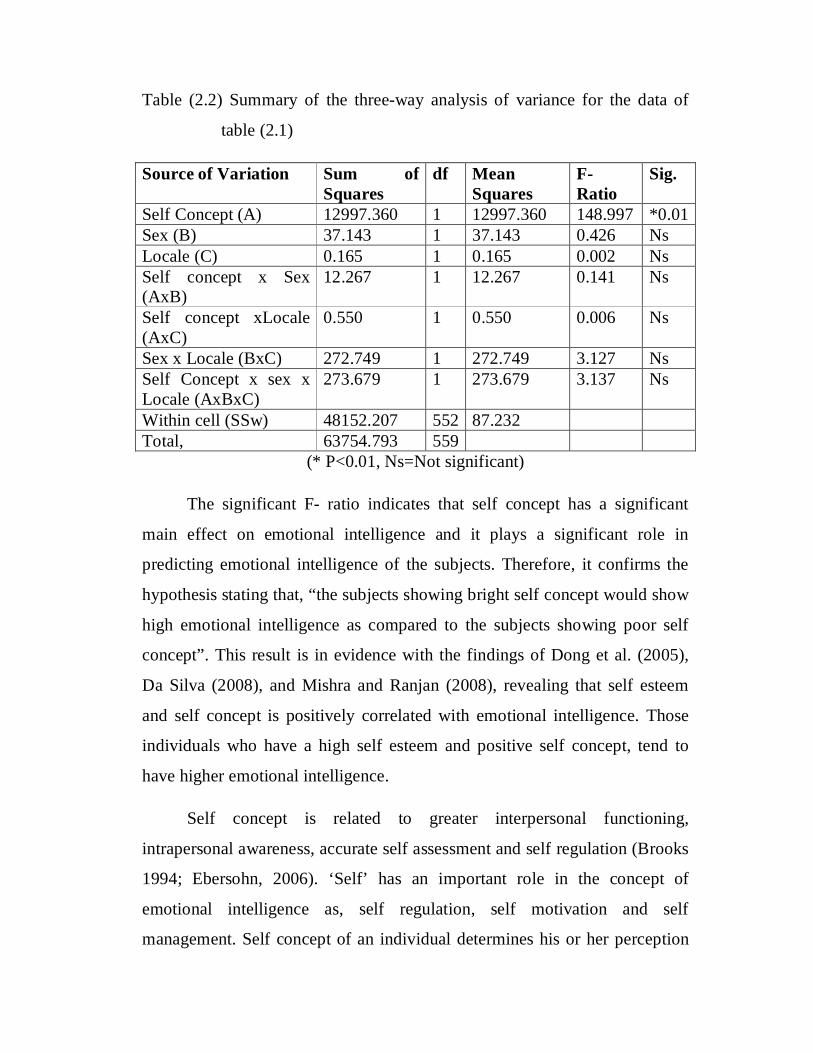
Table (2.2) Summary of the three-way analysis of variance for the data of
table (2.1)
Source of Variation Sum of Squares
df Mean Squares
F- Ratio
Sig.
Self Concept (A) 12997.360 1 12997.360 148.997 *0.01 Sex (B) 37.143 1 37.143 0.426 Ns Locale (C) 0.165 1 0.165 0.002 Ns Self concept x Sex (AxB)
12.267 1 12.267 0.141 Ns
Self concept xLocale (AxC)
0.550 1 0.550 0.006 Ns
Sex x Locale (BxC) 272.749 1 272.749 3.127 Ns Self Concept x sex x Locale (AxBxC)
273.679 1 273.679 3.137 Ns
Within cell (SSw) 48152.207 552 87.232 Total, 63754.793 559
(* P<0.01, Ns=Not significant)
The significant F- ratio indicates that self concept has a significant
main effect on emotional intelligence and it plays a significant role in
predicting emotional intelligence of the subjects. Therefore, it confirms the
hypothesis stating that, “the subjects showing bright self concept would show
high emotional intelligence as compared to the subjects showing poor self
concept”. This result is in evidence with the findings of Dong et al. (2005),
Da Silva (2008), and Mishra and Ranjan (2008), revealing that self esteem
and self concept is positively correlated with emotional intelligence. Those
individuals who have a high self esteem and positive self concept, tend to
have higher emotional intelligence.
Self concept is related to greater interpersonal functioning,
intrapersonal awareness, accurate self assessment and self regulation (Brooks
1994; Ebersohn, 2006). ‘Self’ has an important role in the concept of
emotional intelligence as, self regulation, self motivation and self
management. Self concept of an individual determines his or her perception
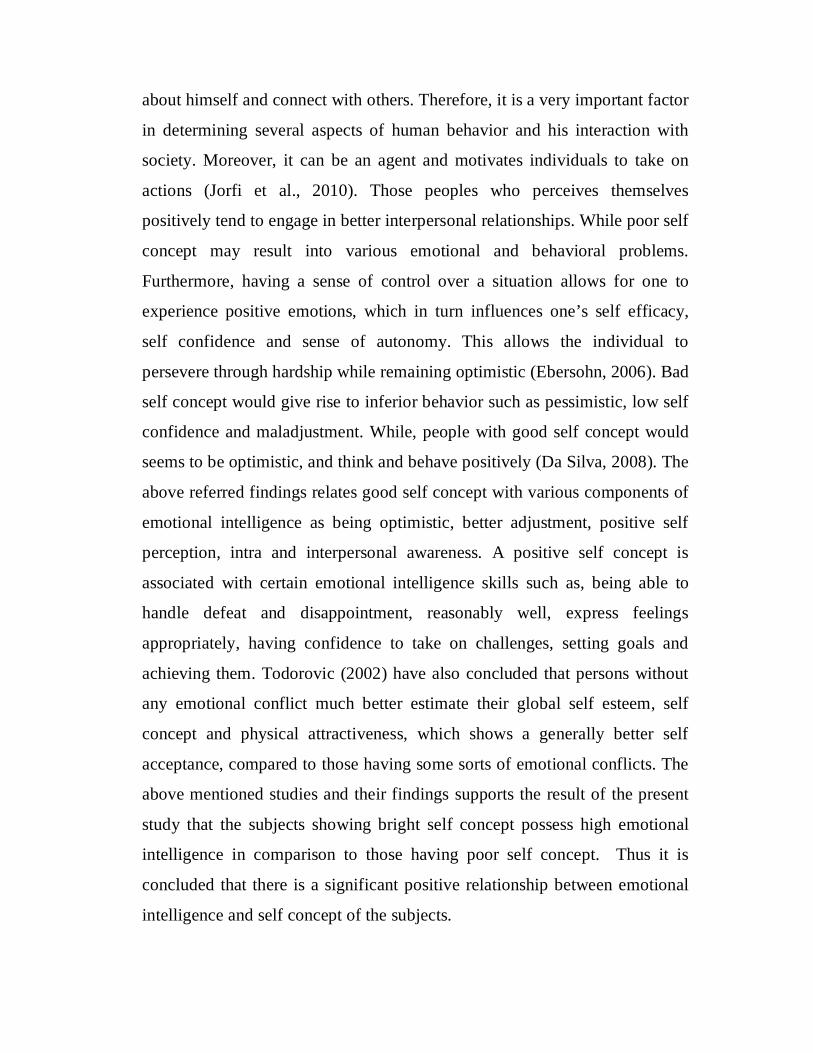
about himself and connect with others. Therefore, it is a very important factor
in determining several aspects of human behavior and his interaction with
society. Moreover, it can be an agent and motivates individuals to take on
actions (Jorfi et al., 2010). Those peoples who perceives themselves
positively tend to engage in better interpersonal relationships. While poor self
concept may result into various emotional and behavioral problems.
Furthermore, having a sense of control over a situation allows for one to
experience positive emotions, which in turn influences one’s self efficacy,
self confidence and sense of autonomy. This allows the individual to
persevere through hardship while remaining optimistic (Ebersohn, 2006). Bad
self concept would give rise to inferior behavior such as pessimistic, low self
confidence and maladjustment. While, people with good self concept would
seems to be optimistic, and think and behave positively (Da Silva, 2008). The
above referred findings relates good self concept with various components of
emotional intelligence as being optimistic, better adjustment, positive self
perception, intra and interpersonal awareness. A positive self concept is
associated with certain emotional intelligence skills such as, being able to
handle defeat and disappointment, reasonably well, express feelings
appropriately, having confidence to take on challenges, setting goals and
achieving them. Todorovic (2002) have also concluded that persons without
any emotional conflict much better estimate their global self esteem, self
concept and physical attractiveness, which shows a generally better self
acceptance, compared to those having some sorts of emotional conflicts. The
above mentioned studies and their findings supports the result of the present
study that the subjects showing bright self concept possess high emotional
intelligence in comparison to those having poor self concept. Thus it is
concluded that there is a significant positive relationship between emotional
intelligence and self concept of the subjects.
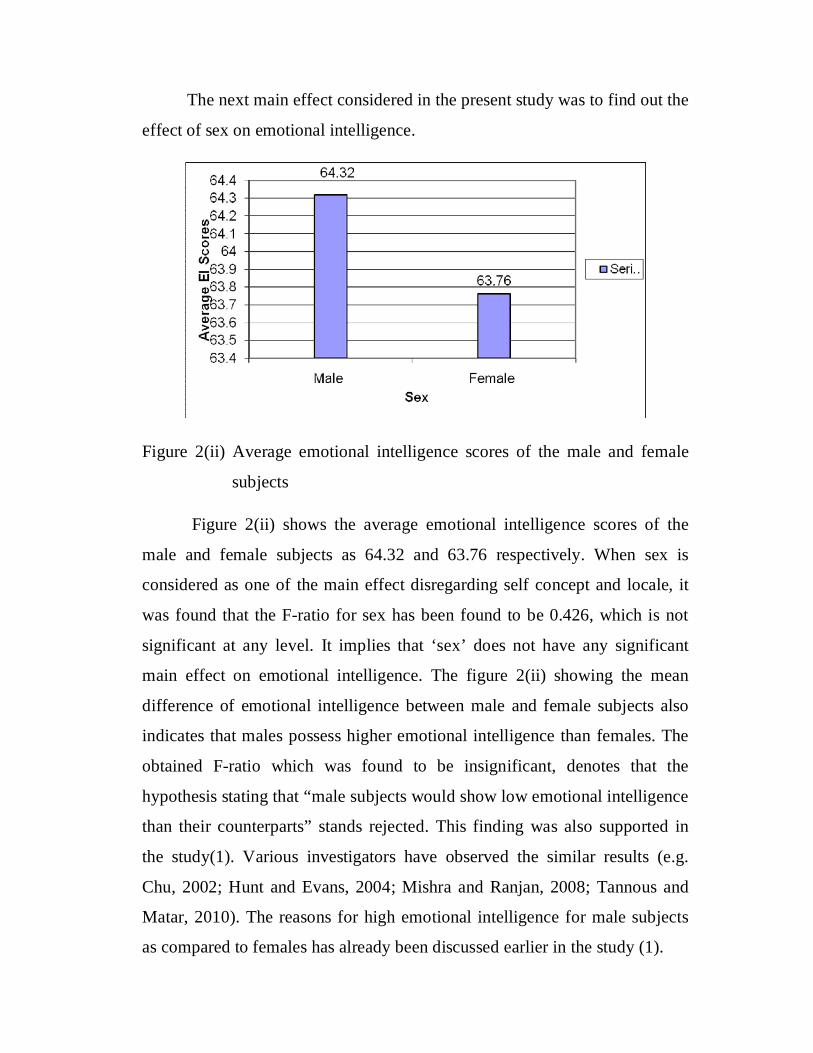
The next main effect considered in the present study was to find out the
effect of sex on emotional intelligence.
Figure 2(ii) Average emotional intelligence scores of the male and female
subjects
Figure 2(ii) shows the average emotional intelligence scores of the
male and female subjects as 64.32 and 63.76 respectively. When sex is
considered as one of the main effect disregarding self concept and locale, it
was found that the F-ratio for sex has been found to be 0.426, which is not
significant at any level. It implies that ‘sex’ does not have any significant
main effect on emotional intelligence. The figure 2(ii) showing the mean
difference of emotional intelligence between male and female subjects also
indicates that males possess higher emotional intelligence than females. The
obtained F-ratio which was found to be insignificant, denotes that the
hypothesis stating that “male subjects would show low emotional intelligence
than their counterparts” stands rejected. This finding was also supported in
the study(1). Various investigators have observed the similar results (e.g.
Chu, 2002; Hunt and Evans, 2004; Mishra and Ranjan, 2008; Tannous and
Matar, 2010). The reasons for high emotional intelligence for male subjects
as compared to females has already been discussed earlier in the study (1).
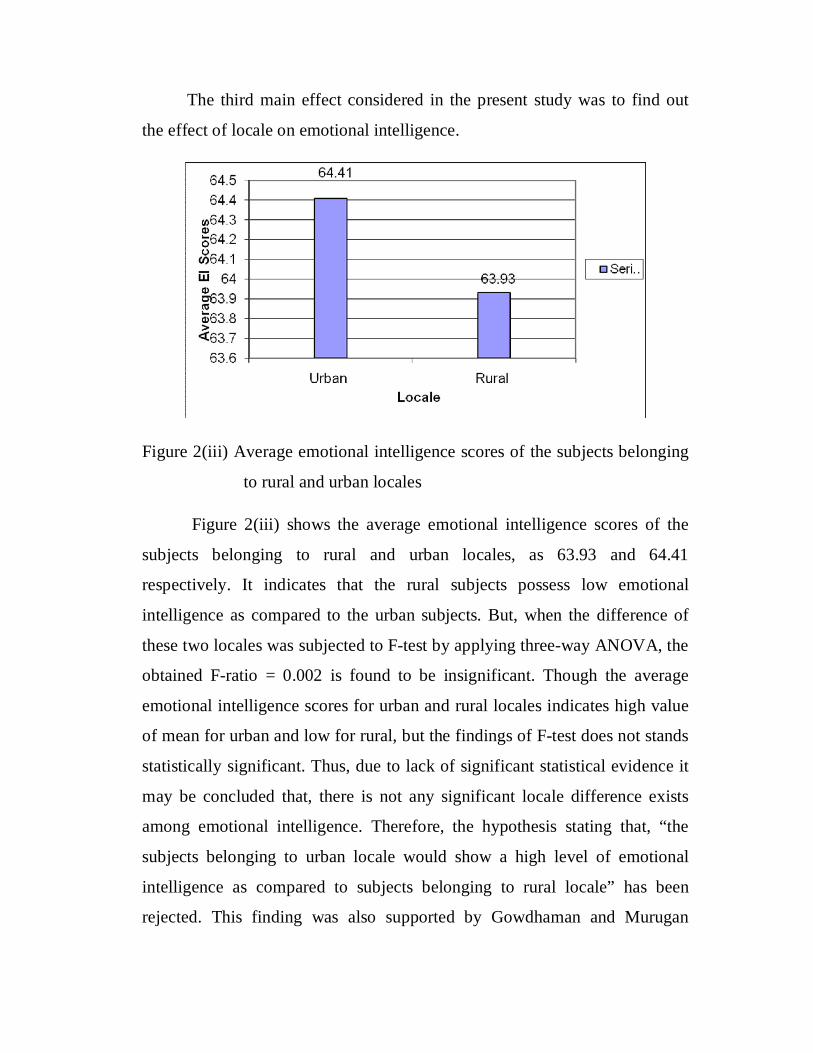
The third main effect considered in the present study was to find out
the effect of locale on emotional intelligence.
Figure 2(iii) Average emotional intelligence scores of the subjects belonging
to rural and urban locales
Figure 2(iii) shows the average emotional intelligence scores of the
subjects belonging to rural and urban locales, as 63.93 and 64.41
respectively. It indicates that the rural subjects possess low emotional
intelligence as compared to the urban subjects. But, when the difference of
these two locales was subjected to F-test by applying three-way ANOVA, the
obtained F-ratio = 0.002 is found to be insignificant. Though the average
emotional intelligence scores for urban and rural locales indicates high value
of mean for urban and low for rural, but the findings of F-test does not stands
statistically significant. Thus, due to lack of significant statistical evidence it
may be concluded that, there is not any significant locale difference exists
among emotional intelligence. Therefore, the hypothesis stating that, “the
subjects belonging to urban locale would show a high level of emotional
intelligence as compared to subjects belonging to rural locale” has been
rejected. This finding was also supported by Gowdhaman and Murugan
(2009) as described in the study (1) and the reasons and interpretation of the
results have already been made there.
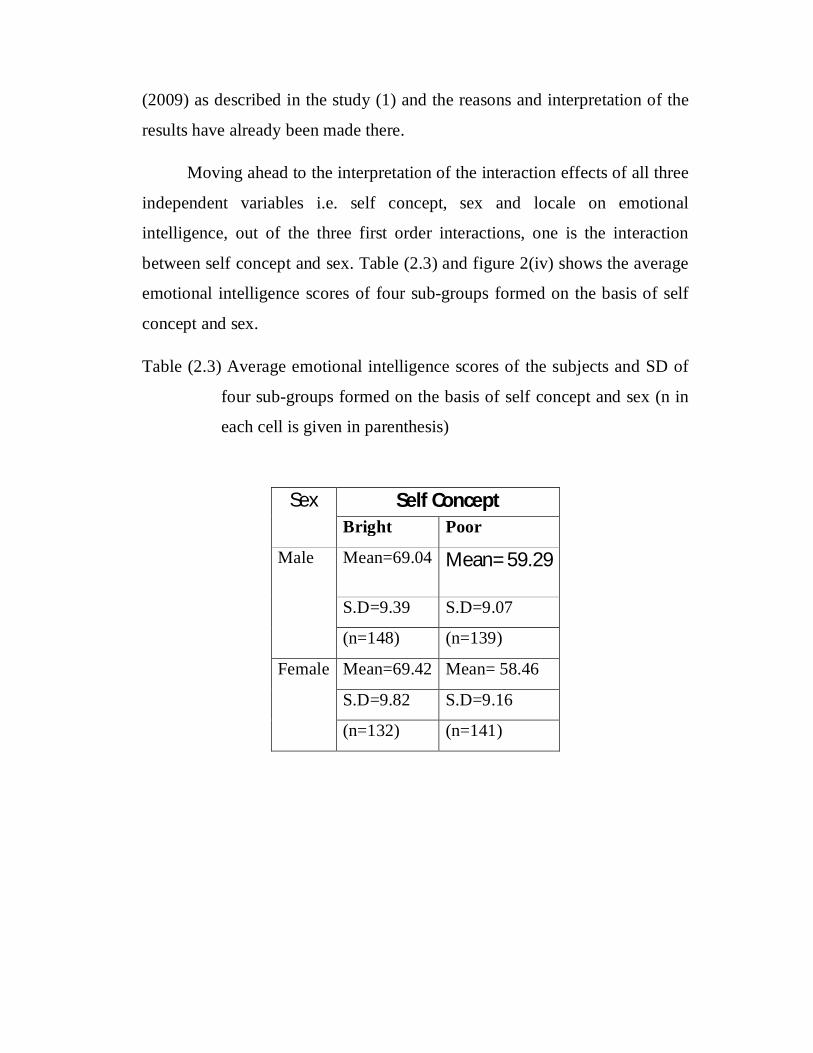
Moving ahead to the interpretation of the interaction effects of all three
independent variables i.e. self concept, sex and locale on emotional
intelligence, out of the three first order interactions, one is the interaction
between self concept and sex. Table (2.3) and figure 2(iv) shows the average
emotional intelligence scores of four sub-groups formed on the basis of self
concept and sex.
Table (2.3) Average emotional intelligence scores of the subjects and SD of
four sub-groups formed on the basis of self concept and sex (n in
each cell is given in parenthesis)
Sex Self Concept
Bright Poor
Male Mean=69.04 Mean= 59.29
S.D=9.39 S.D=9.07
(n=148) (n=139)
Female Mean=69.42 Mean= 58.46
S.D=9.82 S.D=9.16
(n=132) (n=141)
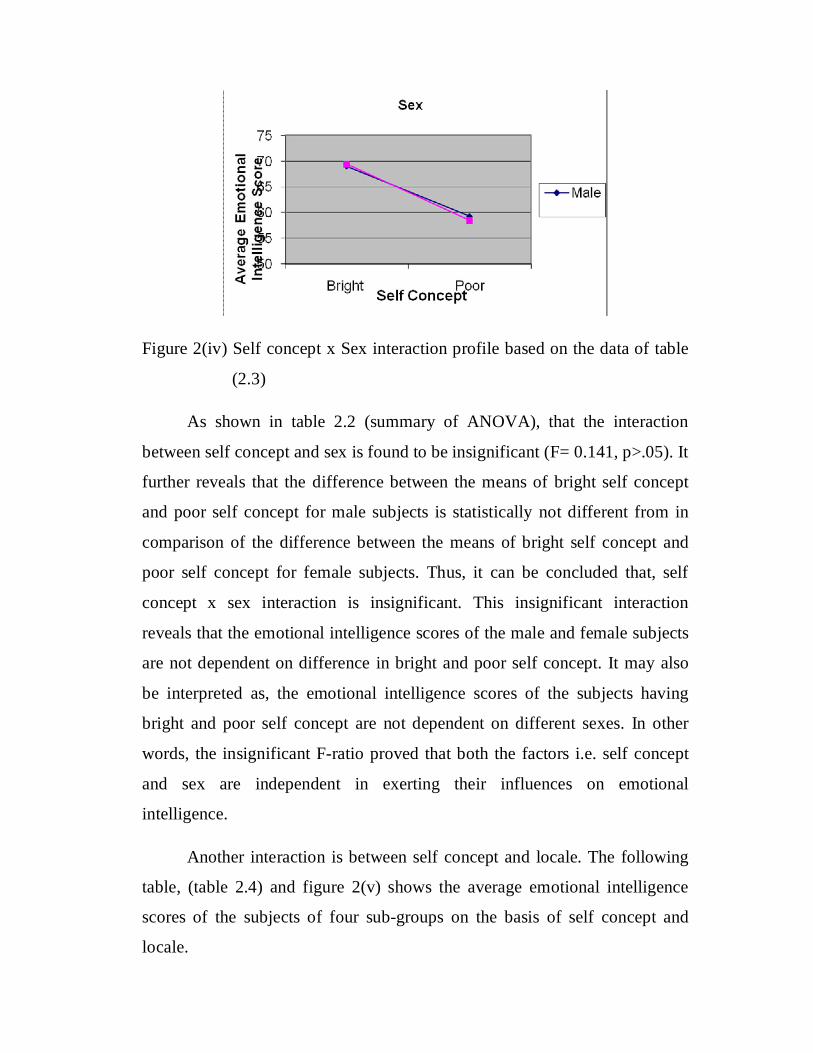
Figure 2(iv) Self concept x Sex interaction profile based on the data of table
(2.3)
As shown in table 2.2 (summary of ANOVA), that the interaction
between self concept and sex is found to be insignificant (F= 0.141, p>.05). It
further reveals that the difference between the means of bright self concept
and poor self concept for male subjects is statistically not different from in
comparison of the difference between the means of bright self concept and
poor self concept for female subjects. Thus, it can be concluded that, self
concept x sex interaction is insignificant. This insignificant interaction
reveals that the emotional intelligence scores of the male and female subjects
are not dependent on difference in bright and poor self concept. It may also
be interpreted as, the emotional intelligence scores of the subjects having
bright and poor self concept are not dependent on different sexes. In other
words, the insignificant F-ratio proved that both the factors i.e. self concept
and sex are independent in exerting their influences on emotional
intelligence.
Another interaction is between self concept and locale. The following
table, (table 2.4) and figure 2(v) shows the average emotional intelligence
scores of the subjects of four sub-groups on the basis of self concept and
locale.
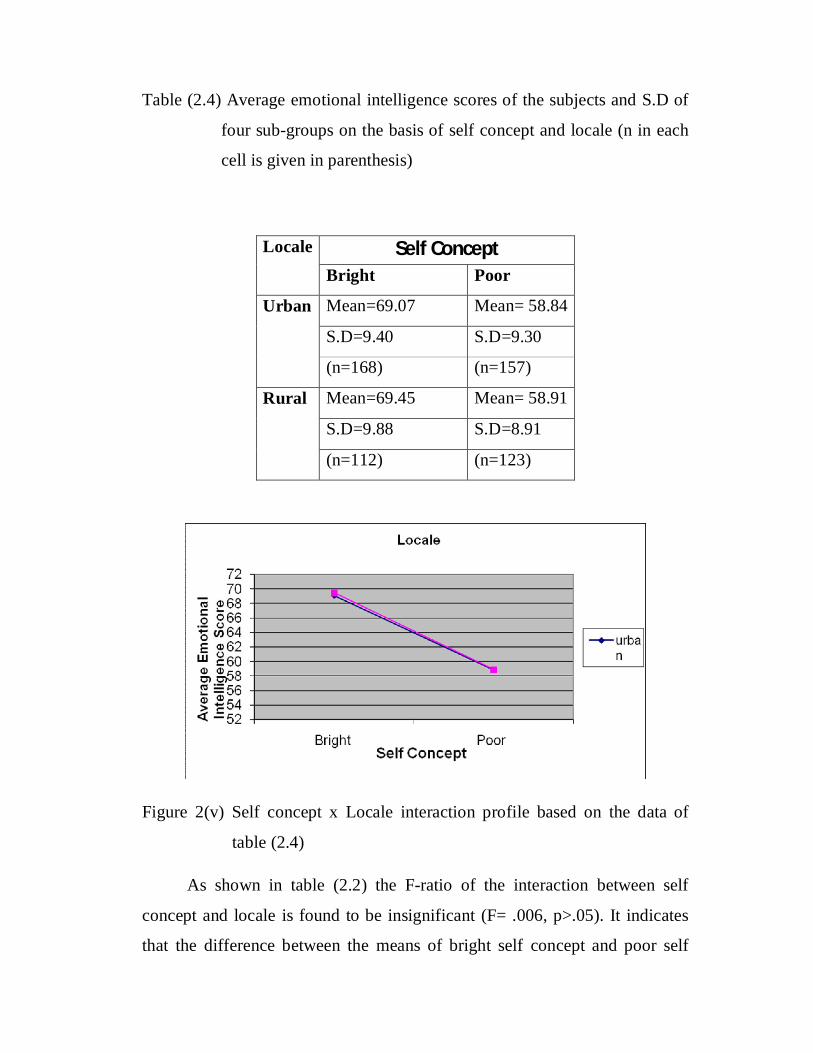
Table (2.4) Average emotional intelligence scores of the subjects and S.D of
four sub-groups on the basis of self concept and locale (n in each
cell is given in parenthesis)
Locale Self Concept Bright Poor
Urban Mean=69.07 Mean= 58.84
S.D=9.40 S.D=9.30
(n=168) (n=157)
Rural Mean=69.45 Mean= 58.91
S.D=9.88 S.D=8.91
(n=112) (n=123)
Figure 2(v) Self concept x Locale interaction profile based on the data of
table (2.4)
As shown in table (2.2) the F-ratio of the interaction between self
concept and locale is found to be insignificant (F= .006, p>.05). It indicates
that the difference between the means of bright self concept and poor self

concept of urban group of subjects is not statistically different from the
difference between the means of bright self concept and poor self concept for
rural group of subjects. Thus, it can be concluded that self concept x locale
interaction is insignificant. This insignificant interaction reveals that the
emotional intelligence scores of the subjects of bright and poor self concept
sub-groups are nearly the same as for rural and urban locale. It may also be
referred that effect of bright and poor self concept on emotional intelligence
does not depend on the difference in rural and urban locale; or the effect of
rural and urban locale on emotional intelligence does not depend on
difference in bright and poor self concept.
The next first order interaction is between sex and locale. The average
emotional intelligence scores of the subjects of four sub-groups formed on
the basis of sex and locale is shown in the table (2.5) and figure 2(vi).
Table (2.5) Average emotional intelligence scores of the subjects and S.D of
four subgroups formed on the basis of sex and locale (n in each
cell is given in parenthesis)
Sex Locale Urban Rural
Male Mean=63.75 Mean=64.84
S.D=10.26 S.D=10.60
(n=138) (n=149)
Female Mean=64.41 Mean=62.36
S.D=10.94 S.D=10.88
(n=187) (n=86)
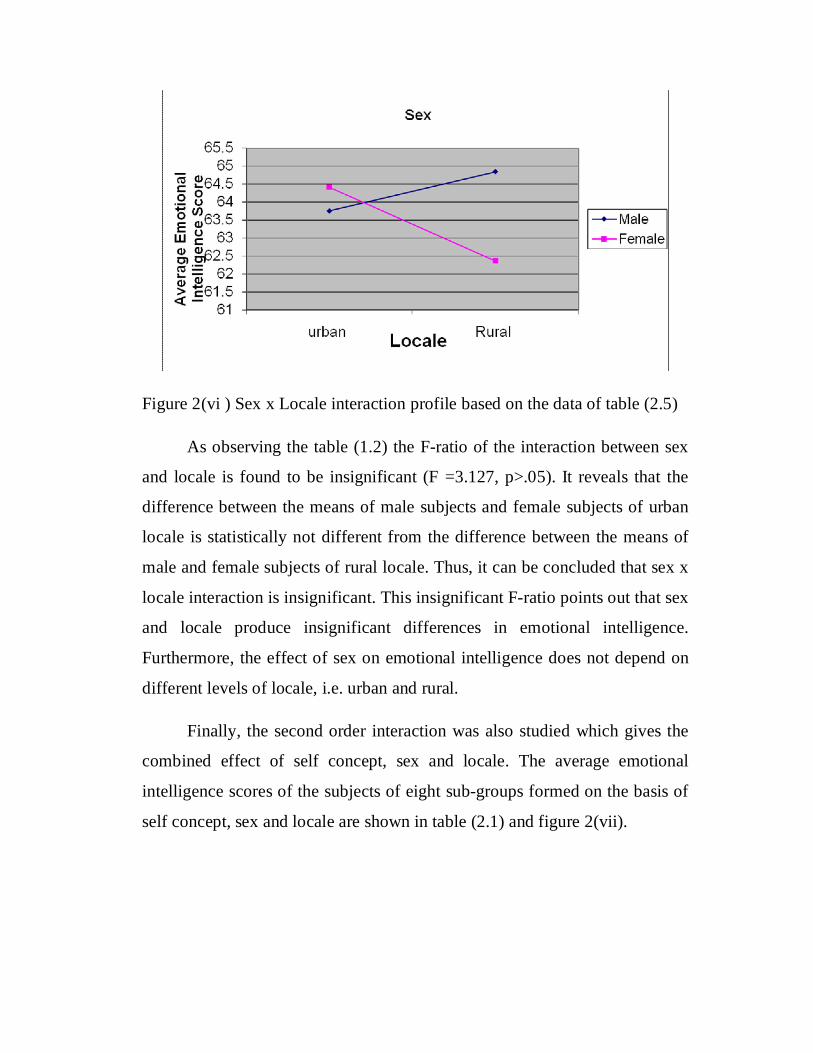
Figure 2(vi ) Sex x Locale interaction profile based on the data of table (2.5)
As observing the table (1.2) the F-ratio of the interaction between sex
and locale is found to be insignificant (F =3.127, p>.05). It reveals that the
difference between the means of male subjects and female subjects of urban
locale is statistically not different from the difference between the means of
male and female subjects of rural locale. Thus, it can be concluded that sex x
locale interaction is insignificant. This insignificant F-ratio points out that sex
and locale produce insignificant differences in emotional intelligence.
Furthermore, the effect of sex on emotional intelligence does not depend on
different levels of locale, i.e. urban and rural.
Finally, the second order interaction was also studied which gives the
combined effect of self concept, sex and locale. The average emotional
intelligence scores of the subjects of eight sub-groups formed on the basis of
self concept, sex and locale are shown in table (2.1) and figure 2(vii).
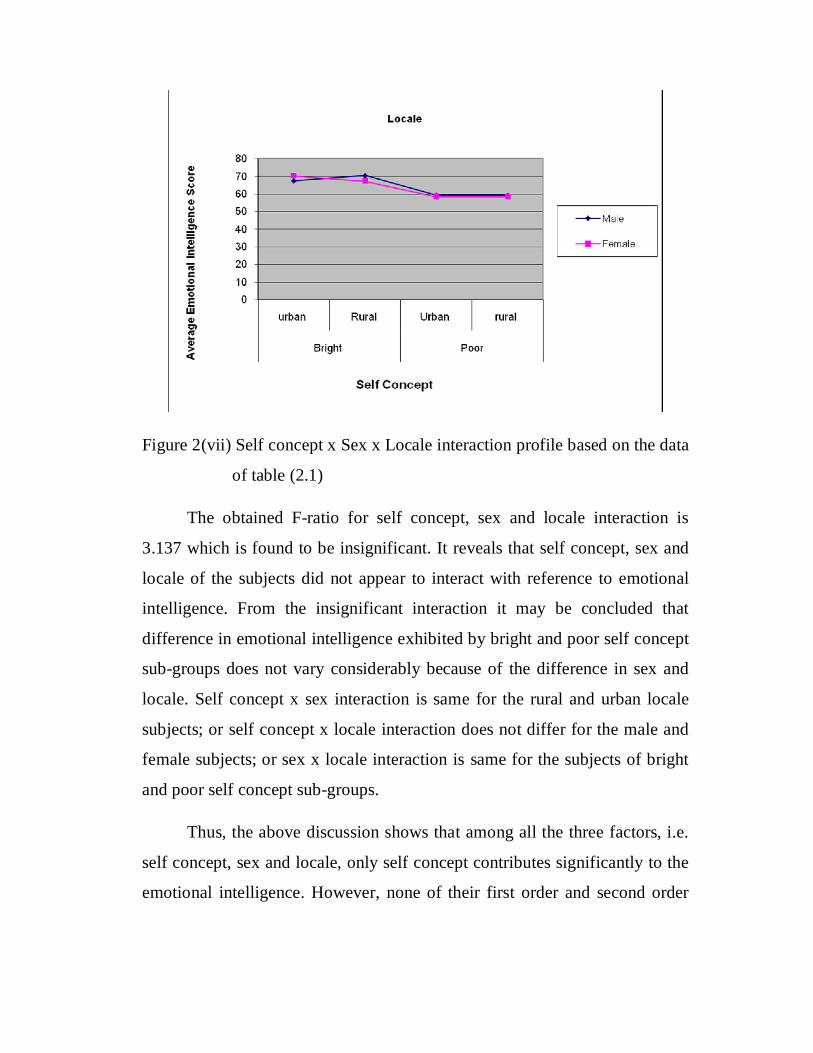
Figure 2(vii) Self concept x Sex x Locale interaction profile based on the data
of table (2.1)
The obtained F-ratio for self concept, sex and locale interaction is
3.137 which is found to be insignificant. It reveals that self concept, sex and
locale of the subjects did not appear to interact with reference to emotional
intelligence. From the insignificant interaction it may be concluded that
difference in emotional intelligence exhibited by bright and poor self concept
sub-groups does not vary considerably because of the difference in sex and
locale. Self concept x sex interaction is same for the rural and urban locale
subjects; or self concept x locale interaction does not differ for the male and
female subjects; or sex x locale interaction is same for the subjects of bright
and poor self concept sub-groups.
Thus, the above discussion shows that among all the three factors, i.e.
self concept, sex and locale, only self concept contributes significantly to the
emotional intelligence. However, none of their first order and second order
interactions were found to be significant. Therefore, it is concluded that self
concept have a significant positive relationship with emotional intelligence.
Study (3) Extraversion and Emotional Intelligence
The next variable to be measured with reference to emotional
intelligence, in the present study is one of the personality dimensions, i.e.
extraversion. In order to examine the role of ‘extraversion’ personality
dimension in predicting emotional intelligence, by using three-way ANOVA
statistic, extraversion was considered as the first independent variable taken
into two levels i.e. high and low. The subjects scoring low on extraversion
were considered as introverts. The next independent variable is sex, also
taken at two levels (categories) i.e. male and female, and the third
independent variable is locale, which is considered also with two levels
(groups) i.e. urban and rural.
The process of dividing the subjects into high and low ‘extraversion’
groups, was the same, as applied for dividing the subjects into high and low
‘aggression’ groups as mentioned previously, in detail. Then a three-way
analysis of variance was computed which was expected to give an overall
estimate of the differences in emotional intelligence scores of the subjects
due to extraversion, sex and locale. The average emotional intelligence scores
of the subjects falling in different cells of ANOVA table are presented in
table (3.1).
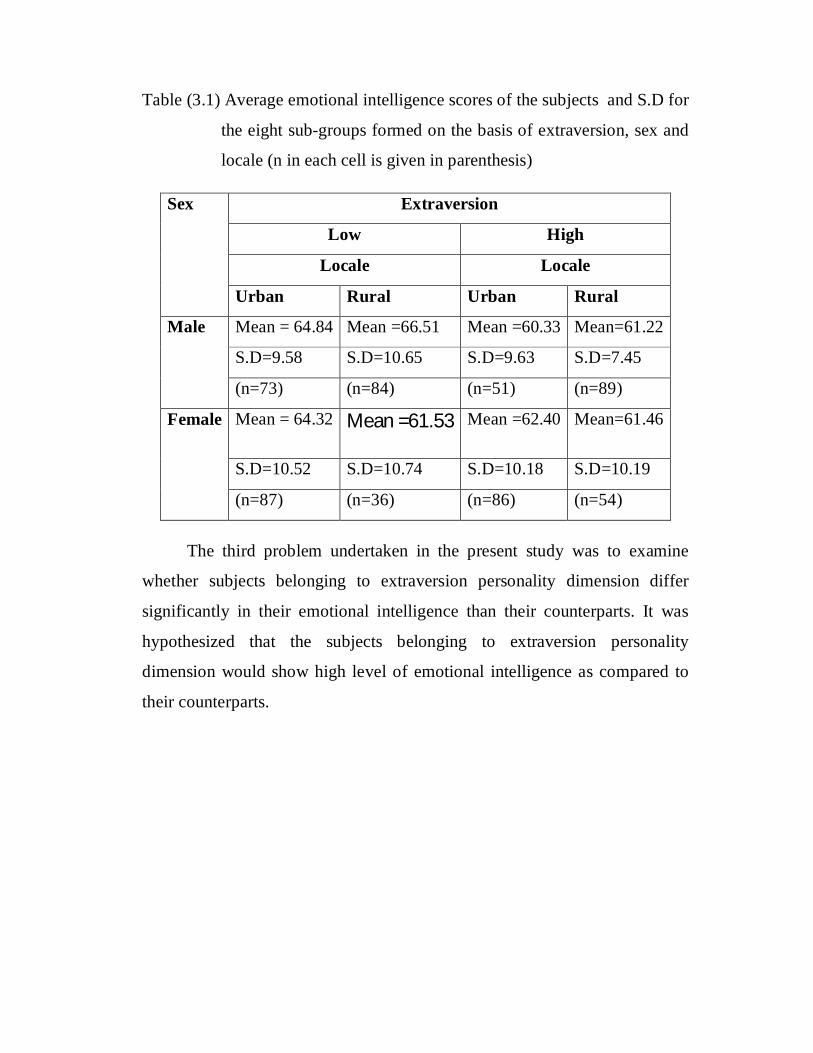
Table (3.1) Average emotional intelligence scores of the subjects and S.D for
the eight sub-groups formed on the basis of extraversion, sex and
locale (n in each cell is given in parenthesis)
Sex Extraversion
Low High
Locale Locale
Urban Rural Urban Rural
Male Mean = 64.84 Mean =66.51 Mean =60.33 Mean=61.22
S.D=9.58 S.D=10.65 S.D=9.63 S.D=7.45
(n=73) (n=84) (n=51) (n=89)
Female Mean = 64.32 Mean =61.53 Mean =62.40 Mean=61.46
S.D=10.52 S.D=10.74 S.D=10.18 S.D=10.19
(n=87) (n=36) (n=86) (n=54)
The third problem undertaken in the present study was to examine
whether subjects belonging to extraversion personality dimension differ
significantly in their emotional intelligence than their counterparts. It was
hypothesized that the subjects belonging to extraversion personality
dimension would show high level of emotional intelligence as compared to
their counterparts.

Figure 3(i) Average emotional intelligence scores of the subjects scoring low
and high on extraversion
It was observed from the above figure 3(i) that the average emotional
intelligence scores of the subjects scoring low and high on extraversion are
64.75 and 61.47 respectively. Further when difference of these two groups
(i.e. high and low extraversion) were tested in F-test the obtained F-ratio was
found to be 11.396 which is significant at .01 level of confidence (table 3.2).
Table (3.2) Summary of the three-way analysis of variance for the data of table (3.1)
Source of Variation Sum of Squares
df Mean square
F- ratio
Sig.
Extraversion (A) 1102.657 1 1102.657 11.396 *0.01 Sex (B) 81.237 1 81.237 0.840 Ns Locale (C) 10.668 1 10.668 0.110 Ns Extraversion x Sex (AxB)
483.145 1 483.145 4.993 Ns
Extraversion x Locale (AxC)
9.212 1 9.212 0.095 Ns
Sex x Locale (BxC) 314.748 1 314.748 3.253 Ns Extraversion x sex x Locale (AxBxC)
55.650 1 55.650 0.573 Ns
Within cell (SSw) 53411.799 552 96.761 Total 55719.136 559
(* P<0.01, Ns=Not significant)
The significant F-ratio indicates that extraversion personality
dimension has a significant main effect on emotional intelligence of the
subjects. It indicates that both the groups (high and low extraversion) differed
significantly. But a glance at the mean scores indicates that subjects scoring
low on extraversion, possess high emotional intelligence as compared to
those who were scored high on extraversion dimension of personality.
However, it was expected that those who have scored high on extraversion
would also possess high emotional intelligence. Thus, it can be interpreted
that subjects high on extraversion scores are low on their emotional
intelligence. It further implies that subjects scoring low on extraversion (i.e.
those who are introverts) are possessing high emotional intelligence as
compared to their counterparts.
Therefore, the above finding leads to the conclusion that there exists a
significant negative relationship between emotional intelligence and
extraversion dimension of personality, which means that the level of
emotional intelligence decreases with an increase in extraversion scores of
the subjects. Hence, the hypothesis stating that “the subjects belonging to
extraversion personality dimension would show high level of emotional
intelligence as compared to their counterparts” has been rejected in this study.
The findings of the present study is in evidence with the results obtained by
Palmer, Gardner and Stough (2003) who have found small correlations
between extraversion personality dimension and emotional intelligence.
Furthermore, the findings of Kumar and Bhushan (2006), have also supported
the results of the results of the present study by concluding that, extraversion
personality (referred as ‘sociability’) had a negative correlation with ‘social
skills’ dimension of emotional intelligence.
Extraversion is often characterized as being energetic, outgoing, to
seek out stimulation and the company of others. The extraverts tend to be
gregarious, assertive and interested in obtaining gratification from what is
outside the ‘self’. while, introverts tend to be more reserved and less outgoing
in comparison to the former. Being reserved and less sociable does not meant
that they are loners, but they tend to be satisfy with fewer social relationships.
Introversion does not describe social discomfort. Extraversion and
introversion are viewed as a single continuum, thus to be high on one is
necessarily to be low on the other. As the finding of the present study reveals
that subjects scoring low on extraversion (i.e. introverts) are possessing high
emotional intelligence as compared to those who have scored high on
extraversion personality dimension. One of the reasons behind this type of
finding may be that, though typical extraverts possess qualities of being
optimistic, and having positive emotions, they are also often characterized as
impulsive individuals, tends to be aggressive, and loosing temper quickly.
Eysenck (1967) have revealed that extraverts don’t learn from punishments.
They show a pattern of poorly socialized and impulsive behavior.
Furthermore, extraverts who are highly emotional respond to their emotions
impulsively and at its extreme, the extravert’s impulsive actions are not
restrained at all, as his feelings are not under right control, resulting in a
pattern of behavior that is variously been labeled psychopathy, antisocial
personality, and sociopathy. All the above mentioned behavioral aspects
opposes the emotionally intelligent behavioral skills. Nevertheless,
extraversion is perceived as socially desirable, but it is not always an
advantage. Studies show that, extraverted youth are more likely to engage in
delinquent behavior (Ryckman, 2004). While, introversion constitutes
controlled and responsible behavior, and conversally, it is perceived as less
socially desirable but it is strongly associated with positive traits such as
intelligence (Furnham, Forde and Cotter, 1998) and “giftedness” (Gallagher,
1990; Hoehn, and Birely, 1988) and also, researchers have found that
introverts tend to be more successful in academic environments, where
extroverts may find boring (Eysenck, 1971). Studies revealed that an introvert
distrusts the impulse of the moment, likes a well ordered mode of life, seldom
behaves in an aggressive manner and does not lose his temper easily
(Eysenck, 1967). The aforesaid behavioral patterns are essential for having a
good emotional intelligence. Therefore, on the basis of the results obtained by
the present study, it may be concluded that, there exists a significant negative
relationship between emotional intelligence and extraversion personality
dimension, as the subjects scoring low on extraversion are possessing high
emotional intelligence.
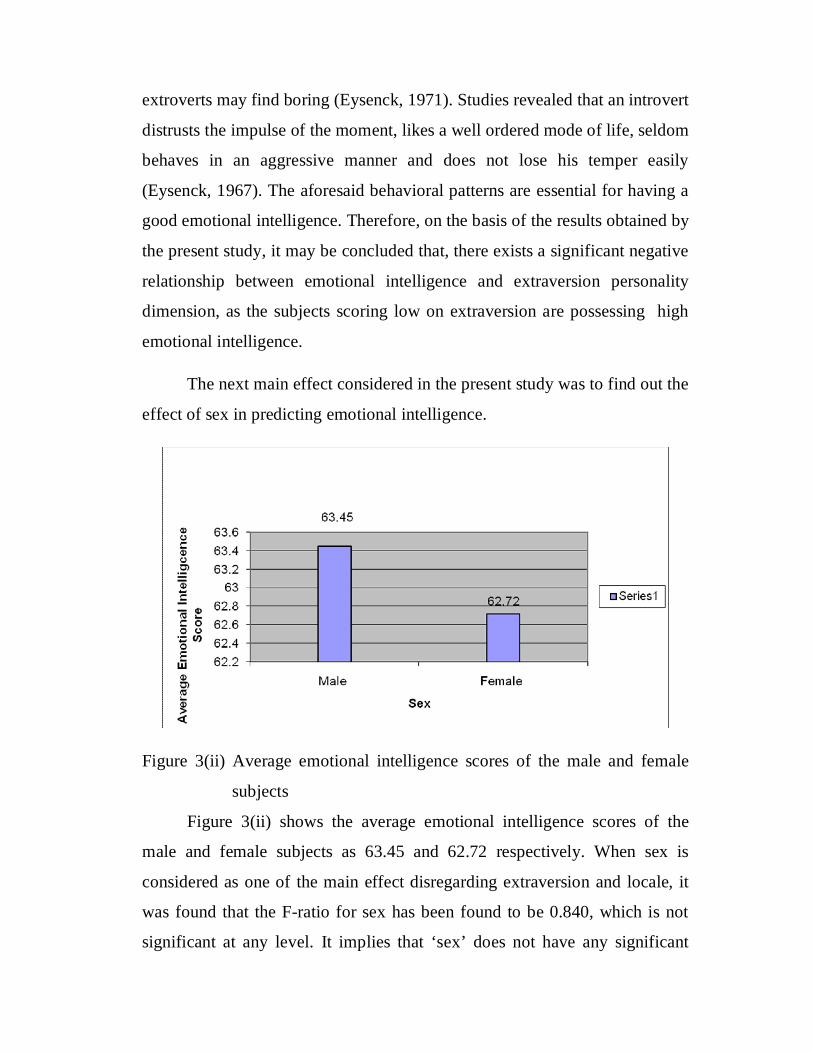
The next main effect considered in the present study was to find out the
effect of sex in predicting emotional intelligence.
Figure 3(ii) Average emotional intelligence scores of the male and female
subjects
Figure 3(ii) shows the average emotional intelligence scores of the
male and female subjects as 63.45 and 62.72 respectively. When sex is
considered as one of the main effect disregarding extraversion and locale, it
was found that the F-ratio for sex has been found to be 0.840, which is not
significant at any level. It implies that ‘sex’ does not have any significant
main effect on emotional intelligence. The figure 3(ii) showing the mean
difference of emotional intelligence between male and female subjects also
indicates that males possess higher emotional intelligence than females. The
obtained F-ratio which was found to be insignificant, denotes that the
hypothesis stating that “male subjects would show low emotional intelligence
than their counterparts” has been rejected in the present study. This finding
was also supported in study (1). Various investigators have observed the
similar results (e.g. Chu, 2002; Hunt and Evans, 2004; Mishra and Ranjan,
2008; Tannous and Matar, 2010). The reasons for high emotional intelligence
for male subjects as compared to females has already been discussed earlier
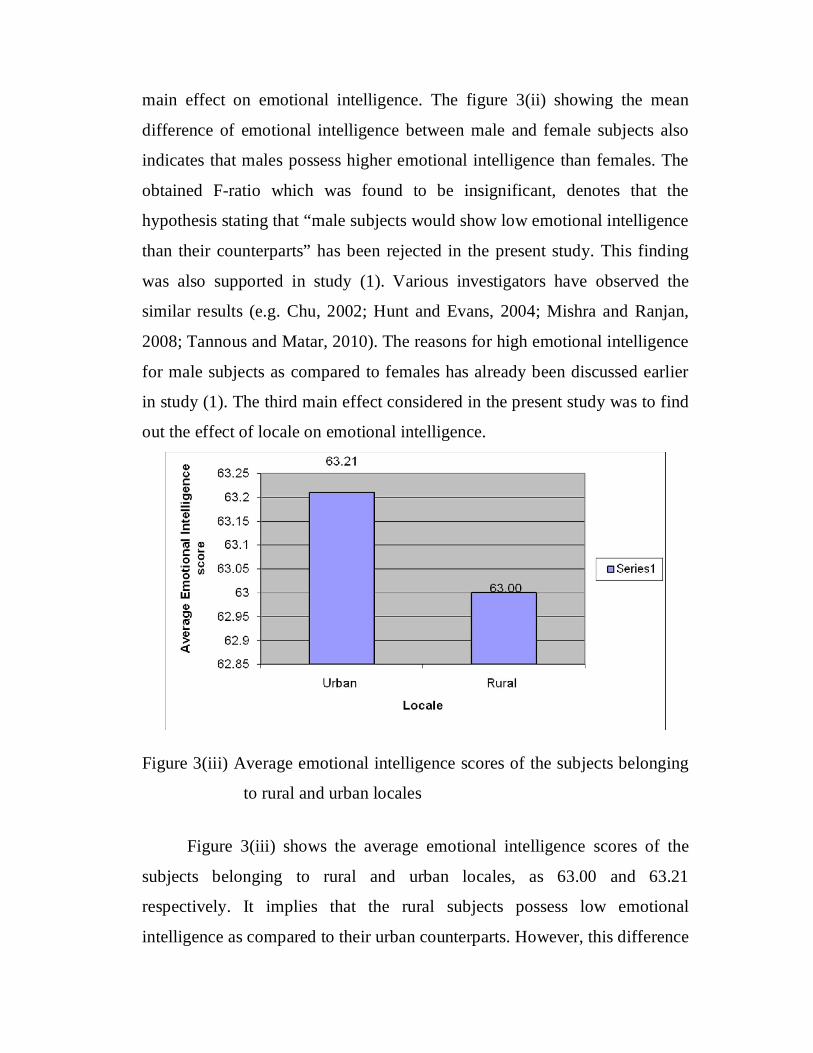
in study (1). The third main effect considered in the present study was to find
out the effect of locale on emotional intelligence.
Figure 3(iii) Average emotional intelligence scores of the subjects belonging
to rural and urban locales
Figure 3(iii) shows the average emotional intelligence scores of the
subjects belonging to rural and urban locales, as 63.00 and 63.21
respectively. It implies that the rural subjects possess low emotional
intelligence as compared to their urban counterparts. However, this difference
does not show much variation. But, when the difference of these two locales
was subjected to F-test by applying three-way ANOVA, the obtained F-ratio
= 0.110 is found to be insignificant. It implies that there is not any significant
main effect of locale on the emotional intelligence of the subjects.
Therefore, due to lack of significant statistical evidence the research
hypothesis stating that, “the subjects belonging to urban locale would show a
high level of emotional intelligence as compared to their rural counterparts”
has been rejected. This finding was also supported in study (1) and the
reasons and interpretation of the results have already been made there.
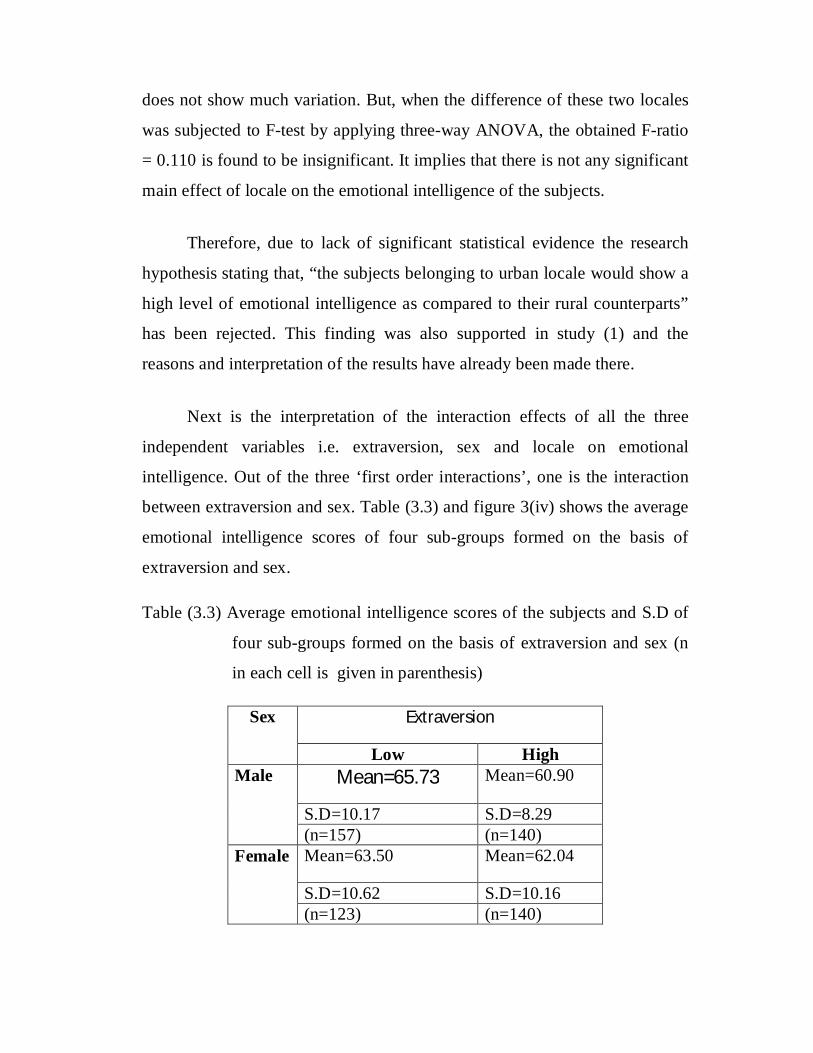
Next is the interpretation of the interaction effects of all the three
independent variables i.e. extraversion, sex and locale on emotional
intelligence. Out of the three ‘first order interactions’, one is the interaction
between extraversion and sex. Table (3.3) and figure 3(iv) shows the average
emotional intelligence scores of four sub-groups formed on the basis of
extraversion and sex.
Table (3.3) Average emotional intelligence scores of the subjects and S.D of
four sub-groups formed on the basis of extraversion and sex (n
in each cell is given in parenthesis)
Sex Extraversion
Low High Male Mean=65.73 Mean=60.90
S.D=10.17 S.D=8.29 (n=157) (n=140)
Female Mean=63.50 Mean=62.04
S.D=10.62 S.D=10.16 (n=123) (n=140)
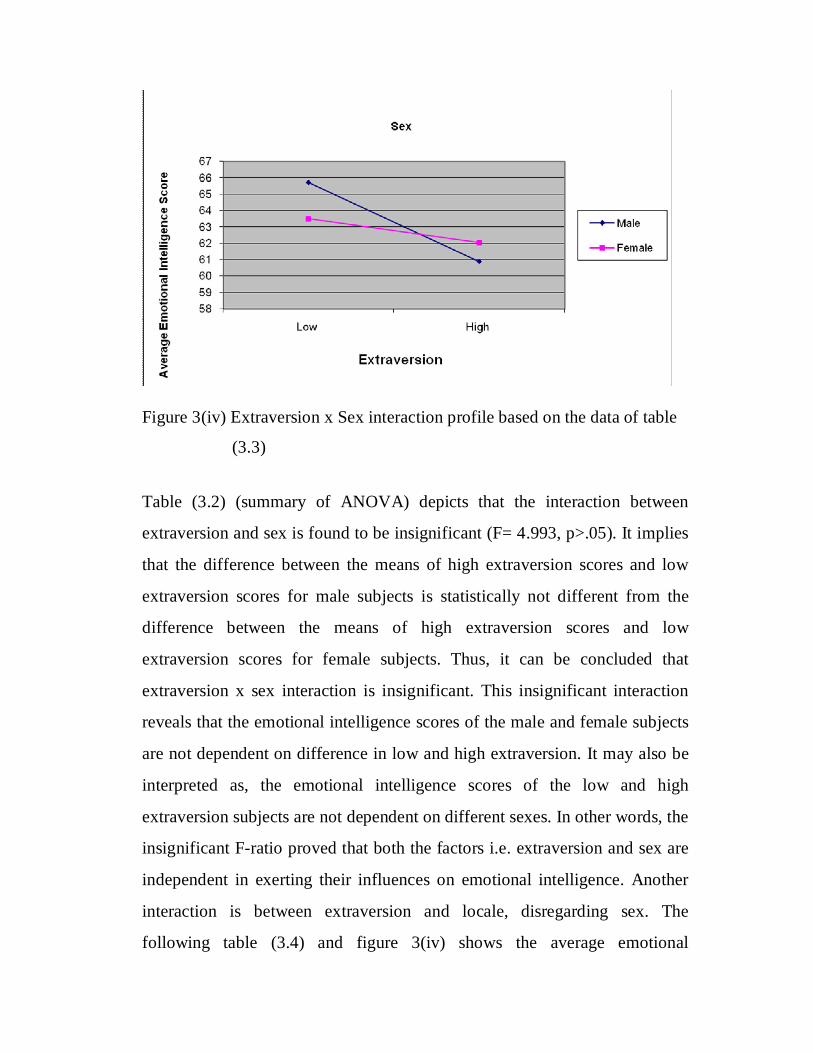
Figure 3(iv) Extraversion x Sex interaction profile based on the data of table
(3.3)
Table (3.2) (summary of ANOVA) depicts that the interaction between
extraversion and sex is found to be insignificant (F= 4.993, p>.05). It implies
that the difference between the means of high extraversion scores and low
extraversion scores for male subjects is statistically not different from the
difference between the means of high extraversion scores and low
extraversion scores for female subjects. Thus, it can be concluded that
extraversion x sex interaction is insignificant. This insignificant interaction
reveals that the emotional intelligence scores of the male and female subjects
are not dependent on difference in low and high extraversion. It may also be
interpreted as, the emotional intelligence scores of the low and high
extraversion subjects are not dependent on different sexes. In other words, the
insignificant F-ratio proved that both the factors i.e. extraversion and sex are
independent in exerting their influences on emotional intelligence. Another
interaction is between extraversion and locale, disregarding sex. The
following table (3.4) and figure 3(iv) shows the average emotional

intelligence scores of the subjects of four subgroups on the basis of
extraversion and locale. Table (3.4) Average emotional intelligence scores of the subjects and S.D of
four subgroups on the basis of extraversion and locale (n in each
cell is given in parenthesis)
Locale Extraversion Low High
Urban Mean=64.56 Mean=61.63
S.D=10.07 S.D=9.99
(n=160) (n=137)
Rural Mean=65.02 Mean=61.31
S.D=10.88 S.D=8.55
(n=120) (n=143)
Figure 3(v) Extraversion x Locale interaction profile based on the data of
table (3.4)
As it has been clear from the table (3.2) that the F-ratio of the
interaction between extraversion and locale is found to be insignificant (F=
0.095, p>.05). It indicates that the difference between the means of high
extraversion scores and low extraversion scores of urban group of subjects is
not statistically different from the difference between means of high
extraversion scores and low extraversion scores for rural group of subjects.
Thus, it can be concluded that extraversion x locale interaction is
insignificant. This insignificant interaction reveals that the emotional
intelligence scores of the subjects of low and high extraversion sub-groups
are nearly the same as for rural and urban locale. It may also be stated that
effect of low and high extraversion on emotional intelligence does not depend
on the difference in rural and urban locale; or the effect of rural and urban
locale on emotional intelligence does not depend on difference in low and
high extraversion.
The next first order interaction is between sex and locale, disregarding
extraversion. The average emotional intelligence scores of the subjects of
four sub-groups formed on the basis of sex and locale is shown in the table
(3.5) and figure 3(vi).
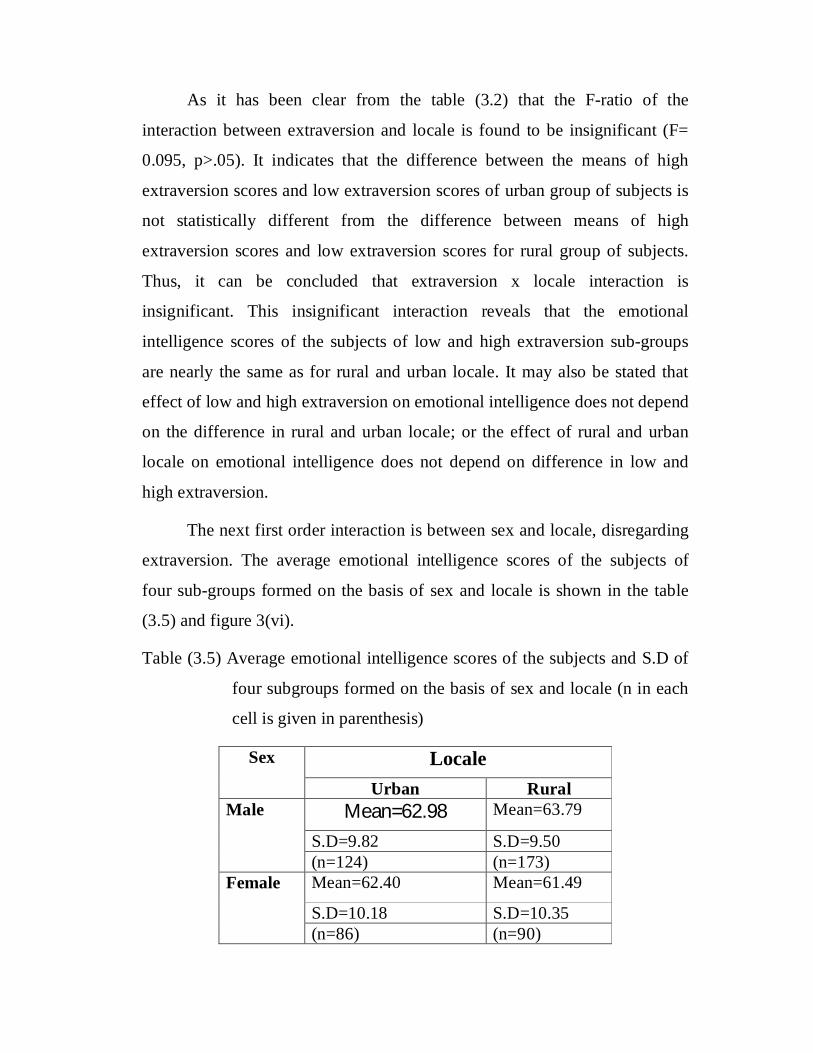
Table (3.5) Average emotional intelligence scores of the subjects and S.D of
four subgroups formed on the basis of sex and locale (n in each
cell is given in parenthesis)
Sex Locale Urban Rural
Male Mean=62.98 Mean=63.79
S.D=9.82 S.D=9.50 (n=124) (n=173)
Female Mean=62.40 Mean=61.49
S.D=10.18 S.D=10.35 (n=86) (n=90)
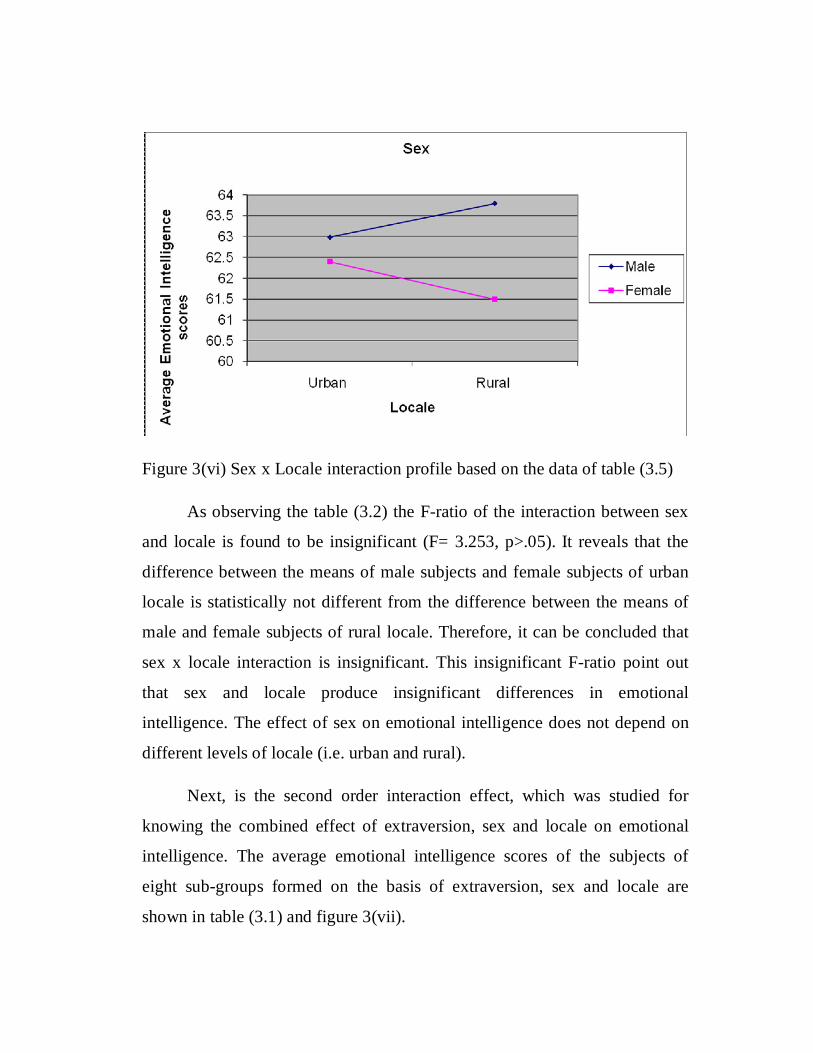
Figure 3(vi) Sex x Locale interaction profile based on the data of table (3.5)
As observing the table (3.2) the F-ratio of the interaction between sex
and locale is found to be insignificant (F= 3.253, p>.05). It reveals that the
difference between the means of male subjects and female subjects of urban
locale is statistically not different from the difference between the means of
male and female subjects of rural locale. Therefore, it can be concluded that
sex x locale interaction is insignificant. This insignificant F-ratio point out
that sex and locale produce insignificant differences in emotional
intelligence. The effect of sex on emotional intelligence does not depend on
different levels of locale (i.e. urban and rural).
Next, is the second order interaction effect, which was studied for
knowing the combined effect of extraversion, sex and locale on emotional
intelligence. The average emotional intelligence scores of the subjects of
eight sub-groups formed on the basis of extraversion, sex and locale are
shown in table (3.1) and figure 3(vii).
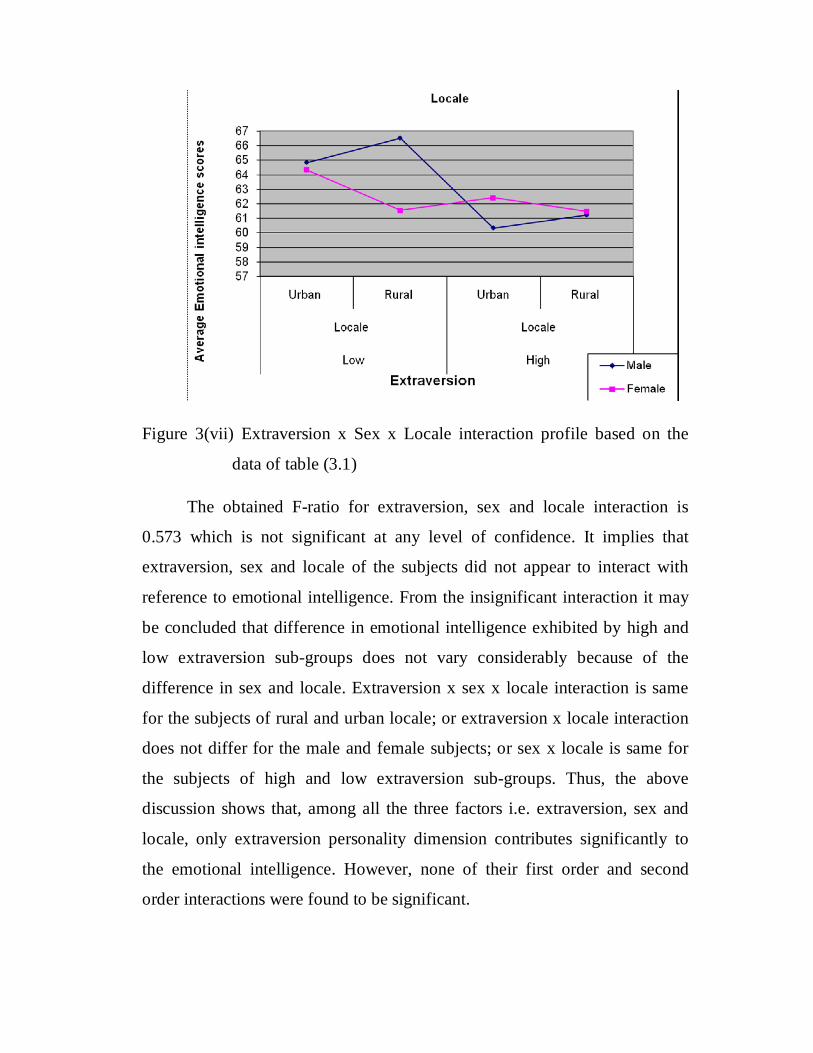
Figure 3(vii) Extraversion x Sex x Locale interaction profile based on the
data of table (3.1)
The obtained F-ratio for extraversion, sex and locale interaction is
0.573 which is not significant at any level of confidence. It implies that
extraversion, sex and locale of the subjects did not appear to interact with
reference to emotional intelligence. From the insignificant interaction it may
be concluded that difference in emotional intelligence exhibited by high and
low extraversion sub-groups does not vary considerably because of the
difference in sex and locale. Extraversion x sex x locale interaction is same
for the subjects of rural and urban locale; or extraversion x locale interaction
does not differ for the male and female subjects; or sex x locale is same for
the subjects of high and low extraversion sub-groups. Thus, the above
discussion shows that, among all the three factors i.e. extraversion, sex and
locale, only extraversion personality dimension contributes significantly to
the emotional intelligence. However, none of their first order and second
order interactions were found to be significant.
Study (4) Neuroticism and Emotional intelligence Neuroticism is the another important personality dimension that was
considered as the next independent variable to be measured in the present
research work. In order to examine the role of ‘neuroticism’ personality
dimension in predicting emotional intelligence by using 2x2x2 ANOVA,
neuroticism was considered as the first independent variable, taken into two
levels i.e. high and low. The subjects scoring low on ‘neuroticism’ were
considered as ‘emotionally stable’. The next independent variable is sex,
which was also taken at two levels (categories) i.e. male and female, and the
third independent variable is locale which is also considered with two levels
(groups) i.e. urban and rural.
The process of dividing the subjects into high and low ‘neuroticism’
groups, was the same, as applied for dividing the subjects into high’ and low’
‘aggression’ groups as mentioned previously in detail. Then a three-way
analysis of variance was computed which was expected to give an overall
estimate of the differences in emotional intelligence scores of the subject due
to neuroticism, sex and locale. The average emotional intelligence scores of
the subjects falling in different cells of ANOVA table are presented in Table
(4.1.)
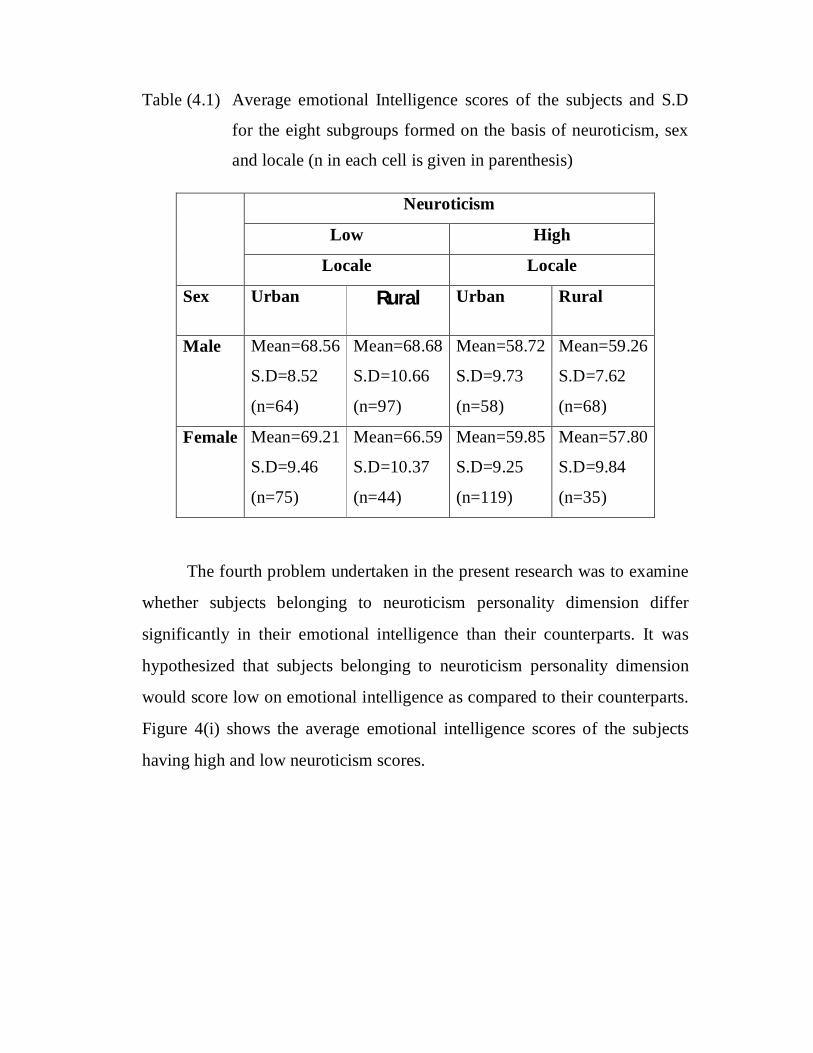
Table (4.1) Average emotional Intelligence scores of the subjects and S.D
for the eight subgroups formed on the basis of neuroticism, sex
and locale (n in each cell is given in parenthesis)
The fourth problem undertaken in the present research was to examine
whether subjects belonging to neuroticism personality dimension differ
significantly in their emotional intelligence than their counterparts. It was
hypothesized that subjects belonging to neuroticism personality dimension
would score low on emotional intelligence as compared to their counterparts.
Figure 4(i) shows the average emotional intelligence scores of the subjects
having high and low neuroticism scores.
Neuroticism
Low High
Locale Locale
Sex Urban Rural Urban Rural
Male Mean=68.56
S.D=8.52
(n=64)
Mean=68.68
S.D=10.66
(n=97)
Mean=58.72
S.D=9.73
(n=58)
Mean=59.26
S.D=7.62
(n=68)
Female Mean=69.21
S.D=9.46
(n=75)
Mean=66.59
S.D=10.37
(n=44)
Mean=59.85
S.D=9.25
(n=119)
Mean=57.80
S.D=9.84
(n=35)
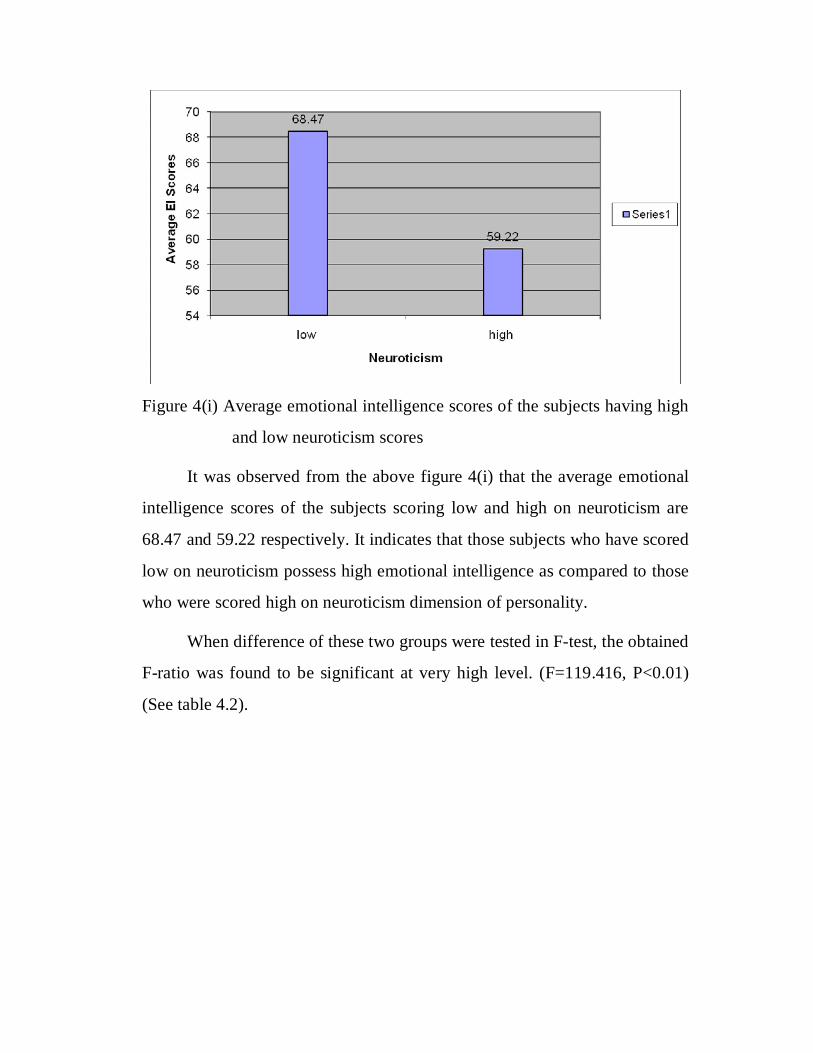
Figure 4(i) Average emotional intelligence scores of the subjects having high
and low neuroticism scores
It was observed from the above figure 4(i) that the average emotional
intelligence scores of the subjects scoring low and high on neuroticism are
68.47 and 59.22 respectively. It indicates that those subjects who have scored
low on neuroticism possess high emotional intelligence as compared to those
who were scored high on neuroticism dimension of personality.
When difference of these two groups were tested in F-test, the obtained
F-ratio was found to be significant at very high level. (F=119.416, P<0.01)
(See table 4.2).
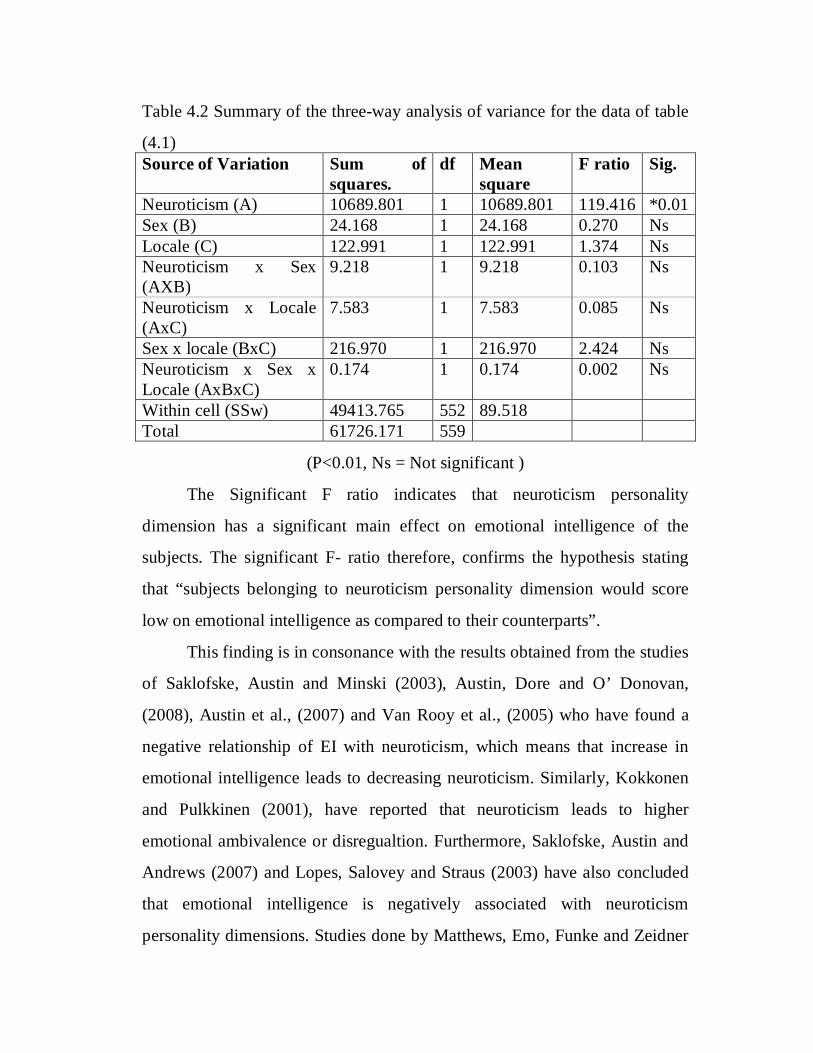
Table 4.2 Summary of the three-way analysis of variance for the data of table
(4.1) Source of Variation Sum of
squares. df Mean
square F ratio Sig.
Neuroticism (A) 10689.801 1 10689.801 119.416 *0.01 Sex (B) 24.168 1 24.168 0.270 Ns Locale (C) 122.991 1 122.991 1.374 Ns Neuroticism x Sex (AXB)
9.218 1 9.218 0.103 Ns
Neuroticism x Locale (AxC)
7.583 1 7.583 0.085 Ns
Sex x locale (BxC) 216.970 1 216.970 2.424 Ns Neuroticism x Sex x Locale (AxBxC)
0.174 1 0.174 0.002 Ns
Within cell (SSw) 49413.765 552 89.518 Total 61726.171 559
(P<0.01, Ns = Not significant )
The Significant F ratio indicates that neuroticism personality
dimension has a significant main effect on emotional intelligence of the
subjects. The significant F- ratio therefore, confirms the hypothesis stating
that “subjects belonging to neuroticism personality dimension would score
low on emotional intelligence as compared to their counterparts”.
This finding is in consonance with the results obtained from the studies
of Saklofske, Austin and Minski (2003), Austin, Dore and O’ Donovan,
(2008), Austin et al., (2007) and Van Rooy et al., (2005) who have found a
negative relationship of EI with neuroticism, which means that increase in
emotional intelligence leads to decreasing neuroticism. Similarly, Kokkonen
and Pulkkinen (2001), have reported that neuroticism leads to higher
emotional ambivalence or disregualtion. Furthermore, Saklofske, Austin and
Andrews (2007) and Lopes, Salovey and Straus (2003) have also concluded
that emotional intelligence is negatively associated with neuroticism
personality dimensions. Studies done by Matthews, Emo, Funke and Zeidner
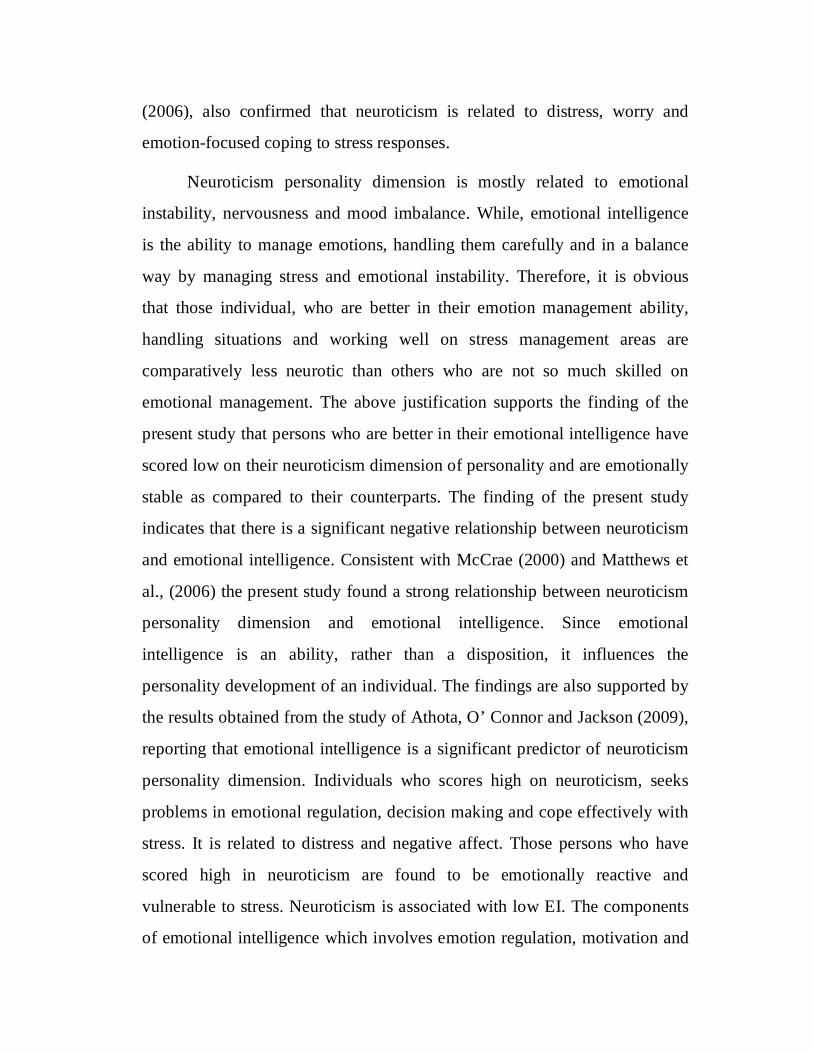
(2006), also confirmed that neuroticism is related to distress, worry and
emotion-focused coping to stress responses.
Neuroticism personality dimension is mostly related to emotional
instability, nervousness and mood imbalance. While, emotional intelligence
is the ability to manage emotions, handling them carefully and in a balance
way by managing stress and emotional instability. Therefore, it is obvious
that those individual, who are better in their emotion management ability,
handling situations and working well on stress management areas are
comparatively less neurotic than others who are not so much skilled on
emotional management. The above justification supports the finding of the
present study that persons who are better in their emotional intelligence have
scored low on their neuroticism dimension of personality and are emotionally
stable as compared to their counterparts. The finding of the present study
indicates that there is a significant negative relationship between neuroticism
and emotional intelligence. Consistent with McCrae (2000) and Matthews et
al., (2006) the present study found a strong relationship between neuroticism
personality dimension and emotional intelligence. Since emotional
intelligence is an ability, rather than a disposition, it influences the
personality development of an individual. The findings are also supported by
the results obtained from the study of Athota, O’ Connor and Jackson (2009),
reporting that emotional intelligence is a significant predictor of neuroticism
personality dimension. Individuals who scores high on neuroticism, seeks
problems in emotional regulation, decision making and cope effectively with
stress. It is related to distress and negative affect. Those persons who have
scored high in neuroticism are found to be emotionally reactive and
vulnerable to stress. Neuroticism is associated with low EI. The components
of emotional intelligence which involves emotion regulation, motivation and
interpersonal skills are appearing to have a negative relationship with
neuroticism. The above mentioned studies and their findings, thus, supports
the results of the present study that the subjects scoring low on neuroticism
possess high emotional intelligence in comparison to their counterparts.
Therefore, it is concluded that there is a significant negative relationship
between emotional intelligence and neuroticism personality dimension of the
subjects.
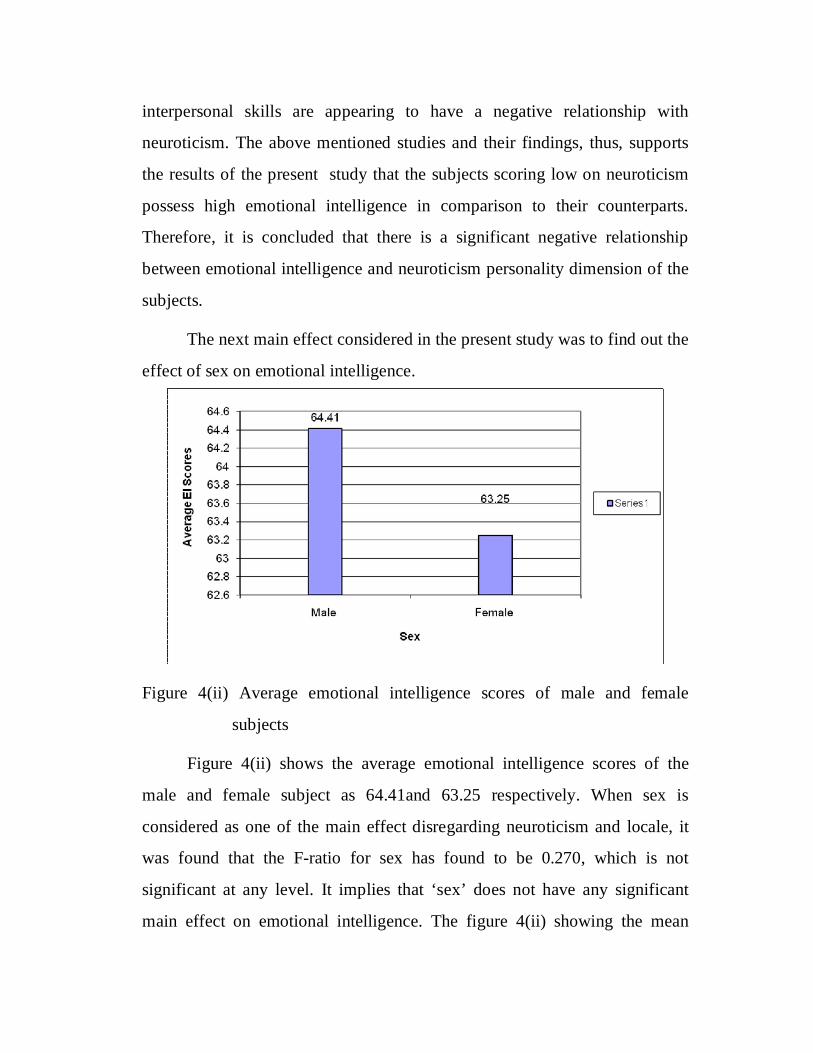
The next main effect considered in the present study was to find out the
effect of sex on emotional intelligence.
Figure 4(ii) Average emotional intelligence scores of male and female
subjects
Figure 4(ii) shows the average emotional intelligence scores of the
male and female subject as 64.41and 63.25 respectively. When sex is
considered as one of the main effect disregarding neuroticism and locale, it
was found that the F-ratio for sex has found to be 0.270, which is not
significant at any level. It implies that ‘sex’ does not have any significant
main effect on emotional intelligence. The figure 4(ii) showing the mean

difference of emotional intelligence between male and female subjects also
indicates that males possess higher emotional intelligence in comparison to
females. The obtained F- ratio which was found to be insignificant, denotes
that the hypothesis stating “male subjects would show low emotional
intelligence than their female counterparts” has been rejected in the present
study. This finding was also supported in the study (1). The similar result was
observed by various investigators (e.g.Chu 2002; Hunt and Evans, 2004;
Mishra and Ranjan, 2008; Tannous and Matar, 2010). The reasons for high
emotional intelligence for male subjects as compared to females has already
been discussed earlier in study (1).
The third main effect considered in the present study was to find out
the effect of locale on emotional intelligence.
Figure 4(iii) Average emotional intelligence scores of subjects belonging to
urban and rural locale
Figure 4(iii) presents the average emotional intelligence scores of the
subjects belonging to rural and urban locales as 64.12 and 63.63 respectively.
When locale is considered as one of the main effect, disregarding neuroticism
and sex it was found that the F-ratio for locale has been found to be 1.374
which is not significant at any level. The figure 4(iii) showing the mean
difference of emotional intelligence between urban and rural locale also
indicates that subjects belonging to rural locale are possessing high emotional
intelligence in comparison of their urban counterparts.
Therefore, the insignificant F- ratio indicates that there is not any
significant main effect of locale exists on the emotional intelligence of the
subjects. Thus, it may be concluded that the research hypothesis stating that
“subjects belonging to urban locale would show a higher level of emotional
intelligence as compared to the subjects belonging to rural locale” has been
rejected. This finding was also supported by the results obtained from the
study of Shanwal (2004) that the rural childrens have high emotional
intelligence as compared to the urban ones.
Next is the interpretation of the interaction effects of all the three
independent variables i.e. neuroticism, sex and locale on emotional
intelligence. Out of the three first order interactions, one is the interaction
between neuroticism and the sex. Table (4.3) and figure 4(iv) shows the
average emotional intelligence scores of four subgroups formed on the basis
of neuroticism and sex.
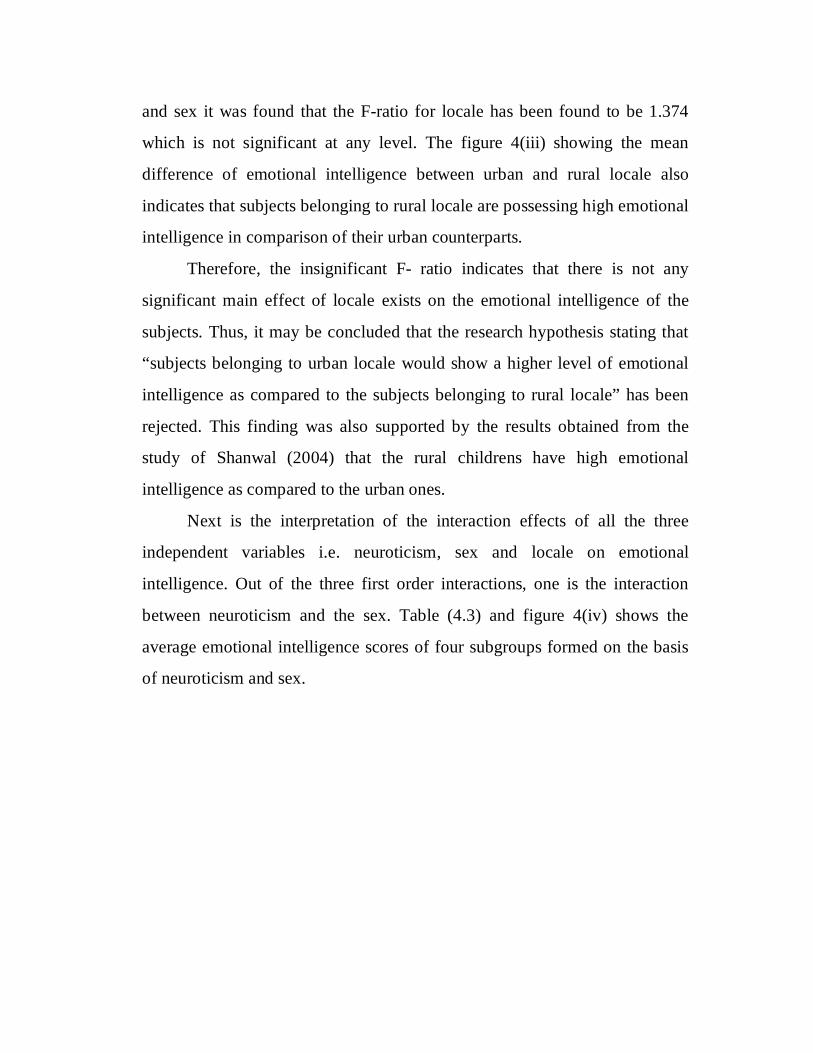
Table (4.3) Average Emotional Intelligence Scores of the subjects and S.D of
four sub-groups formed on the basis of neuroticism and sex (n in
each cell is given in parenthesis)
Sex Neuroticism
Low High
Male Mean=68.63 Mean=59.02
SD=9.84 SD=8.62
(n=161) (n=126)
Female Mean=68.24 Mean=59.38
SD=9.85 SD=9.39
(n=119) (n=154)
Figure 4(iv) Neuroticism x Sex interaction profile based on the data of table
(4.3).
Table 4.2. (Summary of ANOVA) depicts that the interaction between
neuroticism and sex is found to be significant (F=0.103, P>0.05). It implies
that the difference between the means of high neuroticism scores and low
neuroticism scores for male subjects is statistically not different from the
difference between the mean of high neuroticism scores and low neuroticism
scores for female subjects.
This insignificant interaction reveals that the emotional intelligence
scores of the male and female subjects are not dependent on difference in low
and high neuroticism. It may also be interpreted as, the emotional intelligence
scores of the subject having low and high neuroticism are not dependent on
different sex. In other words, the insignificant F- ratio proved that both the
factors i.e neuroticism and sex are independent in exerting their influences in
emotional intelligence.
Thus, it can be concluded that neuroticism x sex interaction is found to
be insignificant.
Another interaction is between neuroticism and locale. The following
table (4.4.) and figure 4(v) shows the average emotional intelligence scores of
the subjects of four sub groups on the basis of neuroticism and locale. Table (4.4) Average emotional intelligence scores of the subjects and S.D of
four sub groups on the basis of neuroticism and locale (n in each
cell is given in parenthesis)
Neuroticism
Locale Low High
Urban Mean=68.91 Mean=59.48
SD=9.02 SD=9.40
(n=139) (n=177
Rural Mean=68.03 Mean=58.77
SD=10.58 SD=8.42
(n=141 (n=103
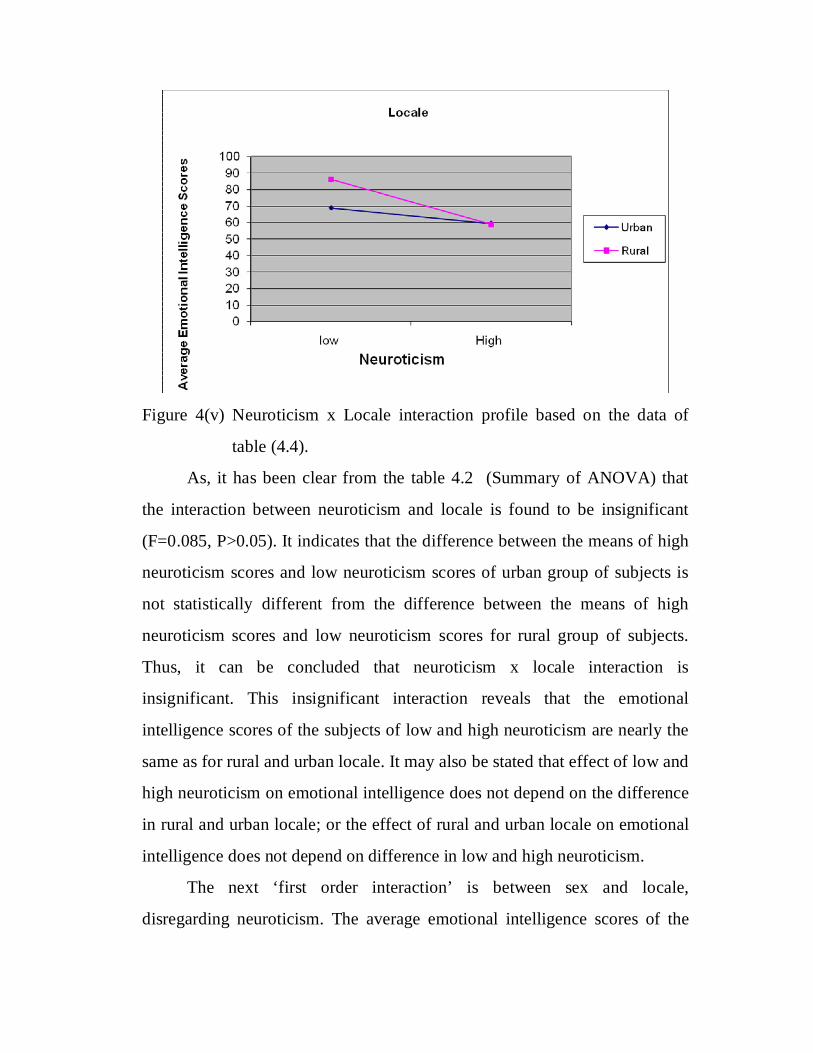
Figure 4(v) Neuroticism x Locale interaction profile based on the data of
table (4.4).
As, it has been clear from the table 4.2 (Summary of ANOVA) that
the interaction between neuroticism and locale is found to be insignificant
(F=0.085, P>0.05). It indicates that the difference between the means of high
neuroticism scores and low neuroticism scores of urban group of subjects is
not statistically different from the difference between the means of high
neuroticism scores and low neuroticism scores for rural group of subjects.
Thus, it can be concluded that neuroticism x locale interaction is
insignificant. This insignificant interaction reveals that the emotional
intelligence scores of the subjects of low and high neuroticism are nearly the
same as for rural and urban locale. It may also be stated that effect of low and
high neuroticism on emotional intelligence does not depend on the difference
in rural and urban locale; or the effect of rural and urban locale on emotional
intelligence does not depend on difference in low and high neuroticism.
The next ‘first order interaction’ is between sex and locale,
disregarding neuroticism. The average emotional intelligence scores of the
subjects of four subgroups formed on the basis of sex and locale is presented
in the following table (4.5) and figure 4(vi).
Table (4.5) Average emotional intelligence scores of the subjects and S.D of
four sub groups formed on the basis of sex and locale (n in each
cell is given in parenthesis )
Sex Locale
Urban Rural
Male Mean=63.89 Mean=64.80
SD=10.33 SD=10.58
(n=122) (n=165)
Female Mean=63.47 Mean=62.70
SD=10.37 SD=10.99
(n=194) (n=79)
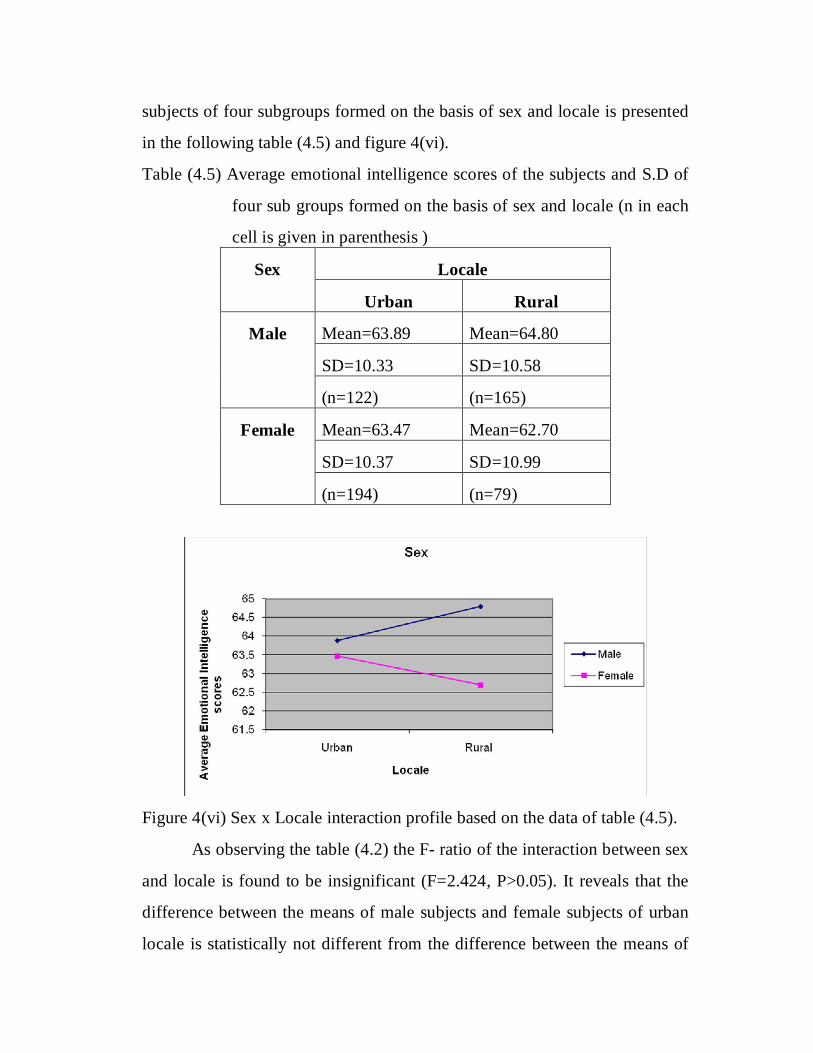
Figure 4(vi) Sex x Locale interaction profile based on the data of table (4.5).
As observing the table (4.2) the F- ratio of the interaction between sex
and locale is found to be insignificant (F=2.424, P>0.05). It reveals that the
difference between the means of male subjects and female subjects of urban
locale is statistically not different from the difference between the means of
male and Female Subjects of rural locale. Therefore, it can be concluded that
sex x locale interaction is insignificant. This insignificant F-ratio points out
that sex and locale produce insignificant differences in emotional
intelligence. Furthermore, the effect of sex on emotional intelligence does not
depend on different levels of locale i.e. rural and urban.
Next, is the second order interaction effect which was studied for
knowing the combined effect of neuroticism, sex and locale on emotional
intelligence. The average emotional intelligence scores of the subjects of
eight subgroups formed on the basis of neuroticism, sex and locale are shown
in table (4.1) and figure 4(vii)
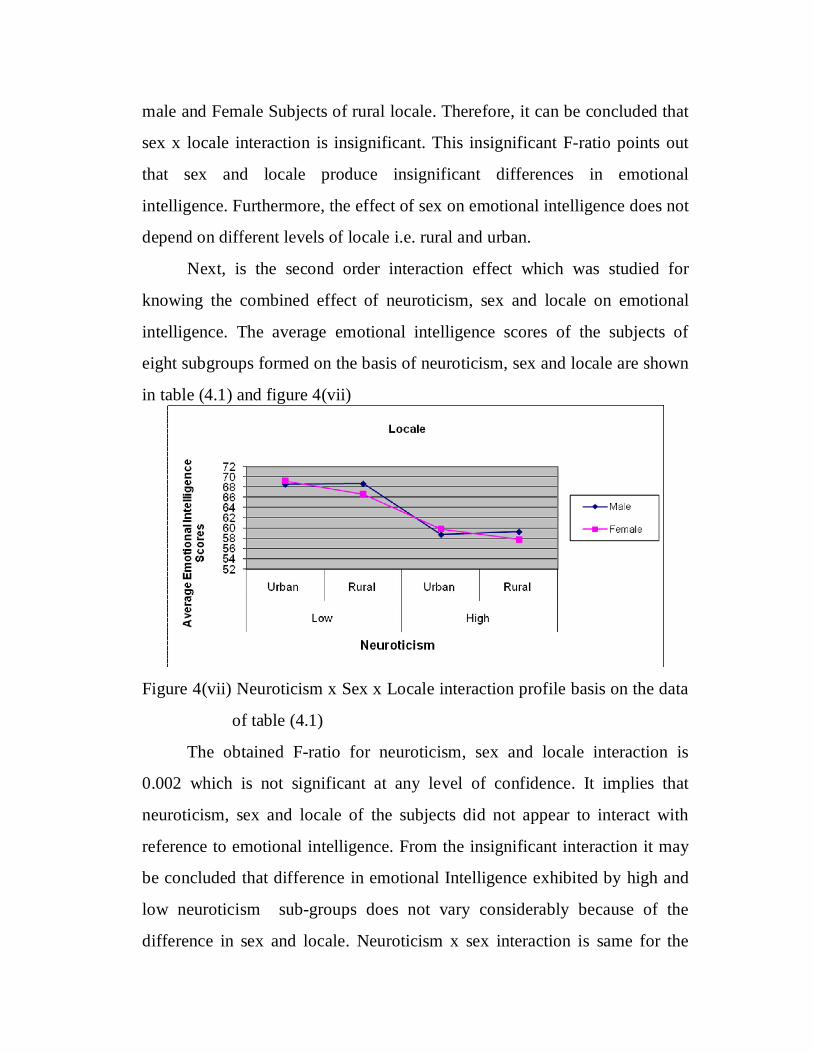
Figure 4(vii) Neuroticism x Sex x Locale interaction profile basis on the data
of table (4.1)
The obtained F-ratio for neuroticism, sex and locale interaction is
0.002 which is not significant at any level of confidence. It implies that
neuroticism, sex and locale of the subjects did not appear to interact with
reference to emotional intelligence. From the insignificant interaction it may
be concluded that difference in emotional Intelligence exhibited by high and
low neuroticism sub-groups does not vary considerably because of the
difference in sex and locale. Neuroticism x sex interaction is same for the
subjects of rural and urban locale; or neuroticism x locale interaction does not
differ for the male and female subjects; or sex x locale interaction is same for
the subjects of high and low neuroticism sub groups. Thus, the above
discussion shows that, among all the three factors i.e. neuroticism, sex and
locale, only neuroticism personality dimension contributes significantly to the
emotional intelligence. However, none of their first order and second order
interactions were found to be significant.
Study (5) Home Environment and Emotional Intelligence With an attempt to examine the role of home environment in predicting
emotional intelligence ANOVA statistic was used. For this purpose home
environment was considered as the first independent variable, taken in two
levels i.e. favourable and unfavourable.
Subjects having low scores on home environment inventory were
denoted to have unfavourable home environment, while subjects scoring high
on home environment inventory were denoted to have a favourable home
environment. Sex and locale were considered as the other two independent
variables with two levels each i.e. male and female (for sex) and urban and
rural (for locale). For dividing the subjects into favourable and unfavourable
home, environment groups, the same process was applied as mentioned
earlier in the interpretation section of aggression and emotional intelligence.
In this way, the subjects were divided into various sub groups as per
the requirements of 2x2x2 ANOVA formed on the basis of home
environment, sex and locale. The average emotional intelligence scores of the
subjects falling in difference cells of ANOVA table are presented in table 5.1.
Table (5.1) Average emotional intelligence scores of the subjects and S.D for
the eight subgroups formed on the basis of home environment, sex
and locale (n in each cell is given in parenthesis )
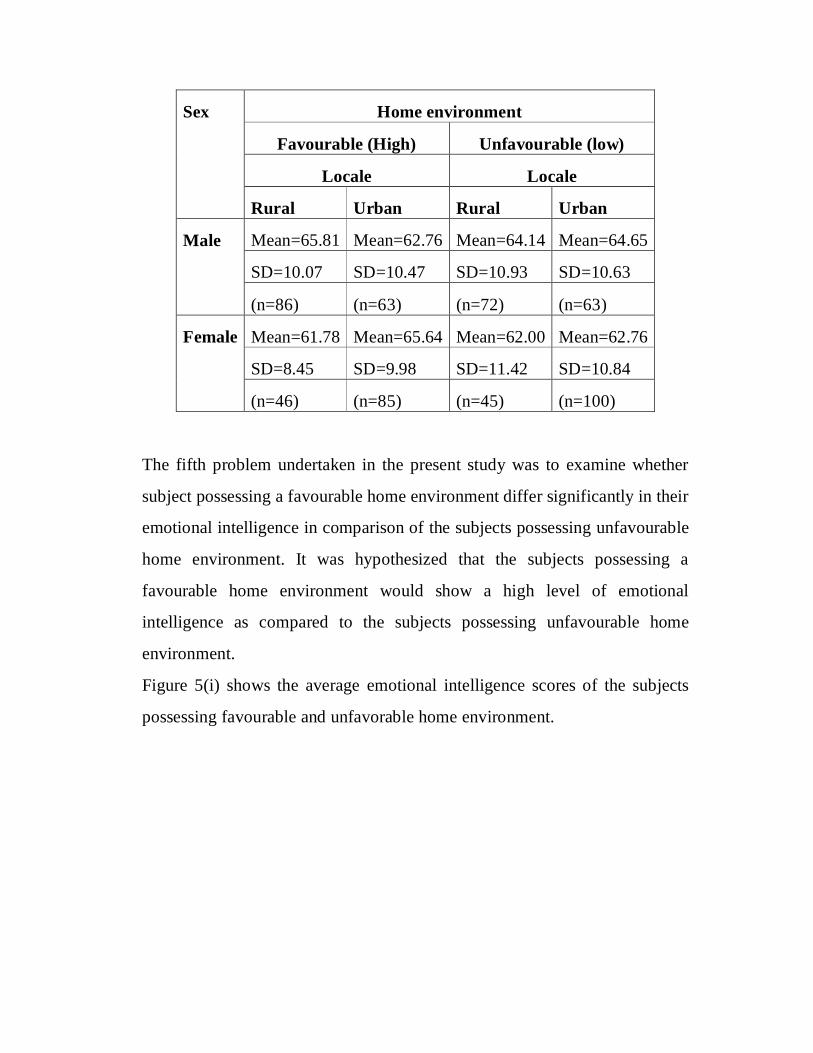
Sex Home environment
Favourable (High) Unfavourable (low)
Locale Locale
Rural Urban Rural Urban
Male Mean=65.81 Mean=62.76 Mean=64.14 Mean=64.65
SD=10.07 SD=10.47 SD=10.93 SD=10.63
(n=86) (n=63) (n=72) (n=63)
Female Mean=61.78 Mean=65.64 Mean=62.00 Mean=62.76
SD=8.45 SD=9.98 SD=11.42 SD=10.84
(n=46) (n=85) (n=45) (n=100)
The fifth problem undertaken in the present study was to examine whether
subject possessing a favourable home environment differ significantly in their
emotional intelligence in comparison of the subjects possessing unfavourable
home environment. It was hypothesized that the subjects possessing a
favourable home environment would show a high level of emotional
intelligence as compared to the subjects possessing unfavourable home
environment.
Figure 5(i) shows the average emotional intelligence scores of the subjects
possessing favourable and unfavorable home environment.
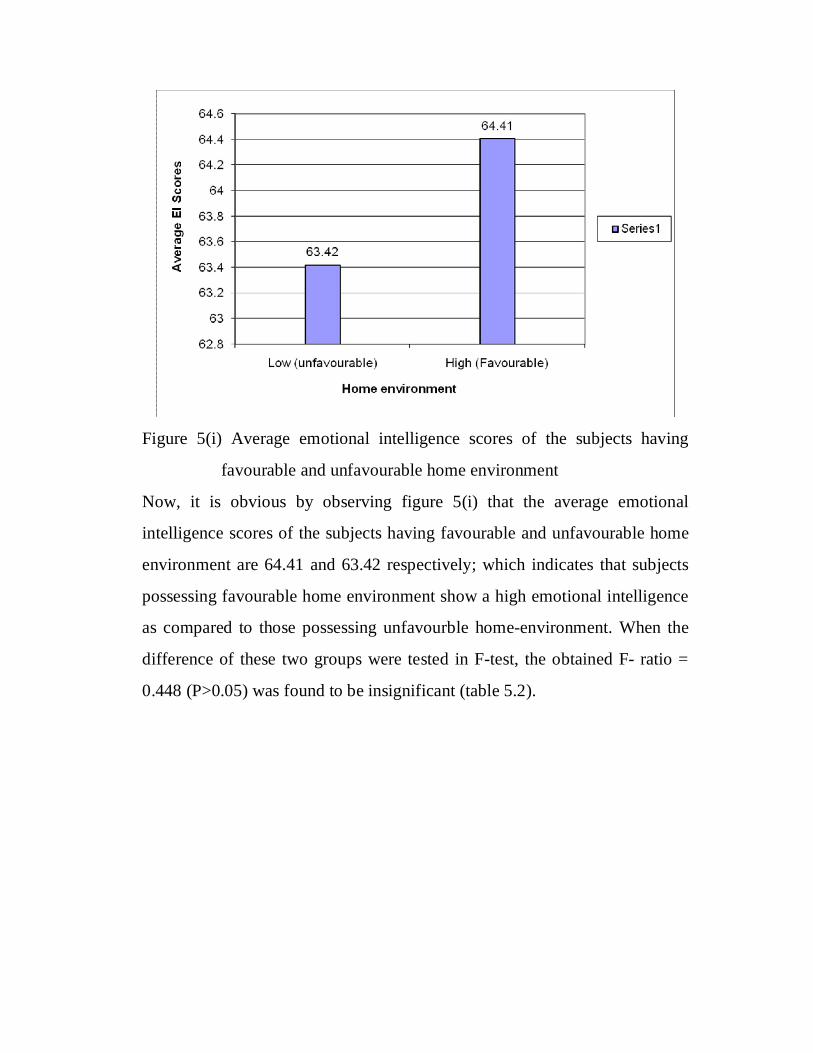
Figure 5(i) Average emotional intelligence scores of the subjects having
favourable and unfavourable home environment
Now, it is obvious by observing figure 5(i) that the average emotional
intelligence scores of the subjects having favourable and unfavourable home
environment are 64.41 and 63.42 respectively; which indicates that subjects
possessing favourable home environment show a high emotional intelligence
as compared to those possessing unfavourble home-environment. When the
difference of these two groups were tested in F-test, the obtained F- ratio =
0.448 (P>0.05) was found to be insignificant (table 5.2).
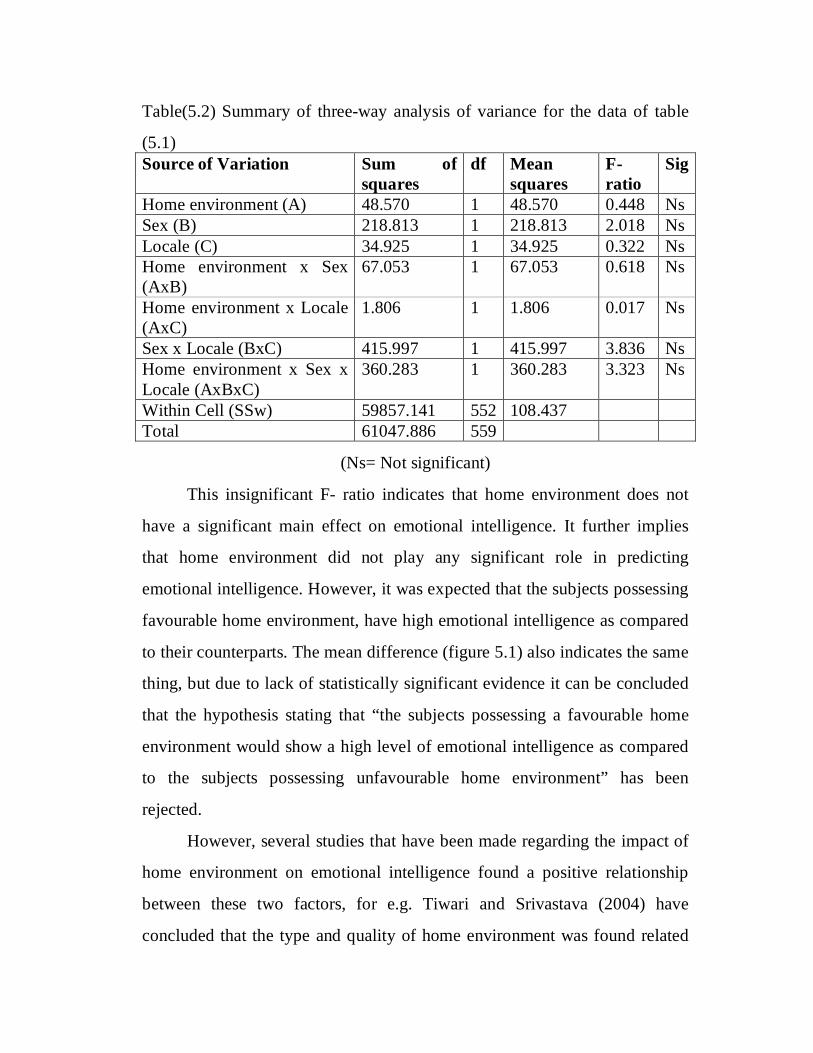
Table(5.2) Summary of three-way analysis of variance for the data of table
(5.1) Source of Variation Sum of
squares df Mean
squares F-ratio
Sig
Home environment (A) 48.570 1 48.570 0.448 Ns Sex (B) 218.813 1 218.813 2.018 Ns Locale (C) 34.925 1 34.925 0.322 Ns Home environment x Sex (AxB)
67.053 1 67.053 0.618 Ns
Home environment x Locale (AxC)
1.806 1 1.806 0.017 Ns
Sex x Locale (BxC) 415.997 1 415.997 3.836 Ns Home environment x Sex x Locale (AxBxC)
360.283 1 360.283 3.323 Ns
Within Cell (SSw) 59857.141 552 108.437 Total 61047.886 559
(Ns= Not significant)
This insignificant F- ratio indicates that home environment does not
have a significant main effect on emotional intelligence. It further implies
that home environment did not play any significant role in predicting
emotional intelligence. However, it was expected that the subjects possessing
favourable home environment, have high emotional intelligence as compared
to their counterparts. The mean difference (figure 5.1) also indicates the same
thing, but due to lack of statistically significant evidence it can be concluded
that the hypothesis stating that “the subjects possessing a favourable home
environment would show a high level of emotional intelligence as compared
to the subjects possessing unfavourable home environment” has been
rejected.
However, several studies that have been made regarding the impact of
home environment on emotional intelligence found a positive relationship
between these two factors, for e.g. Tiwari and Srivastava (2004) have
concluded that the type and quality of home environment was found related
to the development of emotional intelligence. Further, Uma Devi, and Rayal
(2004) concluded that adolescent’s perception about family environment is
positively and significantly related to total emotional intelligence and also to
the interpersonal and stress management components of emotional
intelligence. Adolescents who perceived that their families were cohesive,
show acceptance and caring, are organized and mange stress effectively. In
this connection, study done by Varshney (2007) also implies that higher
parental encouragement is associated with good emotional intelligence.
Similarly, Duhan and Chhikara (2007) inferred that more suitable the
parenting style, better will be the emotional intelligence skills. Results
revealed by the study of Sethi and Ajawani (2008) have also found a
significant positive relationships between emotional intelligence and parent-
child relationship. Conducive home environment with secure feeling give rise
to emotionally intelligent individuals (Mohanty and Devi L., 2010) Now, as
we consider the present study, the average emotional intelligence scores of
the subjects having favourable home environment is found to be higher
(64.41) than that of those having unfavourable home environment (63.42).
This higher mean score of EI show that affectionate, caring, liberal and
considerate home environment leads to increase in emotional intelligence of
the subjects. This finding is in consonance with the above cited studies. But it
is a matter of fact that this finding is statistically insignificant. That means the
difference between the means of the two groups is statistically not significant.
Therefore, it can be concluded for the present study that, there is found an
insignificant relationship between home environment of the individuals and
their emotional intelligence.
To justify this finding, it may be stated that the individuals who are
lacking a favourable home environment, mostly face problems in emotion

regulation and emotional management. Authoritative parenting style,
punishments and parental discouragement exerts an adverse effect on the
children on an emotional ground which results in lack of confidence,
pessimistic nature, development of inferiority complex and many other
behavioral problems. Besides this, a favourable home environment is
necessary for the overall personality development of an individual, including
the development of various emotional processes. Young adults face a number
of challenges at home. In order to be independent emotionally and to have
feeling of understanding, affection, and respect at the same time is a great
challenge for them. As studies revealed that a healthy emotional climate
makes a child relaxed, cooperative, happy, motivated to study, and
disciplined behavior. An unhealthy emotional climate makes the child tense,
nervous, irritate, disinterested in studies, and prone to troublesome behavior
(Hurlock, 1942). Due to poor home conditions, conflicting parental
relationships and unfavorable parental attitudes, children are not able to fulfill
their basic needs and desires, and they become tensed, frustrated and
emotionally unstable. Children’s emotionality and regulation of emotion were
related to the quality of parent child relationships; but the development of
emotional intelligence skills is very much dependent upon various other
factors apart from the home environment, that can influence an individual on
several behavioural and emotional level. The home environment definitely
exerts a significant impact on the individual’s over all well being regarding
several psychological aspects like, learning process, affiliation and security
needs, relationship management and emotional development. A favourable
home environment can provides an individual, the basics of emotional
intelligence by giving emotional stability to them but the emotional
intelligence skills flourishes mostly outside the home with other peoples apart
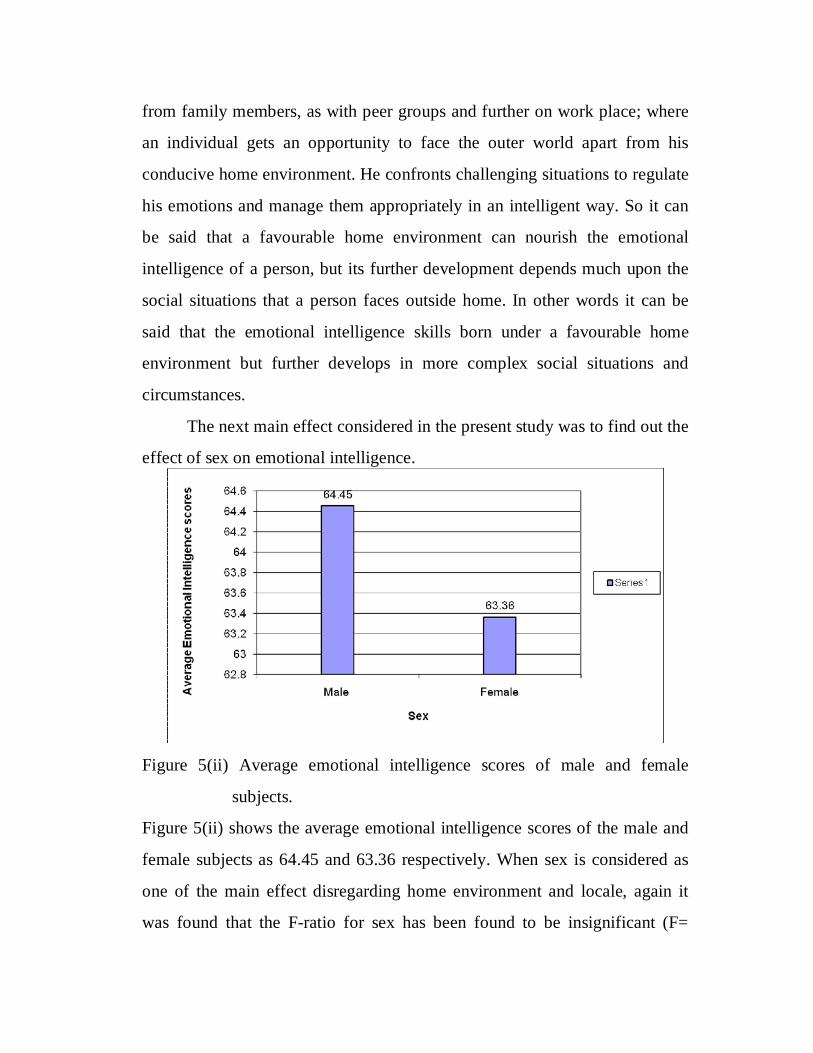
from family members, as with peer groups and further on work place; where
an individual gets an opportunity to face the outer world apart from his
conducive home environment. He confronts challenging situations to regulate
his emotions and manage them appropriately in an intelligent way. So it can
be said that a favourable home environment can nourish the emotional
intelligence of a person, but its further development depends much upon the
social situations that a person faces outside home. In other words it can be
said that the emotional intelligence skills born under a favourable home
environment but further develops in more complex social situations and
circumstances.
The next main effect considered in the present study was to find out the
effect of sex on emotional intelligence.
Figure 5(ii) Average emotional intelligence scores of male and female
subjects.
Figure 5(ii) shows the average emotional intelligence scores of the male and
female subjects as 64.45 and 63.36 respectively. When sex is considered as
one of the main effect disregarding home environment and locale, again it
was found that the F-ratio for sex has been found to be insignificant (F=
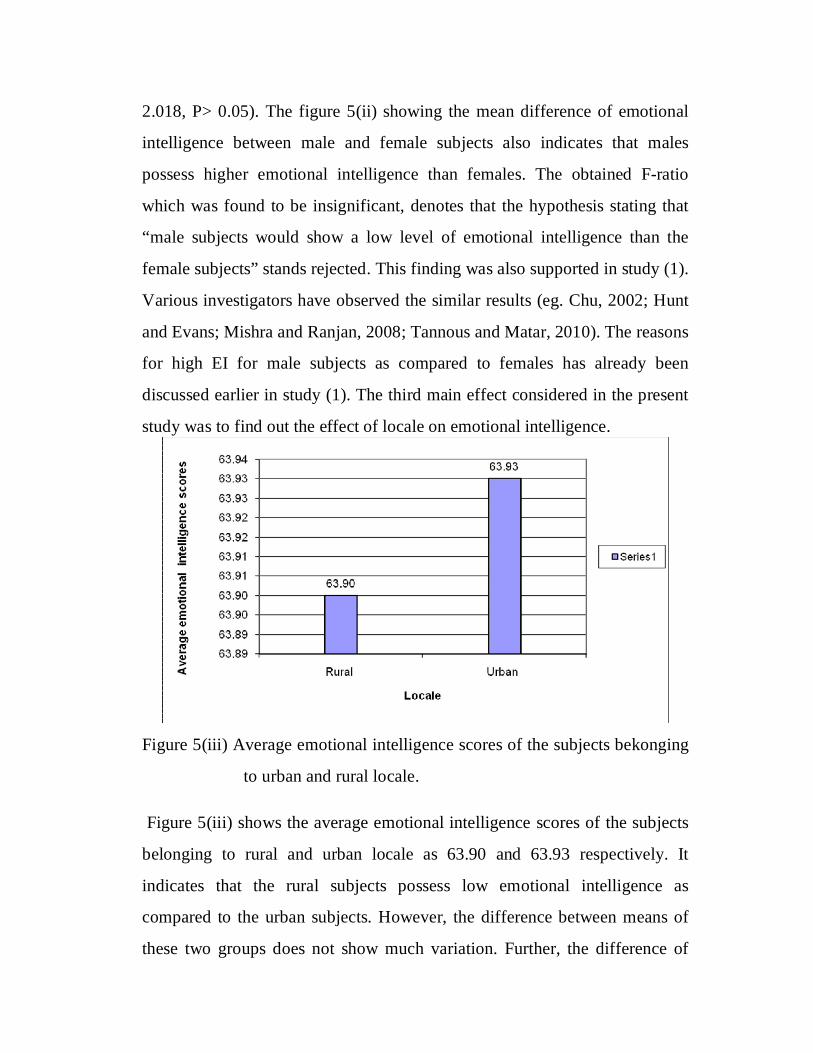
2.018, P> 0.05). The figure 5(ii) showing the mean difference of emotional
intelligence between male and female subjects also indicates that males
possess higher emotional intelligence than females. The obtained F-ratio
which was found to be insignificant, denotes that the hypothesis stating that
“male subjects would show a low level of emotional intelligence than the
female subjects” stands rejected. This finding was also supported in study (1).
Various investigators have observed the similar results (eg. Chu, 2002; Hunt
and Evans; Mishra and Ranjan, 2008; Tannous and Matar, 2010). The reasons
for high EI for male subjects as compared to females has already been
discussed earlier in study (1). The third main effect considered in the present
study was to find out the effect of locale on emotional intelligence.
Figure 5(iii) Average emotional intelligence scores of the subjects bekonging
to urban and rural locale.
Figure 5(iii) shows the average emotional intelligence scores of the subjects
belonging to rural and urban locale as 63.90 and 63.93 respectively. It
indicates that the rural subjects possess low emotional intelligence as
compared to the urban subjects. However, the difference between means of
these two groups does not show much variation. Further, the difference of
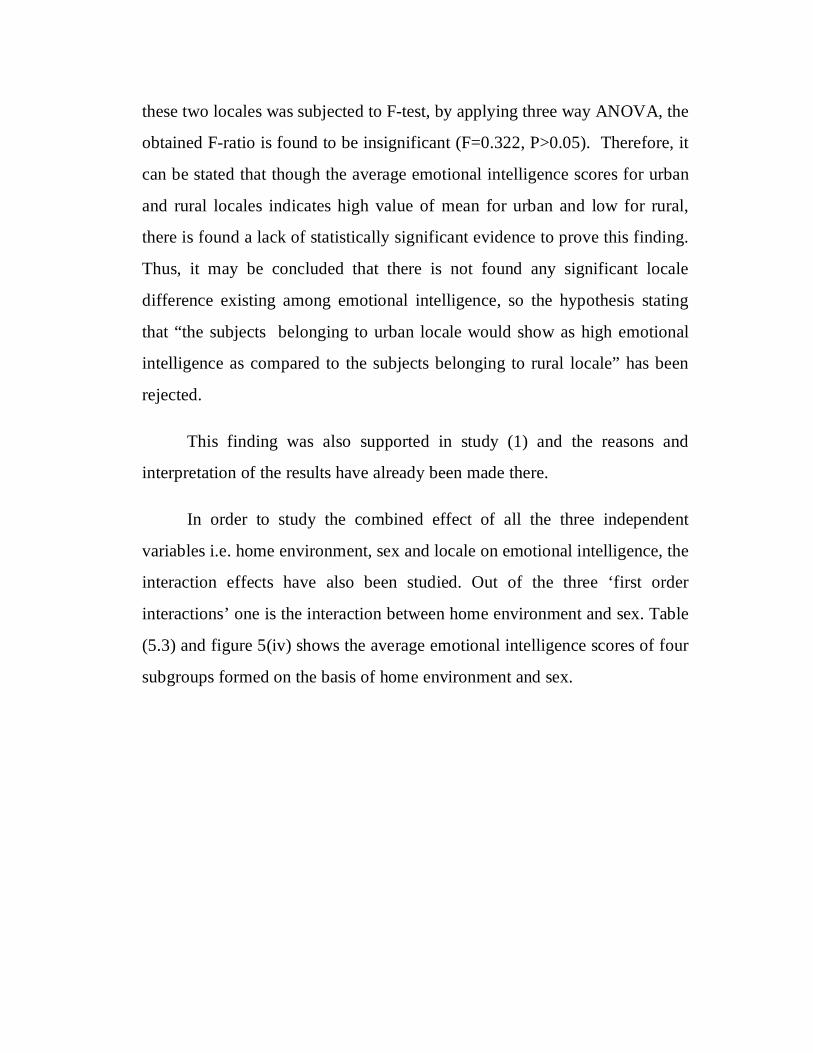
these two locales was subjected to F-test, by applying three way ANOVA, the
obtained F-ratio is found to be insignificant (F=0.322, P>0.05). Therefore, it
can be stated that though the average emotional intelligence scores for urban
and rural locales indicates high value of mean for urban and low for rural,
there is found a lack of statistically significant evidence to prove this finding.
Thus, it may be concluded that there is not found any significant locale
difference existing among emotional intelligence, so the hypothesis stating
that “the subjects belonging to urban locale would show as high emotional
intelligence as compared to the subjects belonging to rural locale” has been
rejected.
This finding was also supported in study (1) and the reasons and
interpretation of the results have already been made there.
In order to study the combined effect of all the three independent
variables i.e. home environment, sex and locale on emotional intelligence, the
interaction effects have also been studied. Out of the three ‘first order
interactions’ one is the interaction between home environment and sex. Table
(5.3) and figure 5(iv) shows the average emotional intelligence scores of four
subgroups formed on the basis of home environment and sex.
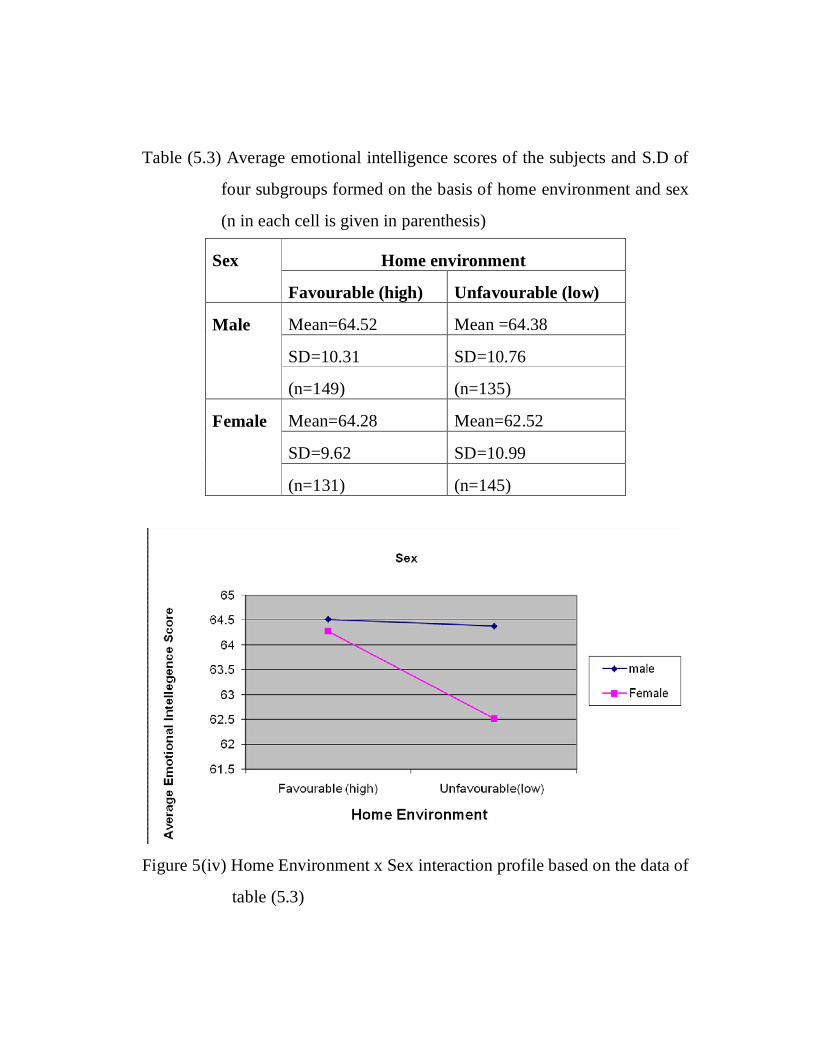
Table (5.3) Average emotional intelligence scores of the subjects and S.D of
four subgroups formed on the basis of home environment and sex
(n in each cell is given in parenthesis)
Sex Home environment
Favourable (high) Unfavourable (low)
Male Mean=64.52 Mean =64.38
SD=10.31 SD=10.76
(n=149) (n=135)
Female Mean=64.28 Mean=62.52
SD=9.62 SD=10.99
(n=131) (n=145)
Figure 5(iv) Home Environment x Sex interaction profile based on the data of
table (5.3)
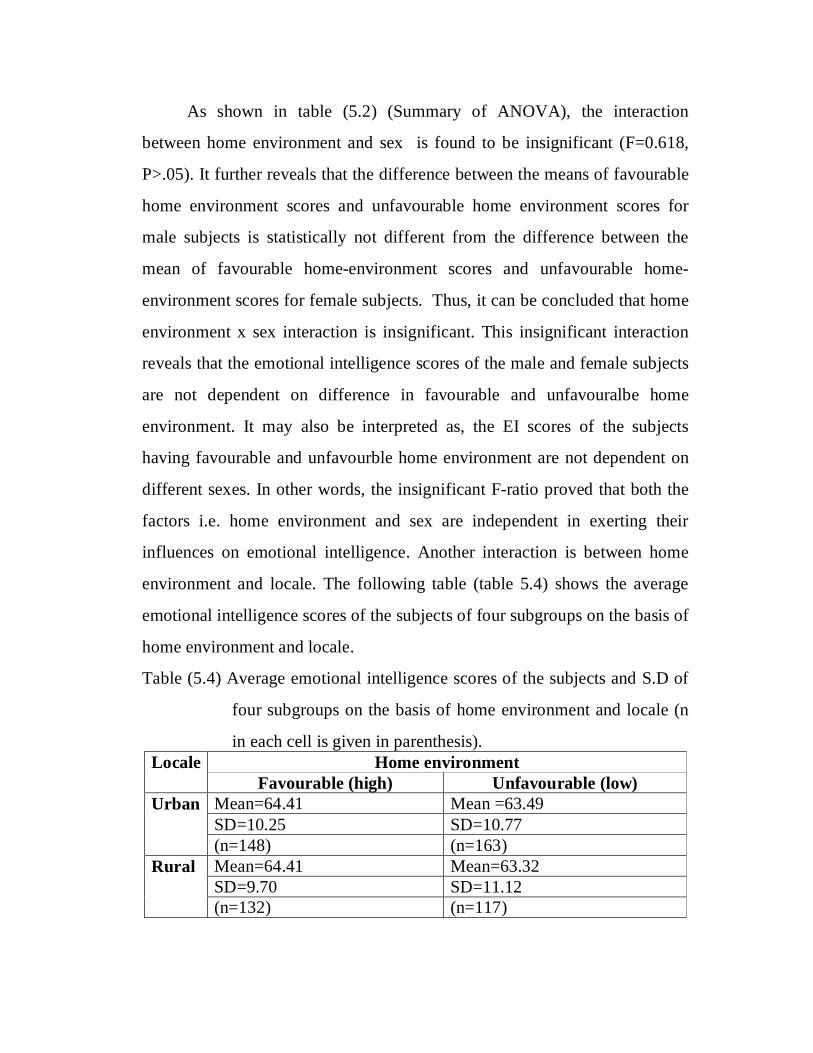
As shown in table (5.2) (Summary of ANOVA), the interaction
between home environment and sex is found to be insignificant (F=0.618,
P>.05). It further reveals that the difference between the means of favourable
home environment scores and unfavourable home environment scores for
male subjects is statistically not different from the difference between the
mean of favourable home-environment scores and unfavourable home-
environment scores for female subjects. Thus, it can be concluded that home
environment x sex interaction is insignificant. This insignificant interaction
reveals that the emotional intelligence scores of the male and female subjects
are not dependent on difference in favourable and unfavouralbe home
environment. It may also be interpreted as, the EI scores of the subjects
having favourable and unfavourble home environment are not dependent on
different sexes. In other words, the insignificant F-ratio proved that both the
factors i.e. home environment and sex are independent in exerting their
influences on emotional intelligence. Another interaction is between home
environment and locale. The following table (table 5.4) shows the average
emotional intelligence scores of the subjects of four subgroups on the basis of
home environment and locale.
Table (5.4) Average emotional intelligence scores of the subjects and S.D of
four subgroups on the basis of home environment and locale (n
in each cell is given in parenthesis). Locale Home environment
Favourable (high) Unfavourable (low) Urban Mean=64.41 Mean =63.49
SD=10.25 SD=10.77 (n=148) (n=163)
Rural Mean=64.41 Mean=63.32 SD=9.70 SD=11.12 (n=132) (n=117)
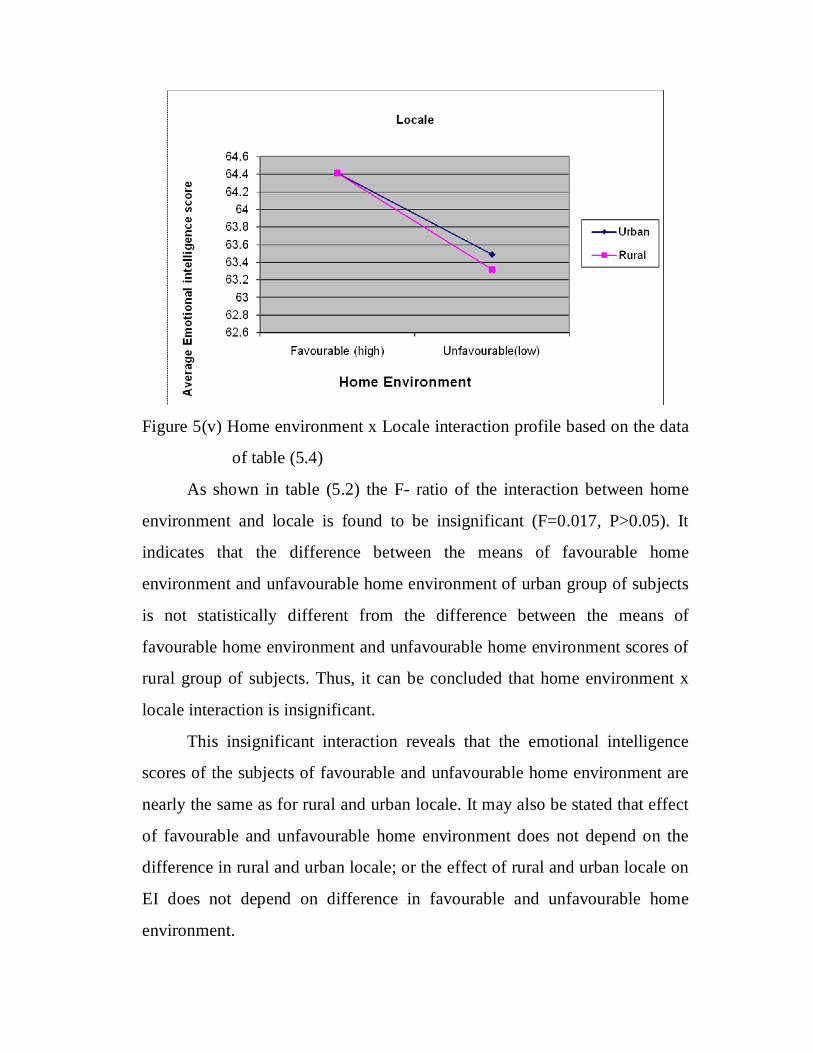
Figure 5(v) Home environment x Locale interaction profile based on the data
of table (5.4)
As shown in table (5.2) the F- ratio of the interaction between home
environment and locale is found to be insignificant (F=0.017, P>0.05). It
indicates that the difference between the means of favourable home
environment and unfavourable home environment of urban group of subjects
is not statistically different from the difference between the means of
favourable home environment and unfavourable home environment scores of
rural group of subjects. Thus, it can be concluded that home environment x
locale interaction is insignificant.
This insignificant interaction reveals that the emotional intelligence
scores of the subjects of favourable and unfavourable home environment are
nearly the same as for rural and urban locale. It may also be stated that effect
of favourable and unfavourable home environment does not depend on the
difference in rural and urban locale; or the effect of rural and urban locale on
EI does not depend on difference in favourable and unfavourable home
environment.
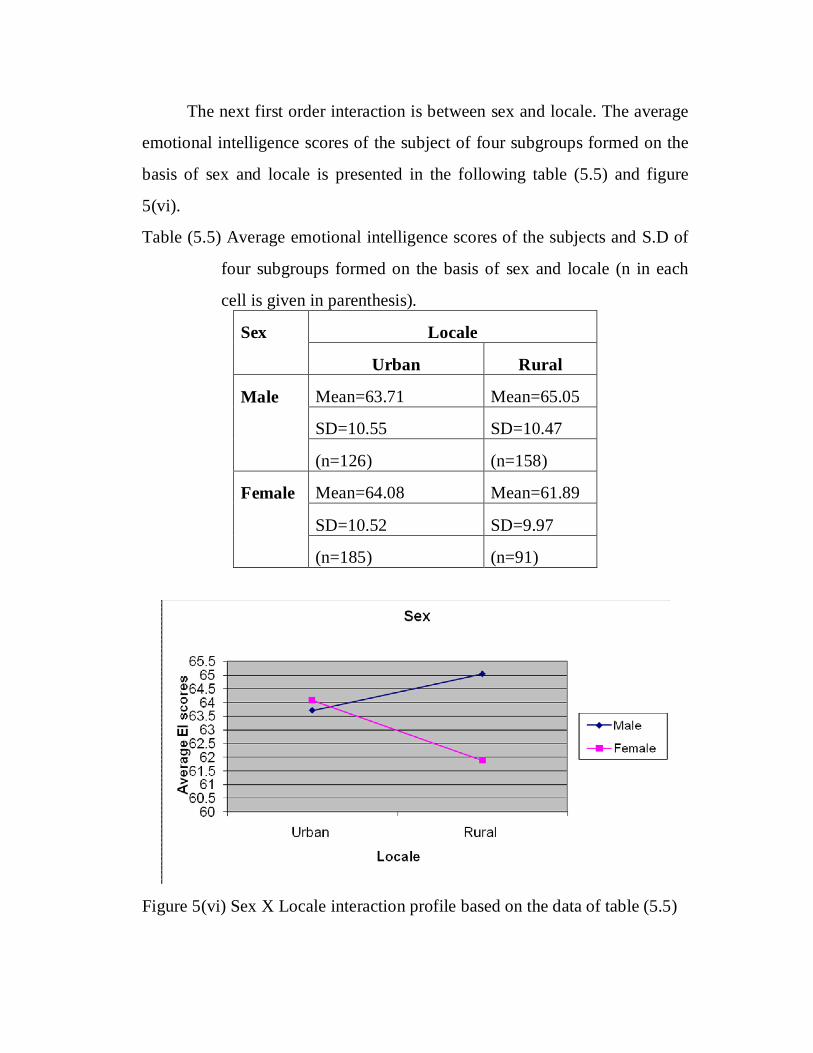
The next first order interaction is between sex and locale. The average
emotional intelligence scores of the subject of four subgroups formed on the
basis of sex and locale is presented in the following table (5.5) and figure
5(vi).
Table (5.5) Average emotional intelligence scores of the subjects and S.D of
four subgroups formed on the basis of sex and locale (n in each
cell is given in parenthesis).
Sex Locale
Urban Rural
Male Mean=63.71 Mean=65.05
SD=10.55 SD=10.47
(n=126) (n=158)
Female Mean=64.08 Mean=61.89
SD=10.52 SD=9.97
(n=185) (n=91)
Figure 5(vi) Sex X Locale interaction profile based on the data of table (5.5)
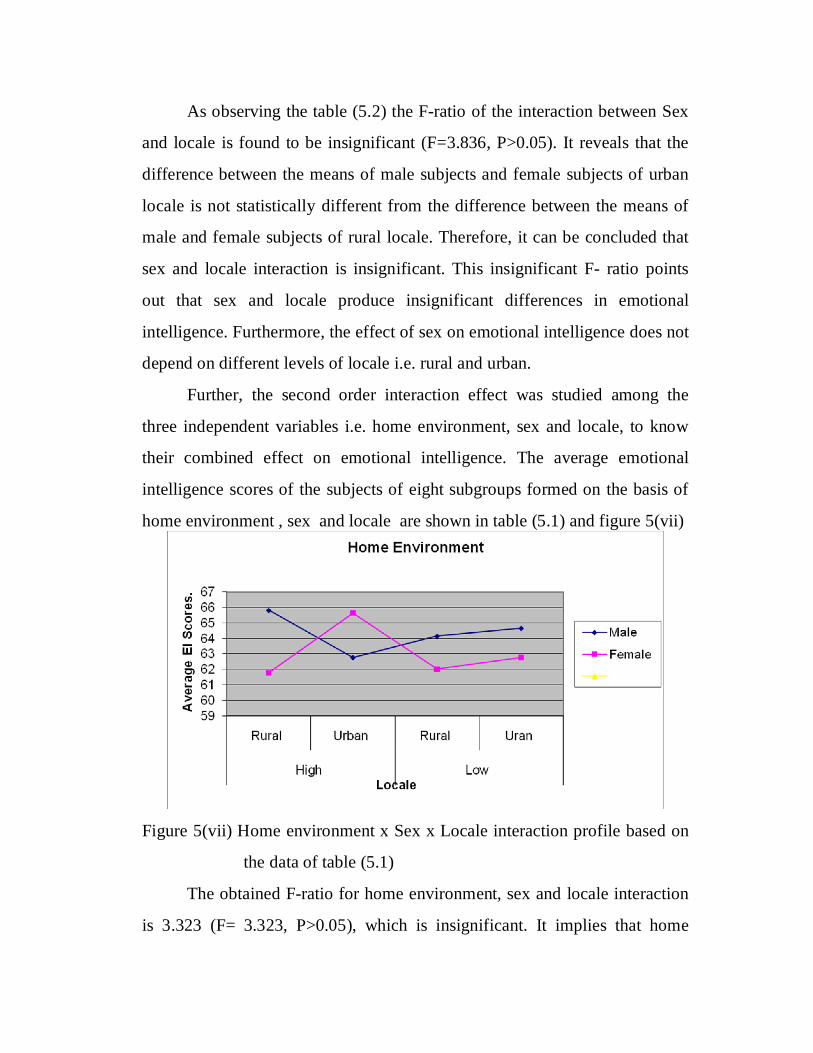
As observing the table (5.2) the F-ratio of the interaction between Sex
and locale is found to be insignificant (F=3.836, P>0.05). It reveals that the
difference between the means of male subjects and female subjects of urban
locale is not statistically different from the difference between the means of
male and female subjects of rural locale. Therefore, it can be concluded that
sex and locale interaction is insignificant. This insignificant F- ratio points
out that sex and locale produce insignificant differences in emotional
intelligence. Furthermore, the effect of sex on emotional intelligence does not
depend on different levels of locale i.e. rural and urban.
Further, the second order interaction effect was studied among the
three independent variables i.e. home environment, sex and locale, to know
their combined effect on emotional intelligence. The average emotional
intelligence scores of the subjects of eight subgroups formed on the basis of
home environment , sex and locale are shown in table (5.1) and figure 5(vii)
Figure 5(vii) Home environment x Sex x Locale interaction profile based on
the data of table (5.1)
The obtained F-ratio for home environment, sex and locale interaction
is 3.323 (F= 3.323, P>0.05), which is insignificant. It implies that home
environment, sex and locale of the subject did not appear to interact with
reference to emotional intelligence.
From the insignificant interaction it may be concluded that difference
in emotional intelligence exhibited by subjects having favorable and
unfavorable home environment does not vary considerably because of the
difference in sex and locale. Furthermore, home environment x sex
interaction is same for the rural and urban locale subject, or home
environment x locale interaction does not differ for the male and female
subjects; or sex or locale interaction is same for the subjects of favorable and
unfavorable home environment sub groups.
Thus, the above discussion shows that, all the three factors i.e. home
environment, sex and locale, does not have any significant main effect
interaction effects on emotional intelligence. Study (6) Social Support and Emotional Intelligence
The next variable to be measured with reference to emotional
intelligence, in the present study is social support. In order to examine the
role of social support in predicting emotional intelligence by using three-way
ANOVA statistic, social support was considered as the first independent
variable taken into two levels i.e. high and low. The next independent
variable is sex, also taken at two levels (categories) i.e. male and female, and
the third independent variable is locale, which is also considered with two
levels (groups) i.e. urban and rural. For dividing the subjects into high and
low social support groups the same process was applied as mentioned earlier
in the interpretation section of aggression and emotional intelligence. In this
way the subjects were divided into various sub-groups as per the
requirements of 2x2x2 ANOVA formed on the basis of social support, sex
and locale. Then a three-way analysis of variance was computed, which was
expected to give an overall estimate of the differences in emotional
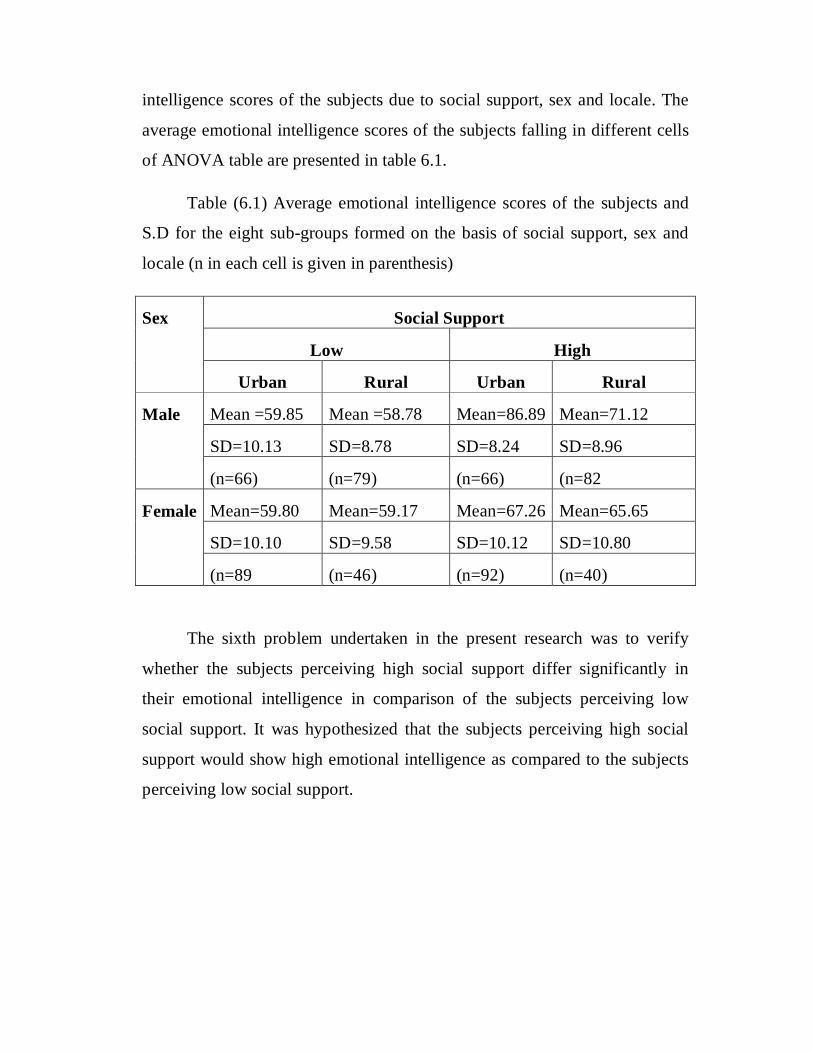
intelligence scores of the subjects due to social support, sex and locale. The
average emotional intelligence scores of the subjects falling in different cells
of ANOVA table are presented in table 6.1.
Table (6.1) Average emotional intelligence scores of the subjects and
S.D for the eight sub-groups formed on the basis of social support, sex and
locale (n in each cell is given in parenthesis)
Sex Social Support
Low High
Urban Rural Urban Rural
Male Mean =59.85 Mean =58.78 Mean=86.89 Mean=71.12
SD=10.13 SD=8.78 SD=8.24 SD=8.96
(n=66) (n=79) (n=66) (n=82
Female Mean=59.80 Mean=59.17 Mean=67.26 Mean=65.65
SD=10.10 SD=9.58 SD=10.12 SD=10.80
(n=89 (n=46) (n=92) (n=40)
The sixth problem undertaken in the present research was to verify
whether the subjects perceiving high social support differ significantly in
their emotional intelligence in comparison of the subjects perceiving low
social support. It was hypothesized that the subjects perceiving high social
support would show high emotional intelligence as compared to the subjects
perceiving low social support.
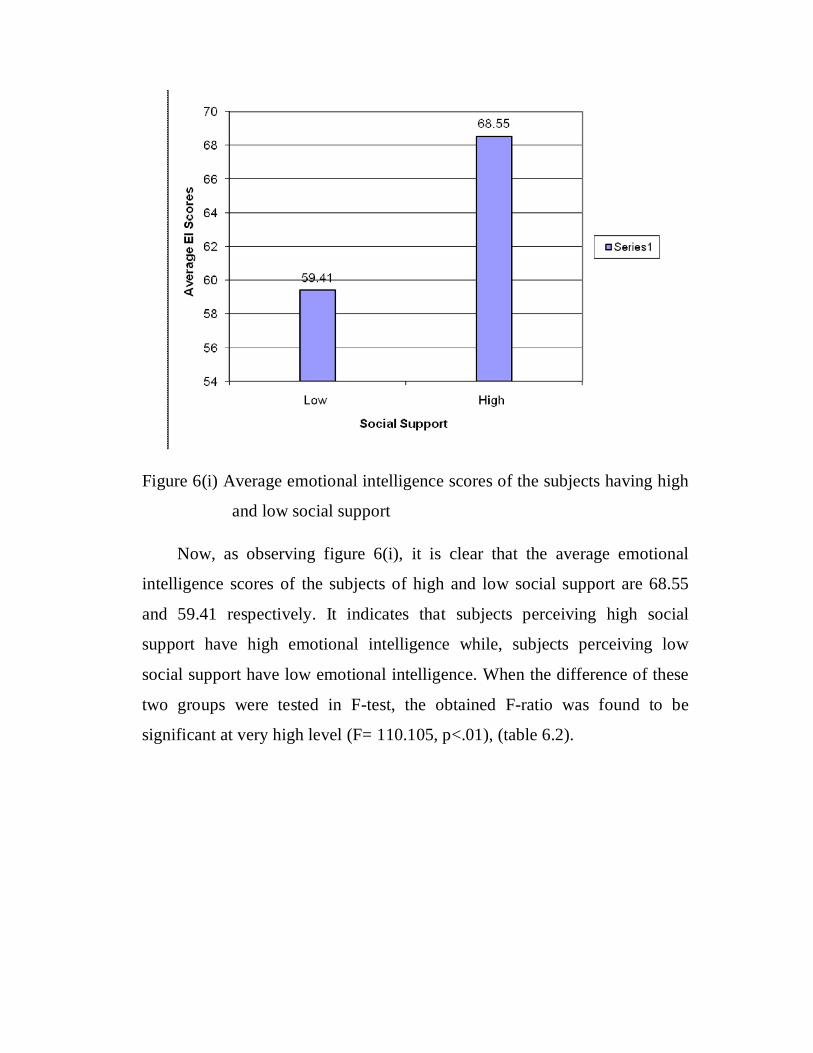
Figure 6(i) Average emotional intelligence scores of the subjects having high
and low social support
Now, as observing figure 6(i), it is clear that the average emotional
intelligence scores of the subjects of high and low social support are 68.55
and 59.41 respectively. It indicates that subjects perceiving high social
support have high emotional intelligence while, subjects perceiving low
social support have low emotional intelligence. When the difference of these
two groups were tested in F-test, the obtained F-ratio was found to be
significant at very high level (F= 110.105, p<.01), (table 6.2).
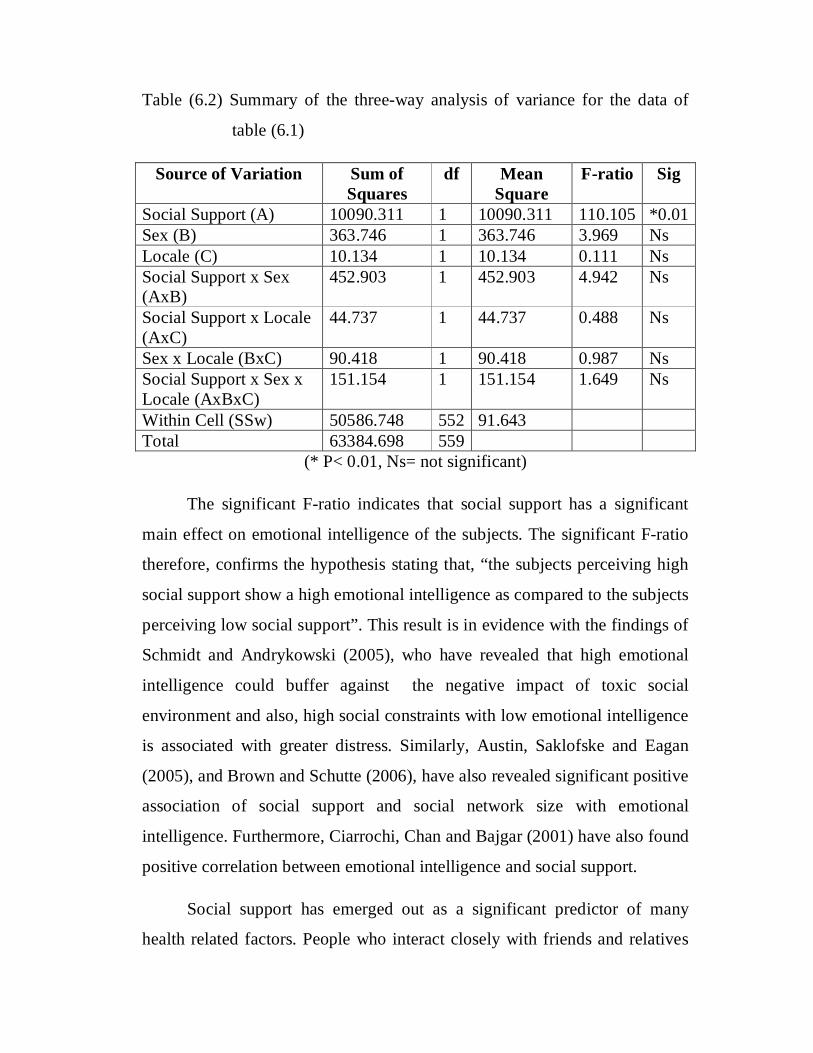
Table (6.2) Summary of the three-way analysis of variance for the data of
table (6.1)
Source of Variation Sum of Squares
df Mean Square
F-ratio Sig
Social Support (A) 10090.311 1 10090.311 110.105 *0.01 Sex (B) 363.746 1 363.746 3.969 Ns Locale (C) 10.134 1 10.134 0.111 Ns Social Support x Sex (AxB)
452.903 1 452.903 4.942 Ns
Social Support x Locale (AxC)
44.737 1 44.737 0.488 Ns
Sex x Locale (BxC) 90.418 1 90.418 0.987 Ns Social Support x Sex x Locale (AxBxC)
151.154 1 151.154 1.649 Ns
Within Cell (SSw) 50586.748 552 91.643 Total 63384.698 559
(* P< 0.01, Ns= not significant)
The significant F-ratio indicates that social support has a significant
main effect on emotional intelligence of the subjects. The significant F-ratio
therefore, confirms the hypothesis stating that, “the subjects perceiving high
social support show a high emotional intelligence as compared to the subjects
perceiving low social support”. This result is in evidence with the findings of
Schmidt and Andrykowski (2005), who have revealed that high emotional
intelligence could buffer against the negative impact of toxic social
environment and also, high social constraints with low emotional intelligence
is associated with greater distress. Similarly, Austin, Saklofske and Eagan
(2005), and Brown and Schutte (2006), have also revealed significant positive
association of social support and social network size with emotional
intelligence. Furthermore, Ciarrochi, Chan and Bajgar (2001) have also found
positive correlation between emotional intelligence and social support.
Social support has emerged out as a significant predictor of many
health related factors. People who interact closely with friends and relatives
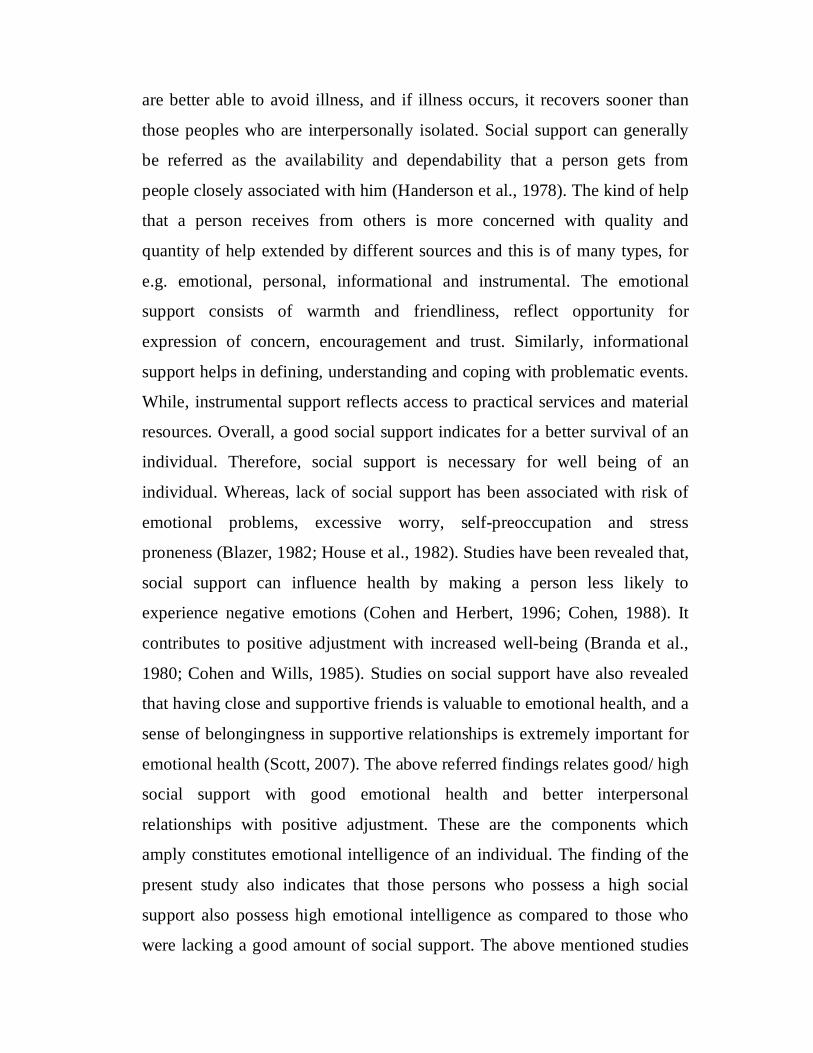
are better able to avoid illness, and if illness occurs, it recovers sooner than
those peoples who are interpersonally isolated. Social support can generally
be referred as the availability and dependability that a person gets from
people closely associated with him (Handerson et al., 1978). The kind of help
that a person receives from others is more concerned with quality and
quantity of help extended by different sources and this is of many types, for
e.g. emotional, personal, informational and instrumental. The emotional
support consists of warmth and friendliness, reflect opportunity for
expression of concern, encouragement and trust. Similarly, informational
support helps in defining, understanding and coping with problematic events.
While, instrumental support reflects access to practical services and material
resources. Overall, a good social support indicates for a better survival of an
individual. Therefore, social support is necessary for well being of an
individual. Whereas, lack of social support has been associated with risk of
emotional problems, excessive worry, self-preoccupation and stress
proneness (Blazer, 1982; House et al., 1982). Studies have been revealed that,
social support can influence health by making a person less likely to
experience negative emotions (Cohen and Herbert, 1996; Cohen, 1988). It
contributes to positive adjustment with increased well-being (Branda et al.,
1980; Cohen and Wills, 1985). Studies on social support have also revealed
that having close and supportive friends is valuable to emotional health, and a
sense of belongingness in supportive relationships is extremely important for
emotional health (Scott, 2007). The above referred findings relates good/ high
social support with good emotional health and better interpersonal
relationships with positive adjustment. These are the components which
amply constitutes emotional intelligence of an individual. The finding of the
present study also indicates that those persons who possess a high social
support also possess high emotional intelligence as compared to those who
were lacking a good amount of social support. The above mentioned studies
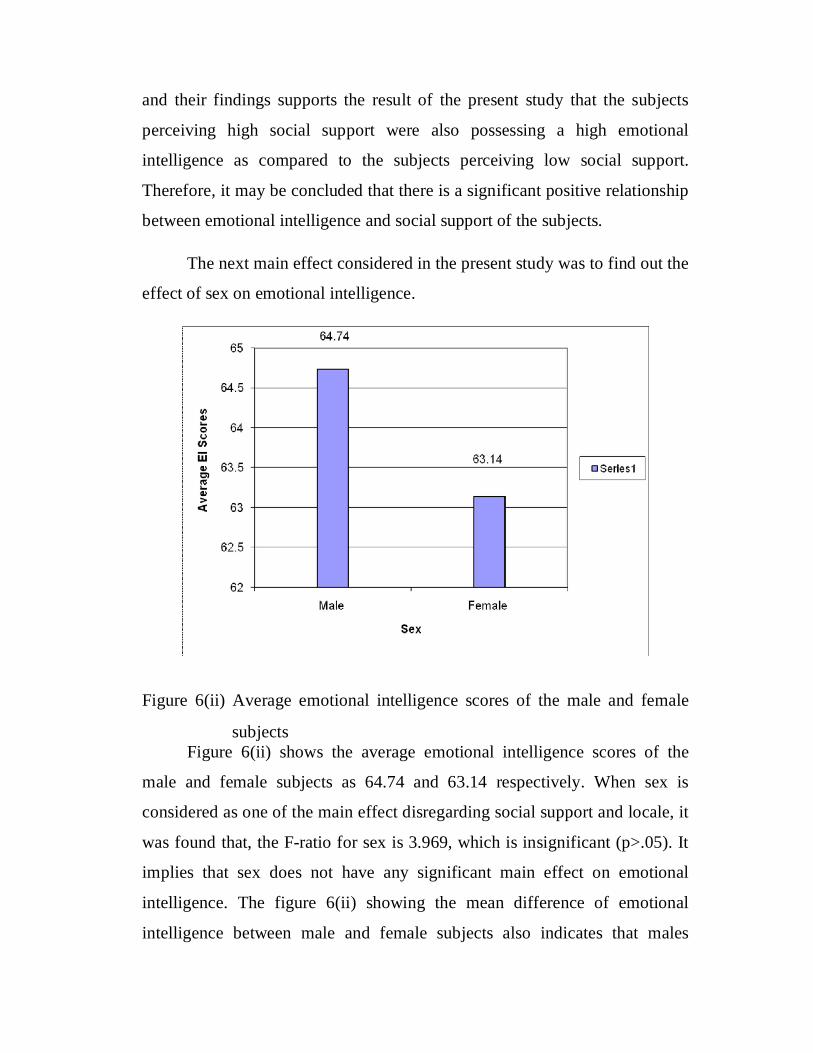
and their findings supports the result of the present study that the subjects
perceiving high social support were also possessing a high emotional
intelligence as compared to the subjects perceiving low social support.
Therefore, it may be concluded that there is a significant positive relationship
between emotional intelligence and social support of the subjects.
The next main effect considered in the present study was to find out the
effect of sex on emotional intelligence.
Figure 6(ii) Average emotional intelligence scores of the male and female
subjects Figure 6(ii) shows the average emotional intelligence scores of the
male and female subjects as 64.74 and 63.14 respectively. When sex is
considered as one of the main effect disregarding social support and locale, it
was found that, the F-ratio for sex is 3.969, which is insignificant (p>.05). It
implies that sex does not have any significant main effect on emotional
intelligence. The figure 6(ii) showing the mean difference of emotional
intelligence between male and female subjects also indicates that males
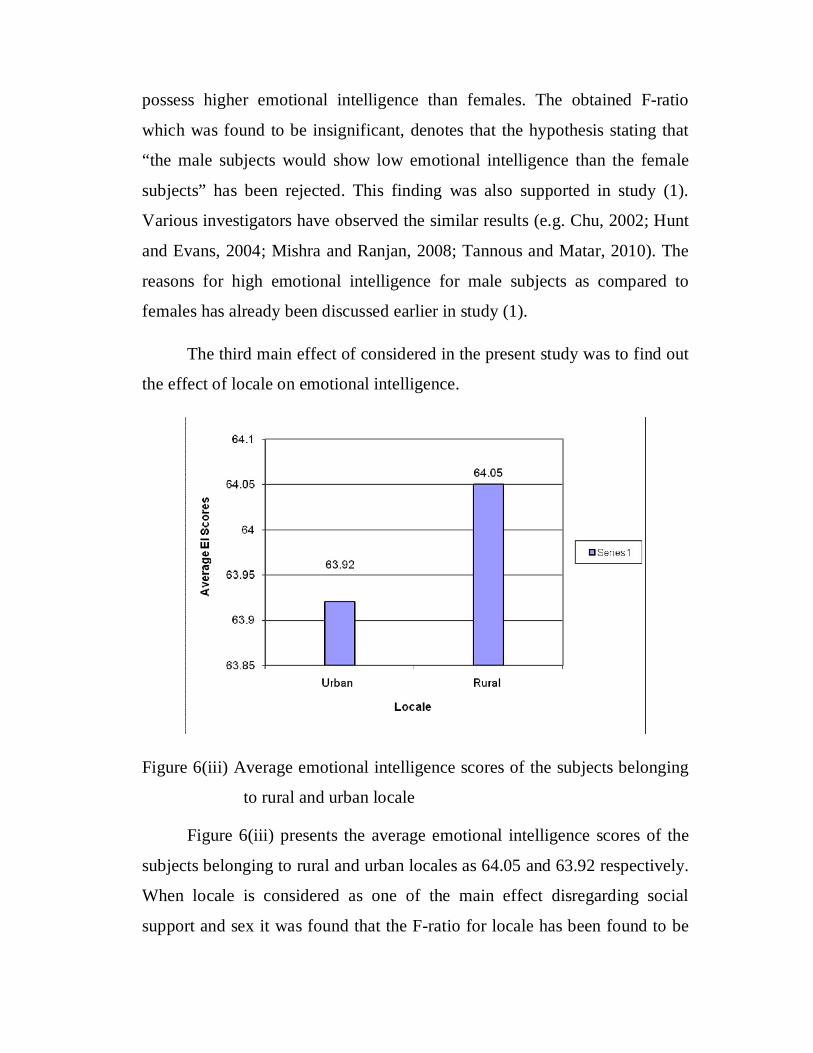
possess higher emotional intelligence than females. The obtained F-ratio
which was found to be insignificant, denotes that the hypothesis stating that
“the male subjects would show low emotional intelligence than the female
subjects” has been rejected. This finding was also supported in study (1).
Various investigators have observed the similar results (e.g. Chu, 2002; Hunt
and Evans, 2004; Mishra and Ranjan, 2008; Tannous and Matar, 2010). The
reasons for high emotional intelligence for male subjects as compared to
females has already been discussed earlier in study (1).
The third main effect of considered in the present study was to find out
the effect of locale on emotional intelligence.
Figure 6(iii) Average emotional intelligence scores of the subjects belonging
to rural and urban locale
Figure 6(iii) presents the average emotional intelligence scores of the
subjects belonging to rural and urban locales as 64.05 and 63.92 respectively.
When locale is considered as one of the main effect disregarding social
support and sex it was found that the F-ratio for locale has been found to be
0.0111 which is not significant at any level of confidence. The figure 6(iii)
showing the mean difference of emotional intelligence between urban and
rural locale also indicates that subjects belonging to rural locale are
possessing high emotional intelligence in comparison to their urban
counterparts. Therefore the insignificant F-ratio indicates that there is not any
significant main effect of locale exists on the emotional intelligence of the
subjects. Thus, it may be concluded that, the research hypothesis stating that
“subjects belonging to urban locale would show a high emotional intelligence
as compared to the subjects belonging to rural locale” has been rejected. This
finding is in consonance with the results obtained by the study of
Gowdhaman and Murugan (2009) that there is not found any significant
relationship between emotional intelligence and locale. In this connection,
Shanwal (2004) have found that the rural childrens have higher emotional
intelligence in comparison of the urban ones, which supports the result of
present study, as the average emotional intelligence scores of rural subjects is
higher than that of urban subjects [figure 6 (iii)]. Next is the interpretation of
the interaction of the interaction effects of all the three independent variables
i.e. social support, sex and locale on emotional intelligence. Out of the three
first order interactions, one is the interaction between social support and sex.
Table (6.3) and figure 6(iv) shows the average emotional intelligence scores
of four sub-groups formed on the basis of social support and sex.

Table (6.3) Average emotional intelligence scores and S.D of four sub-groups formed on the basis of social support and sex (n in each cell is given in parenthesis)
Figure 6(iv) Social support x Sex interaction profile based on the data of table
(6.3)
Table (6.2) (summary of ANOVA) depicts that the interaction
between social support and sex is found to be insignificant (F= 4.942, p>.05).
It implies that the difference between the means of high social support and
Sex Social Support
Low High
Male Mean=59.24 Mean=70.13
SD=9.40 SD=8.69 (n=145) (n=148)
Female Mean=59.59 Mean=66.77
SD=9.90 SD=10.31 (n=135) (n=132)
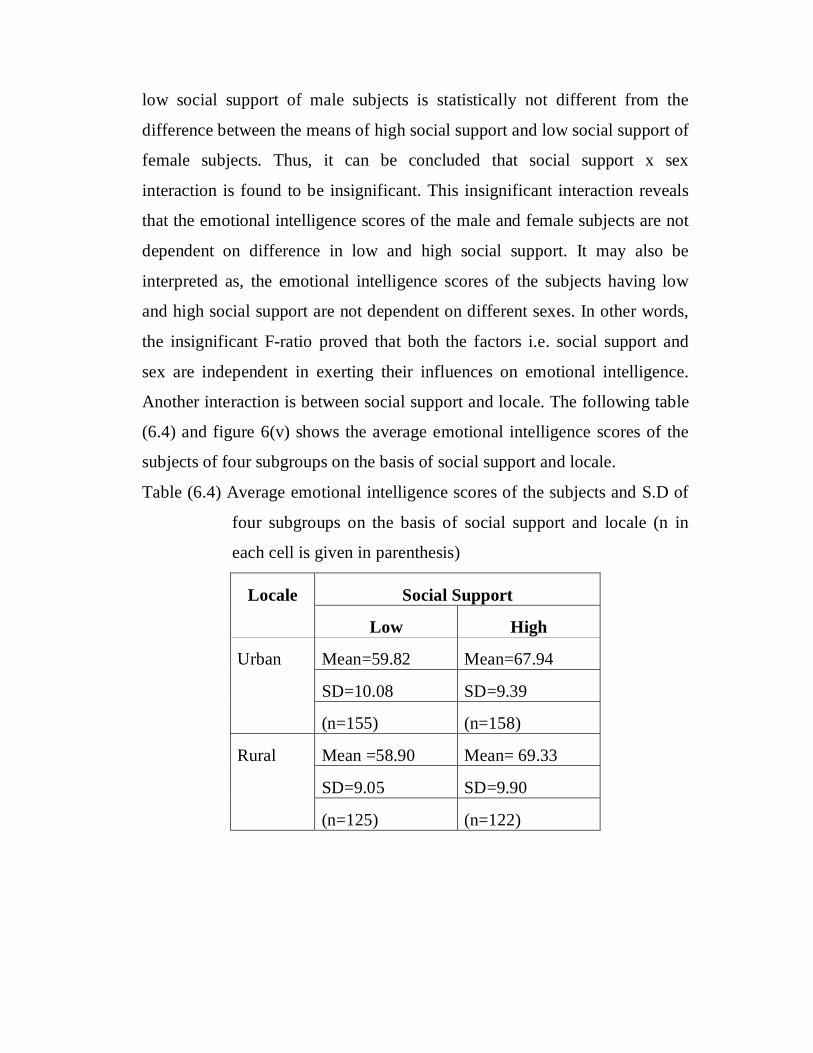
low social support of male subjects is statistically not different from the
difference between the means of high social support and low social support of
female subjects. Thus, it can be concluded that social support x sex
interaction is found to be insignificant. This insignificant interaction reveals
that the emotional intelligence scores of the male and female subjects are not
dependent on difference in low and high social support. It may also be
interpreted as, the emotional intelligence scores of the subjects having low
and high social support are not dependent on different sexes. In other words,
the insignificant F-ratio proved that both the factors i.e. social support and
sex are independent in exerting their influences on emotional intelligence.
Another interaction is between social support and locale. The following table
(6.4) and figure 6(v) shows the average emotional intelligence scores of the
subjects of four subgroups on the basis of social support and locale.
Table (6.4) Average emotional intelligence scores of the subjects and S.D of
four subgroups on the basis of social support and locale (n in
each cell is given in parenthesis)
Locale Social Support
Low High
Urban Mean=59.82 Mean=67.94
SD=10.08 SD=9.39
(n=155) (n=158)
Rural Mean =58.90 Mean= 69.33
SD=9.05 SD=9.90
(n=125) (n=122)
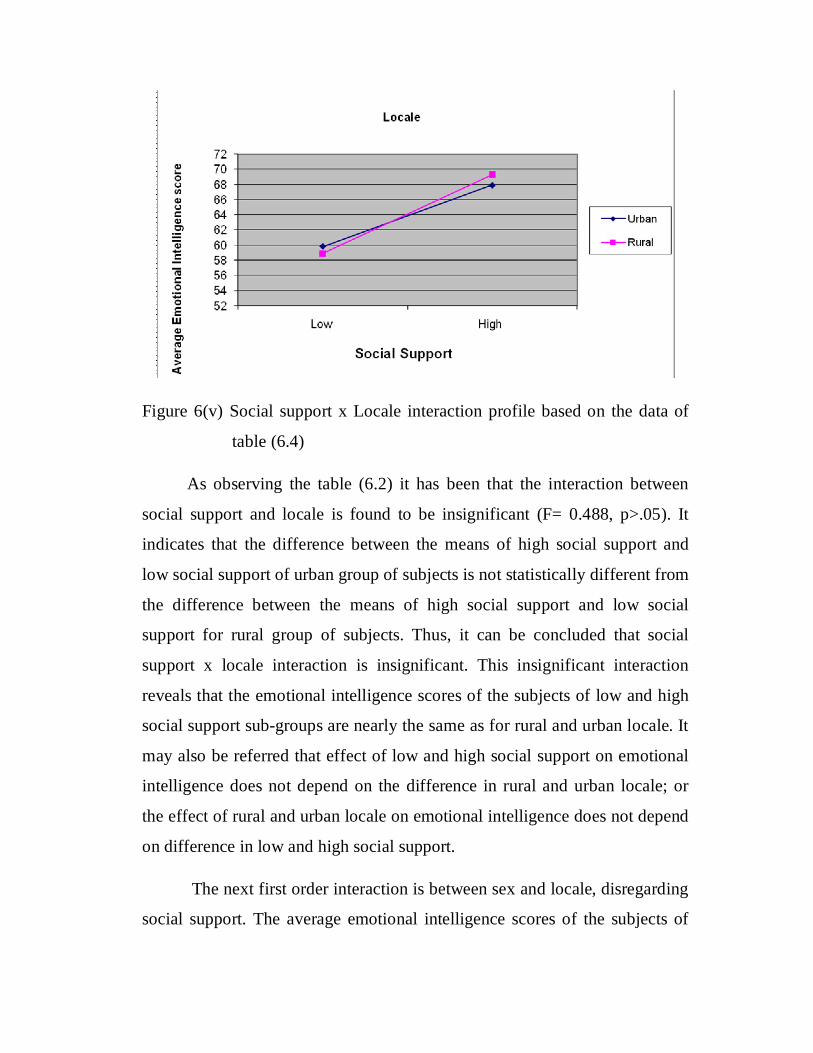
Figure 6(v) Social support x Locale interaction profile based on the data of
table (6.4)
As observing the table (6.2) it has been that the interaction between
social support and locale is found to be insignificant (F= 0.488, p>.05). It
indicates that the difference between the means of high social support and
low social support of urban group of subjects is not statistically different from
the difference between the means of high social support and low social
support for rural group of subjects. Thus, it can be concluded that social
support x locale interaction is insignificant. This insignificant interaction
reveals that the emotional intelligence scores of the subjects of low and high
social support sub-groups are nearly the same as for rural and urban locale. It
may also be referred that effect of low and high social support on emotional
intelligence does not depend on the difference in rural and urban locale; or
the effect of rural and urban locale on emotional intelligence does not depend
on difference in low and high social support.
The next first order interaction is between sex and locale, disregarding
social support. The average emotional intelligence scores of the subjects of
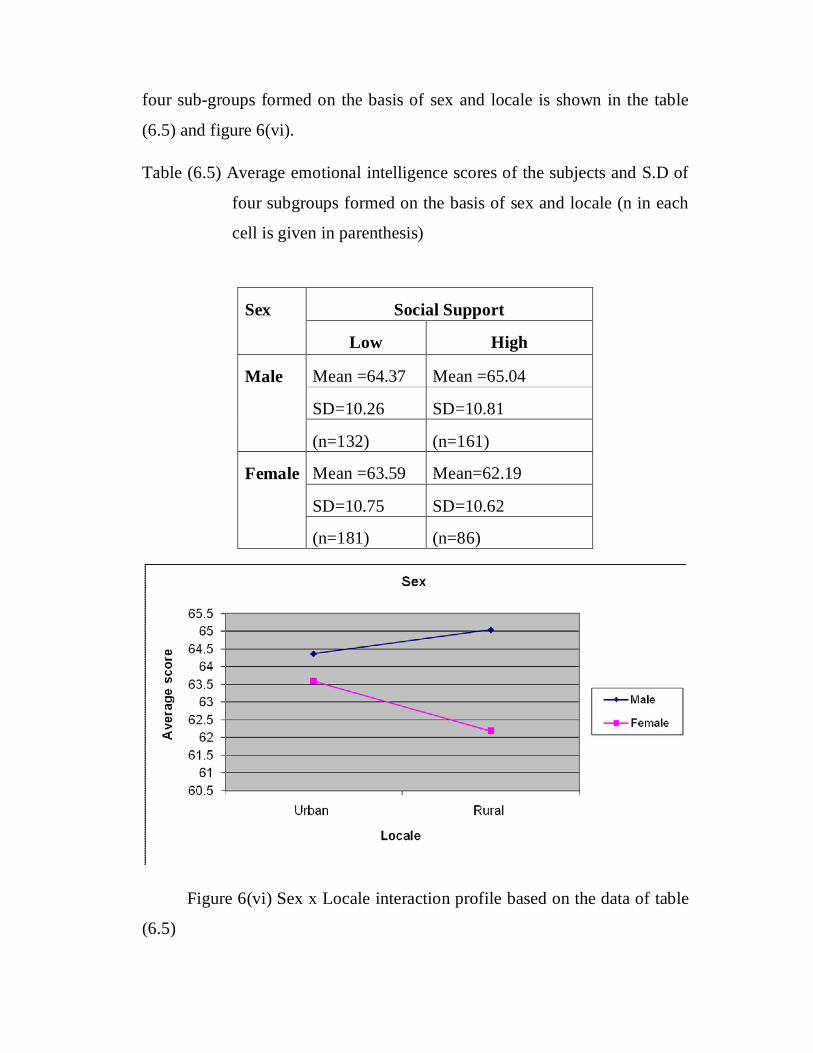
four sub-groups formed on the basis of sex and locale is shown in the table
(6.5) and figure 6(vi).
Table (6.5) Average emotional intelligence scores of the subjects and S.D of
four subgroups formed on the basis of sex and locale (n in each
cell is given in parenthesis)
Figure 6(vi) Sex x Locale interaction profile based on the data of table
(6.5)
Sex Social Support
Low High
Male Mean =64.37 Mean =65.04
SD=10.26 SD=10.81
(n=132) (n=161)
Female Mean =63.59 Mean=62.19
SD=10.75 SD=10.62
(n=181) (n=86)
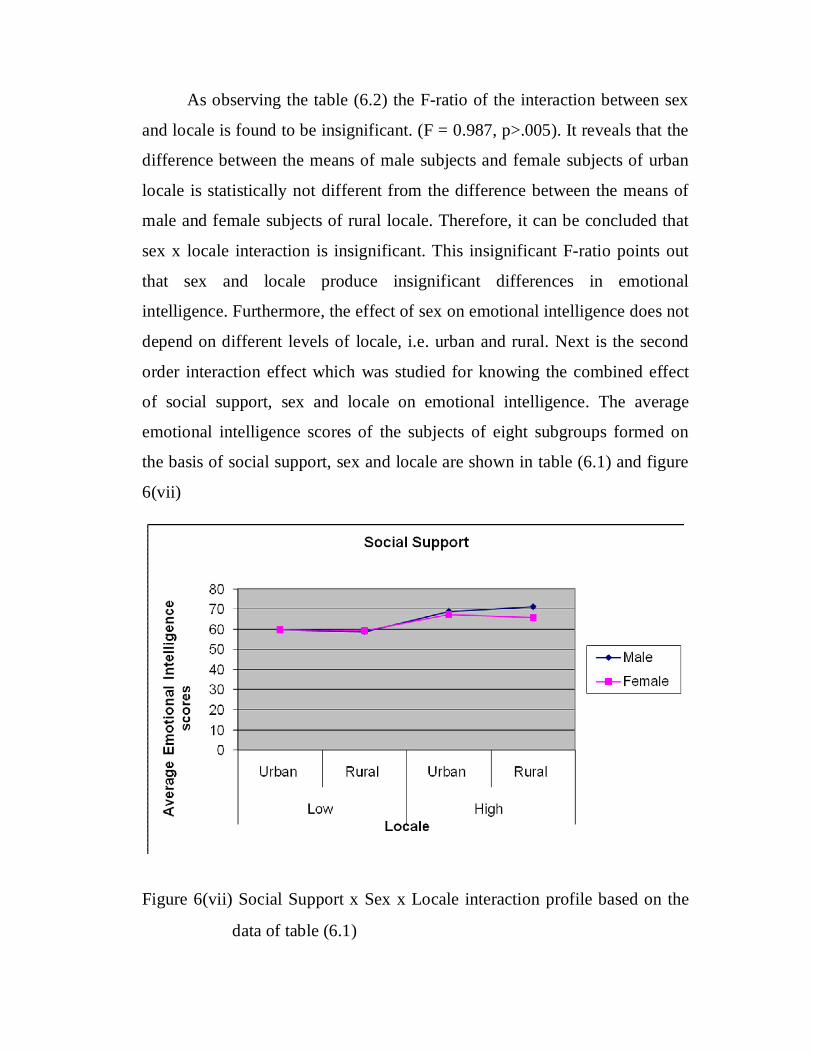
As observing the table (6.2) the F-ratio of the interaction between sex
and locale is found to be insignificant. (F = 0.987, p>.005). It reveals that the
difference between the means of male subjects and female subjects of urban
locale is statistically not different from the difference between the means of
male and female subjects of rural locale. Therefore, it can be concluded that
sex x locale interaction is insignificant. This insignificant F-ratio points out
that sex and locale produce insignificant differences in emotional
intelligence. Furthermore, the effect of sex on emotional intelligence does not
depend on different levels of locale, i.e. urban and rural. Next is the second
order interaction effect which was studied for knowing the combined effect
of social support, sex and locale on emotional intelligence. The average
emotional intelligence scores of the subjects of eight subgroups formed on
the basis of social support, sex and locale are shown in table (6.1) and figure
6(vii)
Figure 6(vii) Social Support x Sex x Locale interaction profile based on the
data of table (6.1)
The obtained F-ratio for social support, sex and locale interaction is
1.649 which is not significant at any level of confidence (p>.05). It implies
that social support, sex and locale of the subjects did not appear to interact
with reference to emotional intelligence. From the insignificant interaction it
may be concluded that difference in emotional intelligence exhibited by high
and low social support subgroups does not vary considerably because of the
difference in sex and locale. Social support x sex interaction is same for the
subjects of rural and urban locale; or social support x locale interaction does
not differ for the male and female subjects; or sex x locale interaction is same
for the subjects of low and high social support subgroups.
Thus, the above discussion shows that, among all the three factors i.e.
social support, sex and locale, only social support plays a significant role in
predicting emotional intelligence. However, none of the first order and
second order interactions were found to be significant.
Results (Part-B)
As it has been mentioned previously that, the present research work is
intended to measure the effect of certain psycho-social variables viz.
aggression, self concept, extraversion, neuroticism, home environment, social
support, sex and locale, on the outcome variable i.e. emotional intelligence.
For the purpose of the present research endeavor, it was hypothesized that the
emotional intelligence (along with its different dimensions viz. interpersonal
awareness, intrapersonal awareness, interpersonal management, and
intrapersonal management) would be significantly related to the aforesaid
psycho-social variables.
Consequently, it seems appropriate to use ‘stepwise multiple regression
analysis’ for the purpose. This has generated overall five multiple regression
analysis tables, four for each different dimensions of the emotional

intelligence and one for emotional intelligence as such. The results are
presented below:
Table (i) Stepwise Multiple Regression with ‘Emotional Intelligence’ as
criterion variable and other psycho-social variables as significant
predictors.
Sno. Independent
Variable
R R Square Beta F-value Sig.
1. Self Concept 0.512 0.262 0.317 263.434 0.000
2. Social Support 0.585 0.343 0.247 193.420 0.000
3. Neuroticism 0.629 0.395 -0.276 161.304 0.000
4. Extraversion 0.641 0.410 -0.118 128.788 0.000
5. Aggression 0.648 0.420 -0.197 106.892 0.000
An observation of the above table (i) clearly indicates that self-concept,
social support, neuroticism, extraversion, and aggression emerged as
significant predictors of overall emotional intelligence. However none of the
other independent variables (home environment, locale and sex) contribute
significantly to overall emotional intelligence. The standardized coefficient
for self-concept (B=0.317) indicates that there is a significant positive
relationship between self-concept and emotional intelligence (F= 263.434,
P<.01), further indicating it as a stronger predictor as compared to others.
Therefore it is inferred that brighter self-concept indicates increase in
emotional intelligence of the individual. This finding confirms the hypothesis
that, subjects showing bright self-concept would show high emotional
intelligence as compared to the subjects showing poor self-concept.
The variable that has second largest contribution is social support (B=
0.247), followed by neuroticism, extraversion, and aggression in that order.
Which shows the contribution of sense of support to emotional intelligence of

the individuals. Similar to self-concept, social support is also having a
significant positive relationship with emotional intelligence (F = 193.42, P
<.01). Therefore it is inferred that more the social support a person has, better
will be his/her emotional intelligence. It confirms the hypothesis that,
subjects perceiving high social support would show high emotional
intelligence as compared to the subjects perceiving low social support.
Neuroticism is found to have a significant negative relationship with EI
(F= 161.340, p<0.01) and (B= -0.276) which denotes that more neurotic the
individual is, less will be its emotional intelligence. Therefore, it confirms the
hypothesis that, subjects belonging to neuroticism personality dimension
would score low on emotional intelligence as compared to their counterparts.
Moving ahead to the interpretation of next predictor i.e. extraversion.
Results indicates that extraversion personality dimension have a negative
relationship with emotional intelligence. A negative standardized coefficient
(B= -0.118) indicates its significant (F= 128.788, P< .01) but negative
relationship with the criterion variable i.e. EI. Therefore it is stated that
extraversion personality dimension contributes negatively for EI. This finding
does not confirm the hypothesis that, the subjects belonging to extraversion
personality dimension would show high level of emotional intelligence as
compared to their counterparts.
Similarly, for aggression (B= -0.047) it is also inferred that though it is
emerged as a significant predictor (F= 106.892, P< .01), it have a negative
relationship with emotional intelligence. This means higher the aggression, of
an individual lower will be its emotional intelligence. This finding supports
the hypothesis that, subjects scoring high on aggression would show a lower
level of emotional intelligence as compared to the subjects showing low
aggression.

The above findings were reported for overall emotional intelligence
score of the subjects. Following is the interpretation of the results obtained
for each of the four dimensions of emotional intelligence (included in this
study) viz. intrapersonal awareness, interpersonal awareness, intrapersonal
management, interpersonal management.
Table (ii) Stepwise Multiple Regression with ‘Intrapersonal Awareness’ as
criterion variable and other psycho-social variables as significant
predictors.
Sno. Independent
Variable
R R Square Beta F-value Sig.
1. Neuroticism 0.528 0.279 -0.367 287.161 0.000
2. Self Concept 0.612 0.374 0.312 222.031 0.000
3. Social Support 0.625 0.390 0.123 158.225 0.000
4. Aggression 0.631 0.398 -0.088 122.369 0.000
Table (ii) shows that neuroticism, self-concept, social support, and
aggression emerged as significant predictors of ‘intrapersonal awareness’
dimension of emotional intelligence. However, extraversion, home
environment, sex, and locale did not contribute significantly to this dimension
of emotional intelligence, Further showing a significant negative relationship
(F= 287.161, P<.01 and B= -0.367) which indicates that highly neurotic
persons will show a decrease in their intrapersonal awareness (i.e. being
aware of his or her own emotions). Neuroticism becomes a stronger predictor
of intrapersonal awareness as compared to the other predictors. The variable
that has second largest contribution in predicting intrapersonal awareness is
self-concept followed by social support and aggression in that order. Self-
concept contributes positively (B = .312) to intrapersonal awareness with an
F-value of 222.031 (P<.01). Similarly, social support is also showing
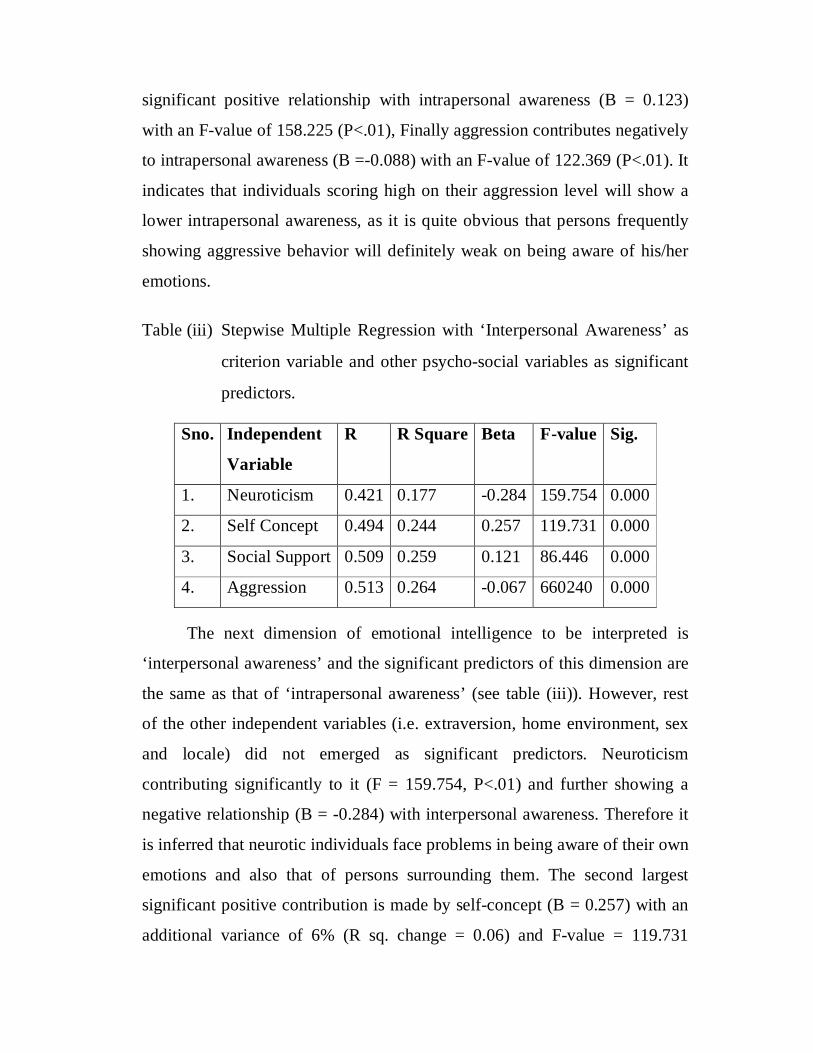
significant positive relationship with intrapersonal awareness (B = 0.123)
with an F-value of 158.225 (P<.01), Finally aggression contributes negatively
to intrapersonal awareness (B =-0.088) with an F-value of 122.369 (P<.01). It
indicates that individuals scoring high on their aggression level will show a
lower intrapersonal awareness, as it is quite obvious that persons frequently
showing aggressive behavior will definitely weak on being aware of his/her
emotions.
Table (iii) Stepwise Multiple Regression with ‘Interpersonal Awareness’ as
criterion variable and other psycho-social variables as significant
predictors.
Sno. Independent
Variable
R R Square Beta F-value Sig.
1. Neuroticism 0.421 0.177 -0.284 159.754 0.000
2. Self Concept 0.494 0.244 0.257 119.731 0.000
3. Social Support 0.509 0.259 0.121 86.446 0.000
4. Aggression 0.513 0.264 -0.067 660240 0.000
The next dimension of emotional intelligence to be interpreted is
‘interpersonal awareness’ and the significant predictors of this dimension are
the same as that of ‘intrapersonal awareness’ (see table (iii)). However, rest
of the other independent variables (i.e. extraversion, home environment, sex
and locale) did not emerged as significant predictors. Neuroticism
contributing significantly to it (F = 159.754, P<.01) and further showing a
negative relationship (B = -0.284) with interpersonal awareness. Therefore it
is inferred that neurotic individuals face problems in being aware of their own
emotions and also that of persons surrounding them. The second largest
significant positive contribution is made by self-concept (B = 0.257) with an
additional variance of 6% (R sq. change = 0.06) and F-value = 119.731
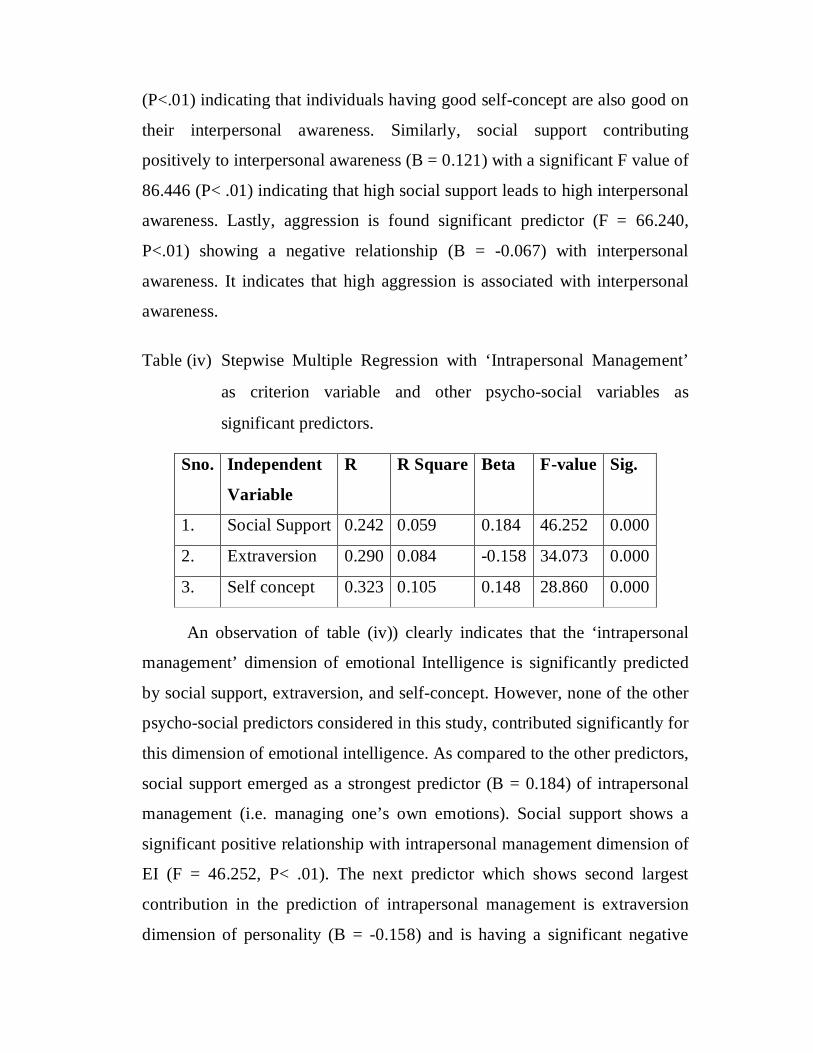
(P<.01) indicating that individuals having good self-concept are also good on
their interpersonal awareness. Similarly, social support contributing
positively to interpersonal awareness (B = 0.121) with a significant F value of
86.446 (P< .01) indicating that high social support leads to high interpersonal
awareness. Lastly, aggression is found significant predictor (F = 66.240,
P<.01) showing a negative relationship (B = -0.067) with interpersonal
awareness. It indicates that high aggression is associated with interpersonal
awareness.
Table (iv) Stepwise Multiple Regression with ‘Intrapersonal Management’
as criterion variable and other psycho-social variables as
significant predictors.
Sno. Independent
Variable
R R Square Beta F-value Sig.
1. Social Support 0.242 0.059 0.184 46.252 0.000
2. Extraversion 0.290 0.084 -0.158 34.073 0.000
3. Self concept 0.323 0.105 0.148 28.860 0.000
An observation of table (iv)) clearly indicates that the ‘intrapersonal
management’ dimension of emotional Intelligence is significantly predicted
by social support, extraversion, and self-concept. However, none of the other
psycho-social predictors considered in this study, contributed significantly for
this dimension of emotional intelligence. As compared to the other predictors,
social support emerged as a strongest predictor (B = 0.184) of intrapersonal
management (i.e. managing one’s own emotions). Social support shows a
significant positive relationship with intrapersonal management dimension of
EI (F = 46.252, P< .01). The next predictor which shows second largest
contribution in the prediction of intrapersonal management is extraversion
dimension of personality (B = -0.158) and is having a significant negative
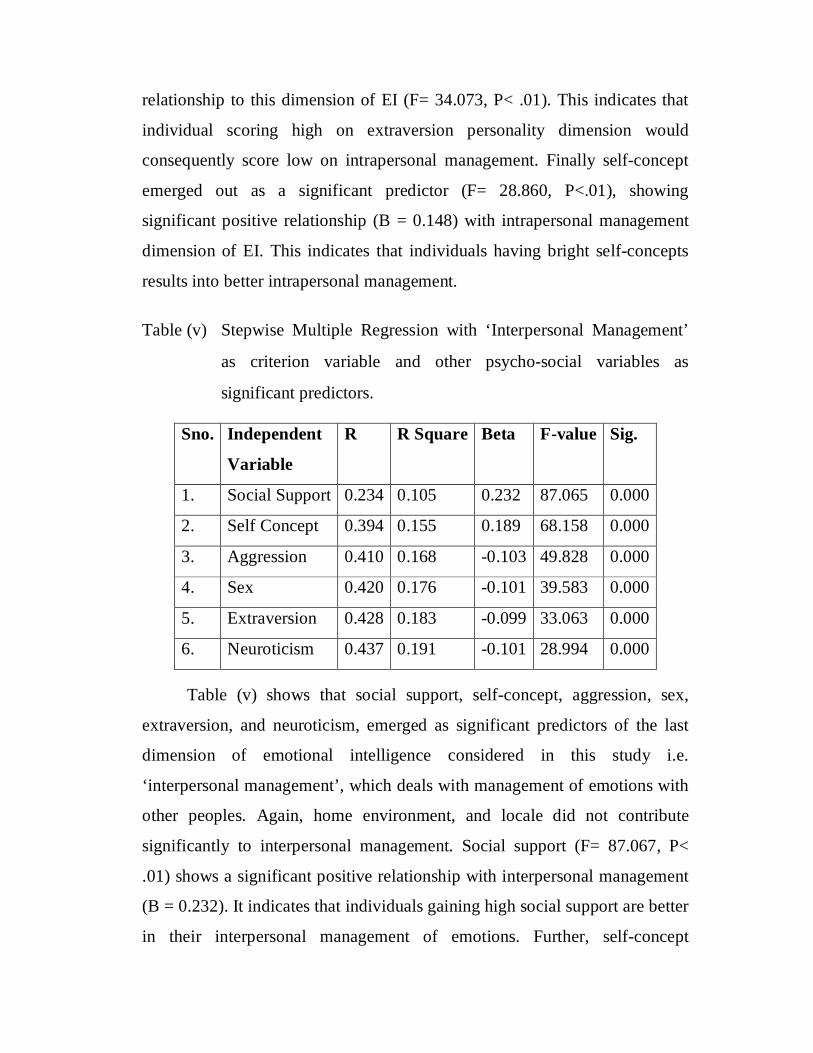
relationship to this dimension of EI (F= 34.073, P< .01). This indicates that
individual scoring high on extraversion personality dimension would
consequently score low on intrapersonal management. Finally self-concept
emerged out as a significant predictor (F= 28.860, P<.01), showing
significant positive relationship (B = 0.148) with intrapersonal management
dimension of EI. This indicates that individuals having bright self-concepts
results into better intrapersonal management.
Table (v) Stepwise Multiple Regression with ‘Interpersonal Management’
as criterion variable and other psycho-social variables as
significant predictors.
Sno. Independent
Variable
R R Square Beta F-value Sig.
1. Social Support 0.234 0.105 0.232 87.065 0.000
2. Self Concept 0.394 0.155 0.189 68.158 0.000
3. Aggression 0.410 0.168 -0.103 49.828 0.000
4. Sex 0.420 0.176 -0.101 39.583 0.000
5. Extraversion 0.428 0.183 -0.099 33.063 0.000
6. Neuroticism 0.437 0.191 -0.101 28.994 0.000
Table (v) shows that social support, self-concept, aggression, sex,
extraversion, and neuroticism, emerged as significant predictors of the last
dimension of emotional intelligence considered in this study i.e.
‘interpersonal management’, which deals with management of emotions with
other peoples. Again, home environment, and locale did not contribute
significantly to interpersonal management. Social support (F= 87.067, P<
.01) shows a significant positive relationship with interpersonal management
(B = 0.232). It indicates that individuals gaining high social support are better
in their interpersonal management of emotions. Further, self-concept
contributes significantly (F= 68.158, P< .01) having positive relationship (B
= 0.189) with interpersonal management. It indicates that good self-concept
is associated with better interpersonal management. The next significant
predictor is aggression (F= 49.828, P<.01) and contributes negatively (B = -
0.103) to interpersonal management. It indicates that aggressive individuals
are having weak interpersonal management skills. Unlike for other
dimensions of emotional intelligence, sex has been emerged out as significant
predictor of interpersonal management (F= 39.583, P<.01) and shows a
negative standardized regression coefficient (B = -0.101). It indicates that
male subjects have higher emotional intelligence as compared to females.
Finally extraversion and neuroticism are emerged out as the least
contributing predictors, associated negatively to interpersonal management
dimension of emotional intelligence (B for Ex = -0.099 and B for Nr= -0.101)
with an F value of 33.063 and 28.994 (both P< .01) respectively.


