Page 1
Chapter 5
Services Liberalization in the ‘ASEAN Plus’
Free Trade
Michael Cornish
School of Economics, University of Adelaide
Christopher Findlay
School of Economics, University of Adelaide
November 2011
This chapter should be cited as
Cornish, M. and C. Findlay. (2011), ‘Services Liberalization in the ‘ASEAN Plus’ Free
Trade Agreements’, in Findlay, C. (ed.), ASEAN+1 FTAs and Global Value Chains in
East Asia. ERIA Research Project Report 2010-29, Jakarta: ERIA. pp.132-155.
Page 2
132
CHAPTER 5
Services Liberalization in the ‘ASEAN Plus’ Free Trade
Agreements
MICHAEL CORNISH
School of Economics, University of Adelaide
CHRISTOPHER FINDLAY
School of Economics, University of Adelaide
Reviews of the treatment of services in ASEAN+1 agreements, applying two different
methodologies, find that commitments to services reform in these agreements are relatively low
compared to what might be possible; whilst they provide some additional commitments to the
General Agreement on Trade in Services (GATS), these commitments continue to be
circumscribed and fail to deal with issues of domestic regulation. Commitments to reform also
vary across economies within an agreement, with generally greater commitments to cross-
border trade, mixed commitments to investment, and few commitments to the movement of
people. An economy’s commitments on services also vary across agreements in what may be a
systematic manner, depending on concerns about competition from the partner economy. There
are some similarities in agreements, though the correlations appear to be low and agreements
involving India and Japan are at early stages of development. Further progress, it is argued,
depends not so much on working with the existing agreements but in tackling the resistance of
policy-makers to adopt reforms and to commit to them with trading partners. This requires
further work on the design of regulatory reform and the institutions to implement regulation.
This focus however does not preclude the development of commitments in sectors of particular
interest to ASEAN, especially in logistics.
Page 3
133
1. Introduction
The trade in services has not historically been granted the same attention as goods
in WTO negotiation rounds nor in free trade agreements (FTAs); it took until the
Uruguay Round in 1986 for the members of the General Agreement on Tariffs and
Trade to even seriously consider services. It is perhaps in part due to this comparatively
limited pedigree that services are often seen as less significant to international trade –
this being substantiated by trade volumes in services relative to goods. Alternatively,
services may also be viewed as being in the ‗too-hard‘ policy basket due to the higher
level of complexity in addressing the attendant issues. In East Asia and South-East
Asia, where developing countries still predominate geographically, services have
historically been of less importance than the commodity trade. International trade
negotiations require an intense combination of technical expertise that is a scarce
resource in many developing countries, keeping services policy ‗on the backburner‘
when faced with competing demands upon capacity.
‗Enabling services‘ – that is, transport, finance, telecommunication and legal
services and logistics – play a crucial role in enabling the structural shift from
commodity- or manufacturing-centric economies to information- and knowledge-based
economies. They attract more attention in ASEAN as a result. Locking in a less
restrictive services trade policy environment will thus be even more important to the
transformative modernization of these economies than commodity trade policy was in
the past.
Recent research (Nordas, Miroudot and Lanz, 2008) on the benefits of the extensive
margin in trade in services (the creation of new trade flows) rather than the intensive
margin (expansions of existing trade flows) further points to the potential of services to
reduce the costs of international business. For example, the Master Plan on ASEAN
Connectivity (ASEAN, 2011) recognizes the role of various and specific services in
reaching its goal of facilitating the movement of goods, people and services themselves.
Despite their increasing potential and importance, global progress on services
reform to date has been sporadic, mixed and slow. In East Asia, the use of bilateral and
regional trade agreements has grown rapidly. In this region, the developing economies
Page 4
134
stand to benefit greatly from services reform, but are there encouraging signs of higher
levels of commitments within these bilateral and regional FTAs?
This paper investigates the level of liberalization in services in that core element of
the East Asian trade system, ASEAN, specifically within its FTA partnerships. The
focus is on the ‗ASEAN Plus one‘ agreements.
The next section provides more background on the results of other research on the
impact of various systems of reform and the contribution of preferential trade
agreements in particular. The following sections apply two different methodologies to
assess the agreements and the final section concludes with a focus on ‗next steps‘.
Rather than focussing on using existing agreements and looking for ways to build up
commitments for reform from within those agreements, the priority should be to build
an improved environment – including, but not limited to, increased economic
cooperation – that will better support reform. In particular, regional cooperation has a
significant role to play in this work. However, this should not rule out or limit progress
on particular sectors of key interest in the region.
2. Background
The key question has been the extent of commitments in services in these
agreements. The general assessment has been that: ‗…most regional agreements have
not been effective mechanisms for liberalizing access to services markets. Instead policy
reforms have mostly been unilateral‘ (François and Hoekman, p.674).
In this chapter, we carefully review studies on this question. However, we also note
that recent presentations from the World Bank have reported that the multilateral
process is not contributing to progress on reform. Gootiiz and Mattoo (2009) (whose
methodology is reviewed in more detail in section 4), compare commitments to actual
policies. They find that Uruguay Round commitments are on average 2.3 times more
restrictive than current policies. The best offers submitted so far as part of the Doha
negotiations improve on Uruguay Round commitments by about 13 per cent but remain
Page 5
135
on average 1.9 times more restrictive than actual policies.1 Their assessment is that the
Doha process does not offer greater access to markets, but a weak assurance that access
will not get worse.
They also stress that significant restrictions remain in many services, with
restrictions in East Asia being relatively high. The gains from reform are therefore
expected to be significant. The extent of these gains is discussed in François and
Hoekman (2010) and also evident in recent work for the Policy Support Unit in Asia--
Pacific Economic Cooperation (APEC) (Findlay et al., 2010).
Our focus in this paper is the treatment of services in preferential agreements
among ASEAN members and their dialogue partners (as listed in Table 1). Some of the
agreements have been examined in other work, although at earlier stages of the
development of those agreements. However, timing matters, as there appears to be
significant evolution in agreements over time.
Trewin et al. (2008) asked the question of whether East Asian FTAs in services
were facilitating the flow of services in ASEAN. They found among other things that:
- The agreements studied did increase the number of committed sectors beyond the
GATS but not dramatically so;
- There was little evidence that these commitments had translated into actual
liberalization;
- The largest gains come from non-discriminatory market access and negotiations are
ineffective in achieving liberalization that requires unilateral action;
- Whilst most intra-Asia agreements adopt a positive list approach, the negative list
approach appears to be more liberalizing; however, they recognize that the
contribution of the architecture to this result is difficult to identify; and
- There are identifiable differences in commitments among ASEAN members under
the various agreements.
1 Other studies find instances of preferential commitments which are more restrictive than those in
the GATS (see papers discussed by Dee and McNaughton, 2011)
Page 6
136
Ochiai, Dee and Findlay (ODF) (2010) reviewed the treatment of services in a
number of East Asian FTAs (their methodology is also discussed in more detail in
section 3). They found that the extent of commitments does not appear to be related to
the architecture of the agreements examined. Some adopt the positive list approach and
others the negative list approach. In the sample of agreements studied here for example
that between ASEAN and China is a positive list agreement, while the ASEAN--ANZ
agreement and the ASEAN--S. Korea agreements are negative list agreements. While
ODF note that in principle both approaches could be used to document the same level of
commitment, the negative list agreements tend to have text that promotes future
liberalization (and those agreements tend to limit protection against new services).
Relative to the GATS, ODF find that preferential agreements tend to have a wider
coverage. At the same time, they stress the number of sectors which are excluded in the
agreements they examine, although, as just noted, they report that the rate of exclusion
is generally better than that in the GATS for the same economy.
ODF also highlight the use of horizontal commitments, but as sources of restriction.
Limitations dismantling the effectiveness of liberalization are imposed in horizontal
commitments; for instance, restrictions on the form of establishment and the dominance
of domestic labour law are explicitly designated. The consequence is that the number of
sectors committed to liberalization may not always be a proper indicator of the degree
of liberalization. ODF report that this situation is more likely to be an issue for
commitments related to the movement of people (mode 4)2.
2The modes of supply in the GATS are the following (quoted from
http://www.wto.org/english/tratop_e/serv_e/gatsqa_e.htm)
1. Cross-border supply is defined to cover services flows from the territory of one Member into
the territory of another Member (e.g. banking or architectural services transmitted via
telecommunications or mail);
2. Consumption abroad refers to situations where a service consumer (e.g. tourist or patient)
moves into another Member's territory to obtain a service;
3. Commercial presence implies that a service supplier of one Member establishes a territorial
presence, including through ownership or lease of premises, in another Member's territory to
provide a service (e.g. domestic subsidiaries of foreign insurance companies or hotel chains);
and
4. Presence of natural persons consists of persons of one Member entering the territory of another
Member to supply a service (e.g. accountants, doctors or teachers).
Page 7
137
In other remarks related to modes of supply, they find that the elimination of
barriers is more likely in cross border supply and consumption abroad (modes 1 and 2),
while investment and commercial presence (mode 3) remains subject to limitations
which are similar to those at the multilateral level and mode 4 obligations are small (see
also the results of Ishido (2011) later in this section). Investment is sometimes treated
in two parts of the same agreement (and in one agreement using a negative list approach
in the investment chapter and a positive list in the services chapter).
With respect to domestic regulation (including matters such as mutual recognition,
transfer payments, transparency, subsidies and business practices), ODF find that the
agreements do not offer much beyond the commitments in the GATS. Fink and
Molinuevo (2007) likewise report that East Asian FTAs have not made significant
progress in areas of rule-making that remain unresolved in the WTO. Roy, Marchetti
and Lim (2007) also find that preferential agreements offer little over the GATS
disciplines with respect to these areas.
Dee (2009) and Dee and McNaughton (2011) report research on the commitments
in services in the ASEAN Framework Agreement on Services (AFAS). To some extent
countries have introduced genuine trade reforms in response to either that agreement or
the GATS but the conclusion is that in general the more significant reforms have been
made unilaterally. However, it was also found that reforms so far have made a only a
slight difference to the overall prevalence of restrictions on foreign suppliers and no
difference to the prevalence of restrictions on domestic suppliers.
A couple of other aspects of agreements deserve attention. These are the rules of
origin and the inclusion of a most favoured nation (MFN) clause.
A rule of origin is required to identify eligibility to access the terms of the
agreement. Generally in a services agreement, the rule is based on the identity of the
supplier rather than being based on the process of production of the service. The rule
can either be the more liberal version based on the location of the substantial business
operations of the provider, or the less liberal rule of ownership. Fink and Jansen (2009)
find that generally liberal rules are used, and by implication any commitments that are
made in preferential agreements are likely to involve only weak degrees of
discrimination. They suggest that contributors to this outcome are the political treatment
of foreign investors and the networking characteristics of services production.
Page 8
138
Fink and Jansen also study the use of MFN clauses within an agreement, so that
when a new agreement is signed by a country it should extend to its existing partners
any more liberal treatment offered to the most recent partner. This clause facilitates
liberalization and reduces the extent of disparities among a set of interconnected
countries. Of the agreements they examine, half have such a clause although such
agreements are more likely to involve developed countries
Ishido (2011) examined the ASEAN+1 agreements, applying the earlier
methodology of Hoekman (1995) which was developed to assess GATS commitments.
A database is created for each sub-sector by mode and by aspect of liberalization (that
is, market access or national treatment) and commitments are rated as N (no limitation
and bound); L (limited or restricted but bound); and U (unbound). These results are
scored as N=1, L=0.5 and U=0. Simple averages are then calculated. Ishido reviews
and compares AFAS, the ASEAN--Australia--New Zealand FTA, the ASEAN--China
FTA and the ASEAN--Korea FTA. A strength of his work is his treatment of the detail
within each agreement by sub-sector and by country. Findings include:
- Low overall scores, which are all less than 0.33;
- Mode 1 and mode 3 have various ‗country- and sector-specific commitment
patterns‘ but (in all but one case) mode 4 shows the least commitments and mode 2
shows the most;
- There is not much difference in commitments with respect to market access and
national treatment across these agreements;
- There is considerable variation in average scores: AFAS – 0.33, AANZFAT – 0. 23,
AKFTA – 0.20 and ACFTA – 0. 12;
- There are some examples of high correlations in commitments among participating
economies within agreements but overall they are low (interpreted as differences in
sensitive sectors among economies, although with no negative correlations);
- In terms of correlations at the agreement level, AFAS is an outlier while the other
three agreements have more similar patterns of commitment; and
- Looking at the commitments by the same country under different FTAs, Ishida
finds that overall ‗there is no ‗convergence‘ of country level commitments under
different FTAs as they currently stand, and the degree of similarity differs greatly
Page 9
139
across different countries and also across different pairs of FTAs‘ (p.28), although
the correlations are generally positive.
Stephenson and Robert (2011) ask a series of questions about the impact of the
regional agreements on services trade. To the question of whether regional agreements
promote reform in services policy they respond with ‗yes and no‘. For example, they
refer to treatment of government procurement of services as a case where regional
agreements have gone further than the WTO. Other areas where contributions might be
found are in provisions for future liberalization, chapters on electronic commerce and
treatment of movement of people. At the same time, they note the lack of more
extensive treatment of subsidies or domestic regulation. Their conclusion is that
regional agreements have not been able to push countries to liberalize services faster
than might otherwise have been done on their own. Their observation is that countries
have organized reform domestically first, and then committed to those changes in trade
agreements ‗where appropriate‘ (p.26).
We now return to our question of the coverage of services in the ASEAN+1
agreements. Our purpose is to determine an indicator of the overall level of
liberalization in each of the +1 agreements and to note their similarities and differences.
In this paper we do not compare the treatment of the agreements with actual policy, nor
with commitments in the WTO. Rather our purpose is to comment on issues in
extending and aligning commitments within these agreements.
Two distinct methodologies were chosen to measure the liberalization in the trade in
services in FTAs: the ODF approach and the Gootiiz and Mattoo (2009) approach.
These are reported in the following sections.
Page 10
140
4. The Ochiai, Dee and Findlay Methodology
The Ochiai, Dee and Findlay (ODF) methodology assesses the level of
liberalization in FTAs by rating the restrictiveness of the various modes of supply. The
most important and indicative clauses in the actual text have been chosen and given
their own rating scale (with some scales reused) between zero and one, with ‗0‘ being
the most restrictive and ‗1‘ being the least restrictive. All of the significant metrics of
liberalization are covered, including, but not limited to: sectoral coverage, most-
favoured nation exemptions, national treatment, market access, transparency and
safeguards.
A final score and simple average for each mode of supply – with modes 1 and 2
combined – is then calculated for each agreement and the numbers compared. We also
comment on country exceptions and variations below.
The key strength of the ODF method is that it grants an immediate and simple
snapshot of the level of restrictiveness, both overall and by mode of supply, but also
against critical individual clauses. The method behoves itself as a quick reference tool,
highlighting the critical areas of the agreement that can be targeted for future progress
towards liberalization. The methodology is relatively straightforward to apply, although
it is a time-consuming process that requires close scrutiny and deep understanding of
the structure of FTAs.
A critical issue is the arbitrary – although consistent – manner in which the original
rating scales have been assigned. The number created at the end of the process can only
be used for like-for-like comparisons, as the rating of individual clauses is not weighted
according to their relative importance to the liberalization in the trade of services, let
alone the level of liberalization that the agreement actually manages to effect in the real-
life policy environment.
The simple averages from the ODF method for the ASEAN+1 agreements hold
some obvious and intuitive conclusions, but also a few surprises. Summary results are
shown in Table 1 and an appendix contains the results by clause.
Page 11
141
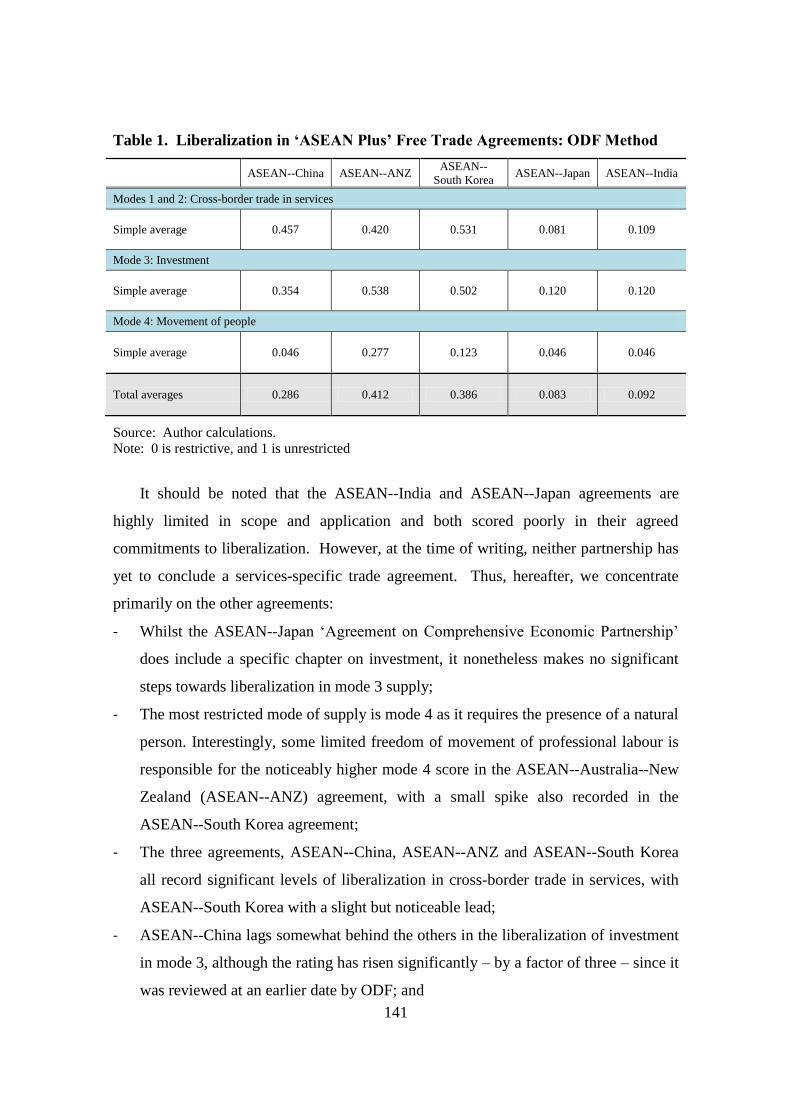
Table 1. Liberalization in ‘ASEAN Plus’ Free Trade Agreements: ODF Method
ASEAN--China ASEAN--ANZ ASEAN--
South Korea ASEAN--Japan ASEAN--India
Modes 1 and 2: Cross-border trade in services
Simple average 0.457 0.420 0.531 0.081 0.109
Mode 3: Investment
Simple average 0.354 0.538 0.502 0.120 0.120
Mode 4: Movement of people
Simple average 0.046 0.277 0.123 0.046 0.046
Total averages 0.286 0.412 0.386 0.083 0.092
Source: Author calculations.
Note: 0 is restrictive, and 1 is unrestricted
It should be noted that the ASEAN--India and ASEAN--Japan agreements are
highly limited in scope and application and both scored poorly in their agreed
commitments to liberalization. However, at the time of writing, neither partnership has
yet to conclude a services-specific trade agreement. Thus, hereafter, we concentrate
primarily on the other agreements:
- Whilst the ASEAN--Japan ‗Agreement on Comprehensive Economic Partnership‘
does include a specific chapter on investment, it nonetheless makes no significant
steps towards liberalization in mode 3 supply;
- The most restricted mode of supply is mode 4 as it requires the presence of a natural
person. Interestingly, some limited freedom of movement of professional labour is
responsible for the noticeably higher mode 4 score in the ASEAN--Australia--New
Zealand (ASEAN--ANZ) agreement, with a small spike also recorded in the
ASEAN--South Korea agreement;
- The three agreements, ASEAN--China, ASEAN--ANZ and ASEAN--South Korea
all record significant levels of liberalization in cross-border trade in services, with
ASEAN--South Korea with a slight but noticeable lead;
- ASEAN--China lags somewhat behind the others in the liberalization of investment
in mode 3, although the rating has risen significantly – by a factor of three – since it
was reviewed at an earlier date by ODF; and
Page 12
142
- The most comprehensive – and longest by far – of the agreements, ASEAN--ANZ,
holds a slight lead over the ASEAN--South Korea agreement, but significantly
ahead of the remaining three agreements.
There is significant variation between country commitments in these agreements.
To illustrate, we examined more closely differences in commitments in ASEAN--China
and ASEAN--ANZ (locating details of commitments by economy and by sector for the
agreement with Korea has been more difficult). Results of our assessments of examples
of sectors in which restrictions remain are summarized in Table 2. These two cases
show:
Table 2. Sectors for which Restrictions are Retained, by Economy
Country
schedules ASEAN--China ASEAN—ANZ
Indonesia Construction and assembly work, tourism,
energy
Professional services, telecommunications,
construction, education, finance and banking,
health, tourism, transport
Brunei Tourism, transport Professional services, telecommunications,
construction, financial, tourism, transport
Vietnam
Professional services, R&D, courier,
telecommunications, construction, distribution,
environmental, educational, financial, health,
transport (all)
Professional services, courier,
telecommunications, construction, distribution,
environmental, financial, tourism, transport (all)
Lao PDR Banking, insurance Professional services, telecommunications,
education, tourism
Myanmar Air transport, communication, finance,
printing/publishing, maritime services
Professional, communication, construction,
education, transport (all)
Cambodia
Construction, professional services,
telecommunications, distribution, education,
environment, finance, banking, health, tourism,
transport (all)
Construction, banking, finance, tourism
Malaysia Professional services, IT, education, banking,
finance, health, tourism, transport (all)
Prof, telecomm, construction, education, finance,
health, tourism, transport (all)
Thailand Professional services, education, tourism,
maritime transport Financial, transport (all)
Singapore
Professional services, telecommunications
distribution, education, environment, financial,
health, tourism, cultural, transport (all)
Limited restrictiveness in courier, environment,
financial
Philippines Mining, construction environmental, tourism,
[applies 'reciprocity test']
Professional services, mining,
telecommunications, education, environmental,
financial, tourism, transport (all)
China Construction, environmental, transport N/A
Australia
Some limited restrictions on financial services,
commercial presence required for real estate
New Zealand None of note
Source: Author calculations.
Note: simple list, does not account for level of restrictions.
Page 13
143
- Nearly all participating economies (except New Zealand) retain restrictions on
some sectors;
- The sectors included in the list of those in which restrictions remain vary across
economies within an agreement;
- Only some countries have consistent sectoral restrictions across the ASEAN--
China and ASEAN--ANZ agreements (the degrees of similarity are strongest for
Vietnam, Malaysia, Philippines and Myanmar);
However, there is also significant asymmetry between the ASEAN--China and
ASEAN--ANZ agreements; for example:
- Indonesia, Brunei, Vietnam, Lao, Myanmar, Malaysia and the Philippines all
restrict professional services in the ASEAN--ANZ agreement;
- Vietnam, Malaysia, Thailand, Cambodia and Singapore restrict professional
services in the ASEAN--China agreement; and
- There is particularly asymmetric treatment between the two agreements for
Indonesia, Cambodia, Thailand, Singapore, Brunei and Lao PDR.
It is also found that Australia and New Zealand have little restrictions of note;
Singapore has a more extensive list in the agreement with China; and China retains
relatively few restrictions.
With respect to the rule of origin, the agreements with Australia and New Zealand,
with China and with South Korea all say that ‗the terms of the agreement may be denied
to the supply of a service, if it establishes that the service is supplied from or in the
territory of‘ an economy which is not a party to the agreement. This is a relatively
liberal ‗place of business rule‘. However there are variations by mode of supply and by
sector which are evident in the schedules and these variations are taken into account in
the scoring system. For example, in the ASEAN--ANZ agreement, there is total denial
of benefits for cross-border trade in services where there is ownership by a third party.
Summary scores are provided in the appendix table.
With respect to the MFN clause, in the ASEAN--South Korea agreement on
investment, each party accords to one another treatment no less favourable than it
Page 14
144
affords to any party with whom it has a trade agreement. However, there is no
automatic future application of this treatment, only retrospective application. The
ASEAN--China agreement would appear to treat MFN status in an identical fashion.
The ASEAN--ANZ agreement in regards to services says that any agreement that the
parties enter into that provides more favourable treatment to a non-party merely
granting the right to request consultative discussions. The parties have committed to
future discussions on MFN treatment in investment. No current commitments are yet
made in regards to MFN status for services under the ASEAN--India and ASEAN--
Japan framework agreements. In summary, whilst the parties to the ASEAN--South
Korea agreement are willing to mirror liberalization measures agreed with existing
partners, the other agreements do not without the right of reservation. None of the
agreements compel the parties to automatically extend any future liberalization measure
resulting from another agreement – as yet, there is no ‗ratchet‘ mechanism.
5. The Gootiiz and Mattoo Methodology
In measuring the level of commitment to liberalization in services in FTAs, the
Gootiiz and Mattoo (G&M) method uses a sectoral weighting approach. Services are
split into seven separate sectors – banking, insurance, retailing, telecommunications,
maritime shipping and auxiliary services, and professional services – and then further
split into subsectors and their possible modes of supply and assigned modal and sectoral
weightings. Following Hoekman (1995), a standardized five-point rating from zero to
one – where ‗1‘ is completely restrictive and ‗0‘ is without restrictions (the inverse of
the ODF method as discussed later in this section) – is then applied to each subsector
and weighted against first the mode and then against standardized sectoral weights for
an average industrialized country. The aggregate scoring at the agreement level is then
on a 0 to 100 scale, with the higher the number the more restrictive the agreement.
Because they reflect the relative importance of each sector to an average
industrialized economy, the scale of the final scores is not as arbitrary as in the ODF
method, and a real sense of proportion can be achieved when comparing the levels of
Page 15
145
liberalization. However, it is less clear how the modal weights have been settled upon
and, despite its consistency, arbitrariness remains in the setting of the five-point scale.
The ‗broad-brush‘ approach of the five-point scale makes its application to sectoral
policy more imprecise and less than straightforward.
The application of the method here to only the main-text level (rather than the
schedules) of an FTA is an oversimplification for multilateral agreements with many
partners – as, for example, with all ‗ASEAN Plus‘ agreements – because it does not
begin to address the complexity contained within the multiple and distinct individual
country schedules of commitments. Conversely, the level of detail required when
attempting to capture the sectoral commitments of all countries is overly complex, and
does not make for easy comparisons.
The agreements involving India and Japan are not sufficiently detailed yet to make
this methodology relevant and hereafter we concentrate on the results of the other three
agreements. Results are shown in Table 3.
Table 3. Liberalization in ‘ASEAN Plus’ Free Trade Agreements: G&M Method
Aggregate scores at FTA main-text level
Over
all
Banking Insurance Retai
ling
Telecom
municati
ons
Maritime shipping and
aux. services
Professional
services
ASEAN--
China 9.6 0 0 0 0 0 0.4
ASEAN--
ANZ 26.6 0.2 0.2 0.3 0.3 0.1 0.4
ASEAN--S.
Korea 14.7 0 0 0 0 0.9 0.4
Average 17.0 0.1 0.1 0.1 0.1 0.3 0.4
Source: Author calculations
The G&M method was only applied here to the main-text level of the ‗ASEAN
Plus‘ FTAs. The ASEAN--China and ASEAN--South Korea agreements made higher
levels of commitment to liberalization in services at the main-text level of the
agreement and therefore appear relatively liberal at the main-text level. However they
also heavily restrict those aspirations within the individual country schedules. The
ASEAN--ANZ agreement, on the other hand, is much more restrictive in the trade of
services at the main-text level of the agreement but much more liberal at the country
Page 16
146
schedule level, and therefore gives the impression that it is more restrictive than
ASEAN--China and ASEAN--South Korea.
In professional services in particular there was no difference recorded between the
troika of specifically services FTAs (ASEAN--China, ASEAN--South Korea and
ASEAN--ANZ) at the macro-level of the main-text commitment. However there is
considerable variation in the provisions for maritime services.
In keeping with the results of the ODF method, cross-border supply of services
(modes 1 and 2) faces less restrictions than investment (mode 3) and much more liberal
than services requiring the movement of natural persons (mode 4) – namely,
professional services.
6. Conclusions
Results of the work undertaken here (and related earlier work) include:
- Significant barriers to trade and investment in services remain in member
economies;
- Commitments to services reform in these agreements are relatively low
compared to what might be possible, and while they provide some additional
commitments to the GATS agreement, they are often circumscribed and
continue to fail to deal with issues of domestic regulation;
- Commitments to reform vary across economies within an agreement with
generally greater commitments to cross-border trade, mixed commitments to
investment and fewer commitments to the movement of people;
- An economy‘s commitments on services also vary across agreements, in what
may be a systematic manner depending on concerns about competition from
the partner economy; and
- There are some similarities in agreements, though the correlations appear to be
low and agreements involving India and Japan are at early stages of
development.
Page 17
147
These results, combined with those of the World Bank on the extent of ‗water‘ in
multilateral commitments as well as the results of other research reviewed above
indicate that further progress on services reform in the short run via these routes of
negotiated agreement will be difficult. A more fundamental understanding of the
reasons for the slow progress is useful in order to suggest some appropriate initiatives.
For that purpose, there are important lessons from services negotiations in the WTO
where there remain large gaps, as noted above, between commitments and actual policy
in services. Hoekman and Mattoo (2010) have identified a number of factors
contributing to this result:
- First, governments are concerned that multilateral commitments will deprive
them of the freedom to regulate, e.g. cross-border flows of financial and data
services and activities such as cross-border gambling services;
- Second, regulators are unprepared for unrestricted entry and competition,
especially in the smaller developing countries and especially in financial
services; and
- Third, there are inadequate mechanisms for the international regulatory
cooperation, such as between financial regulators, competition authorities, and
immigration authorities that would be needed to reap the full benefits of
liberalization.
Furthermore, business interest has been limited: in industrial countries, services
markets are mostly open, except for transport and labour mobility, and developing
countries are unilaterally liberalizing their markets. There is growing mutual
interdependence in any case and developing countries are increasingly suppliers of
outsourced services to OECD nations that are the source of investment and know-how
in sectors such as transport, telecommunications, and finance. This is creating a self-
enforcing equilibrium of openness with a reduced likelihood of policy reversal.
Meanwhile there is pessimism in the business community because regulatory policies
are not the focus of attention in the negotiations and it is those policies that matter to
them.
Page 18
148
Hoekman and Mattoo suggest that therefore the priority is to deal with domestic
regulation by working to ‗...strengthen regulatory institutions and identify, design and
implement policies that address market failures and ensure wider access to services.‘
This might be based on: ‗Services knowledge platforms‘ that bring together
sectoral regulators, trade officials and stakeholders to assess current policies and
identify beneficial reforms could help establish the preconditions for future
liberalization commitments.‘
They also propose international cooperation to address regulatory externalities.
Examples they list are prudential regulation problems arising from differences in
regulatory standards and from international oligopolies (e.g. transport and information
services) capturing all the gains from liberalization. They suggest cooperation between
host and source countries on temporary labour mobility (an area of low commitments
in the ASEAN+1 agreements).
This review of experience in the negotiations at the WTO level and the results here
and in other research of the assessment of the ASEAN+1 agreements therefore
suggests that the next step for progress on services is not to move immediately to a new
comprehensive and consolidated agreement but to work on the environment in which
that agreement might be built. The focus, in other words, should be on the attitudes of
policy-makers to reform and the levels of confidence in regulatory reform. This means
a focus on capacity-building in services that deals with the key issues identified above.
Considerable work of this type is already in progress in APEC and an important
principle for ASEAN and its +1 partners as they seek to consolidate their agreements
would be to confirm their commitments to APEC work programmes with specific time
lines.
This recommendation does not imply that sectoral commitments in services should
be avoided. The supply chain framework and the lessons from the case studies
highlight the value of a well-functioning transport and logistics system. The relevant
bundle of activities is not readily defined in existing services industry classifications
and a recommendation here is that (building on work in the WTO) a model set of
commitments on that package of services be defined and implemented, and those
commitments cover all the modes of supply including investment. There is further
guidance on the relevant scope of this package in the strategies defined in the Master
Page 19
149
Plan on ASEAN Connectivity. This package could be adopted in advance of wider
services and investment commitments. Other sectors might be examined in a similar
fashion but the research here indicates that transport and logistics is the priority.
Both services and investment arrangements would also have to confront the
question of rules of origin, but generally these are less of an issue compared to the
commitments themselves and can be made relatively liberal (e.g. based on commercial
presence).
In summary, progress on services reform and international commitments to reform
involves not so much work with the existing set of agreements but work on the
environment in which those agreements are being negotiated.
Page 20
150
References
ASEAN (2011) Master Plan on ASEAN Connectivity, Jakarta: ASEAN Secretariat,
January.
Dee, P. (2009) ‗Services liberalization toward the ASEAN Economic Community‘,
Chapter 2 in Shujiro Urata et. al, ERIA Research Project 2009 No. 3, ‗Tracing
progress toward the ASEAN Economic Community‘, available at
http://www.eria.org/research/y2009-no3.html.
Dee, P. and McNaughton, A. (2011) ‗Promoting domestic reforms through
regionalism‘, mimeo, ANU.
François, J., and Hoekman, B. (2010) ‗Services Trade and Policy‘, Journal of Economic
Literature, 48(3): 642–92.
Fink, C. and Jansen, M. (2009) ‗Services Provisions in Regional Trade Agreements:
Stumbling or Building Blocks for Multilateral Liberalisation?‘, in R. Baldwin
and P. Low, (eds), Multilateralizing Regionalism, Cambridge: Cambridge
University Press.
Fink, C. and Molinuevo, M. (2007) ‗East Asian Free Trade Agreements in Services:
Roaring Tigers or Timid Pandas?,‘ East Asia and Pacific Region, Report No.
40175, The World Bank.
Gootiiz, B. and Mattoo, A. (2009) ‗Services in Doha: What‘s on the Table?‘, Policy
Research Working Paper 4903, The World Bank Development Research Group
Trade Team, April.
Hoekman, B. (1995) ‗Tentative first steps: An Assessment of the Uruguay Round
agreement on services‘, Policy Research Working Paper 1455, World Bank.
Hoekman, B. and Mattoo, A. (2010) ‗Services trade liberalisation and regulatory
reform: re-invigorating international cooperation‘, available at
http://www.voxeu.org/index.php?q=node/5969, 24 December.
Ishido, H. (2011) ‗Liberalization of trade in services under ASEAN+n: a mapping
exercise‘, ERIA Discussion Paper Series, ERIA-DP-2001-02.
Kawai, M. and Wignaraja, G. (2009) ‗The Asian ―Noodle Bowl‖: Is It Serious for
Business?‘, ADBI Working Paper Series No. 136, ADBI Institute, April.
Nordas, H.K., Miroudot, S. and Lanz, R. (2008) ‗Entry Barriers and the Extensive
Margin: Estimating Trade Restrictiveness from Trade Flows and Lack Thereof‘,
OECD Trade and Agriculture Directorate, OECD Technical Workshop on Trade
Barrier Assessment Methodology, Paris, 12 December.
Ochiai, R., Dee, P. and Findlay, C. (2010) ‗Services in Free Trade Agreements’, in;
(eds) Christopher Findlay and Shujiro Urata (eds), Free Trade Agreements in the
Asia Pacific, World Scientific Studies in International Economics Vol. 11.
Page 21
151
Roy, M., Marchetti, J. and Lim, H. (2007) ‗Services liberalization in the new generation
of preferential trade agreements (PTAs): how much further than the GATS?‘,
World Trade Review, 6: 155-92.
Stephenson, S. and Robert, M. (2011) ‗Evaluating the Contributions of the RTAs to
Governance of Services Trade‘, paper presented to the PECC-ADBI conference
on ‗Services Trade: New Approaches for the 21st Century‘, 1-3 June, Hong
Kong.
Trewin, R., Bosworth, M., Narjoko, D.A., Mukherjee, A., Stoler, A., Donaldson, V. and
Thomson, G. (2008) ‗East Asian Free Trade Agreements in Services:
Facilitating Free Flow of Services in ASEAN?‘, Final Report, REPSF II Project
no. 07/004.
Page 22
152
Appendix
Table A1. Template for Cross-Border Trade in Services
ASEAN--China ASEAN--ANZ ASEAN--
S. Korea
ASEAN--Japan ASEAN--India
(1) Form of Agreement
Scope 0.8 0.75 0.75 0.2 0.2
MFN 0.75 0.25 0 0 0.75
MFN exemptions 1 0 0 0 0
National treatment 0.75 0.5 1 0 0
Market access (i.e.
prohibition on
quantitative
restrictions as in
GATS)
0.5 0.75 0.75 0 0
Local presence not
required (right of non-
establishment)
0 0 0 0 0
Domestic regulation 0.4 0.4 0.4 0 0
Transparency (scores
additive) 0.7 0.7 0.7 0 0
Recognition 0.2 0.2 0.2 0 0
Monopolies and
exclusive service
providers
0.75 0.75 0.75 0 0
Business practices 0.75 0.75 0.75 0 0
Transfers and
payments 1 1 1 0 0
Denial of benefits (i.e.
rules of origin) 0.75 0 0.75 0 0
Safeguards 0 0.5 0.5 1 1
Subsidies 0.5 0.5 1 0 0
Government
procurement in
services
0 0 0 0 0
Ratchet mechanism 1 0 0 0 0
Telecommunications
(scores additive) 0 1 0.6 0 0
Financial services
(scores additive) 0 0.8 0.7 0 0
Page 23
153
(2) Content of Agreement
Excluded modes 0 0.5 0.5 0 0
Excluded measures 0.5 0 0 0 0
Sectoral exclusions:
Total sectors: 138
(based on CPC) 0 0 0 0 0
Measures at regional
level 1 1 1 0 0
Restrictions on land
purchases 0 0 0 0 0
Reservations on
minority 0 0 1 0 0
Requirements on the
number of domestic
employees 0 0 1 0 0
Provisions
asymmetric? 1 1 1 1 1
Simple average 0.467 0.420 0.531 0.081 0.109
Total score 12.600 11.350 14.350 2.200 2.950
Table A2. Template for Investment
ASEAN--China ASEAN--ANZ ASEAN--
S. Korea
ASEAN--Japan ASEAN--India
(1) Form of Agreement
Sectoral coverage 1 1 1 1 1
Scope of MFN, NT etc.
provisions (scores additive) 1 1 1 0 0
MFN 0.75 0 0.75 0 0
MFN exemptions 0 0 0.25 0 0
National treatment 0.5 0.5 0.5 0 0
Nationality (residency) of
management and board of
directors 0 0 0.5 0 0
Performance requirements 0 0.75 0.75 0 0
Transparency (scores additive) 1 0.7 1 0 0
Denial of benefits (i.e. rules of
origin) 0.5 1 1 0 0
Expropriation etc. (scores
additive) 0.6 1 0.6 0 0
Transfers and payments 0.5 0.5 0.5 0 0
Investor state dispute
settlement 1 1 1 0 0
Safeguards 1 1 1 1 1
Subsidies 0 0 0 0 0
Government procurement 0 0 0 0 0
Ratchet mechanism 0 0 0 0 0
Page 24
154
Table A2. (Continued)
(2) Content of Agreement
Excluded measures 0 0 0 0 0
Sectoral exclusions: Total
sectors: 138 (based on CPC) 0 0 0 0 0
Measures at regional level 0 1 0.7 0 0
Restrictions on land purchases 0 0 0 0 0
Reservations on minority 0 0 0 0 0
Requirement of prior residence
for establishment 0 1 0 0 0
General restrictions on foreign
capital participation 0 1 0 0 0
Review or approvals on large
foreign investments
(acquisition) 0 1 1 0 0
Provisions asymmetric 1 1 1 1 1
Simple average 0.354 0.538 0.502 0.120 0.120
Total score 8.850 13.450 12.550 3.000 3.000
Table A3. Template for Movement of People
ASEAN--China ASEAN--ANZ ASEAN--S. Korea ASEAN--Japan ASEAN--India
(1) Form of Agreement
Sectoral coverage 0 1 0.5 0 0
Scope 0 0.5 0.25 0 0
Immigration 0 0 0 0 0
MFN for mode 4
delivery 0 0 0 0 0
MFN exemptions 0 0 0 0 0
National treatment for
mode 4 delivery 0 0 0 0 0
Market access (i.e.
prohibition on
quantitative
restrictions as in
GATS) 0 0 0.5 0 0
Domestic regulation 0 0 0 0 0
Transparency of
regulations governing
service delivery via
mode 4 (scores
additive) 0 0.4 0 0 0
Transparency of
regulations governing
temporary movement
of persons (scores
additive) 0 0.4 0 0 0
Recognition 0 0 0 0 0
Denial of benefits (i.e.
rules of origin) 0 1 0.75 0 0
Ratchet mechanism 0 0 0 0 0
Page 25
155
Table A3. (Continued)
(2) Content of Agreement-Service Delivery
General
reservations/exceptions 0 0 0 0 0
Sectoral exclusions: Total
sectors:138 (based on
CPC)
0.2 0.2 0.2 0.2 0.2
Measures at regional level 0 1 0 0 0
(3) Content of Agreement-Facilitation of Mobility
Skill coverage (least
generous treatment among
members of FTA)
0 0.25 0 0 0
Short term entry (least
generous treatment among
members of FTA
0 0.25 0 0 0
Long term entry (least
generous treatment among
members of FTA
0 0.2 0 0 0
Quotas on numbers of
entrants 0 1 0 0 0
Needs test 0 0 0 0 0
Local labour market testing
or other criteria 0 0 0 0 0
restrictions on land
purchases 0 0 0 0 0
Considerations on minority 0 0 0 0 0
Requirements on the
number of domestic
employees
0 0 0 0 0
Provisions asymmetric? 1 1 1 1 1
Simple average 0.046 0.277 0.123 0.046 0.046
Total score 1.200 7.200 3.200 1.200 1.200