45
CHAPTER 5 WATER TREATMENT EVAL UATION BRIDGE CREEK SUPPLY Prepared for City of Bend, Oregon October 2 3 , 2009 Prepared by Alan W. Peck, P.E. Black & Veatch

CHAPTER 5WATER TREATMENT EVALUATION
BRIDGE CREEK SUPPLY
Prepared for
Ci ty o f Bend , Oregon
October 23, 2009
Prepared by
Alan W. Peck , P.E.Black & Veatch

Chapter 5 Water Treatment Evaluation Bridge Creek Supply
i
TABLE OF CONTENTS
LIST OF FIGURES II
LIST OF TABLES II
LIST OF APPENDICES I
5.0 Executive Summary ..................................................................................................................................5-1
5.1 Introduction ...............................................................................................................................................5-2
5.2 Existing Facilities.......................................................................................................................................5-3
5.3 Summary of Raw Water Quality ................................................................................................................5-4
5.4 Regulatory Review ....................................................................................................................................5-4
5.4.1 Recent Regulatory Framework.......................................................................................................5-4
5.4.2 Filter Backwash Recycling Rule (FBRR) ........................................................................................5-8
5.4.3 Clean Water Act (CWA)/Resource Conservation and Recovery Act (RCRA) ................................5-9
5.5 Design Basis Of Alternatives.....................................................................................................................5-9
5.5.1 Plant Capacity ................................................................................................................................5-9
5.5.2 Disinfection Requirements..............................................................................................................5-9
5.6 Criteria for Evaluating Alternatives ..........................................................................................................5-10
5.7 Treatment Process Alternatives ..............................................................................................................5-11
5.7.1 UV Disinfection.............................................................................................................................5-11
5.7.2 Conventional Treatment ...............................................................................................................5-17
5.7.3 Membrane Filtration......................................................................................................................5-23
5.8 Evaluation Of Alternatives.......................................................................................................................5-30
5.8.1 Capital Cost..................................................................................................................................5-30
5.8.2 O&M Costs ...................................................................................................................................5-31
5.8.3 Water Quality Risks ......................................................................................................................5-32
5.8.4 Staffing, Operability, and Automation ...........................................................................................5-32
5.8.5 Expandability ................................................................................................................................5-33
5.8.6 Operational Flexibility ...................................................................................................................5-33
5.8.7 Site Compatibility..........................................................................................................................5-33
5.9 Results And Recommendations ..............................................................................................................5-34
5.9.1 Summary of Evaluation ................................................................................................................5-34
LIST OF APPENDICES
APPENDIX 5-A USEPA LETTER REGARDING LT2 CRYPTOSPORIDIUM LEVEL
APPENDIX 5-B ESTIMATE OF PROBABLE CONSTRUCTION COST AND 20-YEAR PRESENT WORTH COST

Chapter 5 Water Treatment Evaluation Bridge Creek Supply
ii
LIST OF FIGURES
Figure 5-1. Treatment Process Schematic–Alternative 1: UV Disinfection.........................................................5-13
Figure 5-2. Conceptual Site Layout–Alternative 1: UV Disinfection....................................................................5-14
Figure 5-3. Treatment Process Schematic–Alternative 2: UV Disinfection with Pretreatment............................5-15
Figure 5-4 . Conceptual Site Layout– Alternative 2: UV Disinfection with Pretreatment ....................................5-16
Figure 5-5. DAF Process....................................................................................................................................5-18
Figure 5-6. Actiflo Schematic .............................................................................................................................5-19
Figure 5-7. Treatment Process Schematic– Alternative 3: Conventional Treatment Plant................................5-21
Figure 5-8. Conceptual Site Layout–Alternative 3: Conventional Treatment Plant............................................5-22
Figure 5-9. Relative Size of Small Particles ........................................................................................................5-23
Figure 5-10. Pressure Membrane System...........................................................................................................5-24
Figure 5-11. Submerged Membrane System ......................................................................................................5-24
Figure 5-12. Treatment Process Schematic– Alternative 4: Submerged Membrane Treatment .......................5-27
Figure 5-13. Treatment Process Schematic–Alternative 4: Pressure Membrane Treatment ............................5-28
Figure 5-14 . Conceptual Site Layout– Alternative 4: Membrane Treatment Plant ...........................................5-29
LIST OF TABLES
Table 5-1. Alternatives Cost Summary ...............................................................................................................5-1
Table 5-2. Cryptosporidium Inactivation Requirements for Unfiltered PWSs 1 ...................................................5-3
Table 5-3. Raw Water Quality Data ....................................................................................................................5-4
Table 5-4. Cryptosporidium Inactivation Requirements for Unfiltered PWSs 1....................................................5-5
Table 5-5. Treatment Bin Classification, Additional Cryptosporidium Treatment Requirements forConventional Clarification/Filtration (including softening) 1 .......................................................................5-6
Table 5-6. Key Dates for Stage 2 DBPR Compliance (Systems Serving 50,000 to 99,999 Consumers) ...........5-7
Table 5-7. Key Dates for Stage 2 DBPR Compliance (Systems Serving 50,000 to 99,999 Consumers) ...........5-8
Table 5-8. Disinfection Requirements for Each Treatment Alternative .............................................................5-10
Table 5-9. Typical Design Parameters for Conventional Pretreatment Processes ...........................................5-17
Table 5-10. Typical Design Parameters for the DAF Process ..........................................................................5-18
Table 5-11. Typical Design Parameters for the Actiflo Process ........................................................................5-18
Table 5-12. Capabilities of MF and UF Membranes .........................................................................................5-25
Table 5-13. Summary of Major Treatment Plant Components..........................................................................5-30
Table 5-14. Alternatives Opinion of Capital Costs ............................................................................................5-31
Table 5-15. 20-year Present Worth of O&M Costs1 ..........................................................................................5-32
Table 5-16. 20-year Present Worth Cost ..........................................................................................................5-34
Table 5-17. Treatment Alternatives Evaluation Criteria ....................................................................................5-34

5-1
C H A P T E R 5
W A T E R T R E A T M E N T E V A L U A T I O NB R I D G E C R E E K S U P P L Y
5.0 Executive Summary
The purpose of this technical evaluation is to provide guidance for the City of Bend (City) in selecting theappropriate treatment process for its existing Bridge Creek surface supply. The evaluation focused ontreatment for two water quality scenarios:
Existing normal range of water quality
Water quality following a significant fire in the watershed
The alternatives for both water quality scenarios are designed to meet the requirements of the U.S.Environmental Protection Agency’s (USEPA) Long Term 2 Enhanced Surface Water Treatment (LT2) Ruleand all current and anticipated drinking water regulations. The capacity of the initial plant is anticipated to be13 million gallons per day (mgd) with two future expansions of 6.5 mgd each for a build-out plant capacity of26 mgd. This chapter presents an evaluation of four treatment alternatives that will provide the desiredinactivation or removal of Cryptosporidium to meet the requirements of LT2. The four treatment alternativesevaluated are as follows:
Alternative 1 – Ultraviolet (UV) Disinfection
Alternative 2 – UV Disinfection with Pretreatment for Turbidity Reduction
Alternative 3 - Conventional Treatment (defined as coagulation, flocculation, and sedimentationfollowed by granular media filtration)
Alternative 4 - Membrane Filtration (Microfiltration [MF] or Ultrafiltration [UF]) with Pretreatment
The capital, annual operations and maintenance (O&M), and total 20-year present worth costs of the fouralternative treatment systems for a 13 mgd water treatment plant (WTP) is presented below. All costs arebased on 2009 dollars and are escalated to the anticipated midpoint of construction.
Table 5-1. Alternatives Cost Summary
Treatment alternativeTotal capital costs,
million dollars20-year present worth of
O&M costs, million dollarsTotal 20-year presentworth, million dollars
Alternative 1 – UV Disinfection 8.1 2.5 10.6
Alternative 2 – UV Disinfection with Pretreatment 17.3 2.5 19.8
Alternative 3 – Conventional Treatment 23.0 5.0 28.0
Alternative 4 – Membrane Filtration 22.7 6.0 28.7
Each treatment alternative was ranked with respect to the following seven evaluation criteria:
Capital Cost
O&M Costs
Water Quality
Staffing, Operability, and Automation

Chapter 5 Water Treatment Evaluation Bridge Creek Supply
5-2
Expandability
Operational Flexibility
Site Compatibility
Membrane filtration has the most favorable overall ranking, followed by UV disinfection withoutpretreatment, conventional filtration, and UV disinfection with pretreatment. Although ranked second withrespect to total points, UV disinfection without pretreatment is ranked the lowest in the two most importantareas, water quality risks and operational flexibility. Conventional treatment is ranked third but does have theability to mitigate water quality risks and provides flexibility to treat varying raw water quality conditions.Membrane filtration is ranked first in the most categories including the key criteria of water quality risks andoperational flexibility, primarily due to their robustness and ability to produce high quality water regardless orraw water quality conditions. UV disinfection with pretreatment is ranked lowest. Although UV disinfectionwith pretreatment will provide more operational flexibility than UV disinfection without pretreatment, thisalternative will not mitigate against forest fires. In addition, the additional capital costs of the pretreatmentprocess and additional pumping requirements make this alternative significantly more expensive than UValone.
All of the alternatives assume that a new hydropower facility will be installed on the raw water pipeline at theOutback Facility. If a hydropower facility is not constructed, a UV disinfection facility will be required tomeet the LT2 requirements. A UV disinfection facility without hydropower will operate by gravity similar tocurrent conditions. The estimated capital cost of this compliance only option is $7.1 million.
5.1 Introduction
The City has contracted with Brown and Caldwell to provide engineering services for Phase 1 of a long-termwater supply improvement project. One of the tasks of the engineering services is to provide a WTPEvaluation to compare UV disinfection, conventional treatment (coagulation, flocculation, and sedimentationfollowed by granular media filtration), membrane filtration, and UV disinfection with pretreatment for theCity’s Bridge Creek surface water source. Black & Veatch, as a subcontractor to Brown and Caldwell, isproviding the engineering services for this WTP evaluation. The scope of the evaluation is to cover allnecessary treatment components for reliable 13-mgd production and to include a 20-year net present worthanalysis that includes capital and O&M costs. The report will also discuss components necessary for twofuture expansions of 6.5 mgd each and include recommendations for the design of the water treatmentimprovements.
The City’s primary water source is a surface supply originating in the Bridge Creek watershed. Due to the rawwater quality conditions of the Bridge Creek supply and watershed protection measures implemented by theCity, the City currently meets the requirements for systems using a surface water without filtration as definedin the Safe Drinking Water Act’s (SDWA) Surface Water Treatment Rules adopted by the OregonDepartment of Human Services (ODHS) Drinking Water Program (Oregon Administrative Rules [OAR]333-061-002). The City avoids filtration of the Bridge Creek supply by meeting the disinfection requirementsof OAR.
In January 2006, USEPA issued the LT2 Rule, which formalized disinfection and removal requirements forCryptosporidium oocysts for public water systems (PWSs) treating surface water or groundwater under thedirect influence of surface water. OARs that correspond to the LT2 Rule define monitoring requirementsthat are used to determine the treatment category into which both filtered and unfiltered PWSs will be placedand the required level of Cryptosporidium disinfection credits that must be achieved. For unfiltered watersystems such as the Bridge Creek water source, the Cryptosporidium inactivation requirements are presented inTable 5-2. These additional inactivation requirements must be achieved using chlorine dioxide, ozone orultraviolet (UV) light.

Chapter 5 Water Treatment Evaluation Bridge Creek Supply
5-3
Table 5-2. Cryptosporidium Inactivation Requirements for Unfiltered PWSs1
Average Cryptosporidium concentration, oocysts per liter Cryptosporidium inactivation requirements
≤ 0.01 2 log 2
> 0.01 3 log 2
1 OAR 333-061-0032(3)(e),(3)(f)2 Combined inactivation requirements for Cryptosporidium, Giardia, and virus must be achieved using a minimum of two disinfectantsand each of the disinfectants must separately achieve the total inactivation required for Cryptosporidium, Giardia, or viruses[OAR 333-061-0032(3)(g)].
The addition of UV disinfection will meet the LT2 Rule requirements but will not protect against other waterquality risks such as a long-term turbidity event resulting from a forest fire. In the event of a long-termturbidity event, the Bridge Creek water source would need to be shut down until the turbidity event passed.A new filtration plant will provide additional insurance against the risks of long-term turbidity events andoperational flexibility to address a broader range of water quality issues and future regulations.
This chapter reviews the ability of the following four treatment alternatives to meet the LT2 Rule and toprovide additional protection against a long-term turbidity event:
Alternative 1 – UV Disinfection
Alternative 2 – UV Disinfection with Pretreatment for Turbidity Reduction
Alternative 3 – Conventional Treatment (Coagulation, Sedimentation, and Rapid Sand Filtration)
Alternative 4 – Membrane Filtration (MF or UF) with Pretreatment
This chapter includes evaluation and present worth cost analyses for all major process components with aninitial capacity of 13 mgd and assumes that a new bulk sodium hypochlorite system will replace the existingchlorine gas chlorination system currently used for disinfection of the Bridge Creek source. While chlorine gassystems have proven to be both safe and reliable, conversion from chlorine gas to other methods ofchlorination is an ongoing trend in the water industry. Safety, security, and regulatory compliance are primarydrivers of this trend.
5.2 Existing Facilities
The City’s primary water source is a surface supply that originates in the Bridge Creek watershed. Due to theraw water quality conditions of the Bridge Creek supply and watershed protection measures implemented bythe City, the City currently meets the requirements for systems using a surface water without filtration asdefined in the SDWA’s Surface Water Treatment Rules adopted by ODHS. The City avoids filtration of theBridge Creek supply by meeting the disinfection requirements of the OAR.
Surface water flows in Bridge Creek are supplemented by the diversion of natural springs located in theTumalo Creek drainage basin. Flows from these natural springs are collected in a pond at the Bridge CreekDiversion and transferred through two parallel pipes to a canal flowing to Bridge Creek. The Bridge CreekIntake Facility, located approximately 4 miles downstream on Bridge Creek, is the point of diversion for rawwater that is routed an additional 11.5 miles to the Outback Facility site through two steel transmissionpipelines. At the Outback Facility, the raw water is disinfected with chlorine and then flows through achlorine contact basin to achieve the required disinfection contact time (CT). From the CT basin, waterflows through a series of covered storage reservoirs at the Outback Facility and enters the distribution system.
The City also has an existing well supply which consists of nine well fields. The wells are used to meet supplydemands during peak summer months and when the Bridge Creek raw water turbidity exceeds the City’sinternal turbidity limit of 1 nephelometric turbidity unit (NTU).

Chapter 5 Water Treatment Evaluation Bridge Creek Supply
5-4
5.3 Summary of Raw Water Quality
Three years (2006 to 2008) of historical water quality data for both the Bridge Creek Diversion and the BridgeCreek Intake were provided by the City. Turbidity and temperature data are sampled continuously at theBridge Creek Intake Facility. Additional water quality data are sampled monthly at both the Bridge CreekDiversion and the Bridge Creek Intake. Raw and distributed water total organic carbon (TOC) data are notavailable as unfiltered water systems are not required to measure or remove TOC. Table 5-3 presents asummary of raw water quality data for the Bridge Creek Diversion and the Bridge Creek Intake.
Table 5-3. Raw Water Quality Data
Minimum Maximum AverageWater qualityparameter Unit Diversion Intake Diversion Intake Diversion Intake
Turbidity NTU -- 0.00 -- 5.00 -- 0.34
TemperatureDegreesCelsius
2.7 3.08 3.98 8.43 3.35 5.96
pH units 6.04 6.60 7.98 7.91 6.97 7.33
Conductance µЅ 19.6 29.5 36.0 38.3 32.0 35.8
Ammonia as N mg/L 1 0.02 0.05 0.11 0.05 0.06 0.05
Dissolved oxygen mg/L 10.20 9.72 14.80 13.10 11.96 11.30
Chloride mg/L 0.24 0.27 0.55 0.49 0.34 0.36
Phosphorus total mg/L 0.01 0.02 0.13 0.08 0.05 0.04
Nitrite as N mg/L 0.03 0.00 0.03 0.00 0.03 --
Nitrate as N mg/L 0.01 0.01 0.32 0.11 0.10 0.06
Ortho-phosphate as P mg/L 0.03 0.04 0.16 0.14 0.08 0.06
Sulfate as SO4 mg/L 0.37 0.24 3.63 0.41 0.56 0.33
Fluoride mg/L 0.05 0.05 0.28 0.28 0.15 0.14
Total coliformcoliform per
100 milliliters-- 0.0 -- 0.0 -- 0.0
1 mg/L = milligrams per liter
5.4 Regulatory Review
Current and future regulatory requirements and raw water quality will influence the treatment processselection for the Bridge Creek source. This section provides a summary of recent and future water qualityregulatory requirements that will govern treatment of the Bridge Creek source.
5.4.1 Recent Regulatory Framework
Regulations governing the quality of drinking water have evolved since the enactment of the SDWA in 1974.The pace at which new regulations are issued has increased significantly since the enactment of amendmentsto the SDWA in 1986 and 1996.
The Interim Enhanced Surface Water Treatment Rule (IESWTR) was promulgated in December 16, 1998and took effect February 16, 1999. The IEWSTR primarily addressed filtered water systems, but alsorequired watershed control of Cryptosporidium for unfiltered water supplies. For conventional and directfiltration systems (including those systems utilizing inline filtration), the turbidity level of representativesamples of a system’s filtered water (measured every 4 hours) at each individual filter must be less than orequal to 0.3 NTU in at least 95 percent of the measurements taken each month. The turbidity level of

Chapter 5 Water Treatment Evaluation Bridge Creek Supply
5-5
representative samples of a system’s filtered water must not exceed 1 NTU at any time. Beginning December17, 2001, systems serving at least 10,000 people must meet the turbidity requirements. Systems mustmaintain the results of individual filter monitoring taken under the regulation for at least 3 years. Theserecords must be readily available for State or Health Department representatives to review during sanitarysurveys or other visits.
In January 2006, the USEPA finalized two long-awaited drinking water regulations that impacted U.S. waterutilities, and will require some utilities to make significant changes in their treatment systems to achievecompliance. The Stage 2 Disinfectants and Disinfection Byproducts Rule (Stage 2 DBPR), which is intendedto reduce exposure to potentially harmful disinfection byproducts (DBPs) in drinking water, focuses onreducing DBPs uniformly throughout the distribution system minimizing DBP exposure for all consumers.The intent of the LT2 Rule is to provide additional protection from waterborne disease-causingmicroorganisms, Cryptosporidium in particular, a chlorine-resistant pathogen implicated in several waterbornedisease outbreaks. These two rules were developed concurrently to balance trade-offs in risk between thecontrol of pathogens and the desire to limit exposure to DBPs. For many utilities, the need to achieve higherlevels of treatment to control microbial pathogens while simultaneously meeting the more stringent limits onDBPs will be challenging. Most utilities will want to consider an approach that consists of optimization ofcurrent treatment practices to maximize particulate removal and/or pathogen inactivation capabilities,coupled with the addition of further enhancements and/or new treatment technologies, if necessary, toachieve compliance. A summary of requirements under these two regulations is presented below.
5.4.1.1 LT2 Rule
The LT2 Rule builds upon earlier rules, and applies to all systems that use surface water sources orgroundwater sources subject to direct surface water influence. Systems serving 10,000 or more customersmust initially monitor source water for Cryptosporidium at least monthly over a 2-year period. For unfilteredwater systems such as the Bridge Creek water source, the Cryptosporidium inactivation requirements, whichmust be achieved using chlorine dioxide, ozone or UV light, are presented in Table 5-4.
Table 5-4. Cryptosporidium Inactivation Requirements for Unfiltered PWSs1
Average Cryptosporidium concentration, oocysts per liter Cryptosporidium inactivation requirements
≤ 0.01 2 log 2
> 0.01 3 log 2
1 OAR 333-061-0032(3)(e),(3)(f)2Combined inactivation requirements for Cryptosporidium, Giardia, and virus must be achieved using a minimum of two disinfectantsand each of the disinfectants must separately achieve the total inactivation required for Cryptosporidium, Giardia, or viruses[OAR 333-061-0032(3)(g)].
The City serves a population of approximately 53,000 and has completed 3 years of Cryptosporidiummonitoring. The mean Cryptosporidium concentration resulting from this monitoring is 0.01 oocysts per liter(refer to letter from USEPA in Appendix 5-A), thus requiring a 2.0 log inactivation of Cryptosporidium per thedisinfection requirements of the LT2 Rule presented in Table 4. UV light has been proposed by the City asthe disinfection technology to be used to attain Cryptosporidium inactivation credit.
Following completion of source water monitoring for Crypotosporidium, filtered water systems must determinea Cryptosporidium bin concentration for each plant for which monitoring was required. The final binclassification will determine the level of additional Cryptosporidium treatment over and above the levelscurrently provided by their conventional processes, as listed in Table 5-5. Systems can choose technologies tocomply with these additional treatment requirements from a microbial toolbox of options outlined in the LT2Rule. Microbial toolbox options include improved watershed control, improved treatment system and/ordisinfection performance, and provision of additional treatment barriers.

Chapter 5 Water Treatment Evaluation Bridge Creek Supply
5-6
Table 5-5. Treatment Bin Classification, Additional Cryptosporidium Treatment Requirementsfor Conventional Clarification/Filtration (including softening)
1
Average raw water Cryptosporidiumconcentration, oocysts per liter
Treatment binclassification
Additional Cryptosporidium inactivation/removalrequirements
< 0.075 1 None
0.075 to < 1.0 2 1-log
1.0 to < 3.0 3 2-log 2
≥ 3.0 4 2.5-log 2
1 OAR 333-061-0032(4)(f)(F)2At least 1-log additional treatment must be provided by bag filters, bank filtration, cartridge filters, chlorine dioxide, membranes, ozone and/or UV.
As previously noted, the mean Cryptosporidium concentration in the raw water is 0.01 oocysts per liter. Shouldthe City implement filtration of the Bridge Creek source, the City will be classified in Bin 1 under the LT2Rule. A direct filtration or conventional treatment plant will meet the treatment requirements for Bin 1 andadditional treatment (i.e., UV, ozone, etc.) for Cryptosporidium inactivation will not be required.
The LT2 Rule also includes new requirements for disinfection profiling/benchmarking for those systems thatplan to make significant changes in disinfection practices. Following completion of the initial round ofsource water Cryptosporidium monitoring, systems that will need to make significant changes in disinfectionpractices in order to maintain compliance with the LT2 Rule and/or the Stage 2 DBPR will be required todevelop disinfection profiles and calculate disinfection benchmarks for Giardia lamblia and viruses. Prior tomodifying the disinfection process, systems must notify the state, and must submit the following information:
A completed disinfection profile and benchmark for Giardia lamblia and viruses.
A description of the proposed change(s) in disinfection practice.
An analysis of how the proposed changes will affect the current level of disinfection.
Significant changes to disinfection practice are defined in the LT2 Rule as the following:
Changes to the point of disinfection.
Changes to the disinfectant(s) used in the treatment plant.
Changes to the disinfection process.
Any other modification identified by the state as a significant change to disinfection practice.
In preparing the disinfection profile and benchmark, systems must monitor disinfection conditions at leastweekly for a period of 12 consecutive months to assess total log Giardia and virus inactivation levels. Systemsmust determine log Giardia inactivation through the entire plant based on published CT values, and log virusinactivation through the entire plant based on a state-approved protocol. Systems that have at least 1 year ofexisting disinfection monitoring data may utilize that information in preparing the disinfection profiles, andup to 3 years of existing data may be used in preparing the profiles (assuming that no changes in disinfectionpractices or source water were made during the period that the existing data were collected). The disinfectionbenchmark is the lowest monthly mean value (for systems with 1 year of profiling data) or the average of thelowest monthly mean values (for systems with more than 1 year of profiling data) of Giardia and virus loginactivation in each year of profiling data. Key dates for compliance with the LT2 Rule are summarized inTable 5-6.

Chapter 5 Water Treatment Evaluation Bridge Creek Supply
5-7
Table 5-6. Key Dates for Stage 2 DBPR Compliance(Systems Serving 50,000 to 99,999 Consumers) 1
Activity Compliance date
Deadline for initiating source water monitoring program (month beginning) 04/01/2007
Deadline for completion of source water monitoring program 03/31/2009 2
Submit source water monitoring report with bin placement recommendation (month beginning) 3 09/01/2009
Deadline for compliance with additional treatment requirements 4 10/01/2012
Initiate second round of source water monitoring (month beginning) 10/01/2015
1OAR 333-061-0032(1)(F)(iii)2Monitor Cryptosporidium, E.coli, and turbidity; minimum of once per month for 2 years3Refer to letter to USEPA in Appendix 5-A.42-year compliance extension may be granted (with state approval) if capital improvements are required for compliance. Extension is contingenton City actually working toward compliance. Public notification is also required.
5.4.1.2 Stage 2 DBPR
Under the Stage 2 DBPR, systems will be required to maintain running annual average total trihalomethane(TTHM) concentrations of 0.080 mg/L or lower and haloacetic acid (HAA5) concentrations of 0.060 mg/Lor lower at each compliance monitoring location within the distribution system, rather than following thecurrent practice of averaging the results for all system monitoring locations. Initial compliance efforts willfocus on identifying points within the system where DBP concentrations are typically highest, and for mostsystems will involve 1 year of expanded monitoring of TTHM and HAA5 concentrations. This monitoring,referred to as the Initial Distribution System Evaluation (IDSE) process, must be conducted in addition tothe routine quarterly compliance monitoring required under the Stage 1 DBPR, and results will be used toselect new routine compliance monitoring sites. Options under which systems can meet the IDSE provisionsof the Stage 2 DBPR include collection of new system DBP data through a Standard Monitoring Program(SMP) or the use of qualifying existing system DBP monitoring data or data from extended-period simulationhydraulic models capable of predicting water age within the system through a System Specific Study. Systemsthat can certify that all of their recent existing DBP monitoring results are equal to or less than half of theTTHM and HAA5 maximum contaminant levels (MCLs) will be able to obtain exemptions from IDSEmonitoring requirements. Schedules for submittal and approval of proposed IDSE monitoring plans, actualsystem monitoring, and report submittal are phased based on system size.
Under the Stage 2 DBPR, the required number of routine system DBP monitoring sites will be expanded forsystems serving more than 50,000 consumers from the current requirement of four sites per treatment plantunder the Stage 1 DBPR to as many as 20 sites. The new routine monitoring sites selected followingcompletion of the required IDSE monitoring must include those sites identified as exhibiting the highestDBP concentrations, and at least one quarterly monitoring period must reflect periods of peak historical DBPformation (or highest water temperature).
The Stage 2 DBPR will also introduce an Operational Evaluation requirement that is intended to serve as anearly warning of pending DBP compliance problems to allow systems to initiate prior corrective measures.The Operational Evaluation must be conducted quarterly for each routine system monitoring location. AnOperational Evaluation level is exceeded at any monitoring location where the sum of the two previousquarters’ DBP results (TTHM or HAA5) plus twice the current DBP resulted, divided by 4 to derive anaverage, exceeds the MCL for that specific DBP. While exceeding an Operational Evaluation level is notconsidered a regulatory violation, the utility would be required to examine its treatment and distributionoperational practices, and to submit a written report to the ODHS not later than 90 days after receiving theDBP analysis that caused the exceedence.
Key dates for compliance with Stage 2 DBPR requirements are summarized in Table 5-7.

Chapter 5 Water Treatment Evaluation Bridge Creek Supply
5-8
Table 5-7. Key Dates for Stage 2 DBPR Compliance(Systems Serving 50,000 to 99,999 Consumers) 1
Activity Compliance date
Deadline for initiating IDSE monitoring (SMP) 04/01/2007
Deadline for completion of IDSE monitoring (SMP) 03/31/2009
Submit report summarizing IDSE results and recommended revised DBP monitoring points 07/01/2009
Initiate Stage 2 DBPR quarterly compliance monitoring at revised monitoring points 010/01/2012
1OAR 333-061-0030(2)(b)(A)
A review of the City’s 2006 and 2007 Consumer Confidence Reports indicates that the City currently meetsthe requirements of the Stage 2 DBPR.
5.4.1.3 Endocrine Disrupting Compounds (EDCs)/Pharmaceuticals and
Personal Care Products (PPCPs)
EDCs interfere with the natural action of hormones in the body, and are thought to interfere with thereproductive systems of both wildlife and humans. EDCs include PPCPs such as antibiotics, prescriptiondrugs, shampoos, cleansers, etc., and may be introduced into water supplies through discharge of treatedwastewater flows. Even though the technology to detect these compounds in drinking water is now available,their potentially harmful effects are still largely unknown. To date, the documented levels of thesecompounds are generally very low (at the low end of the nanograms per liter or parts per trillion range). Mostdrinking water standards are set in the mg/L (parts per million) or µg/L (parts per billion) range, which are1,000 to 10,000 times higher than the levels at which EDCs are typically detected in water supplies.Technologies to remove EDCs from water supplies may involve adsorption, rejection (nanofiltration andreverse osmosis), or oxidation. If EDCs are regulated in the future, additional or replacement treatmentprocesses would be necessary at most treatment facilities. However, significant research remains to beconducted in order to develop an adequate understanding of removal capabilities for different treatmentprocesses.
EDCs and PPCPs have an extremely low probability of occurrence in the raw water supply as there are nowastewater discharges upstream of the Bridge Creek Intake Facility. In addition, pets and camping are notallowed in the watershed, but the watershed is open to the public with registration of use required at entrybased on an honor system.
5.4.2 Filter Backwash Recycling Rule (FBRR)
The FBRR was promulgated as a separate regulation during June 2001. Provisions of the FBRR addressingin-plant recycling of waste streams apply to all systems using filtration treatment. In addition to filterbackwash flows, recycle streams covered under this regulation consist of sludge thickener supernatant, andflows associated with sludge dewatering processes. Recycle streams may contain Giardia and Cryptosporidiumcysts, as well as other contaminants removed during the treatment process. Therefore, treatment plants thatpractice recycle of these streams within the treatment scheme must return them to a location such that all unitprocesses of a system’s conventional or direct filtration process are employed in the treatment of the recycleflow. (This location will typically be the inlet to the plant prior to the addition of coagulant.) All systems thatrecycle these flows must submit a plant process schematic to the ODHS for review showing the currentrecycle return location and the proposed return location that will be used to establish compliance. Data ontypical recycle flow rates, maximum recycle flow rates, and the plant design capacity and state-approvedmaximum operating capacity must also be submitted to the state regulatory agency. Systems must collect andmaintain additional information on filter operating data, recycle flow treatment provided, physical dimensionsof recycle flow equalization and/or treatment units, and recycle flow rate and frequency data for review andevaluation by the state regulatory agency.
Chapter 5 Water Treatment Evaluation Bridge Creek Supply
5-9
5.4.3 Clean Water Act (CWA)/Resource Conservation and Recovery
Act (RCRA)
CWA/RCRA rules affect WTPs that use coagulants and create flocculated residuals. While most treatmentprocesses will produce one or more types of residuals, the amount of residuals produced is a function of rawwater quality, facility design and operating flow, and treatment process employed. Flocculated residuals fromclarification and filter backwash or membrane back pulse contain aluminum or iron hydroxides from thecoagulant, natural organic matter and particulates removed from the raw water, and often, low levels ofmanganese, or arsenic concentrated from the raw water or the coagulant. Residuals must be managed anddisposed of in a legally acceptable manner. The initial step for residuals management is separation of theliquid decant or backwash from the solid coagulated material. Equalization and settling are effective atseparating the liquid from the solids. The liquid decant and settled backwash is frequently blended into theraw water at the head of the plant so as to minimize loss of valuable water available for production. Recyclestreams must comply with the FBRR. If recycle is not feasible, discharge back to a surface water body or to awastewater treatment plant may be undertaken with proper permitting. The remaining semi-solids arethickened and disposed of at landfills, composting operations (sometimes commingled with wastewatertreatment plant residuals), or land application. Depending on the type and extent of residuals treatment,residuals treatment costs can be a major consideration in the evaluation of overall process life cycle costs.
5.5 Design Basis Of Alternatives
This section discusses the design basis of alternatives.
5.5.1 Plant Capacity
The City has targeted an initial maximum capacity of 13 mgd for this facility which is based on its initial waterright. It is anticipated that the WTP will undergo two 6.5 mgd expansions in the future for a build-out plantcapacity of 26 mgd. This chapter is focused on the major process trains required for each treatment expansionalternative. The preliminary design will address the full range of plant components, but for the purposes of thistreatment evaluation it is assumed that the following components will be required for all treatment alternatives:
New hydropower after-bay and raw water pump station sized for the initial capacity of 13 mgd andexpandable to 26 mgd (capital costs for the after-bay and raw water pump station are included in thehydropower facility costs)
New bulk hypochlorite system sized for the initial capacity of 13 mgd and expandable to 26 mgd
Use of existing and/or new Outback Facility reservoirs as CT basins
5.5.2 Disinfection Requirements
The performance of MF/UF membrane systems is superior to conventional filtration in removal of Giardia andCryptosporidium. The membrane filtration process provides a physical barrier to these pathogens. Conventionalfiltration is effective at removing them in a chemical and/or physical process; however Giardia andCryptosporidium can pass through the granular media if not properly operated, or if the filters experience an upset(e.g., turbidity breakthrough). Properly functioning conventional filtration plants are generally given credit bythe ODHS for the required 2-log removal of Cryptosporidium (3-log removal required under the pending LT2Rule) , and are typically given credit for 2.5-log Giardia removal. The additional 0.5-log Giardia credit mustcome from disinfection. To prove effective treatment, the filter effluent turbidity must be maintained withinthe limits set by ODHS for each type of filtration. Due to the City’s bin classification under the LT2 Rule,additional treatment (i.e., UV, ozone, etc.) for Cryptosporidium inactivation beyond 3-log will not be required forthe conventional treatment alternative and is not included in this evaluation.

Chapter 5 Water Treatment Evaluation Bridge Creek Supply
5-10
Membrane systems are generally credited with higher removal of Giardia and Cryptosporidium than that ofconventional treatment plants. Membrane systems are typically granted 4-log Giardia and Cryptosporidiumremoval credit by ODHS. However, membrane based systems must still provide virus inactivation throughchlorine disinfection in addition to the removal credits for the membrane systems. The level of virusinactivation required may vary from 2-log to 4-log depending on the membrane manufacturer.
Chlorination will be required for all treatment alternatives for additional disinfection and/or for residualmaintenance. This chapter assumes that all treatment alternatives will require an effective clearwell fordisinfection residence time. It is assumed that one or more of the existing or new reservoirs at the OutbackFacility site will be used as a clearwell.
The required disinfection requirements for each treatment alternative are summarized in Table 5-8.
Table 5-8. Disinfection Requirements for Each Treatment Alternative
Alternative 1 –UV Disinfection
Alternative 2 –UV Disinfection with
Pretreatment
Alternative 3 –Conventional
Treatment
Alternative 4 –MembraneFiltration
Removal/inactivation requirement
Cryptosporidium 2-log 2-log 3-log 3-log
Giardia 3-log 3-log 3-log 3-log
Viruses 4-log 4-log 4-log 4-log
Removal/inactivation credit by filtration or UV
Cryptosporidium 2-log 1 2-log 1 3-log 4-log
Giardia 2.5-log 2.5-log 2.5-log 4-log
Viruses None None None None
Chlorine disinfection requirement
Cryptosporidium None None None None
Giardia 0.5-log 0.5-log 0.5-log None
Viruses 4-log 4-log 2 to 4-log 4-log
1 Assumes UV system sized for 2.5-log Cryptosporidium inactivation (includes 0.5-log safety factor) which also provides greater than 2.5-log Giardiainactivation.
5.6 Criteria for Evaluating Alternatives
The treatment technology alternatives will be evaluated according to the following criteria:
Capital Cost. Capital costs for this evaluation include the cost of all major treatment plantcomponents including treatment equipment, installation, ancillary equipment, buildings andstructures to house the treatment system, miscellaneous site work and site piping as needed toincorporate the new treatment system, and contingency allowances.
Operation and Maintenance (O&M) Costs. These costs include annual costs and recurring filter mediaand equipment replacement costs. Annual costs include staffing, power, utilities, chemicals, and UVequipment replacement (lamps, sleeves, ballasts, and sensors). Recurring costs include partialreplacement and rehabilitation of ancillary equipment (pumps, valves, etc.) at 20 years, andreplacement of filter media or membranes at 10-year intervals.

Chapter 5 Water Treatment Evaluation Bridge Creek Supply
5-11
Water Quality Risks. The primary water quality risk to the Bridge Creek source is a forest fire whichwould likely increase soil erosion and turbidity in Bridge Creek. Some alternatives will not beeffective or as effective if there are significant changes in the raw water quality due to a forest fire orother catastrophic water quality event. In addition, some alternatives will not be effective or aseffective in treating regular turbidity excursions that occur during spring snow melt.
Staffing, Operability, and Automation. The evaluation of needed plant staffing and operability includesthe number of labor hours, or staff full-time-equivalents (FTEs). Automation also affects the neededstaffing levels, staff skill sets, and the reliability of operation without operator attendance.
Expandability. The initial plant expansion will have a capacity of 13 mgd; however, it must beexpandable by an additional 13 mgd (two 6.5 mgd expansions) without a major disruption ofoperation.
Operational Flexibility. Some alternatives are more able to respond to sudden changes in raw waterquality.
Site Compatibility. Some alternatives may require a larger footprint, making it more difficult to fit thenew facilities into the site.
5.7 Treatment Process Alternatives
The following gives a general discussion of UV disinfection and the treatment processes that are availablewithin the conventional and membrane treatment categories. A description of the recommended alternativefor each treatment process is also provided.
5.7.1 UV Disinfection
The use of UV light to disinfect drinking water is a reliable and cost-effective technology for meeting theinactivation requirements mandated under the LT2 Rule for public water systems that treat surface water,including unfiltered surface water supplies such as the Bridge Creek source. UV light also does not formany disinfection byproducts. Its application to drinking water treatment is described in the USEPAUV Disinfection Guidance Manual (2006), including procedures for the validation, design, and control ofUV systems for the inactivation of Cryptosporidium, Giardia, and viruses. It should be noted that UV is noteffective for virus inactivation at the typical design dose for Cryptosporidium and Giardia.
The mechanism of UV disinfection occurs via absorption of UV light in the germicidal spectrum (200 to300 nanometers) by the cellular nucleic acids, resulting in photochemical damage to the microorganisms’nucleic acids, consisting of deoxyribonucleic acid (DNA) and/or ribonucleic acid (RNA). The geneticinformation of a microorganism is mapped in the specific order of the nitrogenous bases of the DNA orRNA genome. The UV inflicted damage to the nitrogenous bases physically inhibits enzymes used fornucleic acid synthesis and thus blocks copying of the damaged strand during replication, rendering themicroorganism inactive.
The UV light entering a water volume is influenced by reflection, scattering of light, shadow effects, andabsorbance of the light by other compounds or particles in the water matrix in addition to microorganisms.The UV intensity, or the magnitude of UV light entering the water, as well as the UV absorbance of water(measure of the amount of UV light absorbed by the water matrix, which is therefore unavailable fordisinfection) are two important factors in monitoring the energy applied to the water. UV dose is a product ofthe UV intensity that a microorganism population is exposed to (mW/cm2) and the time of exposure(s),expressed as the energy per unit area (mW-s/cm2 or mJ/cm2) applied to water. Therefore the residence time ofthe water within a UV reactor, or flow rate, is an additional factor impacting the disinfection performance of aUV system.

Chapter 5 Water Treatment Evaluation Bridge Creek Supply
5-12
Together with flow rate, the UV transmittance (UVT) of a water source is a primary criterion in sizing a UVsystem. Water with lower UVT (or higher absorbance of UV wavelengths) will require higher energy outputsfrom the UV system. The UVT is calculated from the UV absorbance data using the following equation:
UVT = 100*10-A
Where A = UV absorbance (based on a 1 centimeter path length)
Other water quality data important in the design of a UV system include temperature, pH, alkalinity,aluminum, iron, magnesium, manganese, hardness, and total organic carbon because they can have an impacton the fouling rate of the UV system. Other than temperature, pH, and alkalinity, many of these water qualityparameters have not been collected for the Bridge Creek supply. The City recently purchased a UVT analyzerto collect UVT data for the Bridge Creek Supply.
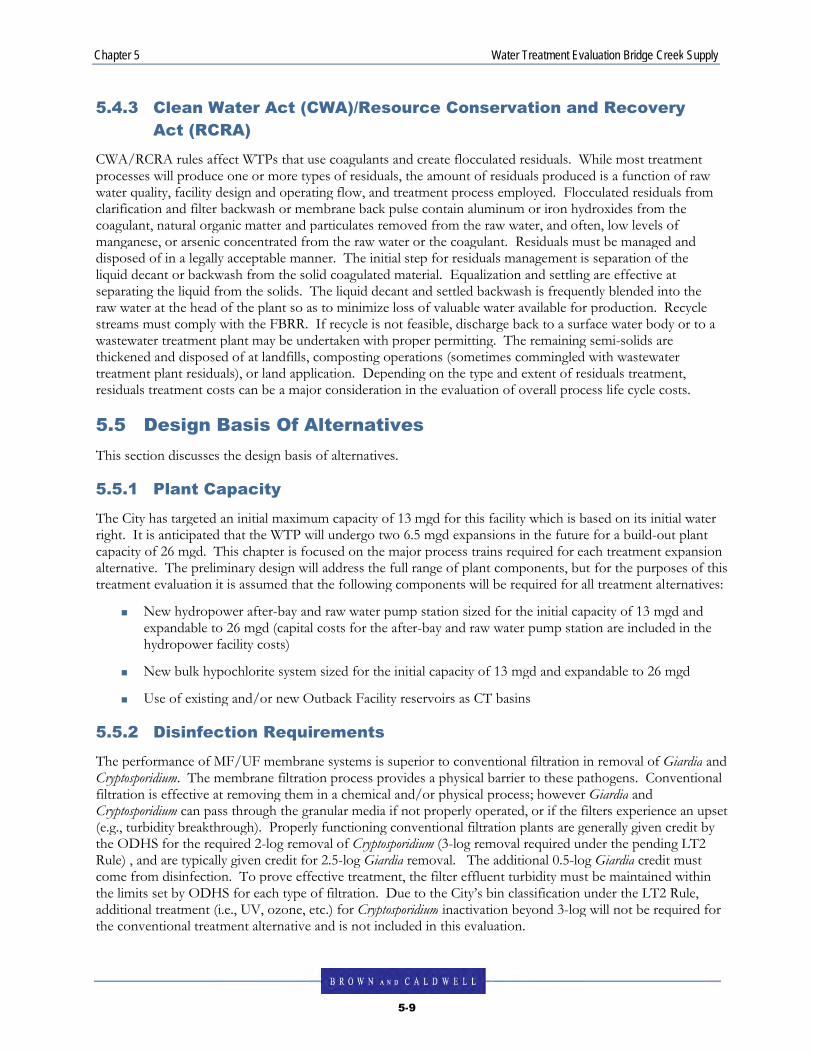
5.7.1.1 UV Recommendation – Treatment Alternative 1
The required number of UV reactors will be determined during preliminary design. UV systems costs for thisevaluation are provided as a cost per mgd rather than a specified number of UV reactors. The UV reactorswould be installed in a new UV building with space allocated for three to four UV reactors at plant build-out.
A process schematic for UV disinfection is presented in Figure 5-1. A conceptual site layout for UVdisinfection is presented in Figure 5-2.
5.7.1.2 UV with Pretreatment Recommendation – Treatment Alternative 2
This UV recommendation is the same as Alternative 1 with the exception of the addition of pretreatment forturbidity reduction upstream of the UV reactors. Pretreatment would likely consist of a high-rate clarificationprocess such as the Actiflo® process described in Section 5.2.7.1. Pretreatment would be used to reduce rawwater turbidities from 5 NTU to approximately 1 NTU to meet the City’s internal turbidity limits. A processschematic for UV disinfection with pretreatment is presented in Figure 5-3. A conceptual site layout for UVdisinfection with pretreatment is presented in Figure 5-4.
It should be noted that this alternative cannot be used when the raw water turbidity exceeds 5 NTU. Tomeet the filtration avoidance criteria, the raw water source must be shut down until the raw water turbidityreturns to 5 NTU or less. OAR 333-061-0030 states that for systems which do not provide filtration, sourcewater turbidity must be less than or equal to 5 NTU immediately prior to the first or only point ofdisinfection.

-
•:,
:.
1o
//
\c_______
AI
-Z
LA
.1’.1
IN
1.
.t,
•/
—-
.-.4
——
,-—-—
-.—
.—
.—
u-.
HH-
>:
!L
4—
//
_
-:-
: .‘
::
.
‘i—
zL
‘P0
—
/
/..r.
...
.
k7//
JI
.-_/
/
/7!
‘%
.\N
I
&\
Iç
s.
.,
.N
’./
S\7-
S..
\.4
//
‘—
.4
)t\/Y
/-
I -:
.1I
‘WY
./
N.k
>/
/.r
J\
I
:2/ç
(7,/s
-•-:
,>.f/’i/
-4j-
.-
.—/4”
//
4‘—
_.____
_._.
//.5/
,/
/L
—I
—/
/cS
-- -‘I7_/7
//1
/.1
/7
.I
/‘-,
---
‘5/F
——
//;-‘
-----,\
71
I’I
1CS
51/
-/
.-
1/
/-U
<‘,
//
I‘
-,,4
1/
I/I
U-c
’)\
/I
1/
//
;/.,:
7-
1/
I-.
5/—’
->..
.../
IC‘‘:/
P/
-.)-
.*.--
),-1
fl1C
)4
‘—I
—
DH
ID-
Cl)fl
r-
--<
-..
m‘-
o‘-
rn
L—
In
spit
I
1.
5/
(:12.
41-/S
z—
—-I
C,
0000
.o9o
Fil
l
0> 0 I


r4.‘S
/
//
/
QLU
--
Q..
LYZc)
>cx
Q1
-..-JU
JC
iLU
cLL
C,),
I-.•øciC’.J
I—i
/Lu
U)
C.,
LU
U0)
Q_
Q_
LU
.-I
,-CS
JC
•U
)C
DI
\
‘3CDLuLu
Lu0
NL
u
-j
0(I)
bzI..)
‘U)
\/
/\
/
//
//
C.,
/

Chapter 5 Water Treatment Evaluation Bridge Creek Supply
5-17
5.7.2 Conventional Treatment
Conventional treatment is defined as coagulation, flocculation, and sedimentation followed by granular mediafiltration. Conventional treatment has been shown to be capable of effectively removing turbidity,manganese oxide particles, color, disinfection by-product precursors, viruses, bacteria, Giardia cysts, andCryptosporidium oocysts. Following is a description of the conventional treatment process.
5.7.2.1 Coagulation, Flocculation, and Sedimentation Options
In conventional coagulation, flocculation, and sedimentation pretreatment, a coagulant chemical, such asaluminum sulfate, polyaluminum chloride, aluminum chlorohydrate, or iron-based sulfates or chlorides, isadded to the raw water and dispersed thoroughly in a rapid mix process. Next, flocculation of the chemicalwith particulates and dissolved organic matter occurs in a tank or series of tanks in order to allow the particlesto agglomerate into larger, more settleable floc. During sedimentation, these large floc particles are removedfrom the water by gravity. Table 5-9 presents typical design parameters for these processes.
Table 5-9. Typical Design Parameters for Conventional Pretreatment Processes
Process Residence time Function Mixing intensity, G
Rapid mix 1 to 30 seconds Disperse coagulant chemicals 3,000 to 7,000
Flocculation 20 to 45 minutesForm large aggregates (floc) 70 to 20
Sedimentation –conventional
2 to 4 hours Remove the bulk of the floc to reduceloading on the filters
0
Sedimentation – platesettlers
0.5 hour Remove the bulk of the floc to reduceloading on the filters
0
There are variations on the conventional coagulation filtration process that have been developed to replacesedimentation with other clarification processes. For raw water with significant natural organicconcentrations or high levels of algae, dissolved air flotation (DAF) may be appropriate. Where space forexpansion or retrofit is extremely limited, ballasted flocculation has been used. Descriptions of both of thesealternative clarification processes follow.
DAF is a high-rate clarification process that is available from several manufacturers. In the DAF process, rawwater particles are flocculated with coagulants and seeded with micro-bubbles and then separated out of thewater by floating to the surface, as opposed to settling to the bottom of a basin. For this reason, DAF isbetter suited for light particles that tend to float or have near neutral buoyancy.
A DAF system consists of air compressors, recirculation pumps, and saturators (or dissolving tanks) and theDAF basin in which solids flotation and separation takes place. The process introduces micro-sized airbubbles through diffusers at the bottom of the DAF basin to float the floc. The air bubbles are produced byrecycling a portion of the effluent through the saturator, or dissolving tank, where air is introduced underpressure, resulting in water that is saturated with air at the increased pressure, but substantially supersaturatedwith air when exposed to atmospheric pressure. The pressurized stream is then reduced to ambient pressure,releasing the micro-bubbles. This effect is similar to opening a can of soda. As the micro-bubbles arereleased, they attach to solid particles, and float to the surface. The floated sludge is removed from the top ofthe basin by mechanical or hydraulic means, while the clarified water is removed through an under bafflebeneath the water surface. Typical design criteria for the DAF process are presented in Table 5-10.

Chapter 5 Water Treatment Evaluation Bridge Creek Supply
5-18
Table 5-10. Typical Design Parameters for the DAF Process
Process Residence time Comments
Rapid mix 1 to 2 seconds Coagulant added and dispersed
Flocculation 5 to 15 minutes High intensity flocculation, forms tight floc
Flotation 40 minutes Inject micro-sized air bubbles (form around floc)
Flotation – e.g., AQUADAF, ClariDAF 15 minutes High-rate DAF
Figure 5-5 illustrates the DAF process.
Figure 5-5. DAF Process
Actiflo Ballasted Flocculation (Actiflo) systems accelerate the clarification process by applying microsand towhich the floc is attached through the addition of a polymer. The microsand is recovered during settling andseparated from the floc in a hydrocyclone while the clarified water continues to the filters. A key to thesuccess of ballasted flocculation lies in the ability to identify the appropriate polymer to use in conjunctionwith the primary coagulant. Once this is accomplished, the ballasted flocculation process can provide a highdegree of treatment at extremely high loading rates for varying water qualities. Very compact facility layoutsresult and significant construction cost savings can be achieved compared with a conventional sedimentationbasin. The tradeoff is a continuing operational cost for the microsand and microsand handling facilities, andpolymer as well as coagulant. Process control can also be critical—changes in raw water quality orintermittent operation of the plant can lead to process upsets or clarified water that may not meet waterquality targets. Typical design parameters for the Actiflo process are presented in Table 5-11.
Table 5-11. Typical Design Parameters for the Actiflo Process
Process Residence time, minutes Comments
Coagulation 2 Coagulant added before coagulation chamber; begin to form floc
Injection 2 Micro-sand and polymer are added
Maturation 4 Complete process of attaching floc to micro-sand
Sedimentation 8 Includes tube settlers or plate settlers

Chapter 5 Water Treatment Evaluation Bridge Creek Supply
5-19
Figure 5-6 presents a schematic of the Actiflo process.
Figure 5-6. Actiflo Schematic
5.7.2.2 Granular Media Filters
Granular media filters are used as a final barrier after the coagulation, flocculation, and sedimentation/clarification processes. Granular media filters are categorized as gravity or pressure filters. Most installationslarger in size than 1 mgd use gravity to eliminate the added expense of constructing pressure vessels. Themaximum headloss for most gravity granular media filters is between 8 and 10 feet and is dependent upon themaximum water depth above the filter. Filter productivity is defined as the amount of water that can befiltered starting with a clean filter before it reaches maximum headloss or turbidity breakthrough. Typically,filters with adequate pretreatment can operate between 24 and 96 hours at filtration rates of 6 gallons perminute/square foot (gpm/sf) before either reaching the headloss limit or experiencing poor filtered waterquality. This would equate to a productivity of 9,000 to 36,000 gallons per square foot.
The effective size of the media has a significant impact on the rate of headloss in the filter. Coarse media, ingeneral, allow for greater penetration of particles within the filter bed compared with fine media. Thistranslates to a lower rate of headloss accumulation, longer filter runs, and potentially greater waterproduction. Conversely, because fine particles tend to penetrate further within coarse media, greater depthsof coarse media than fine media are necessary to achieve the same particle capture. Many filters areconstructed of layers of different media with different size and density characteristics to provide optimalfiltration capacity. Dual media filtration generally consists of a layer of anthracite coal or granular activatedcarbon (GAC), over a layer of sand. The upper layer (anthracite or GAC) is relatively coarse, which allowsfor a greater penetration of particles in the filter bed, thus minimizing headloss. The lower sand layer has afiner gradation than the upper layer and functions as a second barrier to remove fine particles.
SLUDGESLUDGE
HYDROCYCLONEHYDROCYCLONE
POLYMERPOLYMER
RAW
WATER
RAW
WATER
COAGULANTCOAGULANT
COAGULATIONCOAGULATION
INJECTIONINJECTION
MATURATIONMMAATTUURRAATTIIOONN
TUBE SETTLER
WITH SCRAPER
TUBE SETTLER
WITH SCRAPER
CLARIFIED
WATER
CLARIFIED
WATER
BALLASTED FLOCS
TO HYDROCYCLONE
BALLASTED FLOCS
TO HYDROCYCLONE
MICRO-SANDMICRO-SAND

Chapter 5 Water Treatment Evaluation Bridge Creek Supply
5-20
5.7.2.3 Direct Filtration
Direct coagulation and flocculation, also called direct filtration, is similar to conventional treatment. Themajor difference is that in a direct filtration process, the floc is removed by the filters and not through asedimentation or advanced clarification process. Direct filtration is more suitable for better quality surfacewaters, with low turbidity values (typically less than 10 NTU). The direct process results in a smallerfootprint than the conventional treatment process. However, removal credit based on the direct treatmentprocess is 2.0-log for Giardia, 1.0-log for viruses, and 2.0-log for Cryptosporidium. The remaining microbialinactivation must be obtained through disinfection. An example of a direct filtration plant is the EugeneWater & Electric Board’s Hayden Bridge Water Filtration Plant, which is operated as a direct filtration plantin the summer and as a conventional filtration plant in the winter.
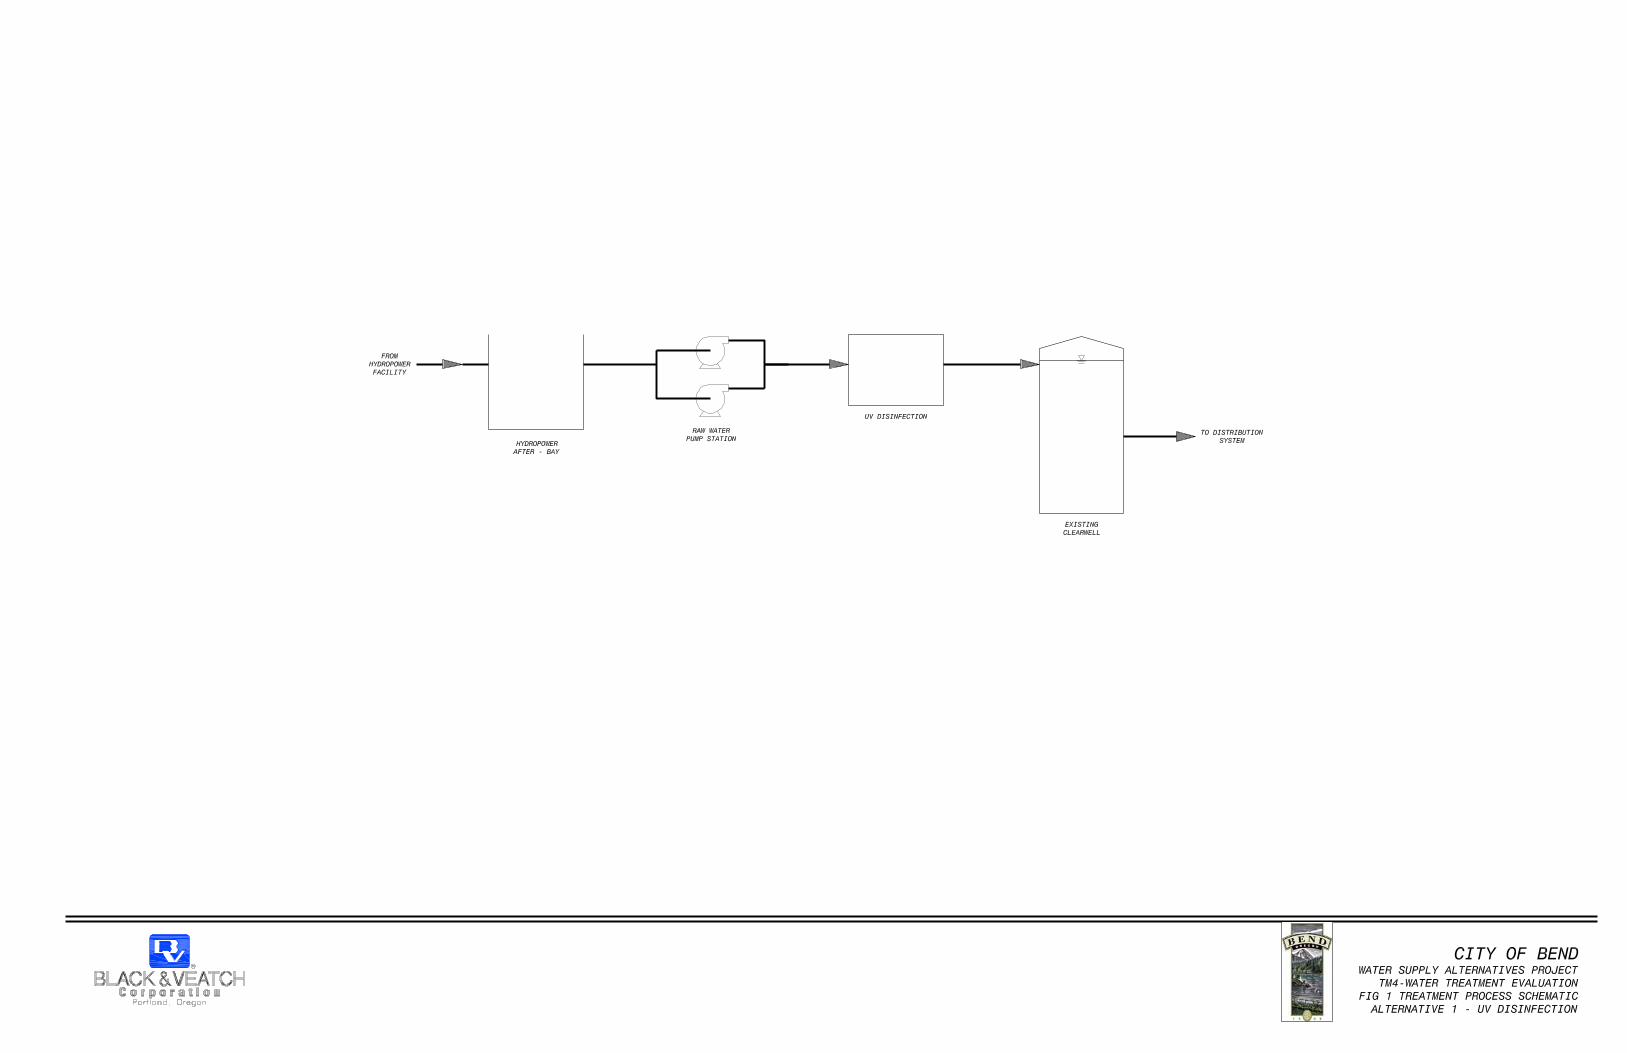
5.7.2.4 Conventional Treatment Recommendation – Treatment Alternative 3
For this project, a combination of direct filtration and conventional filtration treatment is assumed. Rawwater turbidity is typically less than 0.5 NTU which falls within the limits of direct filtration. In the event of aforest fire, turbidity could increase significantly and other water quality parameters could change dramatically.Direct filtration would continue to be suitable for turbidities up to 10 NTU (typical peak turbidity events forBend are approximately 5 NTU). If turbidity exceeds 10 NTU, additional pretreatment will be required. Forturbidity events of 10 NTU (characteristic of a forest fire) or higher, a ballasted flocculation system sized forhalf of the plant capacity, or 6.5 mgd, has been assumed. A ballasted flocculation system sized for 6.5 mgdwould provide operational flexibility to treat a wide range of water quality issues but at reduced flows. Asecond 6.5 mgd ballasted flocculation system could be added if the duration of poor raw water qualityconditions and demands dictate. Under normal operating conditions, the ballasted flocculation system wouldbe bypassed.
Four 3.25-mgd granular media filters would follow pretreatment. It is assumed that new filters can operatesuccessfully at up to 6 gpm/sf. A total filter area of 2,000 square feet would provide 13 mgd firm filtrationcapacity (firm capacity assumes one filter is out of service for backwashing).
For a plant of this size, filter boxes are typically constructed of site-built concrete; however, filter boxes couldalso be fabricated aluminum or factory-built. For the purposes of this evaluation, it is assumed that the filterboxes will be constructed of concrete. A filtered water wet well is assumed for collection of filtered water. Afiltered water pump station will be required to pump filtered water from the wet well to the clearwell(s) andwill also house the backwash pumps.
Backwash waste lagoons will be required to store and settle the filter backwash waste. For this evaluation, it isassumed that decant from the lagoons will be recycled back to the head of the plant. Recycling of filterbackwash flows will reduce the raw water supply requirements by approximately 5 percent (or 0.65 mgd cubicfeet per second at 13 mgd plant flow) but will also recycle contaminants removed during the filtration processback into the treatment process. Recycling of filter backwash flows will require the addition of a small pumpstation.
Discharge of decant to Tumalo Creek may be allowed and will require the City to obtain a National PollutantDischarge Elimination System permit. Handling of filter backwash flows should be evaluated further duringdetailed design.
It should be noted that the existing raw water quality will be difficult to treat conventionally due to the verylow turbidity of the raw water. Bench scale testing is recommended prior to the selection of conventionaltreatment of the Bridge Creek source.
A process schematic for conventional treatment is presented in Figure 5-7. A conceptual site layout forconventional treatment is presented in Figure 5-8.

0
!—c,,
Q_
00
zLU
LU_
J-
U)
CL)C
’)
DC
L)
OcZ
L0
00
LL
JQ
0L
LJC
D
)I
II
IL
l.ILU
O
LUU
.U
.U
.00
u.
I.._JL
UO
L
t-
I-I—
.I—
::L
jO
qLU
‘-
oq_
OuJ
I—il--
.q
I—Ij
LLUc
Q-i
>-Q
LU
LLjI—
Li.
IC
’)
—I
/.
//
//,/
,\
1’
4tt
L+
0C)If)
C)0F—
C)0C
i)
I”
0U0
/
i..I
//
I!do
ô
-j
—/

Chapter 5 Water Treatment Evaluation Bridge Creek Supply
5-23
5.7.3 Membrane Filtration
Based on our review of the City’s water quality data, membrane filtration is a viable alternative. The benefitsof membranes include the following:
It provides a high quality, low turbidity filtered water.
Physical barrier provides low turbidity filtered water and high log removal values for cysts (Giardiaand Cryptosporidium).
Unlike conventional treatment, finished water quality is independent of upstream raw water andpretreatment conditions. Therefore, changes in raw water quality or an upset of the pretreatmentprocess (e.g., loss of coagulant feed) will not affect the microbial log removal or turbidity of thefiltered water. Although changes in raw water quality do not impact the quality of the filtered water,the membranes may operate at reduced capacity during degraded raw water quality conditions.
Automated process allows some costs savings due to minimizing labor requirements.
Membrane systems are modular and can be added when the demand is actually needed. Membranesystems are typically designed for future expansion and will allow the City to defer capitalexpenditures for additional membrane capacity to the future when capacity is necessary.
5.7.3.1 Membrane Systems
The operating mechanism of membranes is completely different than that of granular filter media. The poresin the membrane fiber wall are much smaller than the protozoan cysts, so the microbes are removed easily bysimple size exclusion, independently of pretreatment coagulation conditions. The result is a very high level ofremoval of small particles, resulting in finished water turbidities of less than 0.08 NTU, and frequently muchless. Membrane systems are typically granted 4-log Giardia and Cryptosporidium removal credit by ODHS.However, membrane-based systems must still provide virus inactivation through chlorine disinfection inaddition to the removal credits for the membrane systems. The level of virus inactivation required may varyfrom 2-log to 4-log depending on the membrane manufacturer.
Generally, membrane filtration systems are distinguished by two characteristics: the pressure required fortreating the water, and the effective pore size. MF and UF systems are commonly referred to as low-pressuremembrane filtration systems. Microfiltration systems have larger pore sizes (about 0.2 µm) than ultrafiltrationsystems (about 0.02 µm). Cryptosporidium oocysts range in size from 2 to 5 µm. In membrane filtrationsystems, water flows through the membrane and particles larger than the pores are trapped by the membrane.Because of this exclusion mechanism of operation, the breakthrough of particles is nearly non-existent inmembrane filtration, so long as membrane integrity is maintained. Figure 5-9 illustrates the size of aCryptosporidium oocyst and other common contaminants as compared to a microfiltration pore.
Figure 5-9. Relative Size of Small Particles
Large siliceousParticle (20 µm)
CryptosporidiumOocyst (2 - 5 µm)
Giardia Cyst(5 - 15 µm)
Pencil Dot (40 µm)
Microfiltration (0.2 µm)

Chapter 5 Water Treatment Evaluation Bridge Creek Supply
5-24
Nearly all membrane filtration systems used in the treatment of municipal drinking water are hollow fibers inwhich the water is either driven from the inside of the fiber through the membrane to the outside (inside-out)or from the outside of the fiber through the membrane to the inside (outside-in). There are two basicmembrane configurations—pressure vessel membrane systems and submerged membranes. Pressure vesselsystems use a pumped influent flow to essentially push water through the membrane, thus requiring apressurized vessel enclosing the membrane fibers. Submerged membrane systems essentially pull water byvacuum through the membrane. The process tanks for submerged membranes, thus, can be open to theatmosphere. The Umpqua Basin Water Association has a 6-mgd submerged membrane system. The City ofCottage Grove has a 4-mgd pressure membrane system. Examples of pressure and submerged membranesystems are presented in Figures 5-10 and 5-11.
Figure 5-10. Pressure Membrane System
Figure 5-11. Submerged Membrane System

Chapter 5 Water Treatment Evaluation Bridge Creek Supply
5-25
Choosing a suitable membrane for a water system is critical because the membrane material will determineits performance and durability for any given water. The majority of membranes used for drinking watertreatment are polymeric membranes, made from materials such as cellulose acetate, polysulfone, poly-ether-sulfone, or polyvinylidene difluoride (PVDF).
Ceramic membranes are also used for drinking water treatment, but to a lesser extent than polymericmembranes. Ceramic membranes are similar to PVDF membranes from the perspective of what theyremove from the water. However, a key difference is that the ceramic membranes are more tolerant to highsolids loading because ceramic is a stronger material than polymer. Additionally, ceramic membranes cantolerate more aggressive cleaning solutions than polymeric membranes. Ceramic membranes typically have ahigher capital costs that polymeric membranes.
Each of these materials offers advantages and disadvantages for a specific water source, depending upon theparticles and dissolved matter in the water source. Thus, a specific type of membrane is usuallyrecommended depending upon water quality. Table 5-12 presents capabilities of MF and UF membranes.
Table 5-12. Capabilities of MF and UF Membranes
Parameter to be Removed MF UF
Cysts 99.9 percent, >3-log 99.9 percent, >3-log
Bacteria 99 percent, >2-log 99 percent, >2-log
Virus 0 to 99 percent, 0- to >2-log 0 to 99.9 percent, 0- to >3-log
TOC 0 to 20 percent 0 to 20 percent
Color 1 1
DBP-precursors 1 1
1 Without chemical pretreatment, MF does not remove dissolved material and removal by UF is limited. Removal ofdissolved organic material can be achieved by operating MF in a direct filtration mode and/or with poly-aluminumchloride addition. Ongoing research is being conducted to determine the limits.
Mainly due to physical size, certain particles in the feed water are rejected by the membrane, as water is forcedthrough it. These particles collect on the membrane surface, causing the required pressure for waterproduction to increase. Backwashing is required to release this material from the surface of the membrane.Backwashing cycles are dependent on the applied water quality, membrane type, and the flow pattern in themembrane system. In general, as the water quality degrades, the frequency and duration of backwashingincreases. Although backwashing regimes are very effective for restoring the permeability of the membrane,they do not restore 100 percent of the permeability with each backwash cycle. Over time, the permeability ofthe membrane after backwashing is compromised by particles and dissolved constituents becomingembedded into or adsorbed onto the membrane surface. This loss of permeability over time is called fouling.A chemical cleaning cycle is needed to dissolve the contaminants and restore the membrane’s permeability.The spent cleaning solution is typically neutralized onsite and discharged to a sanitary sewer, or hauled offsitefor disposal.
Membrane filtration systems generate two residual streams—backwash flow and spent cleaning solution flow.For many potable water applications, the membrane filtration backwash streams are disposed of withouttreatment to a receiving body of water or sewer system. Since the backwash reject can be up to 10 percent ofplant flow, many utilities are using backwash flow recovery processes. Alternative viable treatment options torecover water from the backwash include a secondary membrane filtration system to further concentrate thewaste stream, or coagulation and clarification treatment process such as high rate plate settler systems.

Chapter 5 Water Treatment Evaluation Bridge Creek Supply
5-26
5.7.3.2 Pretreatment Requirements
Pretreatment may be required upstream of membranes to aid in removal of dissolved constituents (i.e., ironor manganese) and TOC which can increase membrane fouling. Depending on raw water quality,pretreatment may consist of one or a combination of coagulant addition, flocculation, sedimentation, andoxidation.
5.7.3.3 Membrane System Recommendation – Treatment Alternative 4
Treatment Alternative 4 is discussed in this section.
5.7.3.3.1 Pretreatment Requirements
The low levels of both turbidity and TOC (low TOC values are assumed based on DBP data) in the BridgeCreek source make it a good candidate for membrane filtration without coagulation pretreatment. In theevent of a forest fire, raw water turbidity could increase significantly and the water quality could changedramatically for an extended period of time. It is assumed that pretreatment would be required in the eventof a forest fire. Although membranes do not require pretreatment for turbidity removal, they operate moreefficiently when there are fewer suspended solids in the water being filtered. Fewer suspended solidscorrespond to less membrane fouling, lower pressure loss, and longer filter run times. For this evaluation, itis assumed that pretreatment including coagulation and flocculation will be provided for the initial 13 mgdplant. Pretreatment will provide operational flexibility to meet a wide range of water quality issues. Duringlow turbidity periods the pretreatment process will be bypassed.
5.7.3.3.2 Membrane System Selection
For this project, either a submerged-membrane system or a pressure membrane system would functionequivalently. For most projects, there is no clear advantage of submerged membranes over pressuremembranes or vice-versa. Typically membrane procurement bids allow selected submerged and pressuremembrane manufacturers to compete economically. Care should be taken to ensure that any damaging debrisis removed upstream of the membranes by automatic fine screens.
Membrane filtration for the initial 13 mgd plant would most likely consist of four to five trains ofapproximately 2.6 mgd to 3.25 mgd each. All the membrane equipment, pumping equipment, ancillaryequipment, chemical systems for cleaning and backwashing, and controls would fit into a new treatmentbuilding of approximately 6,500 square feet. The new treatment building will be sized for the build-outcapacity of 26 mgd to allow easy installation of additional treatment capacity in the future. Rather than builda separate storage tank for backwash supply, it is assumed that the existing finished water reservoir(s) will beused for backwash supply storage.
Backwash waste lagoons will be required to store and settle the membrane backwash waste. Similar to theconventional treatment options, it is assumed that backwash flows will be recycled back to the head of theplant. However, recycling of filter backwash flows should be evaluated further during detailed design. It isassumed that spent cleaning solution will be neutralized on site and hauled off-site for disposal.
Process schematics for submerged and pressure membranes are presented in Figures 5-12 and 5-13,respectively. A conceptual site layout for the membrane alternative is presented in Figure 5-14.


/
/0(F)
/
//
rr‘—44/0
(2
C
Ft
c)I—C’)
IL0
(4
//
7.-___I/
uo
LU-
i-’->
-—
I
coL.L
I•-iI--‘q
>-I—I’-jL
uQ
.Lu
>-Q
__ILU
Lu
C)
UJ-•
-lLL
jII-C
C’-.
I—C
.Z
Q
ØC
OL
L-J
% HIIPJC.
C(‘1
/

Chapter 5 Water Treatment Evaluation Bridge Creek Supply
5-30
5.8 Evaluation Of Alternatives
The evaluation of the alternatives includes comparison of treating the Bridge Creek source using thefollowing:
Alternative 1 – UV Disinfection
Alternative 2 – UV Disinfection with Pretreatment for Turbidity Reduction
Alternative 3 - Conventional Treatment (Defined as coagulation, flocculation, and sedimentationfollowed by granular media filtration)
Alternative 4 - Membrane Filtration (MF or UF) with Pretreatment
5.8.1 Capital Cost
Estimated capital costs for this evaluation are based on 2009 dollars and include the cost of all major treatmentplant components required for the initial 13 mgd plant capacity including treatment equipment, installation,ancillary equipment, buildings and structures to house the treatment system, miscellaneous site work and sitepiping as needed to incorporate the new treatment system, and the following contingency allowances
General Conditions 10 percent
Contractor Markups (Labor, Materials, and Equipment) 8 to 10 percent
Bonds and Insurance 3.5 percent
Escalation to Mid-point of Construction (October 2011) 4 percent
Construction Contingency 30 percent
Engineering, Legal, and Administration 18 percent
Table 5-13 summarizes the major plant components included in each treatment alternative. Some plantcomponents are common to more than one alternative.
Table 5-13. Summary of Major Treatment Plant Components
Plant ComponentAlternative 1–
UV Disinfection
Alternative 2–UV Disinfection with
Pretreatment
Alternative 3–Conventional
Treatment
Alternative 4–MembraneFiltration
Hydropower after-bay and raw waterpump station1 X X X X
UV system2 X X
Ballasted floc X X
Flocculation basins X X
Rapid media filtration X
Membrane filtration3 X
Treated/filtered water wet well1 X X
Treated/filtered water pump station4 X X
Coagulant feed system X X X
Sodium hypochlorite feed system X X X X
Backwash waste lagoons and decantpump station
X X
Operations building X X X X

Chapter 5 Water Treatment Evaluation Bridge Creek Supply
5-31
Table 5-13. Summary of Major Treatment Plant Components
Plant ComponentAlternative 1–
UV Disinfection
Alternative 2–UV Disinfection with
Pretreatment
Alternative 3–Conventional
Treatment
Alternative 4–MembraneFiltration
Emergency power X X X X
Site civil and yard piping X X X X
1 Hydropower after-bay and treated/filtered water tanks are sized for 5 percent of 26 mgd, or 1.3 MG. Costs for the hydropower after-bay and raw waterpump station are included in the capital costs for the hydropower facility.
2 UV System costs assume medium-pressure and low-pressure/high-output UV systems are comparable in capital costs.3 Membrane equipment costs assume pressure and submerged membrane systems are comparable in capital costs. Costs also include a new membrane
building, membrane feed or suction pumps, chemical cleaning systems, and backwash systems.4 Includes backwash pumping for Alternative 2 – Conventional Treatment. Backwash pumping for Alternative 3 – Membrane Filtration is included in the
cost of the membrane equipment.
The estimated capital costs for each treatment alternative are presented in Table 5-14. These are consideredto be Association of the Advancement of Cost Engineering International (AACE) Class 4 cost estimates forthe treatment alternatives. AACE Class 4 opinions of probable cost are considered order-of-magnitude costsand have an accuracy range of -30 percent to +50 percent. These planning level estimates provide a basis forevaluating the different treatment alternatives.
Table 5-14. Alternatives Opinion of Capital Costs
Treatment alternative Capital cost, million dollars
Alternative 1 – UV Disinfection 8.1
Alternative 2 – UV Disinfection with Pretreatment 17.3
Alternative 3 – Conventional Treatment 23.0
Alternative 4 – Membrane Filtration 22.7
The UV alternatives are the least expensive, with Alternative 2 being higher due to the addition of thepretreatment component and additional pumping required following pretreatment. Conventional treatmentand membrane filtration are approximately the same cost.
5.8.2 O&M Costs
O&M costs for each treatment alternative are presented in Table 5-15. These are based on treating thecurrent water quality and do not include operational costs associated with treating degraded water qualityfollowing a forest fire or other water quality event. They include annual costs and recurring filter media andequipment replacement costs. Annual costs include staffing, power, utilities, chemicals, and UV equipmentreplacement (lamps, sleeves, ballasts, and sensors). Annual coagulant costs were considered only in theconventional treatment alternative, as this is the only alternative that requires coagulant for treatment of thecurrent raw water quality.
Recurring costs include partial replacement and rehabilitation of ancillary equipment (pumps, valves, etc.) at20 years, and replacement of filter media or membranes at 10 year intervals.
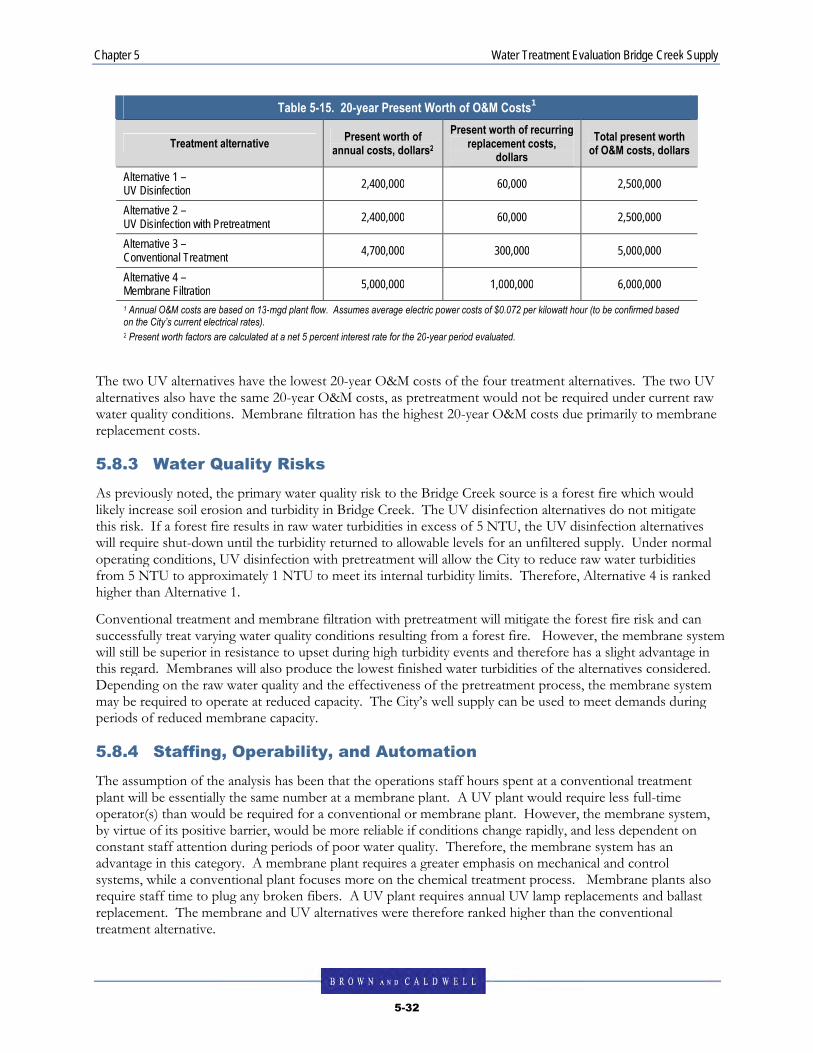
Chapter 5 Water Treatment Evaluation Bridge Creek Supply
5-32
Table 5-15. 20-year Present Worth of O&M Costs1
Treatment alternativePresent worth of
annual costs, dollars2
Present worth of recurringreplacement costs,
dollars
Total present worthof O&M costs, dollars
Alternative 1 –UV Disinfection
2,400,000 60,000 2,500,000
Alternative 2 –UV Disinfection with Pretreatment
2,400,000 60,000 2,500,000
Alternative 3 –Conventional Treatment
4,700,000 300,000 5,000,000
Alternative 4 –Membrane Filtration
5,000,000 1,000,000 6,000,000
1 Annual O&M costs are based on 13-mgd plant flow. Assumes average electric power costs of $0.072 per kilowatt hour (to be confirmed basedon the City’s current electrical rates).2 Present worth factors are calculated at a net 5 percent interest rate for the 20-year period evaluated.
The two UV alternatives have the lowest 20-year O&M costs of the four treatment alternatives. The two UValternatives also have the same 20-year O&M costs, as pretreatment would not be required under current rawwater quality conditions. Membrane filtration has the highest 20-year O&M costs due primarily to membranereplacement costs.
5.8.3 Water Quality Risks
As previously noted, the primary water quality risk to the Bridge Creek source is a forest fire which wouldlikely increase soil erosion and turbidity in Bridge Creek. The UV disinfection alternatives do not mitigatethis risk. If a forest fire results in raw water turbidities in excess of 5 NTU, the UV disinfection alternativeswill require shut-down until the turbidity returned to allowable levels for an unfiltered supply. Under normaloperating conditions, UV disinfection with pretreatment will allow the City to reduce raw water turbiditiesfrom 5 NTU to approximately 1 NTU to meet its internal turbidity limits. Therefore, Alternative 4 is rankedhigher than Alternative 1.
Conventional treatment and membrane filtration with pretreatment will mitigate the forest fire risk and cansuccessfully treat varying water quality conditions resulting from a forest fire. However, the membrane systemwill still be superior in resistance to upset during high turbidity events and therefore has a slight advantage inthis regard. Membranes will also produce the lowest finished water turbidities of the alternatives considered.Depending on the raw water quality and the effectiveness of the pretreatment process, the membrane systemmay be required to operate at reduced capacity. The City’s well supply can be used to meet demands duringperiods of reduced membrane capacity.
5.8.4 Staffing, Operability, and Automation
The assumption of the analysis has been that the operations staff hours spent at a conventional treatmentplant will be essentially the same number at a membrane plant. A UV plant would require less full-timeoperator(s) than would be required for a conventional or membrane plant. However, the membrane system,by virtue of its positive barrier, would be more reliable if conditions change rapidly, and less dependent onconstant staff attention during periods of poor water quality. Therefore, the membrane system has anadvantage in this category. A membrane plant requires a greater emphasis on mechanical and controlsystems, while a conventional plant focuses more on the chemical treatment process. Membrane plants alsorequire staff time to plug any broken fibers. A UV plant requires annual UV lamp replacements and ballastreplacement. The membrane and UV alternatives were therefore ranked higher than the conventionaltreatment alternative.

Chapter 5 Water Treatment Evaluation Bridge Creek Supply
5-33
Automation also affects the needed staffing levels, and the reliability of operation without operatorattendance. UV and membrane systems are designed with a high level of internal automation and easily canbe incorporated into a new or existing plant supervisory control and data acquisition (SCADA) system.Because the filtered water quality from membranes is not affected by changes in raw water quality or upsets inpretreatment, the system lends itself well to minimally-staffed operations. However, many membrane plantsstill choose to staff fully. For example, the City of Albany’s 12-mgd Albany-Millersburg Membrane FiltrationPlant staffs three full-time operators during the week and one operator on the weekends.
Regardless of the level of automation, we believe that either a conventional treatment plant or a membranefiltration plant will require more staff time than a UV plant. This is due primarily to greater complexity of thesystems proposed. The experience of other utilities does not show a strong advantage for either MF/UFmembrane filtration or conventional treatment in terms of total staff time. However, a membrane systemwould have higher reliability when left unattended during high-turbidity excursions.
Four FTEs have been assumed for the conventional treatment and membrane filtration alternatives. TwoFTEs have been assumed for the UV alternatives.
5.8.5 Expandability
The initial plant expansion will have a capacity of 13 mgd; however, it must be expandable to 26 mgd withouta major disruption of operation. Initially, all major components except pretreatment basins and filter trainswill be sized for the build-out capacity of 26 mgd. The conventional treatment alternative would requireconstruction of four additional filters to reach the build-out capacity. The membrane system would requirethe addition of membrane skids or membrane filtration basins in the proposed filter building. The UV systemwould require the addition of lamps to the existing reactors or additional reactors. UV and membranes havean advantage in the expandability area due to their smaller footprint and modular construction.
5.8.6 Operational Flexibility
All of the alternatives can treat the normal water quality of the Bridge Creek source successfully. Theconventional and membrane filtration alternatives will provide flexibility to treat a wide range of raw waterquality conditions, whereas the UV disinfection alternatives will require shut-down during a turbidityexcursion above 5 NTU. As previously noted, UV disinfection with pretreatment will allow the City toreduce raw water turbidities from 5 NTU to approximately 1 NTU to meet its internal turbidity limits.Therefore, Alternative 4 is ranked higher than Alternative 1.
Conventional treatment will respond quickly to increase in raw water turbidity, but will require staff input tochange coagulant dose, filter rates, and filter performance during significant changes in raw water turbidity.In addition, the existing raw water quality may be difficult to treat with conventional treatment due to the lowraw water turbidity and TOC values.
Membranes are also capable of responding more quickly to increases in raw water turbidity. As previouslynoted, membranes will be superior in resistance to upset during rapidly changing raw water turbidity and willbe less dependent on constant staff attention during periods of poor water quality. The membrane systemhas an advantage in this category. However, membrane capacity may be reduced during periods of poorwater quality and may require use of the City’s well supply.
5.8.7 Site Compatibility
Preliminary review of the Outback Facility site indicates that any of the alternatives can be constructed on theexisting site in the location of the future storage reservoirs. All of the treatment alternatives are considered tobe equal with respect to site compatibility. The UV alternatives will have the smallest footprint while theconventional alternative will have the largest footprint.

Chapter 5 Water Treatment Evaluation Bridge Creek Supply
5-34
5.9 Results And Recommendations
This section discusses results and recommendations.
5.9.1 Summary of Evaluation
According to our analysis, the total 20-year present worth of the four alternative treatment systems for13 mgd capacity is listed in Table 5-16.
Table 5-16. 20-year Present Worth Cost
Treatment alternative Cost, million dollars
Alternative 1 – UV Disinfection 10.6
Alternative 2 – UV Disinfection with Pretreatment 19.8
Alternative 3 – Conventional Treatment 28.0
Alternative 4 – Membrane Filtration 28.7
A ranking of the treatment alternatives for the Bridge Creek source according to the evaluation criteria isgiven in Table 5-17. The initial rankings were assigned by Black & Veatch and will be revised as needed uponreview with City staff.
Table 5-17. Treatment Alternatives Evaluation Criteria
Criteria (rank)Alternative 1–
UV Disinfection
Alternative 2–UV with
Pretreatment
Alternative 3–Conventional
Treatment
Alternative 4–MembraneFiltration
Capital cost 1 2 3 3
O&M costs 1 1 2 3
Water quality risks 4 3 2 1
Staffing, operability, and automation 1 4 2 1
Expandability 1 1 2 1
Operational flexibility 3 2 1 1
Site compatibility 1 1 1 1
Total points (lower is best) 12 14 13 11
Membrane filtration has the most favorable overall ranking followed by UV disinfection withoutpretreatment, conventional filtration, and UV disinfection with pretreatment. Although ranked second withrespect to total points, UV disinfection without pretreatment is ranked the lowest in the two most importantareas—water quality risks and operational flexibility. Conventional treatment is ranked third but does havethe ability to mitigate water quality risks and provides flexibility to treat varying raw water quality conditions.Membrane filtration is ranked first in the most categories including the key criteria of water quality risks andoperational flexibility, primarily due to their robustness and ability to produce high quality water regardless orraw water quality conditions. UV disinfection with pretreatment is ranked lowest. Although UV disinfectionwith pretreatment will provide more operational flexibility than UV without pretreatment, this alternative willnot mitigate against forest fires. In addition, the additional capital costs of the pretreatment process andadditional pumping requirements make this alternative significantly more expensive than UV alone.

APPENDIX 5-A
USEPA Letter Regarding LT2 Cryptosporidium Level

UNITED STATES ENVIRONMENTAL PROTECTION AGENCYREGION 1O
1200 Sixth Avenue, Suite 900Seattle, WA 98101-3140
August 3,2009
Steve J. Prazak- Laboratory ManagerCity of Bend Water Quality Laboratory575 NE 15th StreetBend, Oregon 9770I
RE: Long Term 2 Enhanced Surface Water Treatment Rule Mean CryptosporidiumLevelBend Water Department - 4100100
Dear Mr. Prazak:
Thank you for your July 74,2009,letter in which you reported a mean Cryptosporidiumlevel of0.01 oocysts/L based on Cryptosporidium monitoring conducted between December 12,2005 andJanuary 15, 2008. V/ith this letter and the summary of the source water monitoring data that yousubmitted previously, the Bend Water Department has satisfied the initial Cryptosporidium monitoringand reporting requirements of the Long Term 2 Enhanced Surface Water Treatment Rule (LT2ESWTR).
As you are probably aware, unfiltered water systems with a mean Cryptosporidiumlevel of 0.01oocysts/L are required to provide at least 2-log Cryptosporidium inactivation. (The LT2ESWTRidentifies "maximum treatment" for an unfiltered system as 3-log Cryplosporidium úeatment.) The BendWater Department must comply with this treatment requirement no later than October 1,2012, althoughthe State may allow up to an additional two years for complying with the treatment requirement if youwill be making capital improvements,
Water systems serving between 50,000 and99,999 people must conduct a second round of sourcewater monitoring starting October 2015. If , however, the Bend Water Department installs "maximumtreatment" as described above, this monitoring will not be required.
Within the next few months the Environmental Protection Agency will be transferringimplementation of the LT2ESWTR (and the Stage 2 Disinfection Byproducts Rule) to the OregonDrinking Water Program, so if you have any questions pertaining to your treatment requirements or toyour second round of monitoring, please contact the state. ff, however, you have any questions pertainingto this letter, please feel free to contact me at (206) 553-1890 or [email protected].
Envi¡onmental Scientist
OFFICE OFWATER AND WATERSHEDS
€l p¡nrc¿ on aecycte¿ paper

APPENDIX 5-B
Estimate of Probable Construction Cost and
20-year Present Worth Cost

City of Bend Water Supply Alternatives AnalysisTM4 Water Treatment Evaluation
BV Project No. 164499August 2009
City of BendWater Supply Alternatives ProjectTM4 - Water Treatment EvaluationOpinion of Probable Construction CostAlternative 1 - UV Disinfection
Phase 1 13 MGD
General Conditions, Bonds, and Insurance (11.5%) $500,000Contractor Markups (10%) $400,000UV System $1,800,000Chemical Feed Facilities $400,000Operations Building $600,000Emergency Generator $500,000Site Civil & Yard Piping $700,000
Alternative 1 Probable Construction Cost $4,900,000
Contingency (30% of Probable Construction Cost) $1,500,000
Engineering, Legal, & Administration (18% of Subtotal Probable Construction Cost) $900,000
Subtotal Alternative 3 Probable Project Cost $7,300,000
Mid-Point of Construction (October 2011) $800,000Rate= 4%Time= 2.5 years
TOTAL ALTERNATIVE 1 PROBABLE PROJECT COST $8,100,000
Item
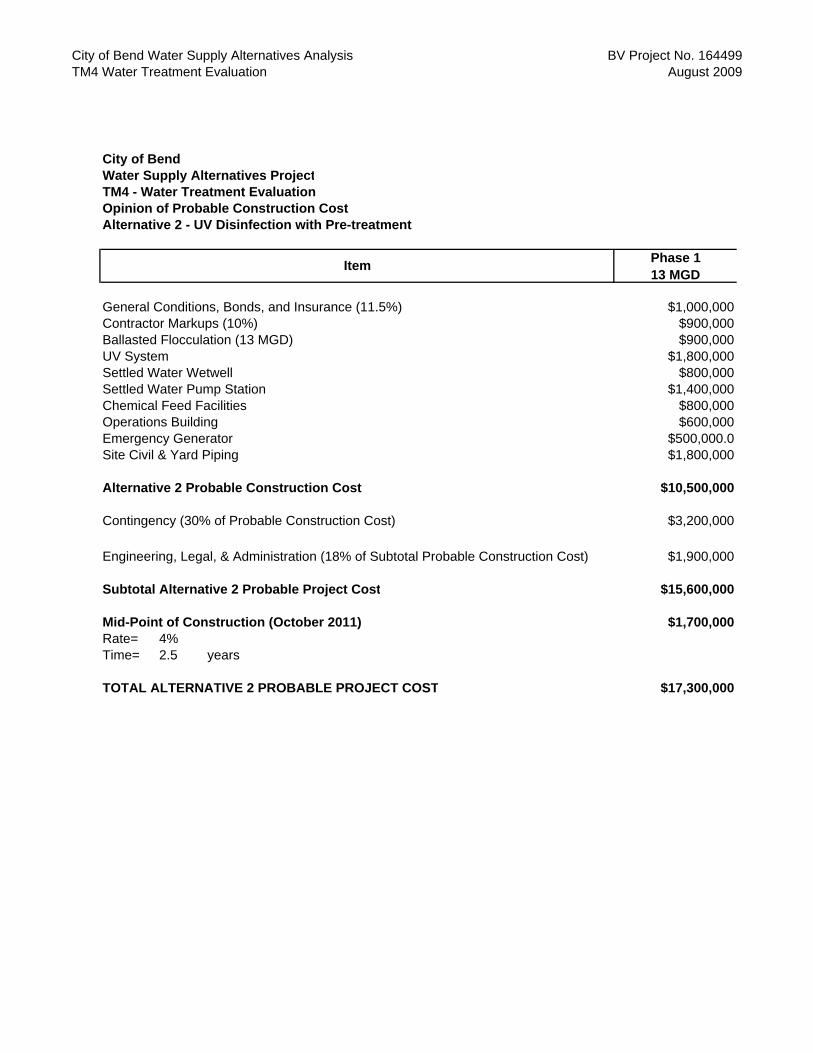
City of Bend Water Supply Alternatives AnalysisTM4 Water Treatment Evaluation
BV Project No. 164499August 2009
City of BendWater Supply Alternatives ProjectTM4 - Water Treatment EvaluationOpinion of Probable Construction CostAlternative 2 - UV Disinfection with Pre-treatment
Phase 1 13 MGD
General Conditions, Bonds, and Insurance (11.5%) $1,000,000Contractor Markups (10%) $900,000Ballasted Flocculation (13 MGD) $900,000UV System $1,800,000Settled Water Wetwell $800,000Settled Water Pump Station $1,400,000Chemical Feed Facilities $800,000Operations Building $600,000Emergency Generator $500,000.0Site Civil & Yard Piping $1,800,000
Alternative 2 Probable Construction Cost $10,500,000
Contingency (30% of Probable Construction Cost) $3,200,000
Engineering, Legal, & Administration (18% of Subtotal Probable Construction Cost) $1,900,000
Subtotal Alternative 2 Probable Project Cost $15,600,000
Mid-Point of Construction (October 2011) $1,700,000Rate= 4%Time= 2.5 years
TOTAL ALTERNATIVE 2 PROBABLE PROJECT COST $17,300,000
Item

City of Bend Water Supply Alternatives AnalysisTM4 Water Treatment Evaluation
BV Project No. 164499August 2009
City of BendWater Supply Alternatives ProjectTM4 - Water Treatment EvaluationOpinion of Probable Construction CostAlternative 3 - Conventional Treatment
Phase 1 13 MGD
General Conditions, Bonds, and Insurance (11.5%) $1,400,000Contractor Markups (10%) $1,200,000Ballasted Floc (6.5 MGD) $450,000Flocculation Basins $400,000Granular Media Filters $2,000,000
Treated/Filtered Water Wetwell $1,600,000
Filtered Water Pump Station w/ Backwash $1,900,000
Chemical Feed Facilities $800,000
Backwash Waste Lagoons and Decant Pump Station $750,000
Operations Building $600,000
Emergency Generator $500,000
Site Civil & Yard Piping $2,400,000
Alternative 3 Probable Construction Cost $14,000,000
Contingency (30% of Probable Construction Cost) $4,200,000
Engineering, Legal, & Administration (18% of Subtotal Probable Construction Cost) $2,600,000
Subtotal Alternative 3 Probable Project Cost $20,800,000
Mid-Point of Construction (October 2011) $2,200,000Rate= 4%Time= 2.5 years
TOTAL ALTERNATIVE 3 PROBABLE PROJECT COST $23,000,000
Item

City of Bend Water Supply Alternatives AnalysisTM4 Water Treatment Evaluation
BV Project No. 164499August 2009
City of BendWater Supply Alternatives ProjectTM4 - Water Treatment EvaluationOpinion of Probable Construction CostAlternative 4 - Membrane Filtration
Phase 1 13 MGD
General Conditions, Bonds, and Insurance (11.5%) $1,300,000
Contractor Markups (10%) $1,200,000
Flocculation Basins $400,000
Membrane Facility (includes Membranes and Ancillary Equipment) $5,800,000Chemical Feed Facilities $800,000Backwash Waste Lagoons and Decant Pump Station $800,000Operations Building $600,000Emergency Generator $500,000Site Civil & Yard Piping $2,400,000
Alternative 4 Probable Construction Cost $13,800,000
Contingency (30% of Probable Construction Cost) $4,200,000
Engineering, Legal, & Administration (18% of Subtotal Probable Construction Cost) $2,500,000
Subtotal Alternative 4 Probable Project Cost $20,500,000
Mid-Point of Construction (October 2011) $2,200,000Rate= 4%Time= 2.5 years
TOTAL ALTERNATIVE 4 PROBABLE PROJECT COST $22,700,000
Item

City of Bend Water Supply Alternatives AnalysisTM4 Water Treatment Evaluation
20-YEAR PRESENT WORTH ANALYSIS WORKSHEET - CONCEPTUAL AND COMPARATIVE BV Project No. 164499August 25, 2009
Alternative 1 UV Disinfection
Alternative 2 UV Disinfection with
Pretreatment
Alternative 3 Conventional
TreatmentAlternative 4
Membrane FiltrationTOTAL PROBABLE PROJECT COST $8,100,000 $17,300,000 $23,000,000 $22,700,000
OPERATION AND MAINTENANCE COSTS (O&M)RECURRING AND ANNUAL COSTS
Alternative 1 UV Disinfection
Alternative 2 UV Disinfection with
Pretreatment
Alternative 3 Conventional
TreatmentAlternative 4
Membrane FiltrationItem Description Unit Qty Unit Cost Item Cost Subtotal Subtotal Subtotal
StaffingStaff time O&M - annual 2 FTE Hours 4,160 $31 $129,000 $129,000 $129,000Staff time O&M - annual 4 FTE Hours 8,320 $31 $257,900 $257,900 $257,900
PowerConventional kWh 680,000 $0.07500 $51,000 -- -- $51,000 --Membranes kWh 850,000 $0.07500 $63,800 -- -- -- $63,800UV kWh 690,000 $0.07500 $51,800 $51,800 $51,800 -- --
Chemical Usage Filter Aid Polymer LS 1 $5,000 $5,000 -- -- $5,000 --CIP Chemicals LS 1 $44,000 $44,000 -- -- -- $44,000CIP Chemicals Disposal LS 1 $35,000 $35,000 -- -- -- $35,000Pre-treatment Coagulant & Polymer LS 1 $60,000 $60,000 -- -- $60,000 --
UV Annual O&M Costs LS 1 $10,000 $10,000 $10,000 $10,000 -- --
Total Annual Costs $190,800 $190,800 $373,900 $400,70020-YEAR PRESENT WORTH OF ANNUAL COSTS AT 5% INTEREST $2,380,000 $2,380,000 $4,660,000 $4,990,000
Replacement
Replacement Costs Unit Qty Unit Cost Item Cost Interval-Years
Filter Media Replacement - Conventional Filters LS 1 $174,000 $174,000 10 -- -- $174,000 --Membrane Replacement LS 1 $913,000 $913,000 10 -- -- -- $913,000Mechanical/Ancillary Equipment LS 1 $300,000 $300,000 20 $150,000 $150,000 $300,000 $300,000
Total 5-yr Replacement Costs $0 $0 $0 $0Total 10-yr Replacement Costs $0 $0 $174,000 $913,000Total 15-yr Replacement Costs $0 $0 $0 $0Total 20-yr Replacement Costs $150,000 $150,000 $474,000 $1,213,000
20-YEAR PRESENT WORTH OF REPLACEMENT COSTS AT 5% INTEREST $60,000 $60,000 $290,000 $1,020,000
TOTAL OF RECURRING AND ANNUAL O&M COSTS $2,440,000 $2,440,000 $4,950,000 $6,010,000
TOTAL PRESENT WORTH OF CAPITAL AND O&M COSTS (AT 5 % INTEREST) $10,540,000 $19,740,000 $27,950,000 $28,710,000
Page 1 of 1


