Page 1
Chapter -5 Wave Climatology of Indian Ocean
80
Chapter 5: Wave Climatology of Indian Ocean – Annual Cycle
5.1 Introduction
The routine collection of information on wave characteristics, in Indian Ocean,
was predominantly based on visual observations carried out using ships of
opportunity. Further using data from Indian Daily Weather Report (IDWR)
(published by Indian Meteorology Department, New Delhi) Vijayarajan et al.
(1978) prepared a wave atlas for Arabian Sea. Subsequently another wave atlas
was prepared by National Institute of Oceanography, India for North Indian Ocean
(NIO, 1982) which was further updated by Chandramohan et al. (1991). Apart
from these, there were also measurements of wave characteristics onboard
research vessels during oceanographic surveys. The availability of in-situ wave
data was very sparse and inhomogeneous over Indian Ocean region. This adds to
the limitation of establishing a reliable wave climatology using in-situ data.
The global coverage and periodic measurements of ocean waves by the altimeters
onboard Geosat, ERS and TOPEX/ POSEIDON made an important contribution
in building up reliable wave data at larger spatio-temporal scale. The wave data
acquired from various satellite platforms has been effectively utilized to
understand the variability and also processes. Rajkumar et al. (2009) utilized the
ERS-1 Synthetic Aperture Radar (SAR) wave mode data along with TOPEX/
POSEIDON altimeter – derived SWH to study the monthly variation of waves off
the west coast of India. A comparative study between Geosat, in-situ and model
data conducted by Vethamony et al. (2000) reveals that the satellite derived
Page 2
Chapter -5 Wave Climatology of Indian Ocean
81
significant wave heights were extremely valuable to evolve long term distribution
for generating wave climatology.
In this chapter the detailed discussion given on daily and monthly Climatology of
SWH computed from model data covering a period from 1998 to 2010 with 6hr
time interval. Modulo re-gridding transformation available with Ferret
(Ferret_user_guide_v602) was used for computation of wave climatology. Prior to
analysis of SWH, the wind climatology has been discussed considering as primary
forcing mechanism for waves.
5.2 Spatial Distribution of SWH Mean Annual Cycle
The climate in the Indian Ocean is characterized by an alteration of seasons
known as monsoons. The effect of monsoons is felt even in the subtropical
regions of the south Indian Ocean. During northern winter, dry surface air blow
from land to sea in the north-east direction, resulting in the north-east monsoon
season and in summer there is a complete reversal of these conditions with the
moist winds blowing from sea to land in the south-west direction, resulting in the
south-west monsoon season.
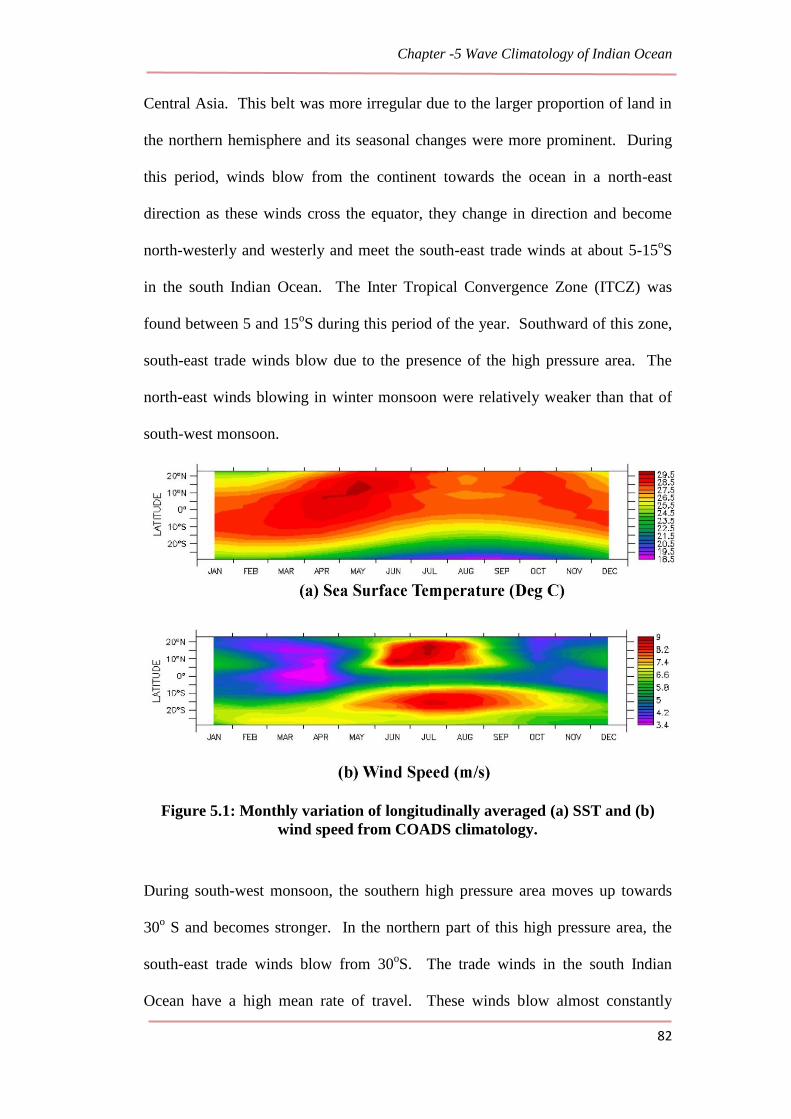
The hovmollar diagram (Figure 5.1) of longitudinally averaged monthly fields of
SST and winds derived from COADS monthly climatology over the Indian Ocean
representing mean latitudinal distribution. The differential heating of land and
ocean causes the formation of pressure gradients, which drives the winds from one
place to another place. During north-east monsoon, a high pressure area was
present at about 35o S in the south Indian Ocean. Towards north of this
subtropical high, the pressure decreases till the equatorial low. At this time, there
was also another subtropical belt of high pressure in the northern hemisphere over
Page 3
Chapter -5 Wave Climatology of Indian Ocean
82
Central Asia. This belt was more irregular due to the larger proportion of land in
the northern hemisphere and its seasonal changes were more prominent. During
this period, winds blow from the continent towards the ocean in a north-east
direction as these winds cross the equator, they change in direction and become
north-westerly and westerly and meet the south-east trade winds at about 5-15oS
in the south Indian Ocean. The Inter Tropical Convergence Zone (ITCZ) was
found between 5 and 15oS during this period of the year. Southward of this zone,
south-east trade winds blow due to the presence of the high pressure area. The
north-east winds blowing in winter monsoon were relatively weaker than that of
south-west monsoon.
Figure 5.1: Monthly variation of longitudinally averaged (a) SST and (b)
wind speed from COADS climatology.
During south-west monsoon, the southern high pressure area moves up towards
30o S and becomes stronger. In the northern part of this high pressure area, the
south-east trade winds blow from 30oS. The trade winds in the south Indian
Ocean have a high mean rate of travel. These winds blow almost constantly
Page 4
Chapter -5 Wave Climatology of Indian Ocean
83
throughout the year from 30oS towards the equator. The highest mean wind speed
(33 km/hr) was found in the south-east trades of the south Indian Ocean. In this
season, the Asiatic high disappears and is replaced by a deep and extensive low.
During this period low pressure was found over northern India. The incoming
solar radiation heat very large land mass of Asia, resulting in steady falling of
pressure from subtropical high (at about 30oS). Hence, the south-east trade winds
cross the equator and become south-west monsoon wind in the north Indian
Ocean. These winds blow parallel to the coast of Africa and Arabia. The Inter
Tropical Convergence Zone (ICTZ) is not easily identified in the Indian Ocean
and the only winds present in this season originate in the south Indian Ocean. In
the Indian Ocean, north of the equator, winds from south-west blow very strong
from June till September. The wind speeds reach values of about 25-30 km/hr
between India, Arabia and Africa. During transition periods (Sep-Oct-Nov and
Mar-Apr-May) the wind speeds reach minimum magnitudes over entire north
Indian Ocean. Because of this high seasonality of winds over north Indian Ocean
the annual mean of the wave heights were comparatively lower than that of
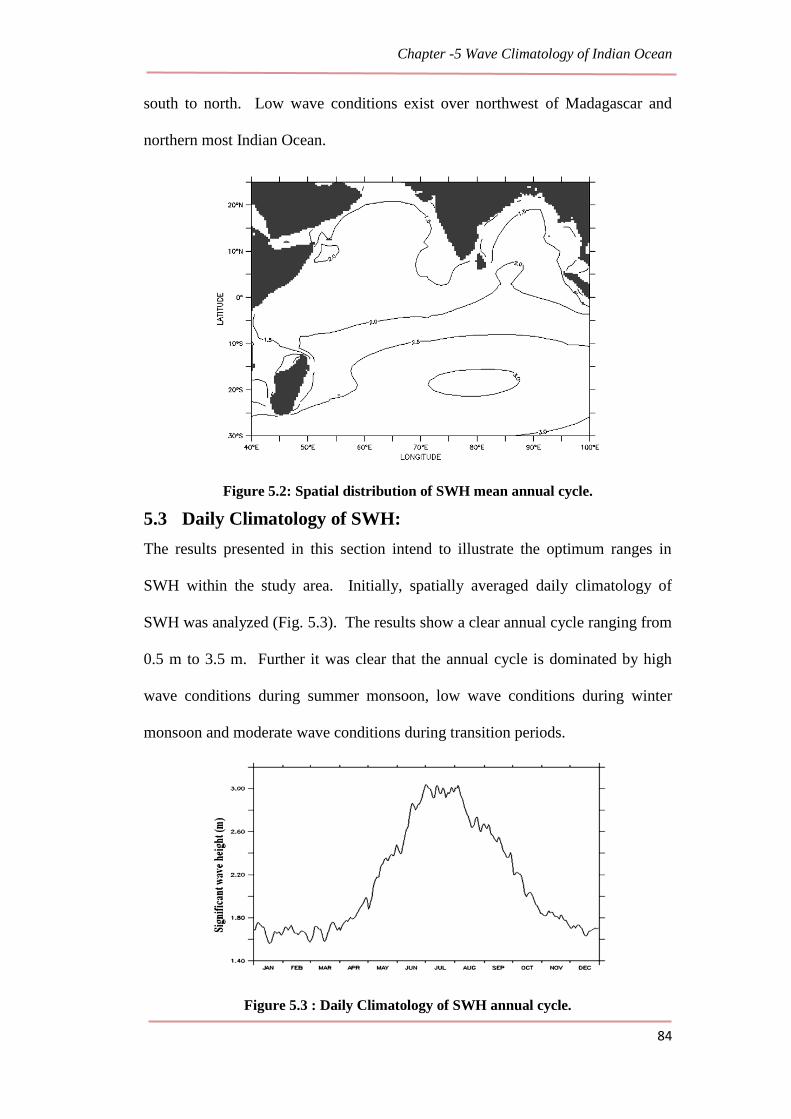
Tropical South Indian Ocean (TSIO). The mean annual spatial distribution of
Significant Wave Height (SWH) by averaging 12 month climatology (Figure 5.2)
of Indian Ocean shows a monopole structure with high wave condition of 3 m to
3.5 m exists around 80oE and 20
oS. The wave heights of Tropical South Indian
Ocean (TSIO) are high compared to Tropical North Indian Ocean (TNIO). It is
clear from the figure 5.1-b that the existence of high and moderate winds over
TSIO all along the year, resulting in large magnitude of the mean annual wind
fields. Waves with more than 2 m exist between 10oS to 30
oS, except the region
west of Madagascar. The mean annual pattern shows decreasing of SWH from
Page 5
Chapter -5 Wave Climatology of Indian Ocean
84
south to north. Low wave conditions exist over northwest of Madagascar and
northern most Indian Ocean.
Figure 5.2: Spatial distribution of SWH mean annual cycle.
5.3 Daily Climatology of SWH:
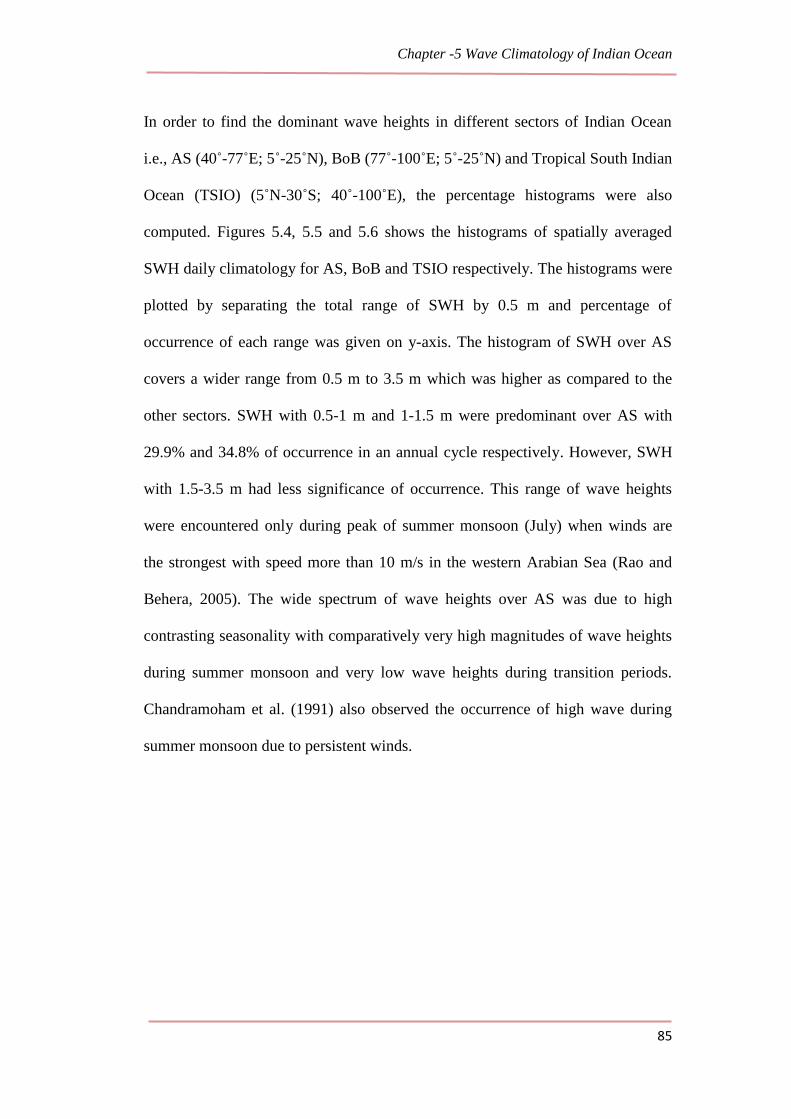
The results presented in this section intend to illustrate the optimum ranges in
SWH within the study area. Initially, spatially averaged daily climatology of
SWH was analyzed (Fig. 5.3). The results show a clear annual cycle ranging from
0.5 m to 3.5 m. Further it was clear that the annual cycle is dominated by high
wave conditions during summer monsoon, low wave conditions during winter
monsoon and moderate wave conditions during transition periods.
Figure 5.3 : Daily Climatology of SWH annual cycle.
Page 6
Chapter -5 Wave Climatology of Indian Ocean
85
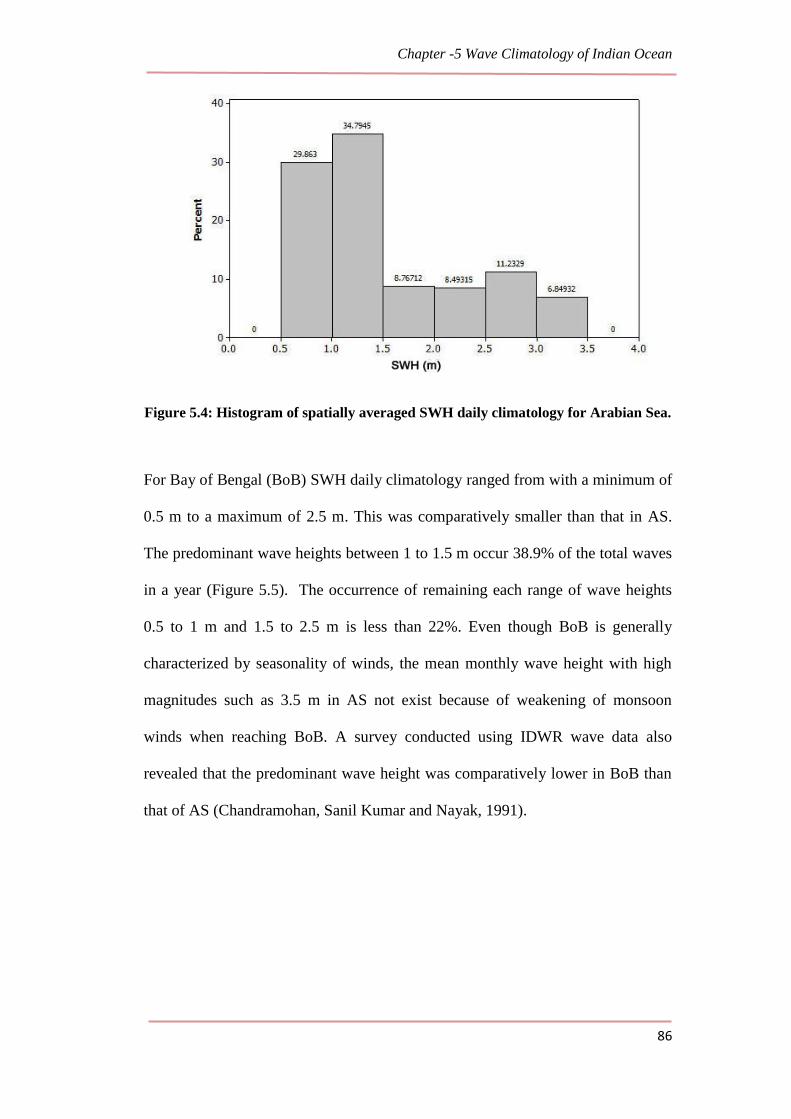
In order to find the dominant wave heights in different sectors of Indian Ocean
i.e., AS (40˚-77˚E; 5˚-25˚N), BoB (77˚-100˚E; 5˚-25˚N) and Tropical South Indian
Ocean (TSIO) (5˚N-30˚S; 40˚-100˚E), the percentage histograms were also
computed. Figures 5.4, 5.5 and 5.6 shows the histograms of spatially averaged
SWH daily climatology for AS, BoB and TSIO respectively. The histograms were
plotted by separating the total range of SWH by 0.5 m and percentage of
occurrence of each range was given on y-axis. The histogram of SWH over AS
covers a wider range from 0.5 m to 3.5 m which was higher as compared to the
other sectors. SWH with 0.5-1 m and 1-1.5 m were predominant over AS with
29.9% and 34.8% of occurrence in an annual cycle respectively. However, SWH
with 1.5-3.5 m had less significance of occurrence. This range of wave heights
were encountered only during peak of summer monsoon (July) when winds are
the strongest with speed more than 10 m/s in the western Arabian Sea (Rao and
Behera, 2005). The wide spectrum of wave heights over AS was due to high
contrasting seasonality with comparatively very high magnitudes of wave heights
during summer monsoon and very low wave heights during transition periods.
Chandramoham et al. (1991) also observed the occurrence of high wave during
summer monsoon due to persistent winds.
Page 7
Chapter -5 Wave Climatology of Indian Ocean
86
Figure 5.4: Histogram of spatially averaged SWH daily climatology for Arabian Sea.
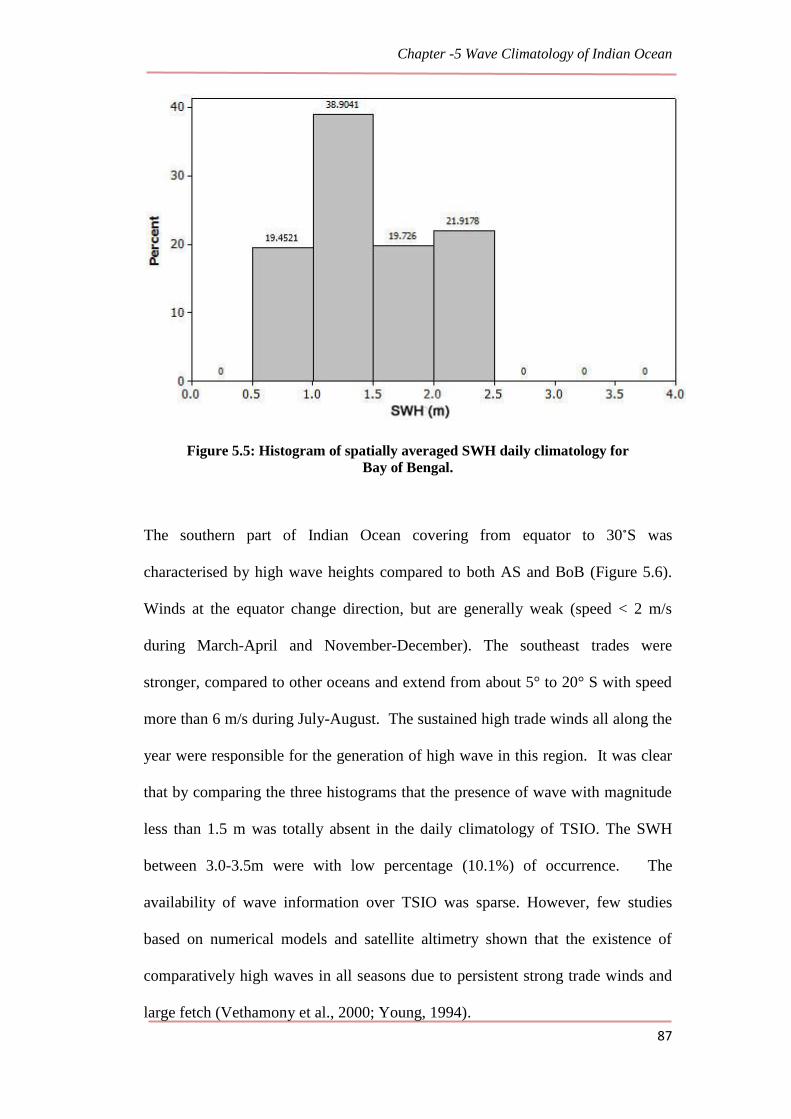
For Bay of Bengal (BoB) SWH daily climatology ranged from with a minimum of
0.5 m to a maximum of 2.5 m. This was comparatively smaller than that in AS.
The predominant wave heights between 1 to 1.5 m occur 38.9% of the total waves
in a year (Figure 5.5). The occurrence of remaining each range of wave heights
0.5 to 1 m and 1.5 to 2.5 m is less than 22%. Even though BoB is generally
characterized by seasonality of winds, the mean monthly wave height with high
magnitudes such as 3.5 m in AS not exist because of weakening of monsoon
winds when reaching BoB. A survey conducted using IDWR wave data also
revealed that the predominant wave height was comparatively lower in BoB than
that of AS (Chandramohan, Sanil Kumar and Nayak, 1991).
Page 8
Chapter -5 Wave Climatology of Indian Ocean
87
Figure 5.5: Histogram of spatially averaged SWH daily climatology for
Bay of Bengal.
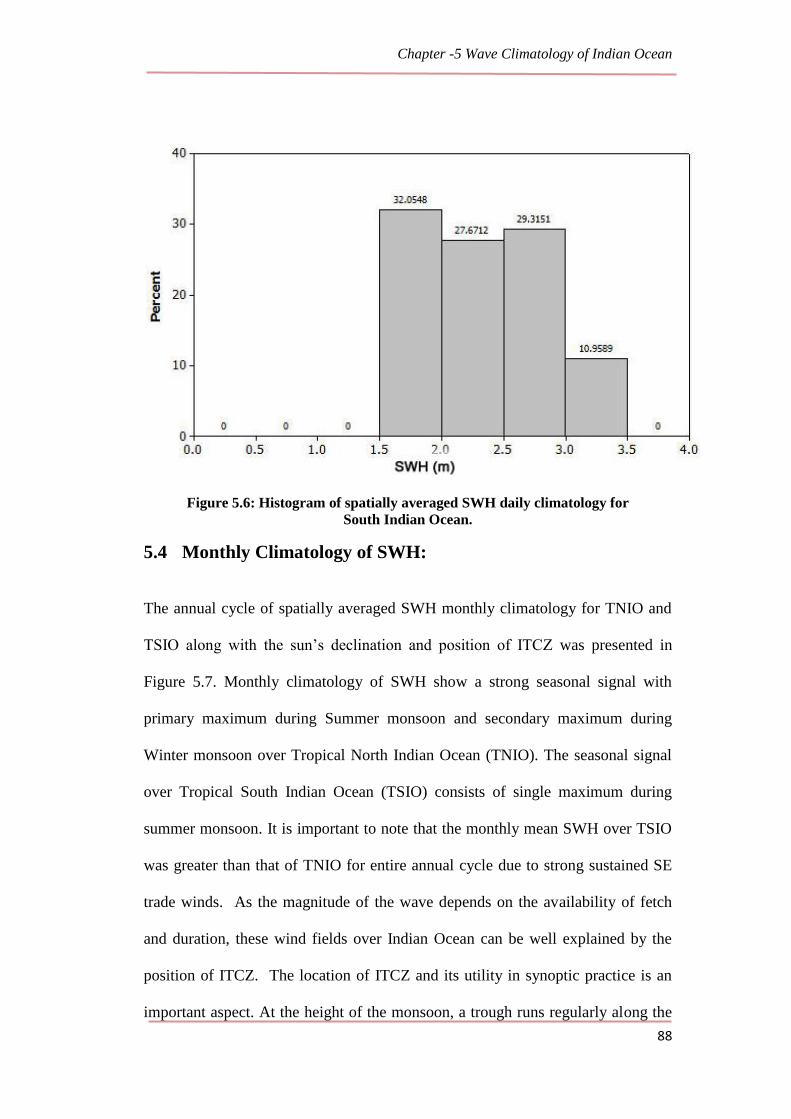
The southern part of Indian Ocean covering from equator to 30˚S was
characterised by high wave heights compared to both AS and BoB (Figure 5.6).
Winds at the equator change direction, but are generally weak (speed < 2 m/s
during March-April and November-December). The southeast trades were
stronger, compared to other oceans and extend from about 5° to 20° S with speed
more than 6 m/s during July-August. The sustained high trade winds all along the
year were responsible for the generation of high wave in this region. It was clear
that by comparing the three histograms that the presence of wave with magnitude
less than 1.5 m was totally absent in the daily climatology of TSIO. The SWH
between 3.0-3.5m were with low percentage (10.1%) of occurrence. The
availability of wave information over TSIO was sparse. However, few studies
based on numerical models and satellite altimetry shown that the existence of
comparatively high waves in all seasons due to persistent strong trade winds and
large fetch (Vethamony et al., 2000; Young, 1994).
Page 9
Chapter -5 Wave Climatology of Indian Ocean
88
Figure 5.6: Histogram of spatially averaged SWH daily climatology for
South Indian Ocean.
5.4 Monthly Climatology of SWH:
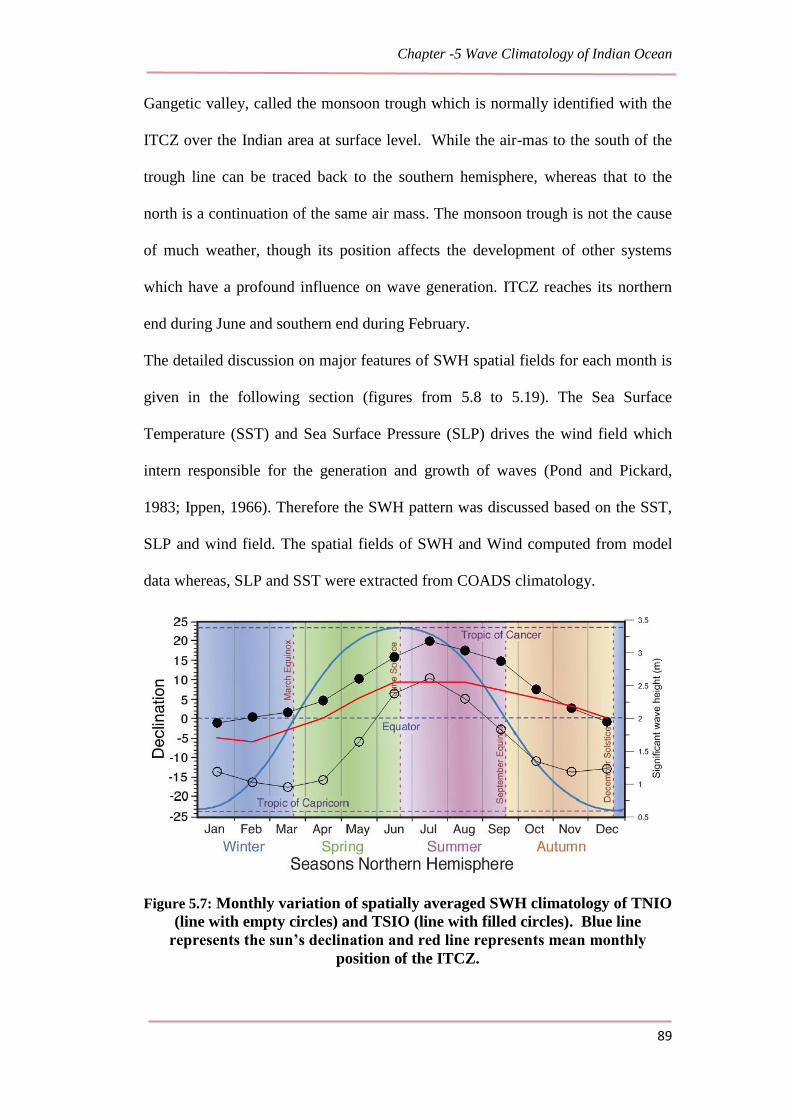
The annual cycle of spatially averaged SWH monthly climatology for TNIO and
TSIO along with the sun’s declination and position of ITCZ was presented in
Figure 5.7. Monthly climatology of SWH show a strong seasonal signal with
primary maximum during Summer monsoon and secondary maximum during
Winter monsoon over Tropical North Indian Ocean (TNIO). The seasonal signal
over Tropical South Indian Ocean (TSIO) consists of single maximum during
summer monsoon. It is important to note that the monthly mean SWH over TSIO
was greater than that of TNIO for entire annual cycle due to strong sustained SE
trade winds. As the magnitude of the wave depends on the availability of fetch
and duration, these wind fields over Indian Ocean can be well explained by the
position of ITCZ. The location of ITCZ and its utility in synoptic practice is an
important aspect. At the height of the monsoon, a trough runs regularly along the
Page 10
Chapter -5 Wave Climatology of Indian Ocean
89
Gangetic valley, called the monsoon trough which is normally identified with the
ITCZ over the Indian area at surface level. While the air-mas to the south of the
trough line can be traced back to the southern hemisphere, whereas that to the
north is a continuation of the same air mass. The monsoon trough is not the cause
of much weather, though its position affects the development of other systems
which have a profound influence on wave generation. ITCZ reaches its northern
end during June and southern end during February.
The detailed discussion on major features of SWH spatial fields for each month is
given in the following section (figures from 5.8 to 5.19). The Sea Surface
Temperature (SST) and Sea Surface Pressure (SLP) drives the wind field which
intern responsible for the generation and growth of waves (Pond and Pickard,
1983; Ippen, 1966). Therefore the SWH pattern was discussed based on the SST,
SLP and wind field. The spatial fields of SWH and Wind computed from model
data whereas, SLP and SST were extracted from COADS climatology.
Figure 5.7: Monthly variation of spatially averaged SWH climatology of TNIO
(line with empty circles) and TSIO (line with filled circles). Blue line
represents the sun’s declination and red line represents mean monthly
position of the ITCZ.
Page 11
Chapter -5 Wave Climatology of Indian Ocean
90
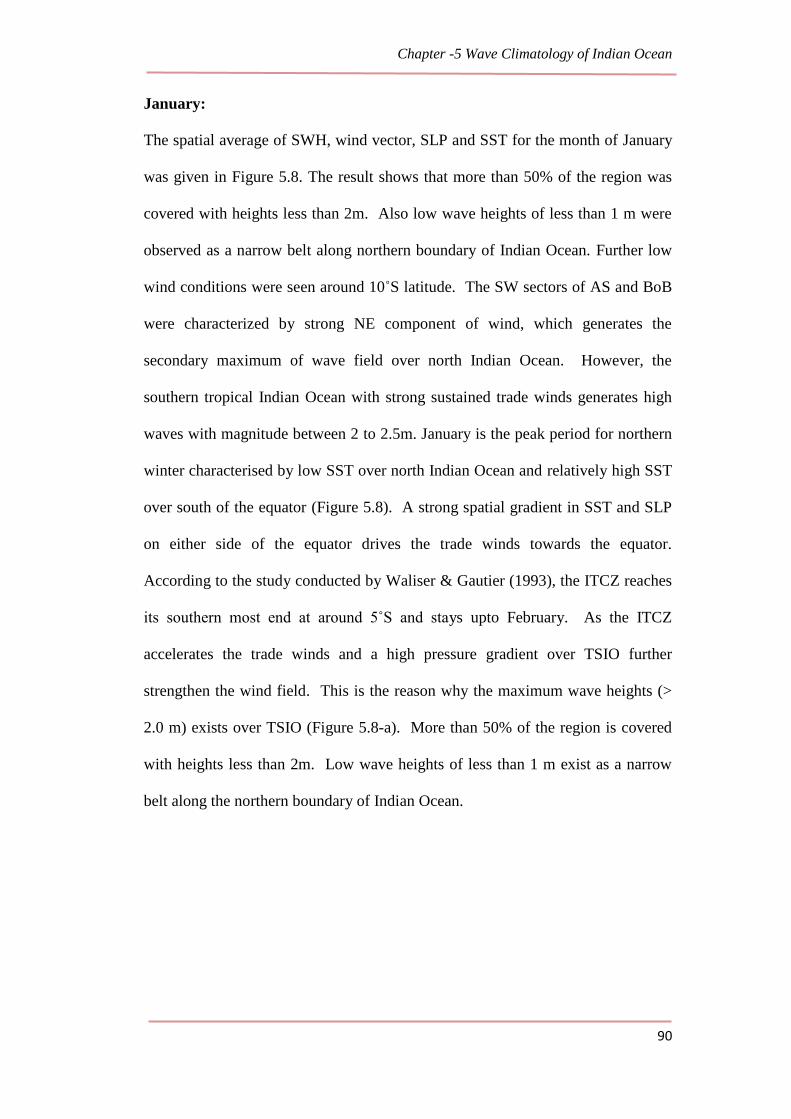
January:
The spatial average of SWH, wind vector, SLP and SST for the month of January
was given in Figure 5.8. The result shows that more than 50% of the region was
covered with heights less than 2m. Also low wave heights of less than 1 m were
observed as a narrow belt along northern boundary of Indian Ocean. Further low
wind conditions were seen around 10˚S latitude. The SW sectors of AS and BoB
were characterized by strong NE component of wind, which generates the
secondary maximum of wave field over north Indian Ocean. However, the
southern tropical Indian Ocean with strong sustained trade winds generates high
waves with magnitude between 2 to 2.5m. January is the peak period for northern
winter characterised by low SST over north Indian Ocean and relatively high SST
over south of the equator (Figure 5.8). A strong spatial gradient in SST and SLP
on either side of the equator drives the trade winds towards the equator.
According to the study conducted by Waliser & Gautier (1993), the ITCZ reaches
its southern most end at around 5˚S and stays upto February. As the ITCZ
accelerates the trade winds and a high pressure gradient over TSIO further
strengthen the wind field. This is the reason why the maximum wave heights (>
2.0 m) exists over TSIO (Figure 5.8-a). More than 50% of the region is covered
with heights less than 2m. Low wave heights of less than 1 m exist as a narrow
belt along the northern boundary of Indian Ocean.
Page 12
Chapter -5 Wave Climatology of Indian Ocean
91
Figure 5.8: Spatial distribution of (a) SWH, (b) wind, (c) sea level pressure and (d)
sea surface temperature climatology for January month.
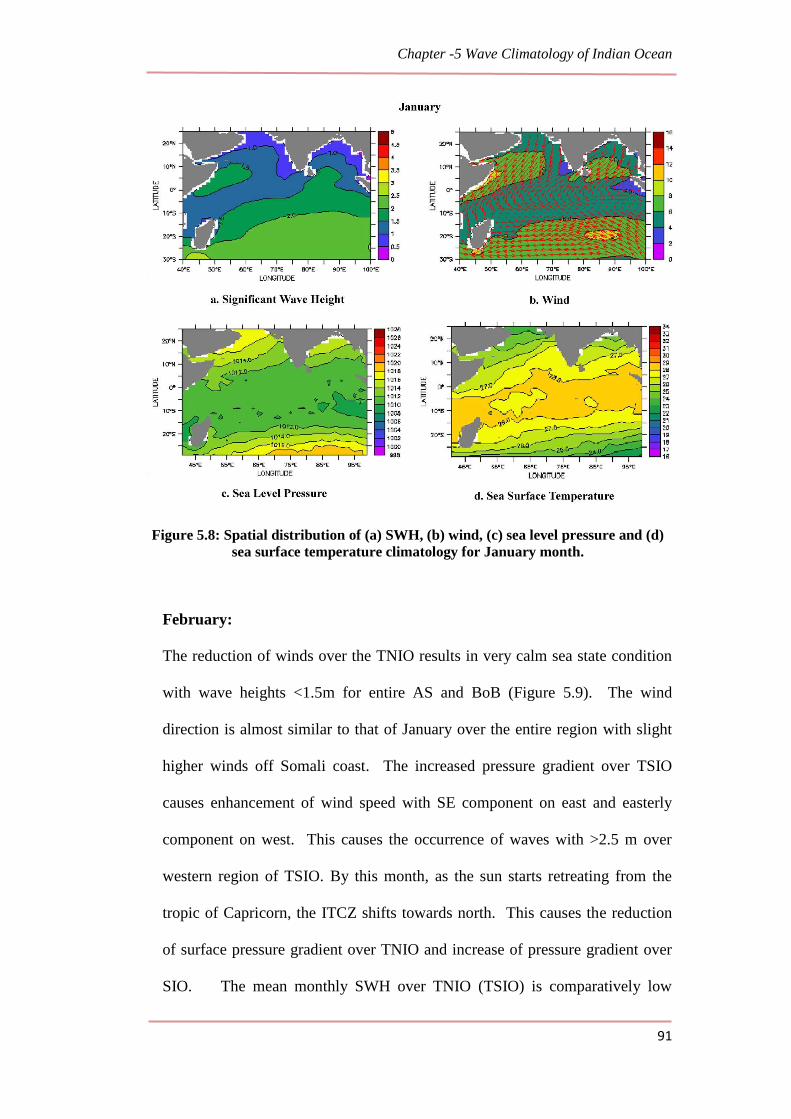
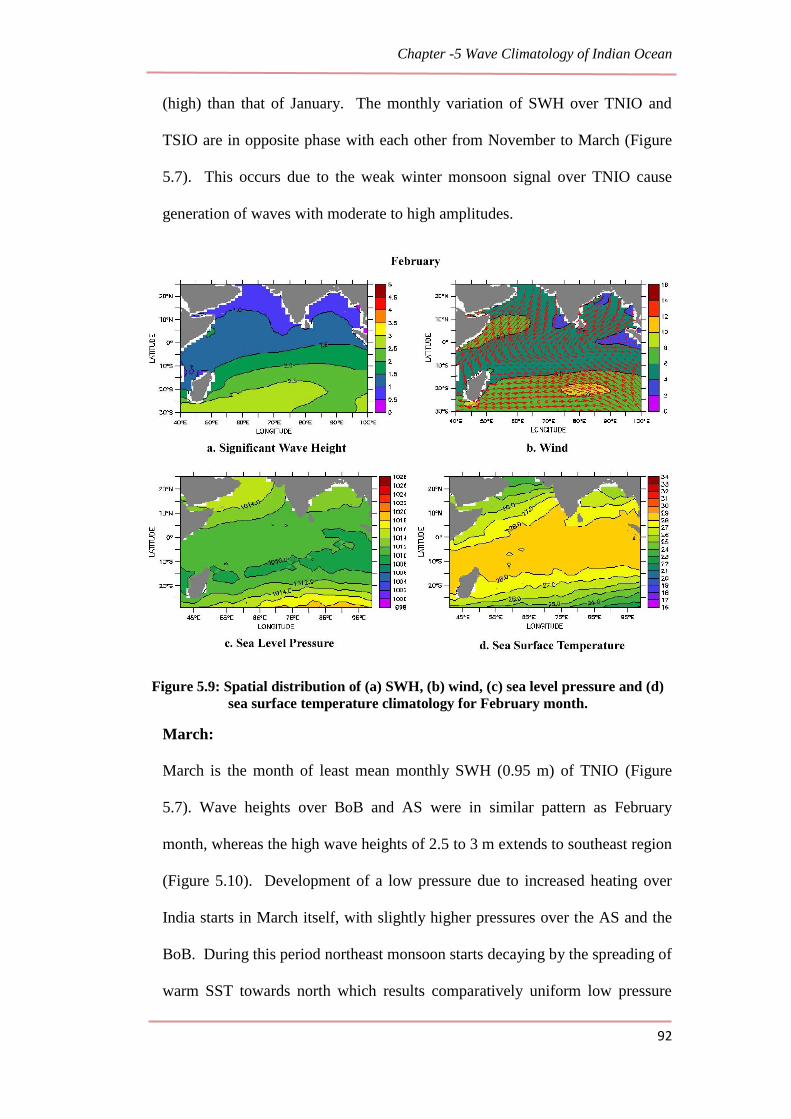
February:
The reduction of winds over the TNIO results in very calm sea state condition
with wave heights <1.5m for entire AS and BoB (Figure 5.9). The wind
direction is almost similar to that of January over the entire region with slight
higher winds off Somali coast. The increased pressure gradient over TSIO
causes enhancement of wind speed with SE component on east and easterly
component on west. This causes the occurrence of waves with >2.5 m over
western region of TSIO. By this month, as the sun starts retreating from the
tropic of Capricorn, the ITCZ shifts towards north. This causes the reduction
of surface pressure gradient over TNIO and increase of pressure gradient over
SIO. The mean monthly SWH over TNIO (TSIO) is comparatively low
Page 13
Chapter -5 Wave Climatology of Indian Ocean
92
(high) than that of January. The monthly variation of SWH over TNIO and
TSIO are in opposite phase with each other from November to March (Figure
5.7). This occurs due to the weak winter monsoon signal over TNIO cause
generation of waves with moderate to high amplitudes.
Figure 5.9: Spatial distribution of (a) SWH, (b) wind, (c) sea level pressure and (d)
sea surface temperature climatology for February month.
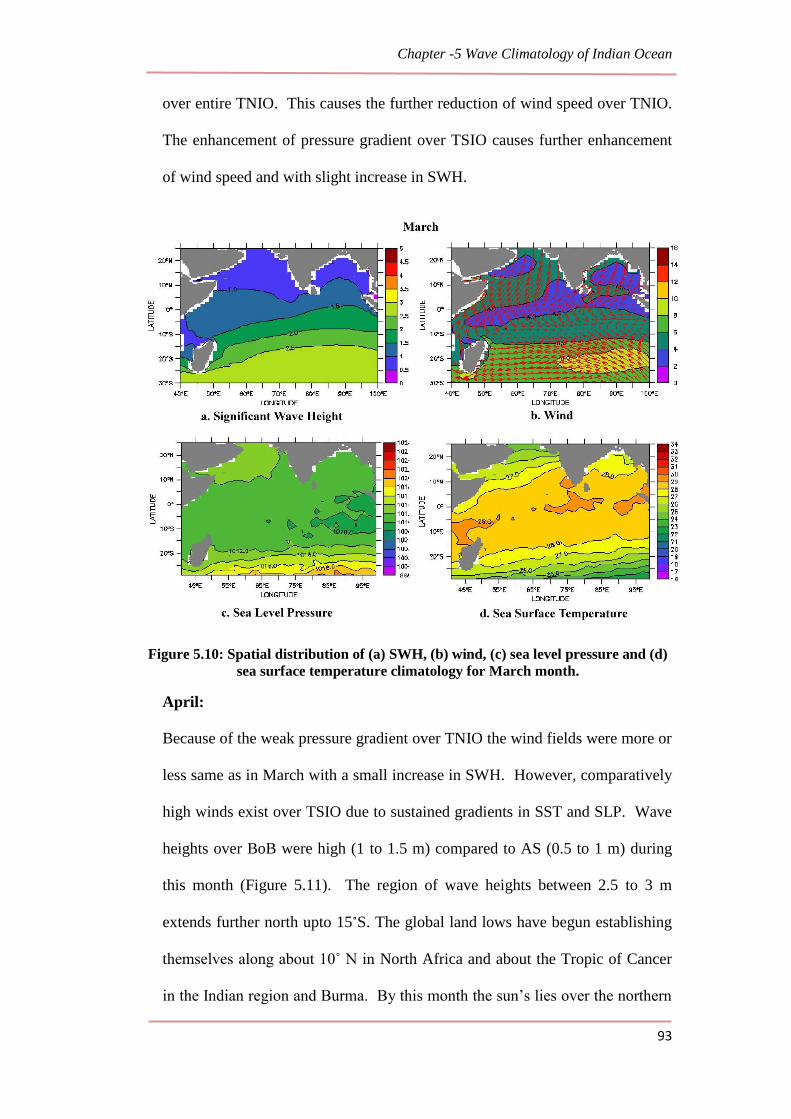
March:
March is the month of least mean monthly SWH (0.95 m) of TNIO (Figure
5.7). Wave heights over BoB and AS were in similar pattern as February
month, whereas the high wave heights of 2.5 to 3 m extends to southeast region
(Figure 5.10). Development of a low pressure due to increased heating over
India starts in March itself, with slightly higher pressures over the AS and the
BoB. During this period northeast monsoon starts decaying by the spreading of
warm SST towards north which results comparatively uniform low pressure
Page 14
Chapter -5 Wave Climatology of Indian Ocean
93
over entire TNIO. This causes the further reduction of wind speed over TNIO.
The enhancement of pressure gradient over TSIO causes further enhancement
of wind speed and with slight increase in SWH.
Figure 5.10: Spatial distribution of (a) SWH, (b) wind, (c) sea level pressure and (d)
sea surface temperature climatology for March month.
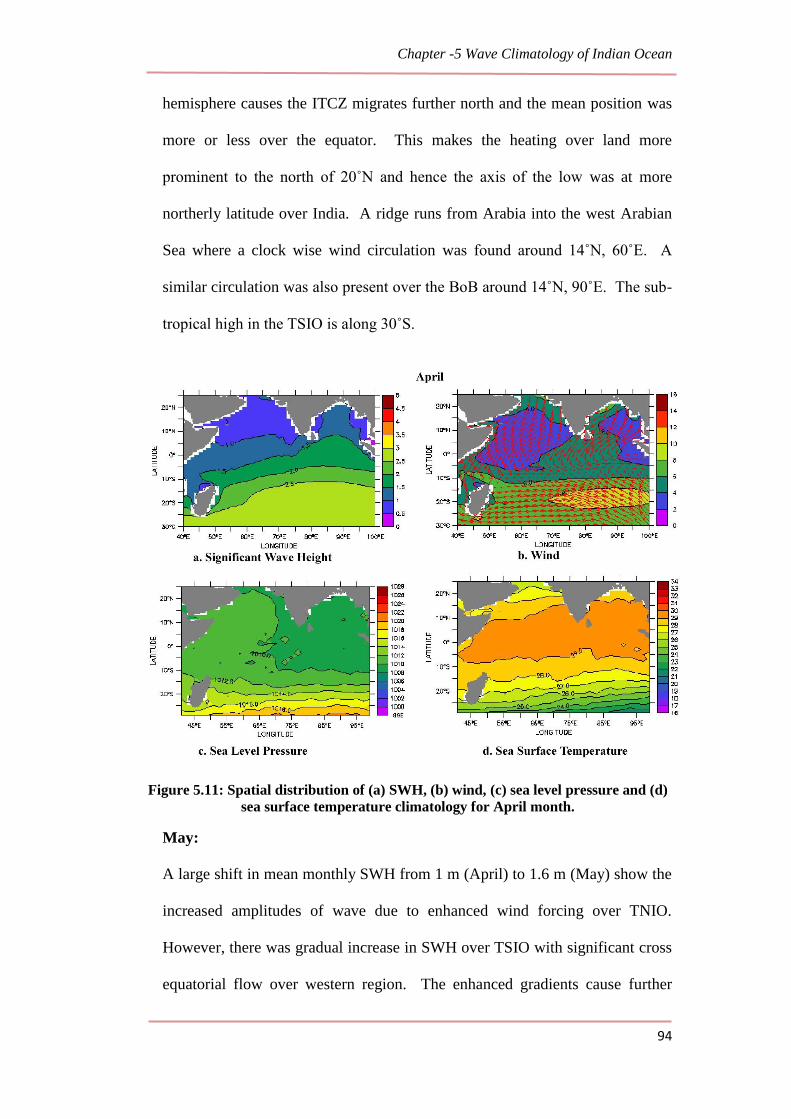
April:
Because of the weak pressure gradient over TNIO the wind fields were more or
less same as in March with a small increase in SWH. However, comparatively
high winds exist over TSIO due to sustained gradients in SST and SLP. Wave
heights over BoB were high (1 to 1.5 m) compared to AS (0.5 to 1 m) during
this month (Figure 5.11). The region of wave heights between 2.5 to 3 m
extends further north upto 15˚S. The global land lows have begun establishing
themselves along about 10˚ N in North Africa and about the Tropic of Cancer
in the Indian region and Burma. By this month the sun’s lies over the northern
Page 15
Chapter -5 Wave Climatology of Indian Ocean
94
hemisphere causes the ITCZ migrates further north and the mean position was
more or less over the equator. This makes the heating over land more
prominent to the north of 20˚N and hence the axis of the low was at more
northerly latitude over India. A ridge runs from Arabia into the west Arabian
Sea where a clock wise wind circulation was found around 14˚N, 60˚E. A
similar circulation was also present over the BoB around 14˚N, 90˚E. The sub-
tropical high in the TSIO is along 30˚S.
Figure 5.11: Spatial distribution of (a) SWH, (b) wind, (c) sea level pressure and (d)
sea surface temperature climatology for April month.
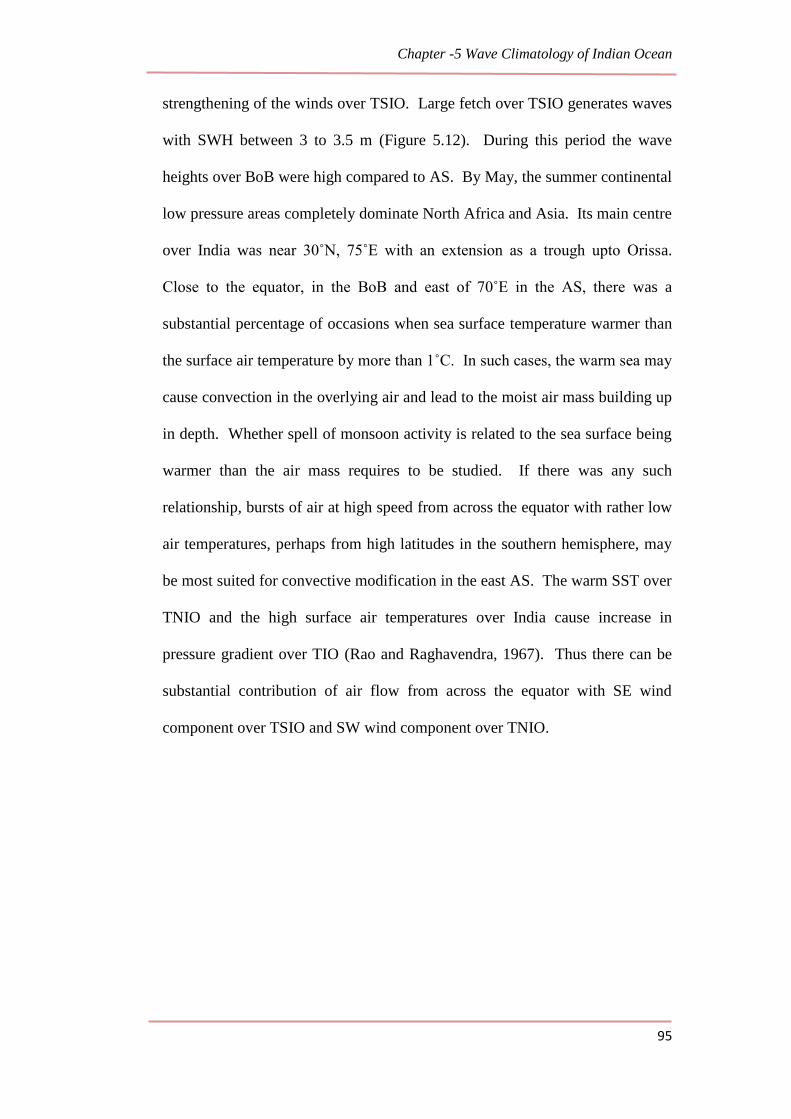
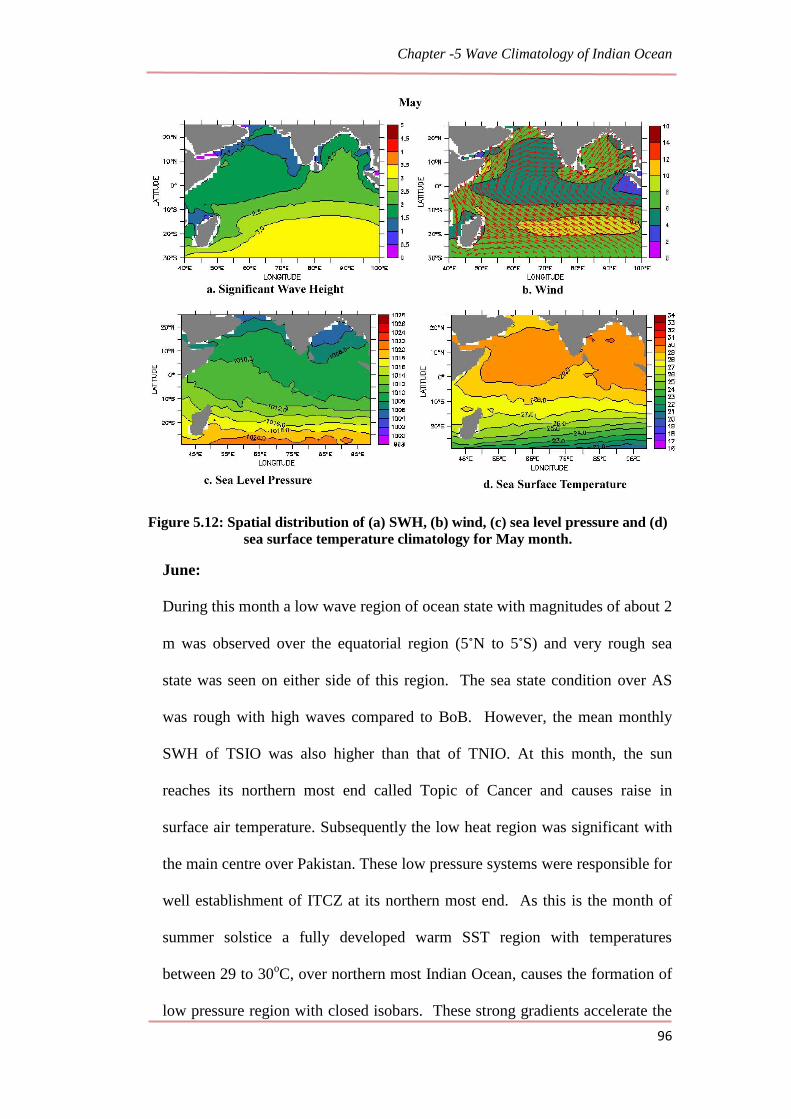
May:
A large shift in mean monthly SWH from 1 m (April) to 1.6 m (May) show the
increased amplitudes of wave due to enhanced wind forcing over TNIO.
However, there was gradual increase in SWH over TSIO with significant cross
equatorial flow over western region. The enhanced gradients cause further
Page 16
Chapter -5 Wave Climatology of Indian Ocean
95
strengthening of the winds over TSIO. Large fetch over TSIO generates waves
with SWH between 3 to 3.5 m (Figure 5.12). During this period the wave
heights over BoB were high compared to AS. By May, the summer continental
low pressure areas completely dominate North Africa and Asia. Its main centre
over India was near 30˚N, 75˚E with an extension as a trough upto Orissa.
Close to the equator, in the BoB and east of 70˚E in the AS, there was a
substantial percentage of occasions when sea surface temperature warmer than
the surface air temperature by more than 1˚C. In such cases, the warm sea may
cause convection in the overlying air and lead to the moist air mass building up
in depth. Whether spell of monsoon activity is related to the sea surface being
warmer than the air mass requires to be studied. If there was any such
relationship, bursts of air at high speed from across the equator with rather low
air temperatures, perhaps from high latitudes in the southern hemisphere, may
be most suited for convective modification in the east AS. The warm SST over
TNIO and the high surface air temperatures over India cause increase in
pressure gradient over TIO (Rao and Raghavendra, 1967). Thus there can be
substantial contribution of air flow from across the equator with SE wind
component over TSIO and SW wind component over TNIO.
Page 17
Chapter -5 Wave Climatology of Indian Ocean
96
Figure 5.12: Spatial distribution of (a) SWH, (b) wind, (c) sea level pressure and (d)
sea surface temperature climatology for May month.
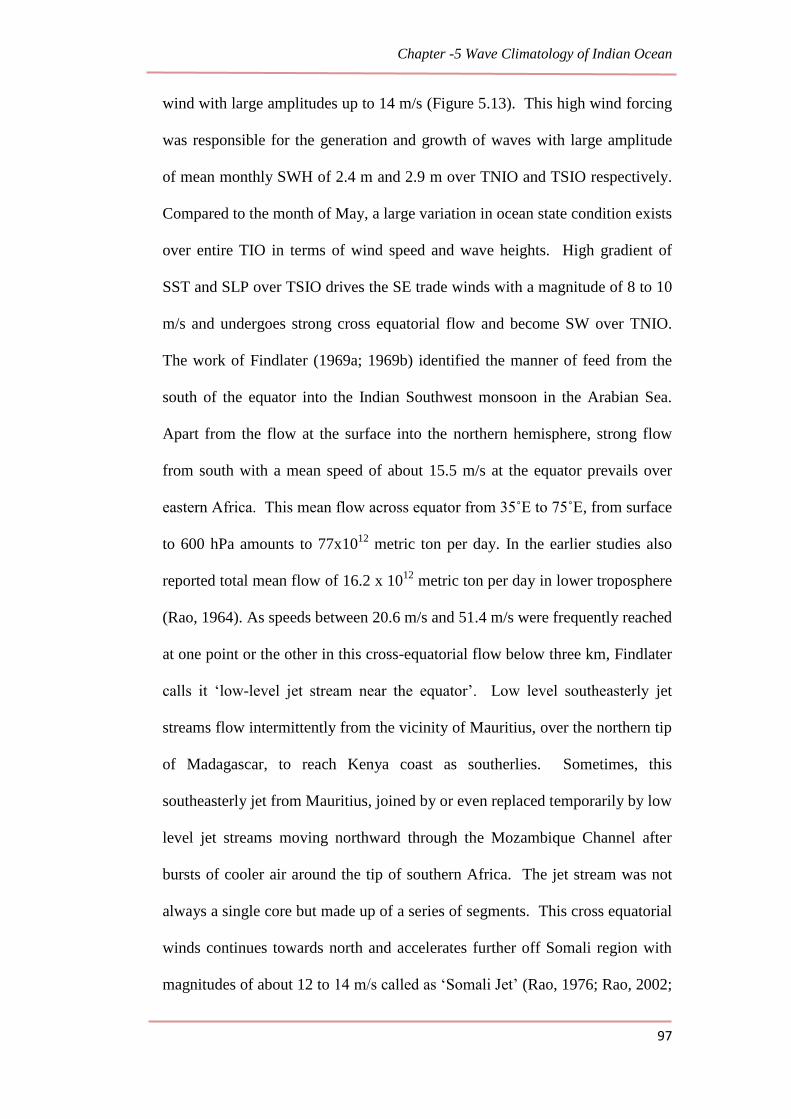
June:
During this month a low wave region of ocean state with magnitudes of about 2
m was observed over the equatorial region (5˚N to 5˚S) and very rough sea
state was seen on either side of this region. The sea state condition over AS
was rough with high waves compared to BoB. However, the mean monthly
SWH of TSIO was also higher than that of TNIO. At this month, the sun
reaches its northern most end called Topic of Cancer and causes raise in
surface air temperature. Subsequently the low heat region was significant with
the main centre over Pakistan. These low pressure systems were responsible for
well establishment of ITCZ at its northern most end. As this is the month of
summer solstice a fully developed warm SST region with temperatures
between 29 to 30oC, over northern most Indian Ocean, causes the formation of
low pressure region with closed isobars. These strong gradients accelerate the
Page 18
Chapter -5 Wave Climatology of Indian Ocean
97
wind with large amplitudes up to 14 m/s (Figure 5.13). This high wind forcing
was responsible for the generation and growth of waves with large amplitude
of mean monthly SWH of 2.4 m and 2.9 m over TNIO and TSIO respectively.
Compared to the month of May, a large variation in ocean state condition exists
over entire TIO in terms of wind speed and wave heights. High gradient of
SST and SLP over TSIO drives the SE trade winds with a magnitude of 8 to 10
m/s and undergoes strong cross equatorial flow and become SW over TNIO.
The work of Findlater (1969a; 1969b) identified the manner of feed from the
south of the equator into the Indian Southwest monsoon in the Arabian Sea.
Apart from the flow at the surface into the northern hemisphere, strong flow
from south with a mean speed of about 15.5 m/s at the equator prevails over
eastern Africa. This mean flow across equator from 35˚E to 75˚E, from surface
to 600 hPa amounts to 77x1012
metric ton per day. In the earlier studies also
reported total mean flow of 16.2 x 10¹²
metric ton per day in lower troposphere
(Rao, 1964). As speeds between 20.6 m/s and 51.4 m/s were frequently reached
at one point or the other in this cross-equatorial flow below three km, Findlater
calls it ‘low-level jet stream near the equator’. Low level southeasterly jet
streams flow intermittently from the vicinity of Mauritius, over the northern tip
of Madagascar, to reach Kenya coast as southerlies. Sometimes, this
southeasterly jet from Mauritius, joined by or even replaced temporarily by low
level jet streams moving northward through the Mozambique Channel after
bursts of cooler air around the tip of southern Africa. The jet stream was not
always a single core but made up of a series of segments. This cross equatorial
winds continues towards north and accelerates further off Somali region with
magnitudes of about 12 to 14 m/s called as ‘Somali Jet’ (Rao, 1976; Rao, 2002;
Page 19
Chapter -5 Wave Climatology of Indian Ocean
98
Gadgil, 2003). Waves with magnitude of 3.5 to 4 m exists at the core of the Jet
over AS (Figure 5.13).
Figure 5.13: Spatial distribution of (a) SWH, (b) wind, (c) sea level pressure and (d)
sea surface temperature climatology for June month.
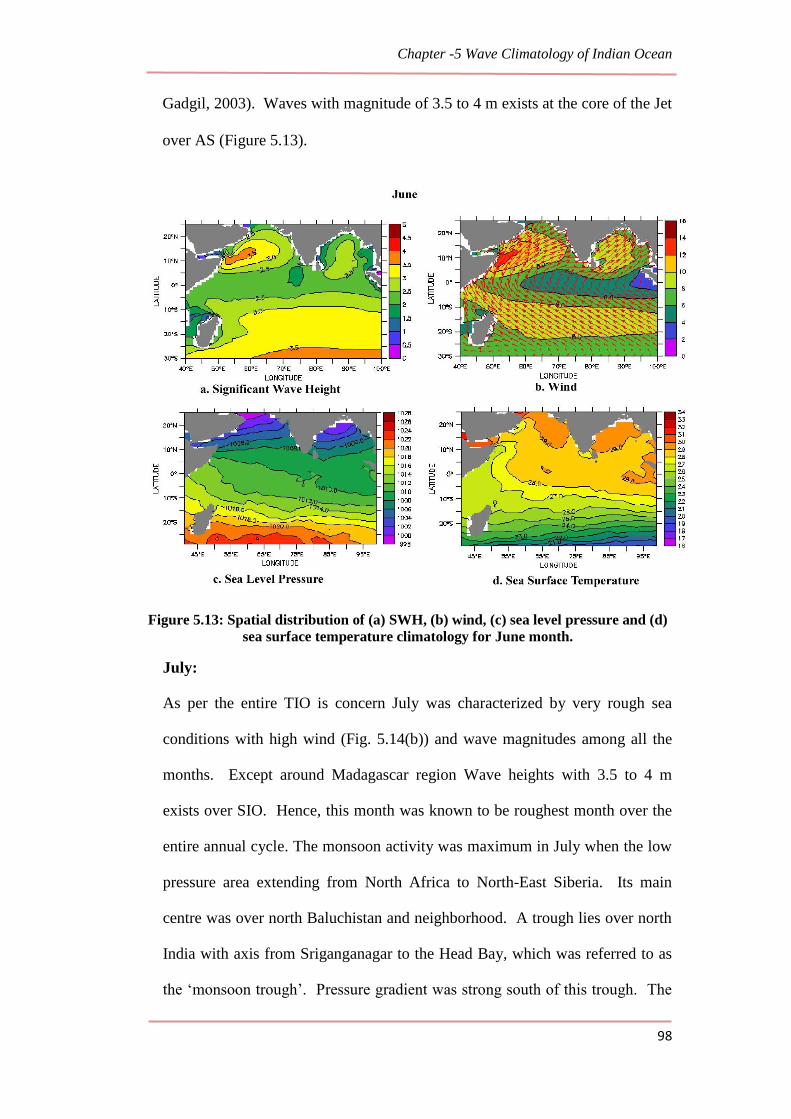
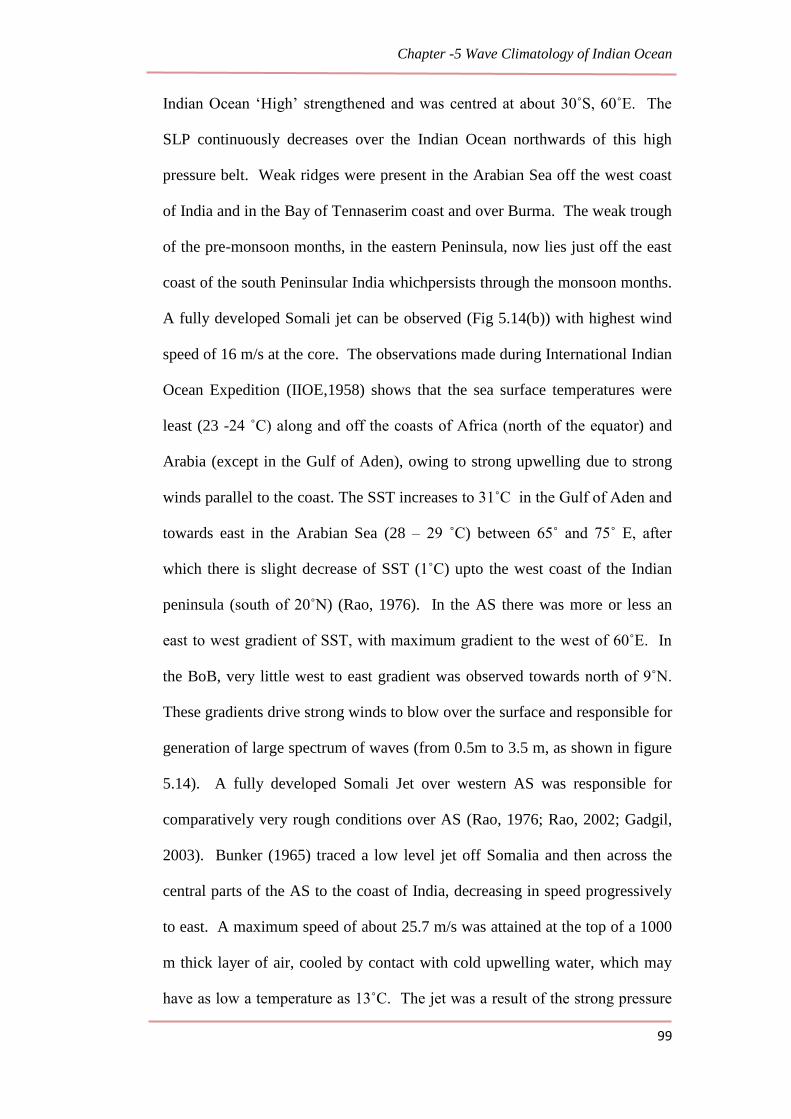
July:
As per the entire TIO is concern July was characterized by very rough sea
conditions with high wind (Fig. 5.14(b)) and wave magnitudes among all the
months. Except around Madagascar region Wave heights with 3.5 to 4 m
exists over SIO. Hence, this month was known to be roughest month over the
entire annual cycle. The monsoon activity was maximum in July when the low
pressure area extending from North Africa to North-East Siberia. Its main
centre was over north Baluchistan and neighborhood. A trough lies over north
India with axis from Sriganganagar to the Head Bay, which was referred to as
the ‘monsoon trough’. Pressure gradient was strong south of this trough. The
Page 20
Chapter -5 Wave Climatology of Indian Ocean
99
Indian Ocean ‘High’ strengthened and was centred at about 30˚S, 60˚E. The
SLP continuously decreases over the Indian Ocean northwards of this high
pressure belt. Weak ridges were present in the Arabian Sea off the west coast
of India and in the Bay of Tennaserim coast and over Burma. The weak trough
of the pre-monsoon months, in the eastern Peninsula, now lies just off the east
coast of the south Peninsular India whichpersists through the monsoon months.
A fully developed Somali jet can be observed (Fig 5.14(b)) with highest wind
speed of 16 m/s at the core. The observations made during International Indian
Ocean Expedition (IIOE,1958) shows that the sea surface temperatures were
least (23 -24 ˚C) along and off the coasts of Africa (north of the equator) and
Arabia (except in the Gulf of Aden), owing to strong upwelling due to strong
winds parallel to the coast. The SST increases to 31˚C in the Gulf of Aden and
towards east in the Arabian Sea (28 – 29 ˚C) between 65˚ and 75˚ E, after
which there is slight decrease of SST (1˚C) upto the west coast of the Indian
peninsula (south of 20˚N) (Rao, 1976). In the AS there was more or less an
east to west gradient of SST, with maximum gradient to the west of 60˚E. In
the BoB, very little west to east gradient was observed towards north of 9˚N.
These gradients drive strong winds to blow over the surface and responsible for
generation of large spectrum of waves (from 0.5m to 3.5 m, as shown in figure
5.14). A fully developed Somali Jet over western AS was responsible for
comparatively very rough conditions over AS (Rao, 1976; Rao, 2002; Gadgil,
2003). Bunker (1965) traced a low level jet off Somalia and then across the
central parts of the AS to the coast of India, decreasing in speed progressively
to east. A maximum speed of about 25.7 m/s was attained at the top of a 1000
m thick layer of air, cooled by contact with cold upwelling water, which may
have as low a temperature as 13˚C. The jet was a result of the strong pressure
Page 21
Chapter -5 Wave Climatology of Indian Ocean
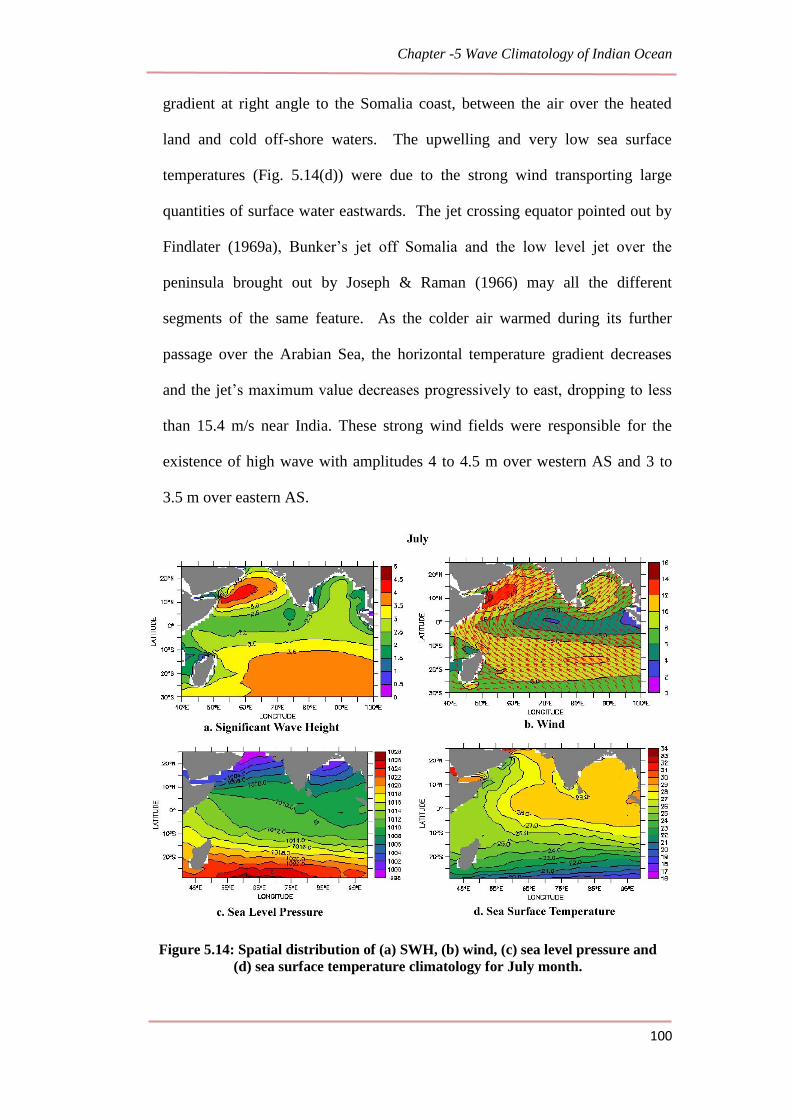
100
gradient at right angle to the Somalia coast, between the air over the heated
land and cold off-shore waters. The upwelling and very low sea surface
temperatures (Fig. 5.14(d)) were due to the strong wind transporting large
quantities of surface water eastwards. The jet crossing equator pointed out by
Findlater (1969a), Bunker’s jet off Somalia and the low level jet over the
peninsula brought out by Joseph & Raman (1966) may all the different
segments of the same feature. As the colder air warmed during its further
passage over the Arabian Sea, the horizontal temperature gradient decreases
and the jet’s maximum value decreases progressively to east, dropping to less
than 15.4 m/s near India. These strong wind fields were responsible for the
existence of high wave with amplitudes 4 to 4.5 m over western AS and 3 to
3.5 m over eastern AS.
Figure 5.14: Spatial distribution of (a) SWH, (b) wind, (c) sea level pressure and
(d) sea surface temperature climatology for July month.
Page 22
Chapter -5 Wave Climatology of Indian Ocean
101
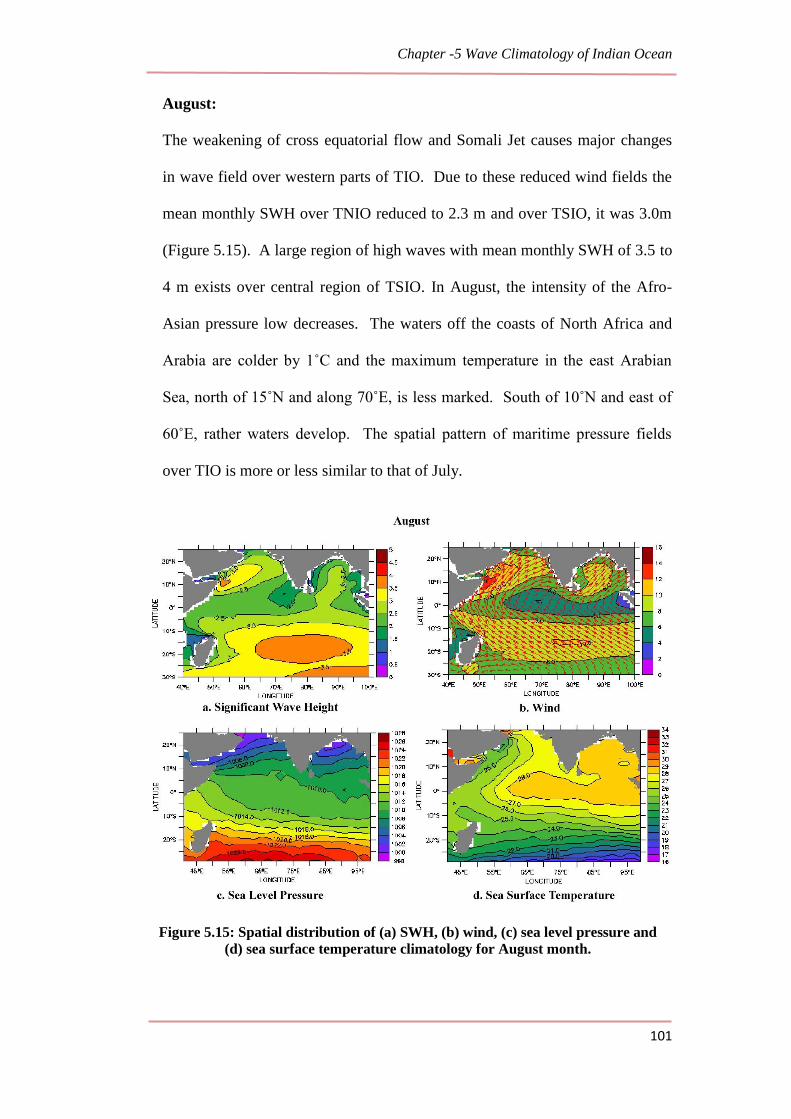
August:
The weakening of cross equatorial flow and Somali Jet causes major changes
in wave field over western parts of TIO. Due to these reduced wind fields the
mean monthly SWH over TNIO reduced to 2.3 m and over TSIO, it was 3.0m
(Figure 5.15). A large region of high waves with mean monthly SWH of 3.5 to
4 m exists over central region of TSIO. In August, the intensity of the Afro-
Asian pressure low decreases. The waters off the coasts of North Africa and
Arabia are colder by 1˚C and the maximum temperature in the east Arabian
Sea, north of 15˚N and along 70˚E, is less marked. South of 10˚N and east of
60˚E, rather waters develop. The spatial pattern of maritime pressure fields
over TIO is more or less similar to that of July.
Figure 5.15: Spatial distribution of (a) SWH, (b) wind, (c) sea level pressure and
(d) sea surface temperature climatology for August month.
Page 23
Chapter -5 Wave Climatology of Indian Ocean
102
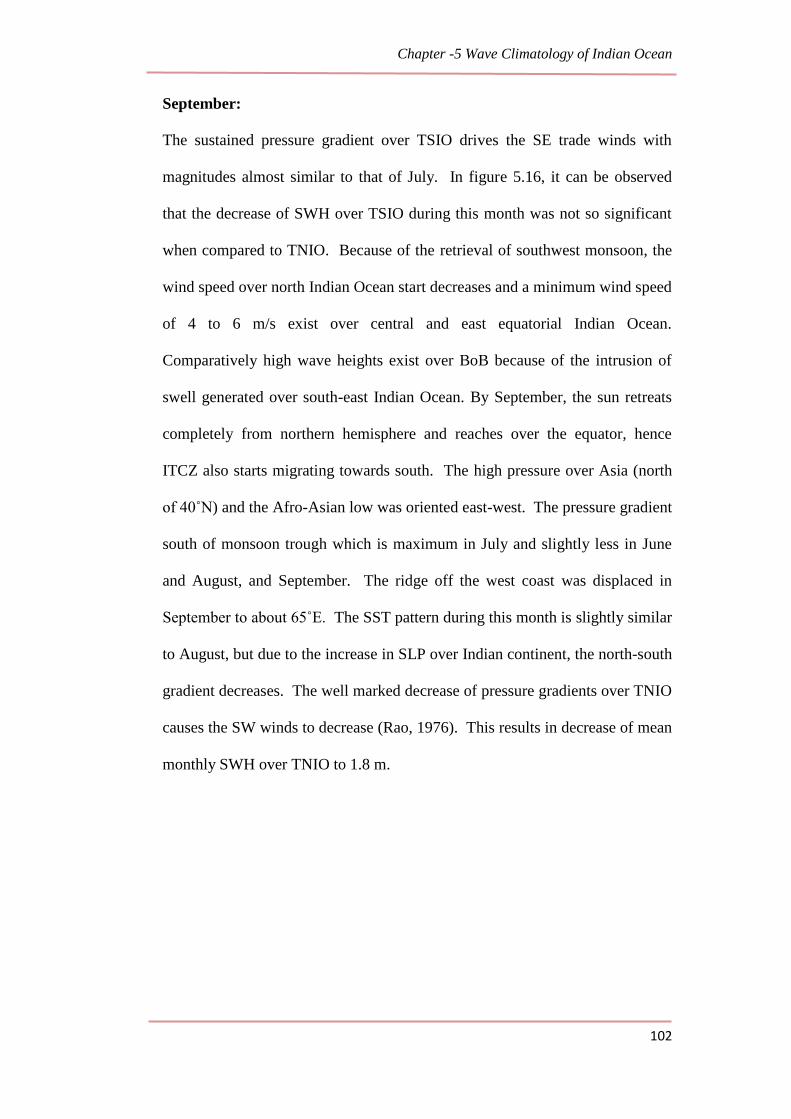
September:
The sustained pressure gradient over TSIO drives the SE trade winds with
magnitudes almost similar to that of July. In figure 5.16, it can be observed
that the decrease of SWH over TSIO during this month was not so significant
when compared to TNIO. Because of the retrieval of southwest monsoon, the
wind speed over north Indian Ocean start decreases and a minimum wind speed
of 4 to 6 m/s exist over central and east equatorial Indian Ocean.
Comparatively high wave heights exist over BoB because of the intrusion of
swell generated over south-east Indian Ocean. By September, the sun retreats
completely from northern hemisphere and reaches over the equator, hence
ITCZ also starts migrating towards south. The high pressure over Asia (north
of 40˚N) and the Afro-Asian low was oriented east-west. The pressure gradient
south of monsoon trough which is maximum in July and slightly less in June
and August, and September. The ridge off the west coast was displaced in
September to about 65˚E. The SST pattern during this month is slightly similar
to August, but due to the increase in SLP over Indian continent, the north-south
gradient decreases. The well marked decrease of pressure gradients over TNIO
causes the SW winds to decrease (Rao, 1976). This results in decrease of mean
monthly SWH over TNIO to 1.8 m.
Page 24
Chapter -5 Wave Climatology of Indian Ocean
103
Figure 5.16: Spatial distribution of (a) SWH, (b) wind, (c) sea level pressure and
(d) sea surface temperature climatology for September month.
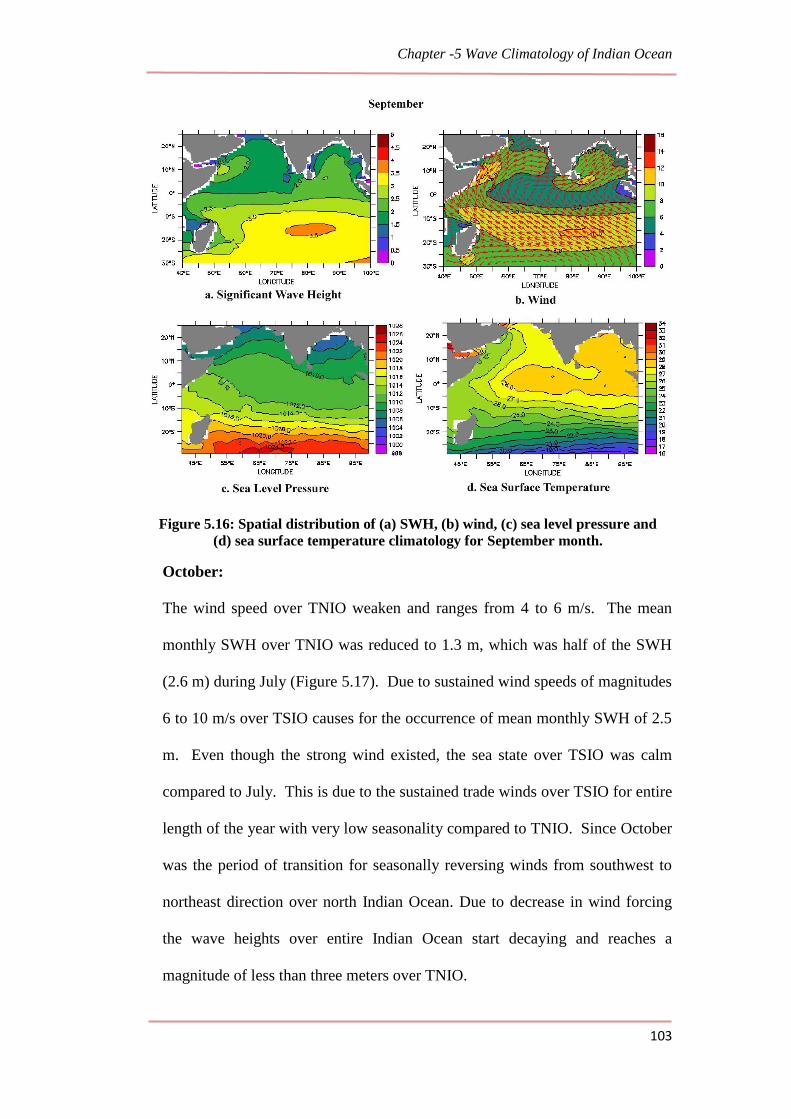
October:
The wind speed over TNIO weaken and ranges from 4 to 6 m/s. The mean
monthly SWH over TNIO was reduced to 1.3 m, which was half of the SWH
(2.6 m) during July (Figure 5.17). Due to sustained wind speeds of magnitudes
6 to 10 m/s over TSIO causes for the occurrence of mean monthly SWH of 2.5
m. Even though the strong wind existed, the sea state over TSIO was calm
compared to July. This is due to the sustained trade winds over TSIO for entire
length of the year with very low seasonality compared to TNIO. Since October
was the period of transition for seasonally reversing winds from southwest to
northeast direction over north Indian Ocean. Due to decrease in wind forcing
the wave heights over entire Indian Ocean start decaying and reaches a
magnitude of less than three meters over TNIO.
Page 25
Chapter -5 Wave Climatology of Indian Ocean
104
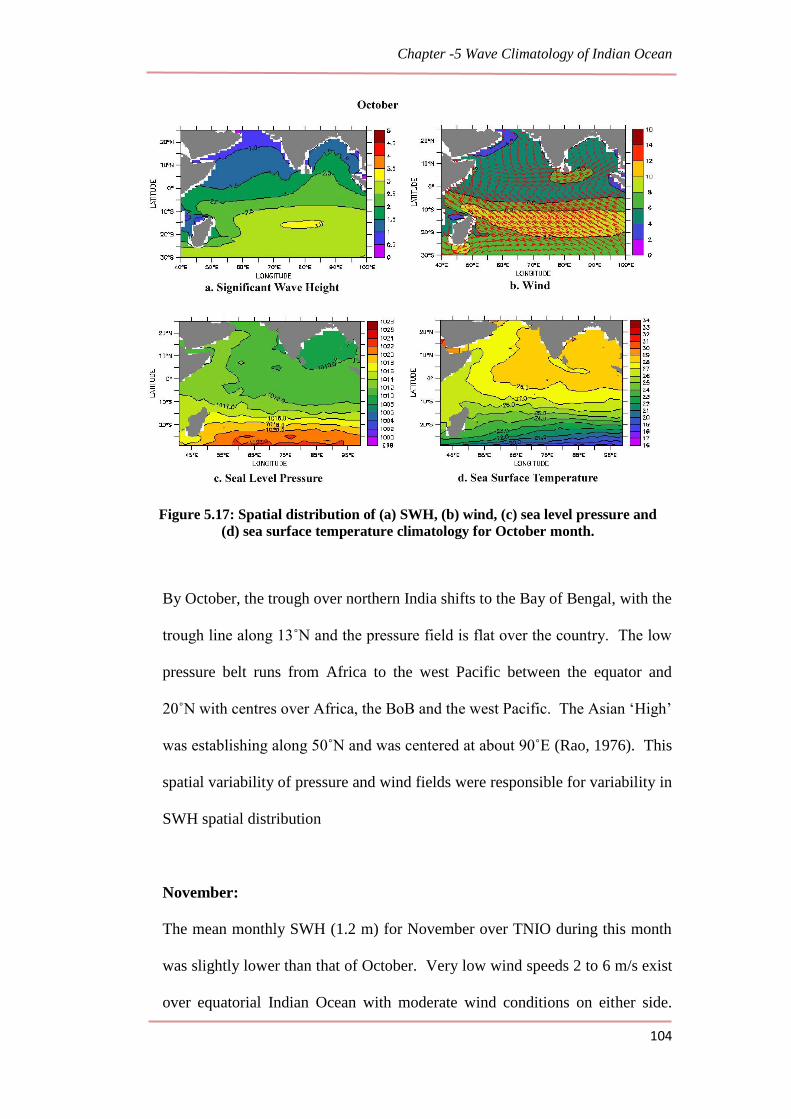
Figure 5.17: Spatial distribution of (a) SWH, (b) wind, (c) sea level pressure and
(d) sea surface temperature climatology for October month.
By October, the trough over northern India shifts to the Bay of Bengal, with the
trough line along 13˚N and the pressure field is flat over the country. The low
pressure belt runs from Africa to the west Pacific between the equator and
20˚N with centres over Africa, the BoB and the west Pacific. The Asian ‘High’
was establishing along 50˚N and was centered at about 90˚E (Rao, 1976). This
spatial variability of pressure and wind fields were responsible for variability in
SWH spatial distribution
November:
The mean monthly SWH (1.2 m) for November over TNIO during this month
was slightly lower than that of October. Very low wind speeds 2 to 6 m/s exist
over equatorial Indian Ocean with moderate wind conditions on either side.
Page 26
Chapter -5 Wave Climatology of Indian Ocean
105
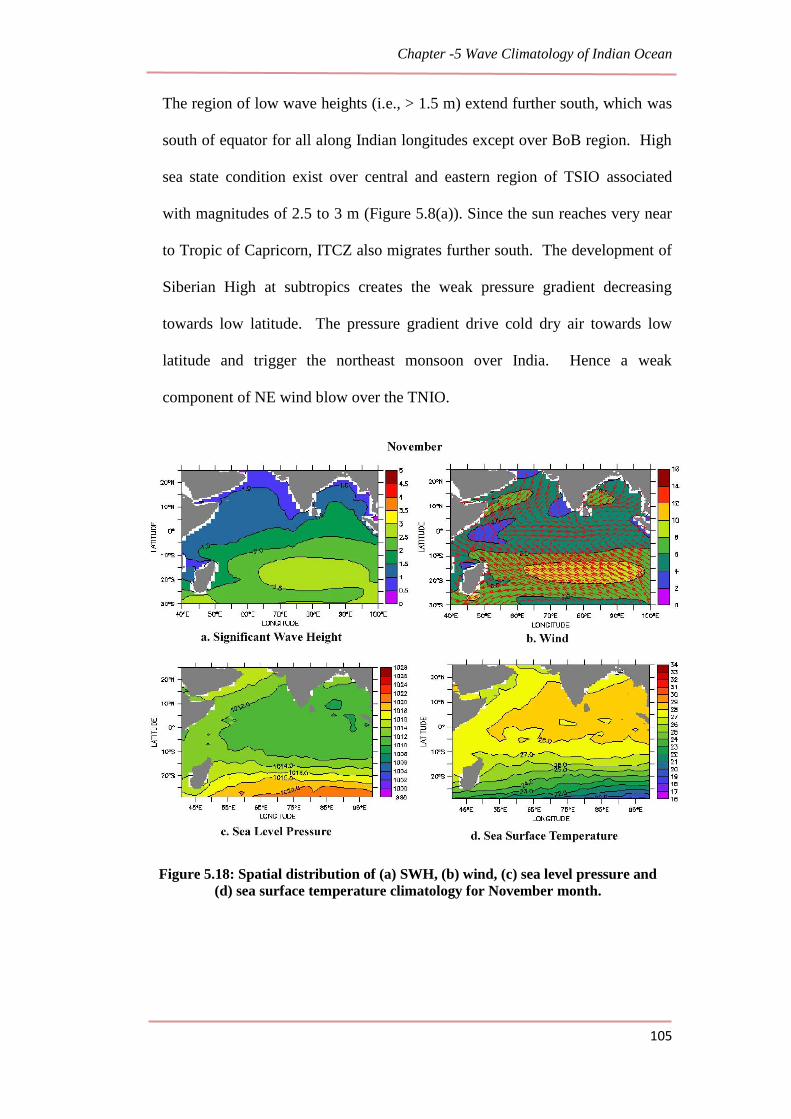
The region of low wave heights (i.e., > 1.5 m) extend further south, which was
south of equator for all along Indian longitudes except over BoB region. High
sea state condition exist over central and eastern region of TSIO associated
with magnitudes of 2.5 to 3 m (Figure 5.8(a)). Since the sun reaches very near
to Tropic of Capricorn, ITCZ also migrates further south. The development of
Siberian High at subtropics creates the weak pressure gradient decreasing
towards low latitude. The pressure gradient drive cold dry air towards low
latitude and trigger the northeast monsoon over India. Hence a weak
component of NE wind blow over the TNIO.
Figure 5.18: Spatial distribution of (a) SWH, (b) wind, (c) sea level pressure and
(d) sea surface temperature climatology for November month.
Page 27
Chapter -5 Wave Climatology of Indian Ocean
106
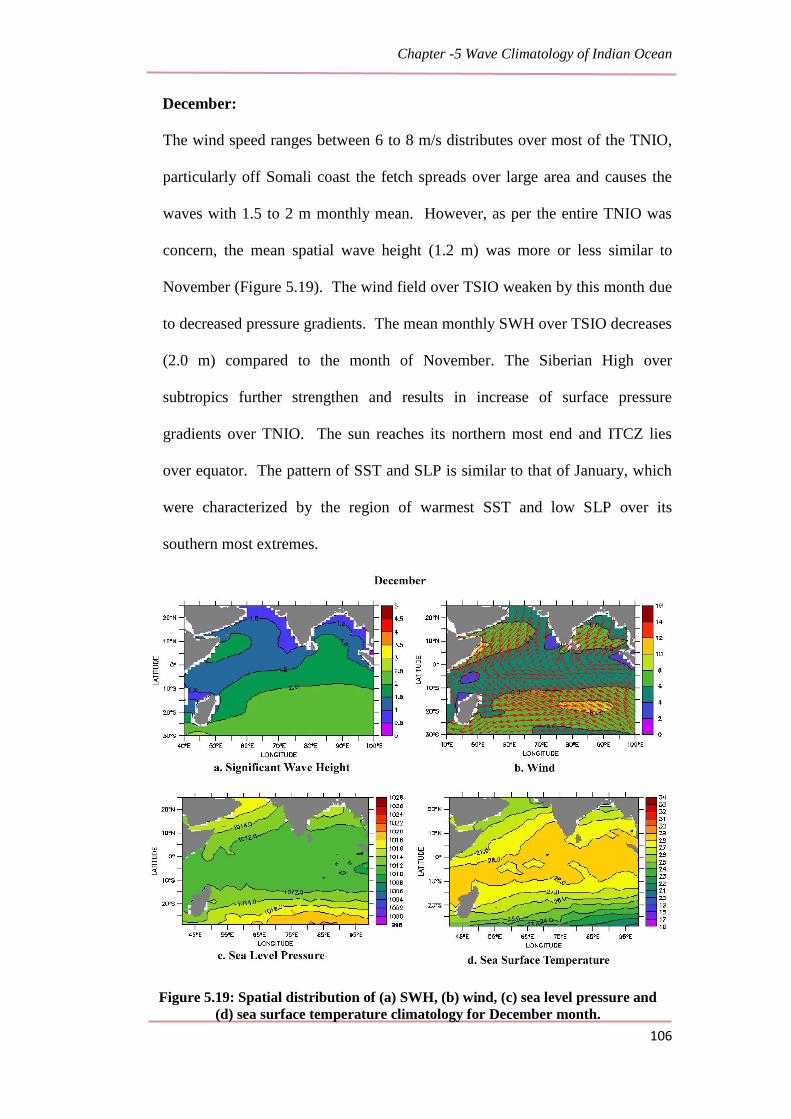
December:
The wind speed ranges between 6 to 8 m/s distributes over most of the TNIO,
particularly off Somali coast the fetch spreads over large area and causes the
waves with 1.5 to 2 m monthly mean. However, as per the entire TNIO was
concern, the mean spatial wave height (1.2 m) was more or less similar to
November (Figure 5.19). The wind field over TSIO weaken by this month due
to decreased pressure gradients. The mean monthly SWH over TSIO decreases
(2.0 m) compared to the month of November. The Siberian High over
subtropics further strengthen and results in increase of surface pressure
gradients over TNIO. The sun reaches its northern most end and ITCZ lies
over equator. The pattern of SST and SLP is similar to that of January, which
were characterized by the region of warmest SST and low SLP over its
southern most extremes.
Figure 5.19: Spatial distribution of (a) SWH, (b) wind, (c) sea level pressure and
(d) sea surface temperature climatology for December month.
Page 28
Chapter -5 Wave Climatology of Indian Ocean
107
5.5 Seasonality of wave climate:
Apart from the daily and monthly climatology discussed in earlier sections, an
attempt has been also made to understand the seasonality of the wave climate. The
results were presented along two meridional transects (65˚ E and 90˚ E), three
zonal transects (15˚ N, equator and 15˚ S). Further Principal Component Analysis
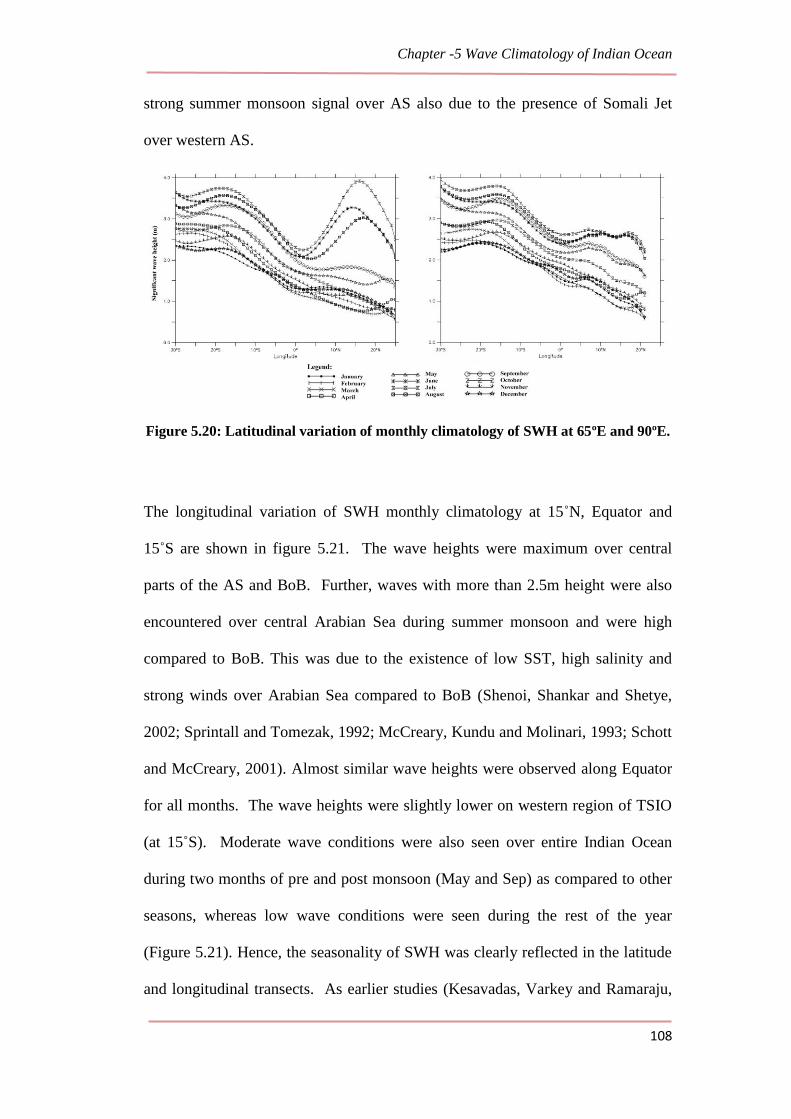
(PCA) of the annual cycle was also carried out. The latitudinal variation of SWH
monthly climatology at 65˚E longitude and 90˚E longitude is shown in figure
5.20. There were three major features of the wave climate were observed. First
one was a clear decreasing gradient of SWH towards north for all months except
during July at 65˚E. This was due to the presence of Somali Jet. A large fetch and
sustained winds for the entire annual cycle over TSIO was responsible for the
generation of high waves and propagates towards north with decreasing
magnitude. However, the sea state over TNIO was dominant during summer
monsoon with strong wind forcing. A study conducted by Chandramohan et al.
(1991) also reveals that the wave heights during summer monsoon were
comparatively high than other months. The second feature was, a clear
classification of annual cycle into three seasons i.e., summer monsoon (JJA), one
month each of pre and post monsoon (May and Sep) and rest of the year
(ONDJF)(figure 5.20). This classification was particularly significant over TNIO
(i.e., over AS and BoB) due to seasonal reversal of winds. Kesavadas et al. (1979)
were analyzed the wave data collected from ship borne wave recorder over eastern
AS (Lakshadweep) in 1978. They classified the wave data in to two seasons (June
to September and October to May) based on magnitude of wave height and period.
The third feature was the contrasting sea state condition over TNIO. The sea state
over AS was rough compared to BoB, from May to September, which was due to
Page 29
Chapter -5 Wave Climatology of Indian Ocean
108
strong summer monsoon signal over AS also due to the presence of Somali Jet
over western AS.
Figure 5.20: Latitudinal variation of monthly climatology of SWH at 65ºE and 90ºE.
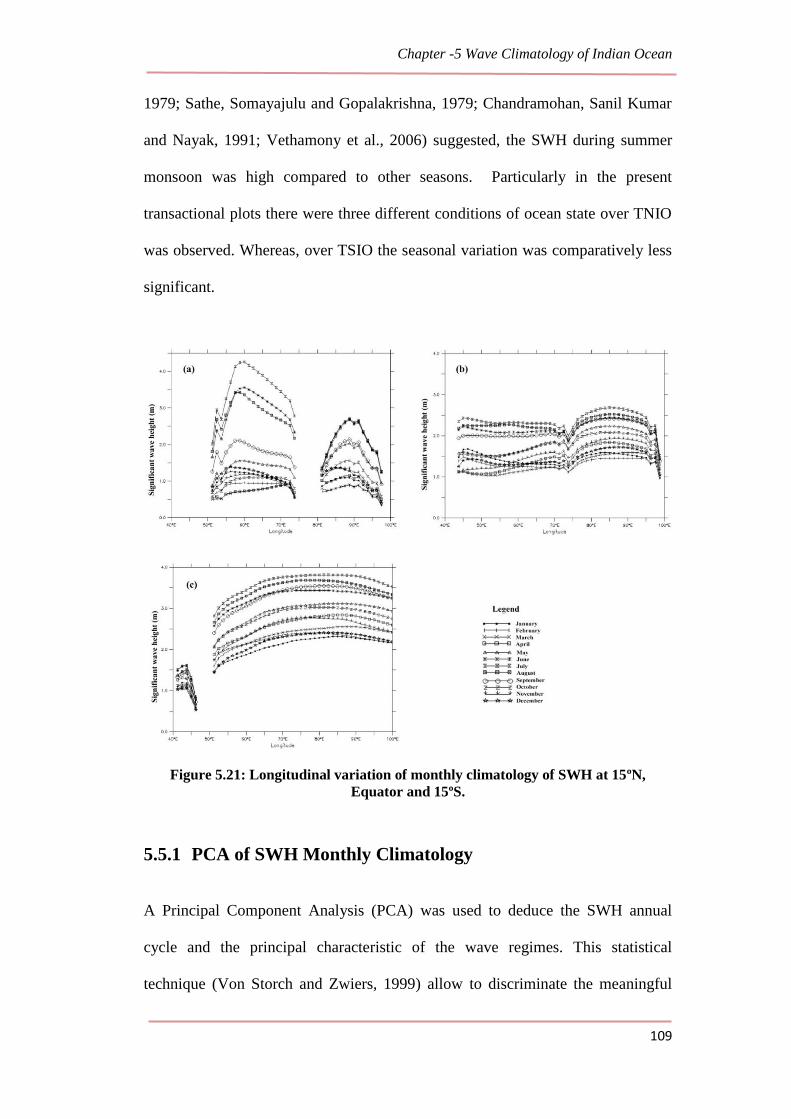
The longitudinal variation of SWH monthly climatology at 15˚N, Equator and
15˚S are shown in figure 5.21. The wave heights were maximum over central
parts of the AS and BoB. Further, waves with more than 2.5m height were also
encountered over central Arabian Sea during summer monsoon and were high
compared to BoB. This was due to the existence of low SST, high salinity and
strong winds over Arabian Sea compared to BoB (Shenoi, Shankar and Shetye,
2002; Sprintall and Tomezak, 1992; McCreary, Kundu and Molinari, 1993; Schott
and McCreary, 2001). Almost similar wave heights were observed along Equator
for all months. The wave heights were slightly lower on western region of TSIO
(at 15˚S). Moderate wave conditions were also seen over entire Indian Ocean
during two months of pre and post monsoon (May and Sep) as compared to other
seasons, whereas low wave conditions were seen during the rest of the year
(Figure 5.21). Hence, the seasonality of SWH was clearly reflected in the latitude
and longitudinal transects. As earlier studies (Kesavadas, Varkey and Ramaraju,
Page 30
Chapter -5 Wave Climatology of Indian Ocean
109
1979; Sathe, Somayajulu and Gopalakrishna, 1979; Chandramohan, Sanil Kumar
and Nayak, 1991; Vethamony et al., 2006) suggested, the SWH during summer
monsoon was high compared to other seasons. Particularly in the present
transactional plots there were three different conditions of ocean state over TNIO
was observed. Whereas, over TSIO the seasonal variation was comparatively less
significant.
Figure 5.21: Longitudinal variation of monthly climatology of SWH at 15ºN,
Equator and 15ºS.
5.5.1 PCA of SWH Monthly Climatology
A Principal Component Analysis (PCA) was used to deduce the SWH annual
cycle and the principal characteristic of the wave regimes. This statistical
technique (Von Storch and Zwiers, 1999) allow to discriminate the meaningful
Page 31
Chapter -5 Wave Climatology of Indian Ocean
110
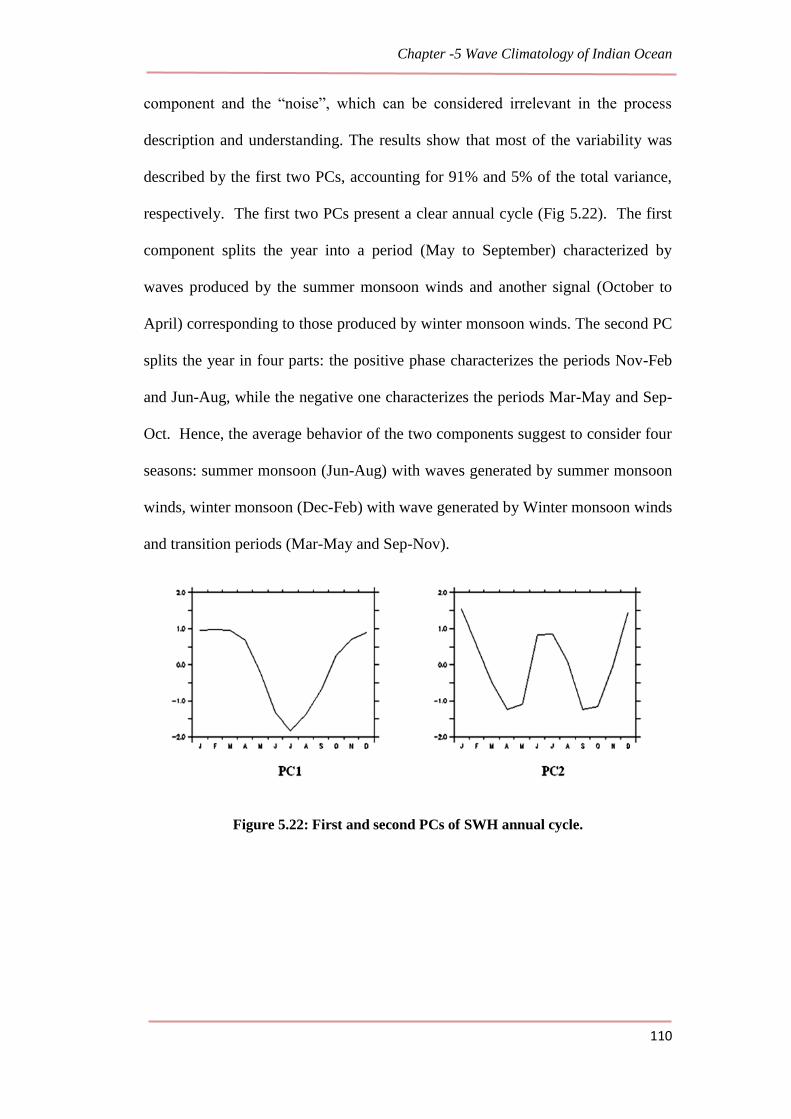
component and the “noise”, which can be considered irrelevant in the process
description and understanding. The results show that most of the variability was
described by the first two PCs, accounting for 91% and 5% of the total variance,
respectively. The first two PCs present a clear annual cycle (Fig 5.22). The first
component splits the year into a period (May to September) characterized by
waves produced by the summer monsoon winds and another signal (October to
April) corresponding to those produced by winter monsoon winds. The second PC
splits the year in four parts: the positive phase characterizes the periods Nov-Feb
and Jun-Aug, while the negative one characterizes the periods Mar-May and Sep-
Oct. Hence, the average behavior of the two components suggest to consider four
seasons: summer monsoon (Jun-Aug) with waves generated by summer monsoon
winds, winter monsoon (Dec-Feb) with wave generated by Winter monsoon winds
and transition periods (Mar-May and Sep-Nov).
Figure 5.22: First and second PCs of SWH annual cycle.
Page 32
Chapter -5 Wave Climatology of Indian Ocean
111
5.6 Summary
The chapter presents detailed discussion on daily and monthly climatology of
SWH computed from model data. The spatially averaged daily climatology of
SWH for different sectors of Indian Ocean i.e., AS (40˚-77˚E; 5˚-25˚N), BoB
(77˚-100˚E; 5˚-25˚N) and Tropical South Indian Ocean (TSIO) (5˚N-30˚S; 40˚-
100˚E) was analyzed. The annual cycle of TIO was dominated by high wave
conditions during southwest monsoon, low wave conditions during winter
monsoon and moderate wave conditions during transition periods. Due to high
contrasting seasonality of winds over AS, the wider range (0.5 m to 3.5 m) of
wave heights were observed. For BoB, SWH daily climatology ranged from 0.5 m
to 2.5 m. The southern part of Indian Ocean covering from equator to 30˚S was
characterized by high waves compared to both AS and BoB. Monthly climatology
of SWH over TNIO showed strong seasonality with primary maximum during
summer monsoon and secondary maximum during winter monsoon. The seasonal
signal over TSIO consists of single maximum during summer monsoon. The
highest sea state condition over entire TIO was observed during July and lowest
during transition months (i.e., Mar and Nov). Another important observation was
that the monthly mean SWH over TSIO was greater than that of TNIO for entire
annual cycle due to strong sustained SE trade winds. There were three major
features of the wave climate observed in latitudinal transects. First one was a
clear decreasing gradient of SWH towards north for all months except during July
at 65˚E. The second feature was, a clear classification of annual cycle into three
seasons i.e., summer monsoon (JJA), one month each of pre and post monsoon
(May and Sep) and rest of the year (ONDJF). This classification was particularly
significant over TNIO (i.e., over AS and BoB) due to seasonal reversal of winds.
Page 33
Chapter -5 Wave Climatology of Indian Ocean
112
The third feature was the contrasting sea state condition over TNIO. The sea state
over AS was rough compared to BoB, from May to September, which was due to
strong summer monsoon signal over AS also due to the presence of Somali Jet
over western AS. The wave heights were maximum over central parts of the AS
and BoB. The average behavior of the two components of PCA suggest to
consider four seasons: summer monsoon (Jun-Aug) with waves generated by
Summer monsoon winds, winter monsoon (Dec-Feb) with wave generated by
Winter monsoon winds and transition periods (Mar-May and Sep-Nov).