20
hapter 54: Ecosystems is an ecosystem? l the organisms living within an area & all the abiotic facto ey interact with ergy flows through while chemicals cycle within an ecosystem
| Date post: | 31-Dec-2015 |
| Category: |
Documents |
| Upload: | freya-bullock |
| View: | 25 times |
| Download: | 1 times |
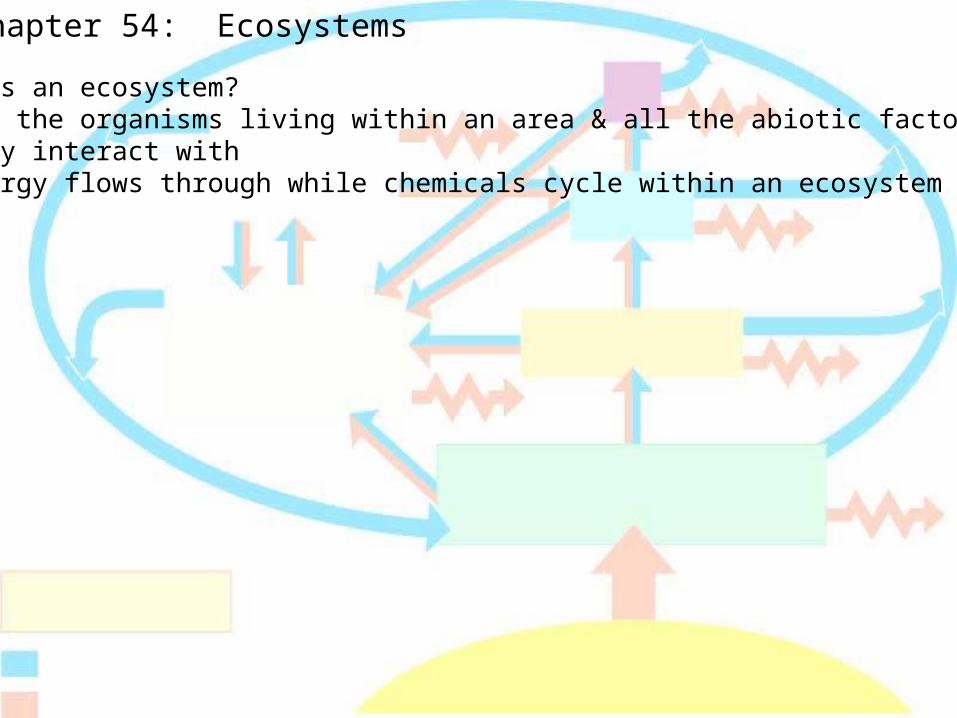
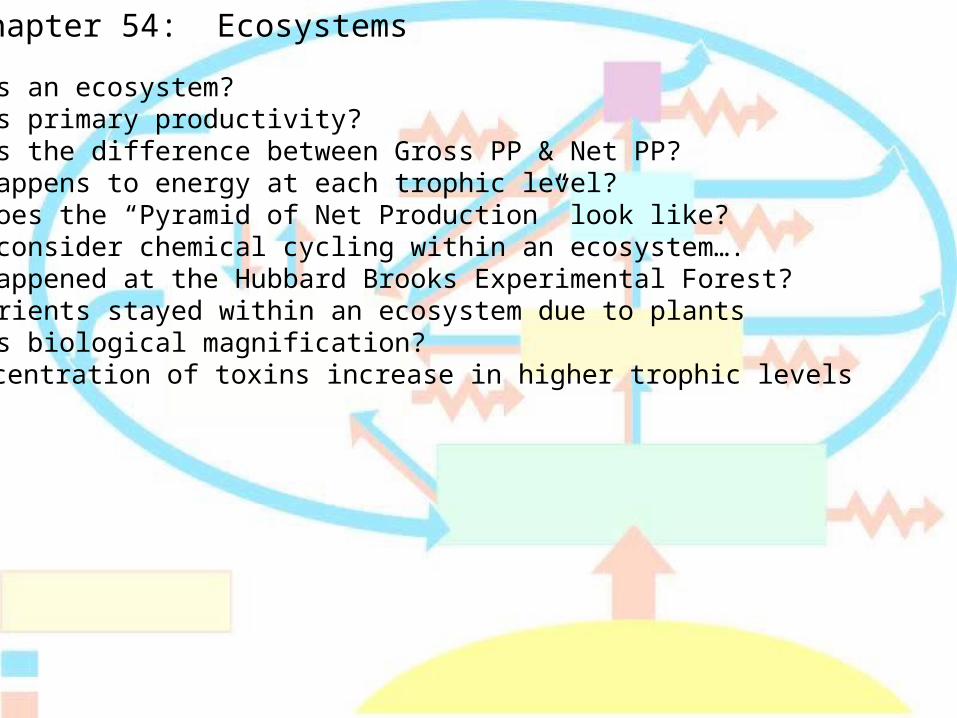
Chapter 54: Ecosystems
1. What is an ecosystem?- All the organisms living within an area & all the abiotic factors
they interact with- Energy flows through while chemicals cycle within an ecosystem

Figure 54.2 An overview of energy and nutrient dynamics in an ecosystem
Microorganismsand other
detritivores
Detritus
Primary producers
Primary consumers
Secondaryconsumers
Tertiary consumers
Heat
Sun
Key
Chemical cycling
Energy flow
Chapter 54: Ecosystems
1. What is an ecosystem?- All the organisms living within an area & all the abiotic factors
they interact with- Energy flows through while chemicals cycle within an ecosystem
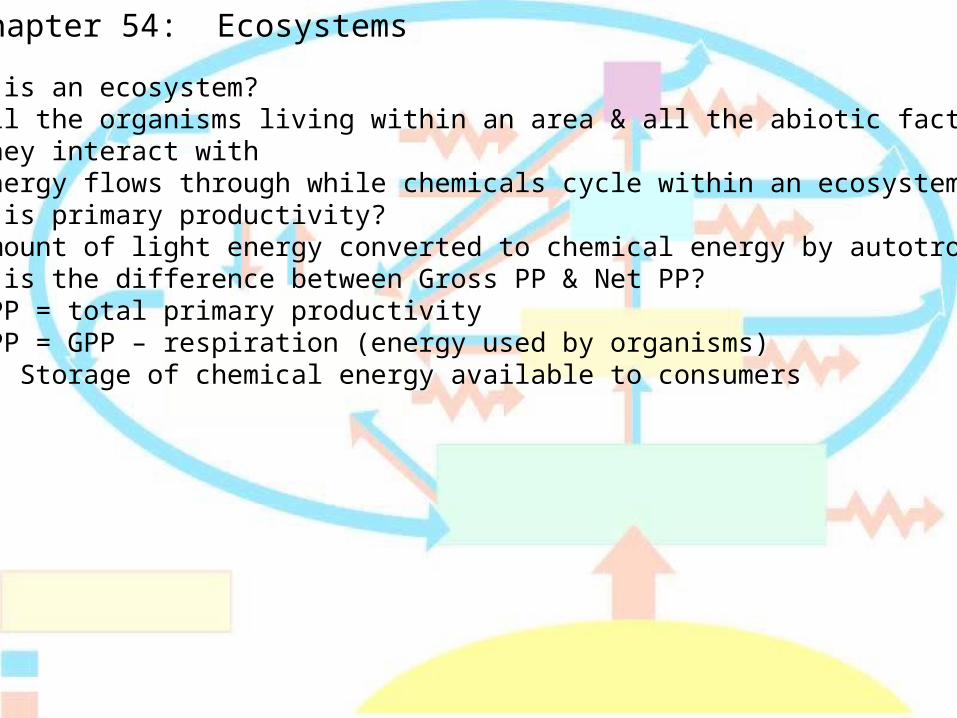
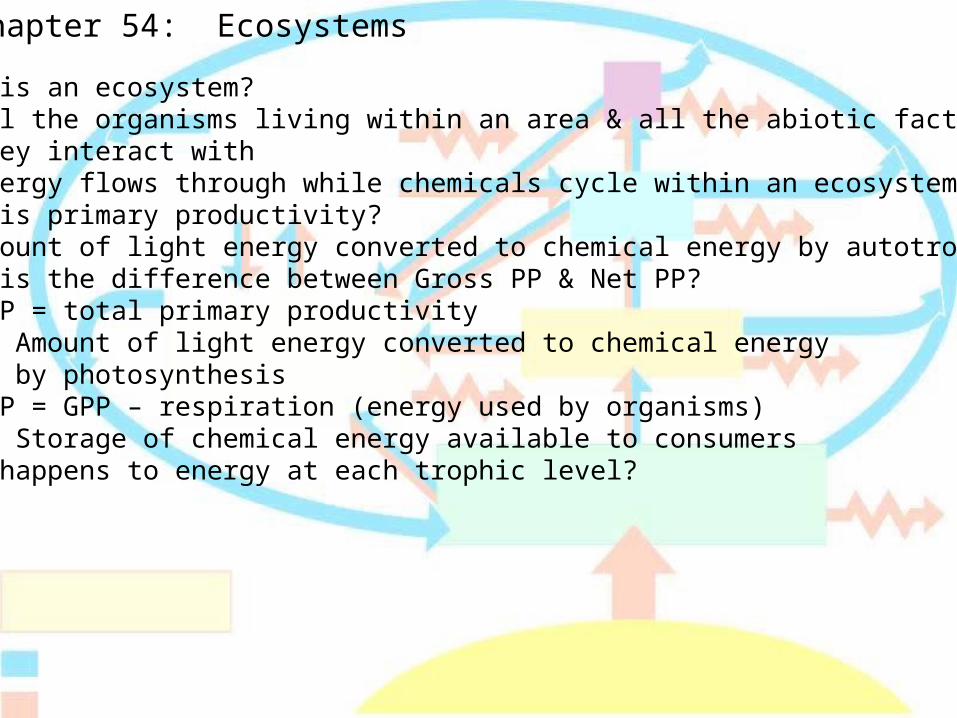
2. What is primary productivity?- Amount of light energy converted to chemical energy by autotrophs
3. What is the difference between Gross PP & Net PP?- GPP = total primary productivity - NPP = GPP – respiration (energy used by organisms)
- Storage of chemical energy available to consumers
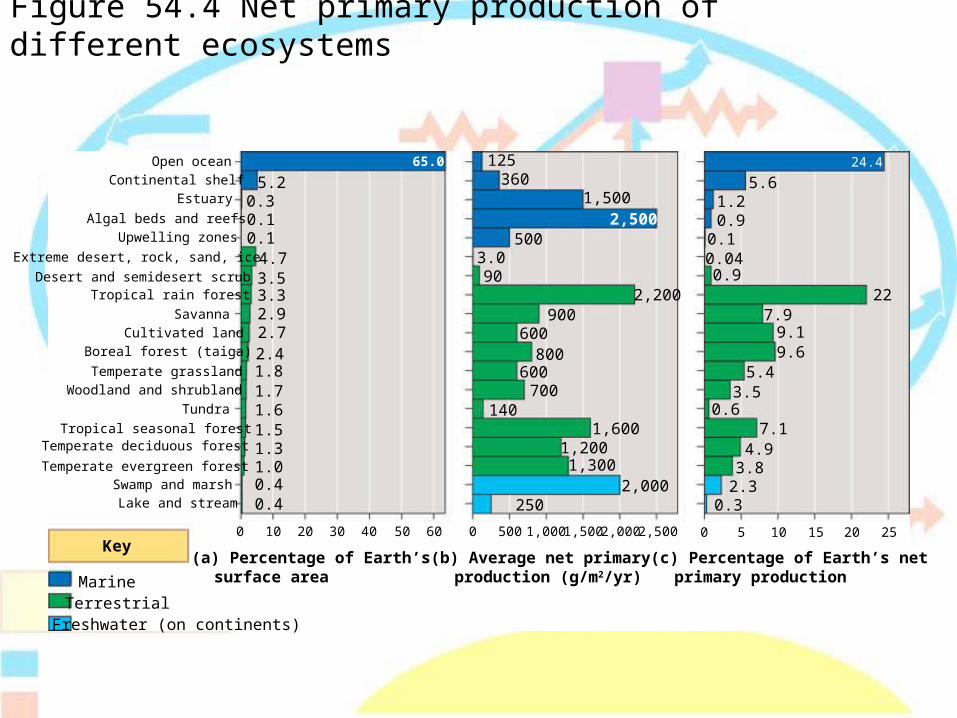
Figure 54.4 Net primary production of different ecosystems
Lake and stream
Open ocean
Continental shelf
Estuary
Algal beds and reefs
Upwelling zones
Extreme desert, rock, sand, ice
Desert and semidesert scrubTropical rain forest
Savanna
Cultivated land
Boreal forest (taiga)
Temperate grassland
Tundra
Tropical seasonal forestTemperate deciduous forest
Temperate evergreen forestSwamp and marsh
Woodland and shrubland
0 10 20 30 40 50 60 0 500 1,000 1,500 2,000 2,500 0 5 10 15 20 25
(a) Percentage of Earth’ssurface area
(b) Average net primaryproduction (g/m2/yr)
(c) Percentage of Earth’s netprimary production
Key
Marine
Freshwater (on continents)Terrestrial
5.20.30.10.1
4.73.53.32.92.72.41.81.71.61.51.31.00.40.4
125360
1,5002,500
5003.090
2,200900
600800
600700
1401,600
1,2001,300
2,000250
5.61.20.9
0.10.040.9
227.9
9.19.6
5.43.5
0.67.1
4.93.8
2.30.3
65.0 24.4

Figure 54.5 Regional annual net primary production for Earth
180 120W 60W 0 60E 120E 180
North Pole
60N
30N
Equator
30S
60S
South Pole
Chapter 54: Ecosystems
1. What is an ecosystem?- All the organisms living within an area & all the abiotic factors
they interact with- Energy flows through while chemicals cycle within an ecosystem
2. What is primary productivity?- Amount of light energy converted to chemical energy by autotrophs
3. What is the difference between Gross PP & Net PP?- GPP = total primary productivity
- Amount of light energy converted to chemical energy by photosynthesis
- NPP = GPP – respiration (energy used by organisms)- Storage of chemical energy available to consumers
4. What happens to energy at each trophic level?
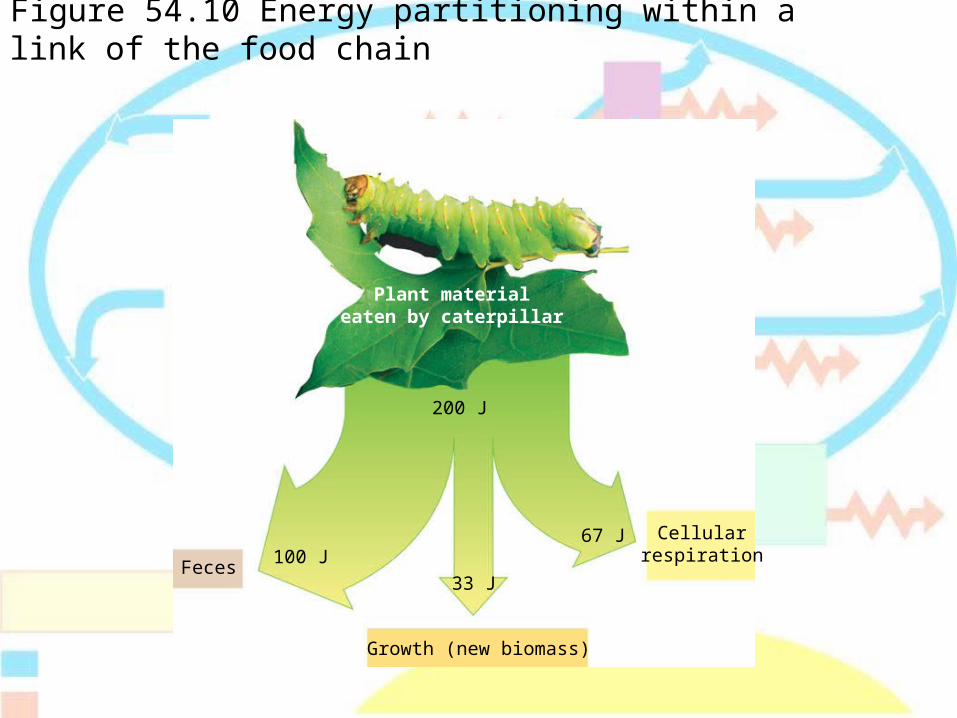
Figure 54.10 Energy partitioning within a link of the food chain
Plant materialeaten by caterpillar
Cellularrespiration
Growth (new biomass)
Feces100 J
33 J
200 J
67 J

Chapter 54: Ecosystems
1. What is an ecosystem?- All the organisms living within an area & all the abiotic factors
they interact with- Energy flows through while chemicals cycle within an ecosystem
2. What is primary productivity?- Amount of light energy converted to chemical energy by autotrophs
3. What is the difference between Gross PP & Net PP?- GPP = total primary productivity
- Amount of light energy converted to chemical energy by photosynthesis
- NPP = GPP – respiration (energy used by organisms)- Storage of chemical energy available to consumers
4. What happens to energy at each trophic level?5. What does the “Pyramid of Net Production” look like?

Figure 54.11 An idealized pyramid of net production
Tertiaryconsumers
Secondaryconsumers
Primaryconsumers
Primaryproducers
1,000,000 J of sunlight
10 J
100 J
1,000 J
10,000 J- <1% harnessed by autotrophs
Rule of 10 = only 10% of energy reaches the next trophic level
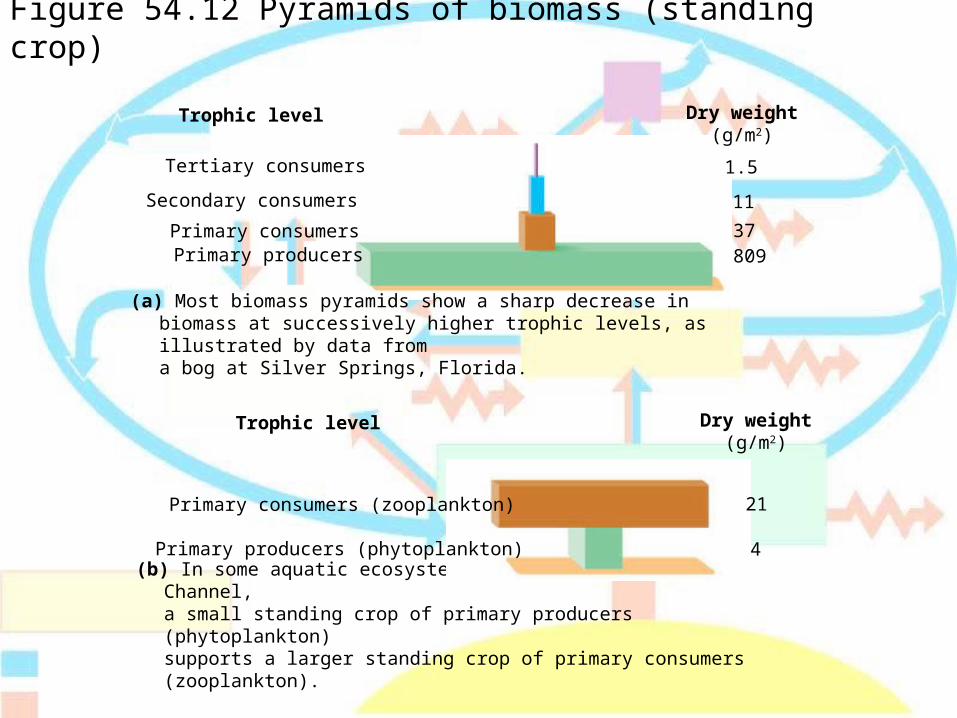
Figure 54.12 Pyramids of biomass (standing crop)
(a) Most biomass pyramids show a sharp decrease in biomass at successively higher trophic levels, as illustrated by data froma bog at Silver Springs, Florida.
Trophic level Dry weight(g/m2)
Primary producers
Tertiary consumers
Secondary consumers
Primary consumers
1.5
11
37809
(b) In some aquatic ecosystems, such as the English Channel, a small standing crop of primary producers (phytoplankton)supports a larger standing crop of primary consumers (zooplankton).
Trophic level
Primary producers (phytoplankton)
Primary consumers (zooplankton)
Dry weight(g/m2)
21
4
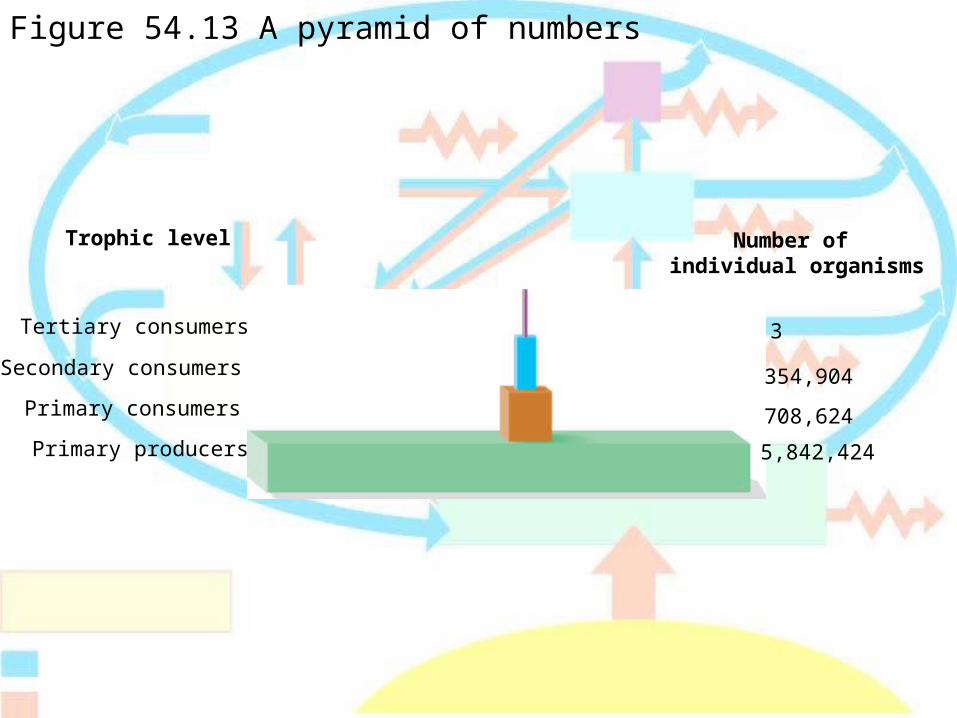
Figure 54.13 A pyramid of numbers
Trophic level Number of individual organisms
Primary producers
Tertiary consumers
Secondary consumers
Primary consumers
3
354,904
708,624
5,842,424

Fig. 54.14 Relative food energy available to the human population at different trophic levels
Trophic level
Secondaryconsumers
Primaryconsumers
Primaryproducers
- energy is more directly available to vegetarians than carnivores

Chapter 54: Ecosystems
1. What is an ecosystem?- All the organisms living within an area & all the abiotic factors
they interact with- Energy flows through while chemicals cycle within an ecosystem
2. What is primary productivity?- Amount of light energy converted to chemical energy by autotrophs
3. What is the difference between Gross PP & Net PP?- GPP = total primary productivity
- Amount of light energy converted to chemical energy by photosynthesis
- NPP = GPP – respiration (energy used by organisms)- Storage of chemical energy available to consumers
4. What happens to energy at each trophic level?5. What does the “Pyramid of Net Production” look like?6. Let’s consider chemical cycling within an ecosystem….
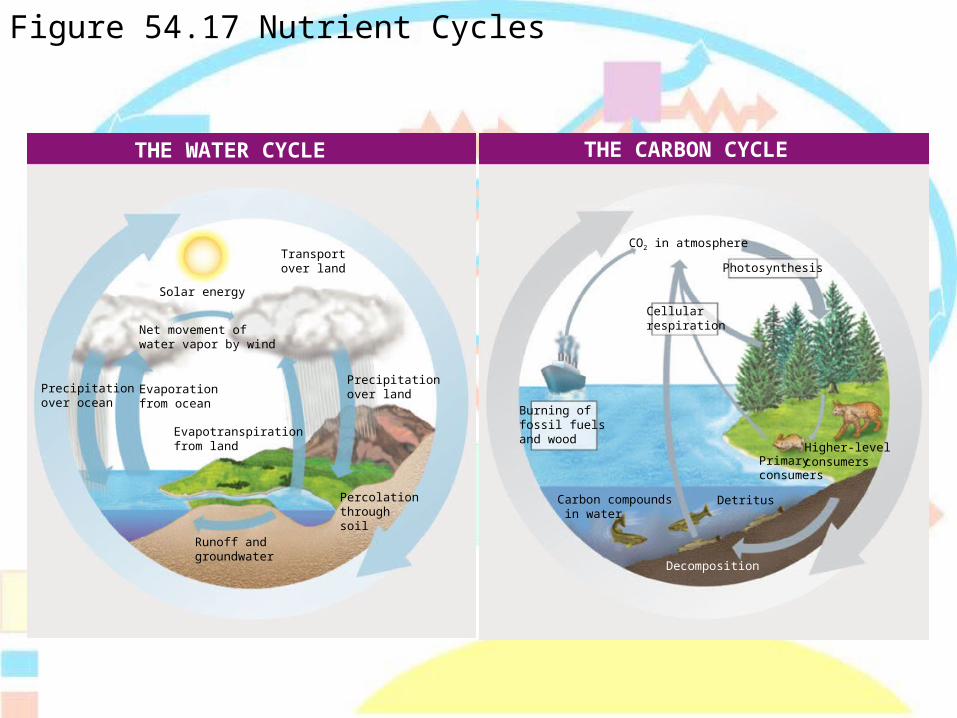
Figure 54.17 Nutrient Cycles
Transportover land
Solar energy
Net movement ofwater vapor by wind
Precipitationover ocean
Evaporationfrom ocean
Evapotranspirationfrom land
Precipitationover land
Percolationthroughsoil
Runoff andgroundwater
CO2 in atmosphere
Photosynthesis
Cellularrespiration
Burning offossil fuelsand wood
Higher-levelconsumersPrimary
consumers
DetritusCarbon compounds in water
Decomposition
THE WATER CYCLE THE CARBON CYCLE
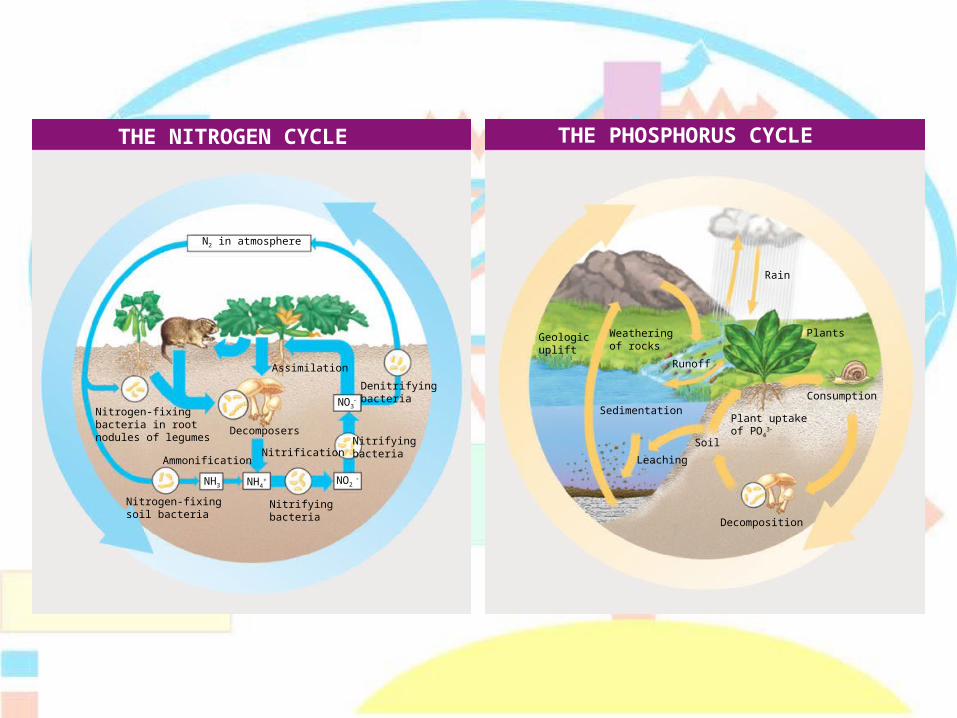
N2 in atmosphere
Denitrifyingbacteria
Nitrifyingbacteria
Nitrifyingbacteria
Nitrification
Nitrogen-fixingsoil bacteria
Nitrogen-fixingbacteria in rootnodules of legumes
Decomposers
Ammonification
Assimilation
NH3 NH4+
NO3
NO2
Rain
Plants
Consumption
Decomposition
Geologicuplift
Weatheringof rocks
Runoff
SedimentationPlant uptakeof PO4
3
Soil
Leaching
THE NITROGEN CYCLE THE PHOSPHORUS CYCLE

Chapter 54: Ecosystems
1. What is an ecosystem?2. What is primary productivity?3. What is the difference between Gross PP & Net PP?4. What happens to energy at each trophic level?5. What does the “Pyramid of Net Production” look like?6. Let’s consider chemical cycling within an ecosystem….7. What happened at the Hubbard Brook Experimental Forest?
- Nutrients stayed within an ecosystem due to plants

Figure 54.19 Nutrient cycling in the Hubbard Brook Experimental Forest: an example of long-term ecological research
(a) Concrete dams and weirs built across streams at the bottom of watersheds enabled researchers to monitor the outflow of water and nutrients from the ecosystem.
Nitr
ate
conc
entr
atio
n in
run
off
(mg/
L)
Deforested
ControlCompletion of
tree cutting
1965 1966 1967 1968
80.060.040.020.0
4.03.02.01.0
0
The concentration of nitrate in runoff from thedeforested watershed was 60 times greater than in a control (unlogged) watershed.
(c)
One watershed was clear cut to study the effects of the loss of vegetation on drainage and nutrient cycling.
(b)
Chapter 54: Ecosystems
1. What is an ecosystem?2. What is primary productivity?3. What is the difference between Gross PP & Net PP?4. What happens to energy at each trophic level?5. What does the “Pyramid of Net Production” look like?6. Let’s consider chemical cycling within an ecosystem….7. What happened at the Hubbard Brooks Experimental Forest?
- Nutrients stayed within an ecosystem due to plants8. What is biological magnification?
- Concentration of toxins increase in higher trophic levels
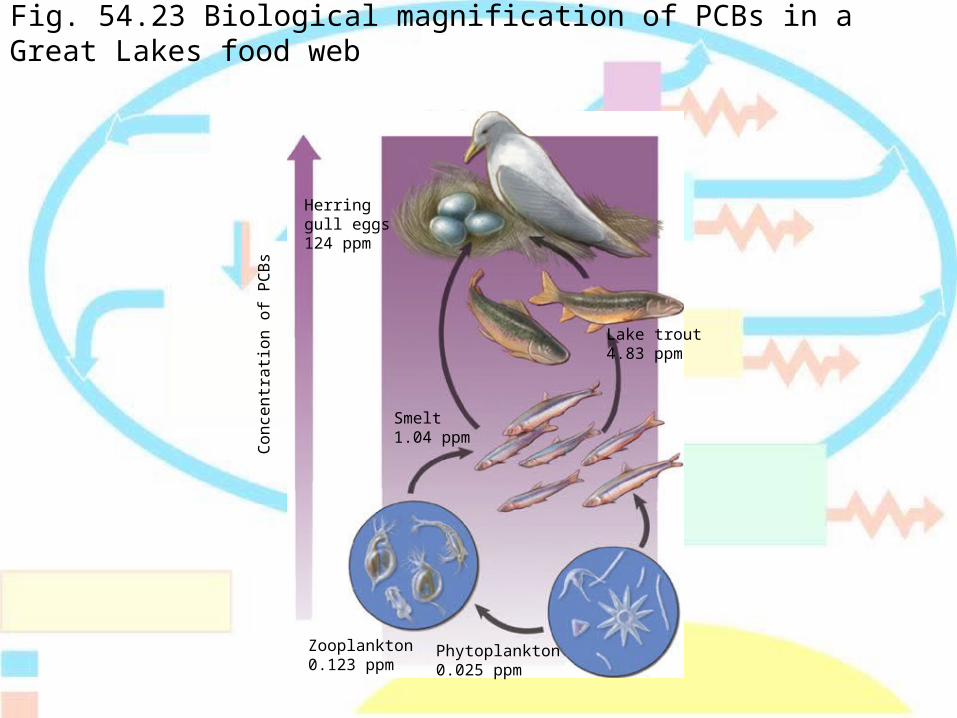
Fig. 54.23 Biological magnification of PCBs in a Great Lakes food web
Co
nce
ntr
atio
n o
f P
CB
s
Herringgull eggs124 ppm
Zooplankton 0.123 ppm
Phytoplankton 0.025 ppm
Lake trout 4.83 ppm
Smelt 1.04 ppm


