49
CHAPTER-5

CHAPTER-5

Fabrication of composites ….. 215
CHAPTER-5: SYNTHESIS AND CHARACTERIZATION OF POLYESTER POLYOLS; SYNTHESIS OF POLYURETHANE COMPOSITES AND THEIR PHYSICO-CHEMICAL CHARACTERIZATION
This chapter of the thesis describes the synthesis and characterization
of polyester polyols, synthesis of polyurethane composites and their physico-
chemical characterization. This part is further subdivided into five sections.
SECTION – 1: General Introduction SECTION – 2: Synthesis of Polyester Polyols SECTION – 3: Characterization of Polyester Polyols SECTION – 4: Synthesis of Composites SECTION – 5: Physico-Chemical Characterization of Composites
Fabrication of composites ….. 216
SECTION – 1: General Introduction
Composite is defined as “An anisotropic, heterogeneous medium,
made by combining two or more materials with different properties. Properties
of the composites are different do not merge completely into each other and
can be physically identified along with the interface between them. The
properties of the interface also contribute to the properties of the composite”.
Composite - with light weight, low density, high strength to weight ratio,
stiffness property and corrosion resistance have come a long way in replacing
the conventional materials such as steel, aluminum, timber, etc. Now a days
composite [1-4] are being used for the manufacturing of prefabricated,
portable and modular buildings as well as for exterior cladding panels, which
can simulate masonry or stone. In interior applications composites are used in
the manufacturing of the shower enclosures, trays, bath, sinks, troughs and
spas. Cast composites products are widely used for the production of vanity
units, bench tops and basins. Owing to their good combination of properties
[5-7], recently composites are widely used in automotive and aircraft
industries in the manufacturing of spaceships, sea vehicles, etc.
Composite consists of two major ingredients viz: reinforcing fibers
(dispersed phase) responsible for stress resistance and matrix materials
(continuous phase) responsible for stress propagation.
Reinforcing fibers The base of the composite is fibers. It is often called reinforcing
materials. A strength of composite is mainly depends upon the nature of
reinforcing fibers [8-9]. There is a broad classification of reinforcing fibers but
mainly they are classified according to their origin i.e. synthetic or natural
fibers. They are available in different forms such as woven, non-woven or
randomly oriented in more than one direction.
Different job calls different fibers, depending upon the mode of
application, selection of fibers are made. Especially for engineering and high
performance applications, synthetic fibers are called for the job.
Fabrication of composites ….. 217
1. M. S. Sobhy and M. T. Tammam, “The influence of fiber length and
concentration on the physical properties of wheat husk fibers rubber
composites”, Inter. J. Polym. Sci., 2010.
2. Myrtha Karina, Holia Onggo and Anung Syampurwadi, “Physical and
mechanical properties of natural fibers filled polypropylene composites
and its recycle”, J. Biological Sci., 7, 393-396, 2007.
3. Turgay Ozdemir and Fatih Mengeloglu, “Some properties of composite
panels made from wood flour and recycled polyethylene”, Int. J. Mol.
Sci., 9, 2559–2569, 2008.
4. Byoung-Ho Lee, Hee-Soo Kim, Sena Lee, Hyun-Joong Kim , John R.
Dorgan, “Bio-composites of kenaf fibers in polylactide: Role of
improved interfacial adhesion in the carding process”, Compo. Sci. and
Techno., 69, 2573–2579, 2009.
5. Z. Yaakob, A. Min Min, M. N. Satheesh Kumar, S. S. K. Kamarudin, M.
M. Hilmi and H. M. Khairul Zaman, “Oleic acid-based polyurethane
and its biocomposites with oil palm trunk fiber dust”, J. Thermoplas.
Compo. Mater., 23, 447-458, 2010.
6. E. I. Maafi, Lan Tighzert and Fouad Malek,“Elaboration and
characterization of composites of castor oil-based polyurethane and
fibers from alfa stems”, J. Appl. Polym. Sci., 118, 902-909, 2010. 7. U. Ude, A. K. Ariffin, K. Sopian, A. Arifin and C. H. Azhari, “The impact
damage response of plain woven natural silk/epoxy laminated
composite plates”, Intern. J. Engg., Sci. and Techn., 2 , 128-140,
2010.
8. Zhi-Hong Donga, Li Zhanga, Yu-Bao Lia, Gang Zhouab and Soo-Whon
Leeb, “A guided bone regeneration membrane composed of
hydroxyapatite and polyurethane”, J. Ceramic Proc. Research, 9, 478-
481, 2008.
9. F. O. Aramide, I. O. Oladele, and D. O. Folorunso, “Evaluation of the
effect of fiber volume fraction on the mechanical properties of a
polymer matrix composite” Leonardo Electro. J. Practices and
Technol., 14, 134-141, 2009

Fabrication of composites ….. 218
The fibers like glass, aramid, kevlar, carbon, spectra (PE-fibers) etc are
popular for load bearing applications. The glass fiber is most popular due to
low price and suitable for engineering applications. Where cost is no factor,
one can use strong fibers like kevlar, aramid, carbon and spectra fibers. The
other cheap option for composite application is natural fibers in its raw form,
originated directly from nature. Natural fibers have been used as
reinforcement in composite materials since the beginning of our civilization,
when grass, straw and animal hair were used to reinforce mud bricks also
known as adobe. Recent years have seen a growing interest in the
development of natural fiber reinforced composites in terms of both industrial
applications and fundamental research. The natural fibers are incorporated in
to a matrix material such as thermosetting plastics, thermoplastics or rubber.
The significant weight savings and the ease of low cost of the raw constituent
materials make these composites an attractive alternative material to glass
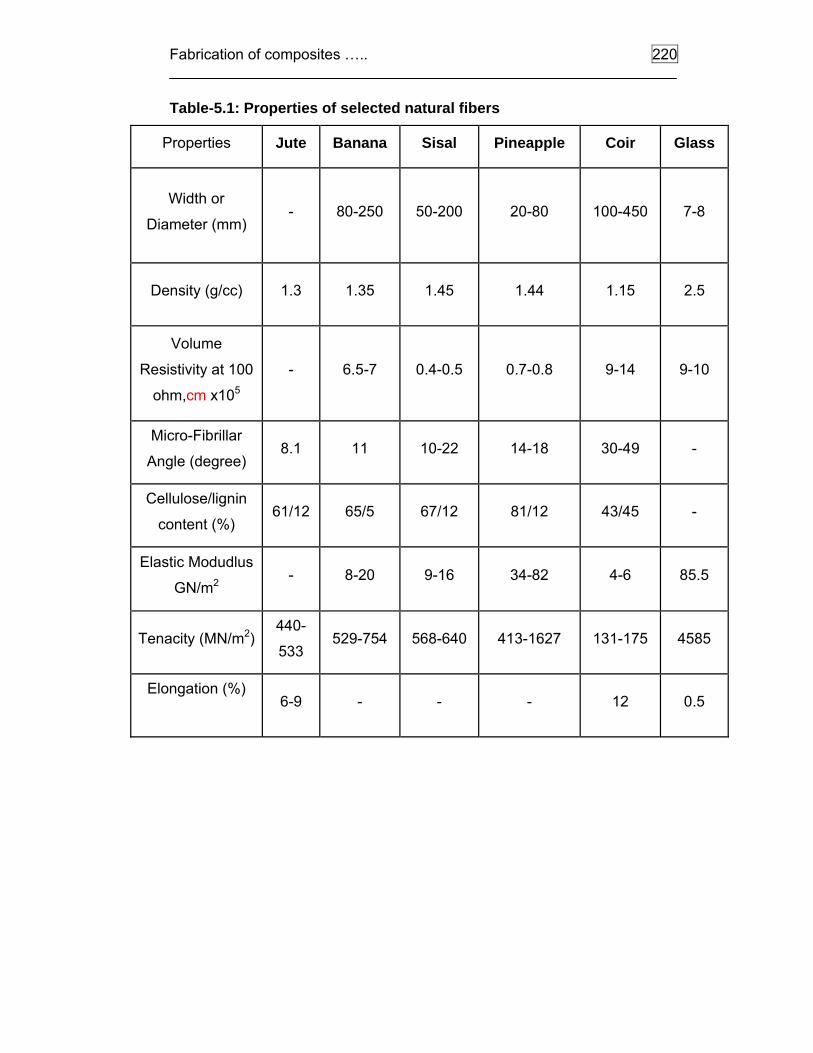
and carbon. The most commonly used natural fibers are shown in the Chart-1
and their properties are shown in Table-5.1

Fabrication of composites ….. 219
Plant fiber (Cellulose fiber)
Bast fiber Leaf fiber
Flax
Hemp
Kenaf
Jute
Mesta
Ramie
Urena
Reselle
Pineapple
Banana
Sisal
Strawpine
Abaca
Curaua
Agaves
Cabuja
Henequen
Date palm
African palm
Seed fibers
Cotton
Kapok
Coir
Fruit fibers
Coconut
Wood fibersHard wood
Soft wood
Grasses and ReedsWheat
Barley
Rice
Bamboo
Bagasse
Reed
Corn
Rape
Rye
Esparte
Elephant grass
Cannary grass
Chart-1. Classification of natural fibers
Fabrication of composites ….. 220
Table-5.1: Properties of selected natural fibers
Properties Jute Banana Sisal Pineapple Coir Glass
Width or
Diameter (mm) - 80-250 50-200 20-80 100-450 7-8
Density (g/cc) 1.3 1.35 1.45 1.44 1.15 2.5
Volume
Resistivity at 100
ohm,cm x105
- 6.5-7 0.4-0.5 0.7-0.8 9-14 9-10
Micro-Fibrillar
Angle (degree) 8.1 11 10-22 14-18 30-49 -
Cellulose/lignin
content (%) 61/12 65/5 67/12 81/12 43/45 -
Elastic Modudlus
GN/m2 - 8-20 9-16 34-82 4-6 85.5
Tenacity (MN/m2) 440-
533 529-754 568-640 413-1627 131-175 4585
Elongation (%)
6-9 - - - 12 0.5

Fabrication of composites ….. 221
The advantages of natural fibers over the synthetic fibers are:
• Low cost
• Light weight, low density
• Easy availability
• Enhanced energy recovery and biodegradability
• High strength to weight ratio
• High specific strength
• Reduced tool wear and safer handling
• Reduced dermal and respiratory irritation
• Easy surface modification
Amongst all the natural fibers jute fibers have received considerable
attention for its diversified used as a potential reinforcement in the production
of the polymer composites [10-13].
10. Suvangshu Dutta, Niranjan Karak, and Sasidhar Baruah,” Jute-fiber-
reinforced polyurethane green composites based on mesua ferrea
L.seed oil”, J. Appl.Polym.Sci., 115, 843-850, 2010.
11. R. G. Schmidt and C. E. Frazier, “Network characterization of phenol-
formaldehyde thermosetting wood adhesive”, Adhesion and Adhesives,
18, 139 -146, 1998.
12. J. Gassan and V. S. Gutowski, “Effects of corona discharge and UV
treatment on the properties of jute-fibre epoxy composites”, Compos.
Sci. and Technol. 60, 2857-2863, 2000.
13. M. S. Sreekala, M. G. Kumaran, S. Joseph and M. Jacob, “Oil palm
fiber reinforced phenol formaldehyde composites: Influence of fibre
surface modifications on the mechanical performance”, J. Appl.
Compos. Mater., 7, 295-329, 2000.

Fabrication of composites ….. 222
Jute is an attractive natural fiber for the reinforcement because of its
low cost, renewable nature and much lower energy requirement for
processing. Jute fiber contains high proportion of stiff natural cellulose. Rated
fibers of jute have three principle chemical constituents, namely α- cellulose,
hemicellulose and lignin. In addition, they contain minor constituents such as
fats and waxes, minerals, nitrogenous matter and trace of pigments like β-
carotene and xanthophylls. Several studies of fiber composition and
morphology have found that cellulose content and micro fibril angle tend to
control the mechanical properties of the cellulosic fibers. The specific
mechanical properties of the composites are comparable to those of the glass
fiber reinforced plastics (GRP). Comparison of mechanical properties of E-
glass with jute is listed in Table-5.2. Various items such as school buildings,
food grain silos, wood substitutes, low cost housing units, roofing, pipes [14],
etc. have been fabricated from the jute fiber reinforced composites.
14. M. A. Semsarzadesh, “Fiber matrix interactions in jute reinforced
polyester resin”, Polym. Compos., 7, 23-25, 1986.

Fabrication of composites ….. 223
Table-5.2: Mechanical properties of E-Glass and Jute
Properties E-glass Jute
Specific gravity 2.5 1.3
Tensile strength
(MN/m2) 3400 442
Young’s modulus
(MN/m2) 72 55.5
Specific strength
(MN/m2) 1360 340
Specific modulus
(GN/m2) 28.8 42.7

Fabrication of composites ….. 224
Hybrid composites are the materials made by combining two or more
different types of fibers in a common matrix. They offer a range of properties
that cannot be obtained with a single kind of reinforcement. By careful
selection of reinforcing fibers, the material cost can be reduced substantially
[15].
Low cost hybrid composites are produced by the use of biomass or
agro waste in combination with jute. In India rice husk (RH) and wheat husk
(WH) are the biomass materials, which are byproducts from the crops.
Considerable work has been carried out on the utilization of biomass for
particle board, medium density board, pulp and composites [16]. The
incentives of utilizing agro waste in the fabrication of composites are greater
deformability, low density, less abrasiveness to equipments, low cost, etc.
Matrices The role of matrix (resin) is to hold reinforcement together. A loose
bundle of fibers would not be of much use. In addition, though the fibers are
strong, they can be brittle but matrix can absorb energy by deforming under
stress. Thus, matrix adds toughness to the composites. Depending upon the
properties required, different matrix materials are being used viz: epoxy,
phenolic, unsaturated polyester, polyurethane, polyimide, etc. When going for
cheaper application, phenolic and epoxy systems are used in combination
with glass fibers with decent properties.
15. S. V. Joshi, L. T. Drzal, A. K. Mohanty and S. Arora, “Are natural fiber
composites environmentally superior to glass fiber reinforced
composites?”, Compos. Part-A, 35, 371-376, 2004.
16. A. Khalil, H. Ismail, M. N. Ahmed, A. Ariffrin and K. Hassan, “The
effect of various anhydride modifications on mechanical properties and
water absorption of oil palm empty fruit bunches reinforced polyester
composites” Polym. Int., 50, 396-413, 2001.

Fabrication of composites ….. 225
Unsaturated polyester resin is being used in combination with glass
woven cloth for composite fabrication, but restricts their use due to high
shrinkage when cured, more moisture absorption, lower impact strength and
low chemical resistance.
Another specialized matrix system is polyurethane, which possesses
three dimensional network structures. The unique feature of polyurethane is
that it can be tailor made to fit the application requires. Today, polyurethanes
are finding a growing interest for the applications as composites virtually in all
the sectors especially in the automotive market because of their flexibility,
excellent adhesion, high cohesive strength, excellent hardness, impact
resistance, high scratch and abrasion resistance and excellent chemical
resistance [17].
Another low cost system is vinyl ester resin derived from esterification
of diepoxide with acrylic and methacrylic acids results in vinyl ester epoxy
resin that is curable with vinyl monomers like styrene and divinyl benzene by
free radical mechanism. Such a low cost system is advantageous over
unsaturated polyester resin due to low shrinkage, low moisture absorption and
good chemical resistance.
For real high temperature applications such as space shuttles,
vehicles, etc. traveling beyond the velocity of sound, a great deal of air friction
is produced on the surface of the object that generates extreme heat. Special
kinds of matrix system, namely, polyimide, bismaleimide or polybenzoxazole
are being widely used.
Mechanical properties of FRP v/s other conventional material are
shown in Table- 5.3.
17. J. P. L. Dwanisa, A. K. Mohanty, M. Misra, M. Kazemizadeh and L. T.
Drzal, “Novel soy oil based polyurethane composites: Fabrication and
dynamic mechanical properties evolution”, J. Mater. Sci., 39, 1887-
1890, 2004.

Fabrication of composites ….. 226
Table-5.3: Mechanical properties of FRP Vs other conventional materials
Mechanical Properties
Pultruded FRP Rigid
PVC Mild Steel
Stainless Steel
Wood
Polyester Vinyl Ester
Tensile
strength
(N/mm2)
382 401 44 340 340 80
Flexural
strength
(N/mm2)
468 508 70 380 380 12
Izod impact
strength (Kg-
m/cm)
1.36 1.63 0.09 1.5 0.53 -
Specific
gravity 1.80 1.80 1.38 7.8 7.92 0.52
Safe working
Temp. (0C) 120 170 55 600 600 160

Fabrication of composites ….. 227
SECTION – 2: Synthesis of Polyester Polyols
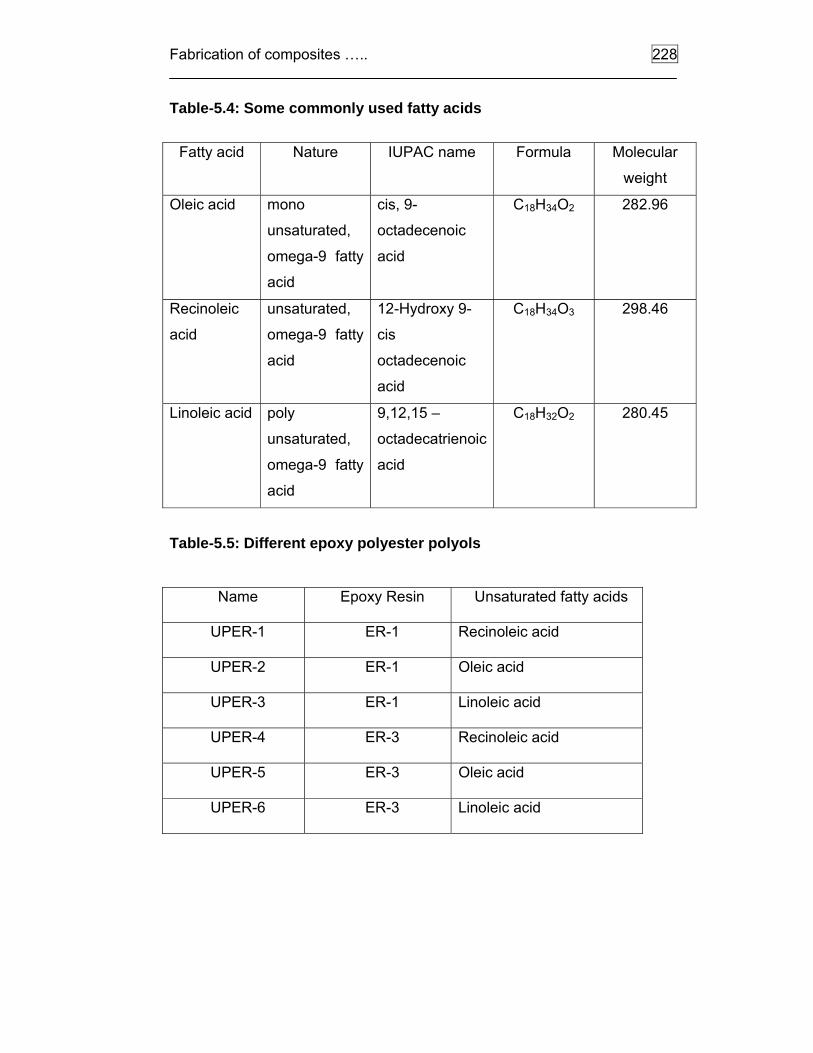
Surplus vegetable oils represent attractive renewable resources for the
production of useful chemicals. Fatty acids derived from vegetable oils and
they are value added materials for synthesizing polyols. Some commonly
used fatty acids are shown in Table-5.4.
Syntheses of epoxy polyester polyols of ER-1/ER-3 with some unsaturated fatty acids
To a 250ml three necked round bottomed flask, equipped with a
condenser, thermometer and a mechanical stirrer, were placed into a
thermostat bath and added 0.001mol ER-1/ER-3, 0.002mol fatty acids and
50ml 1,4-dioxane containing 2ml triethylamine as a catalyst. The reaction mass
was brought to reflux and stirrered 3-3.5h so that desired acid values were
achieved (<30 mg KOH/g of resin). Solid resins were isolated from cold water,
filtered, washed well with water and dried in an oven at 50°C. The yields were
83-86%. Epoxy polyester polyols are soluble in common organic solvents like
chloroform, THF, DMF, DMSO, etc.
Fabrication of composites ….. 228
Table-5.4: Some commonly used fatty acids
Fatty acid Nature IUPAC name Formula Molecular
weight
Oleic acid mono
unsaturated,
omega-9 fatty
acid
cis, 9-
octadecenoic
acid
C18H34O2 282.96
Recinoleic
acid
unsaturated,
omega-9 fatty
acid
12-Hydroxy 9-
cis
octadecenoic
acid
C18H34O3 298.46
Linoleic acid poly
unsaturated,
omega-9 fatty
acid
9,12,15 –
octadecatrienoic
acid
C18H32O2 280.45
Table-5.5: Different epoxy polyester polyols
Name Epoxy Resin Unsaturated fatty acids
UPER-1 ER-1 Recinoleic acid
UPER-2 ER-1 Oleic acid
UPER-3 ER-1 Linoleic acid
UPER-4 ER-3 Recinoleic acid
UPER-5 ER-3 Oleic acid
UPER-6 ER-3 Linoleic acid

Fabrication of composites ….. 229
SECTION – 3: Characterization of Epoxy Polyester Polyols [A] Acid value Acid value is a measure of the free fatty acids content of oil and is
expressed as the number of milligrams of potassium hydroxide required to
neutralize the free acid in 1 gram of the sample. Acid value quantifies the
reaction, which is in the beginning of the reaction, the acid value is high but as
the reaction progresses acid is consumed to form ester and at the end of the
reaction the acid value is low which signifies the completion of the ester
reaction.
Acid values of epoxy polyester polyols were determined by ASTM
method and are reported in Table-5.6.
Epoxy polyester was exactly weighed (0.5 to 1g) in a small capsule and
placed carefully into a 250 ml RBF and to it 50 ml of acetone was added. The
flask was swirled for some time and heated gently for some time to dissolve
sample completely. The solution was cooled and titrated with standard 0.1 N
methanolic KOH by using phenolphthalein as an indicator. Similar procedure
was repeated for blank titration under similar condition. The average of three
measurements was used to determine the acid value according to following
relationship [18].
56.1 x N x (A - B)Acid Value = W
Where N = Normality of KOH
A = Sample burette reading
B = Blank burette reading
W = Weight of sample in grams
Similarly acid values of the other epoxy polyesters were determined
and are summarized in Table-5.6.
18. ASTM-D-1639-Rev. 90, “Standard test method for acid value of
organic coating material”

Fabrication of composites ….. 230
Table-5.6: Experimental details, acid and hydroxyl values of epoxy polyesters
Polyols
Weight in gm
Time, h Acid value,
mg KOH/g
Hydroxyl
value,
Mg KOH/g
Epoxy
resin, g
Fatty acid,
g
UPER-1 12.2 5.86 3.5 17 1117
UPER-2 12.2 5.66 3.5 21 1098
UPER-3 12.2 5.61 3.5 16 1115
UPER-4 10.60 5.86 3 8 1187
UPER-5 10.60 5.66 3 11 1143
UPER-6 10.60 5.61 3.5 11 1196

Fabrication of composites ….. 231
[B] Hydroxyl value
Hydroxyl value is a measure of free hydroxyl groups present in the
polyester polyols (epoxy esters) and it is expressed as number of milligrams
of potassium hydroxide equivalent to the quantity of acetic acid that binds with
1 g of hydroxyl containing substances.
The hydroxyl value gives information about the number of free hydroxyl
group present in a material. The determination is carried out by acetylation
with acetic anhydride in pyridine. Aldehyde and primary and secondary amine
interfere with the determination and if present than phthalic anhydride is used
in place of acetic anhydride.
Hydroxyl values of epoxy polysters are summarized in Table-5.6. Low
acid values and high hydroxyl values confirmed formation of epoxy polyesters.
General reaction scheme as under:
+ N + NCCH3
O
Resin O C
O
CH3Resin OH CH3COOH+
+ + H2OCH3COOH KOH CH3COOK
Epoxy polyester was exactly weighed (1- 2 g) in to a small capsule and
placed carefully in to a 250 ml RBF and to it 20 ml of acetylating mixture (1
volume of acetic anhydride and 3 volume of pyridine) was added. The flask
was swirled for some time and heated gently to dissolve sample completely
and then refluxed for 30 to 50 min., cooled to room temperature and 50 ml
cold water was added slowly down to the condenser. Titrated the free acetic
acid with standard 1N NaOH using phenolphthalein (10-15 drops) as an
indicator. The procedure was repeated for blank titration under similar
condition. The average of three measurements was used to determine the
hydroxyl value of given sample according to following relationship [19].

Fabrication of composites ….. 232
56.1 x N x (A - B)Hydroxyl Value =
W
Where N = Normality of KOH
A = Blank burette reading
B = Sample burette reading
W = Weight of sample in grams
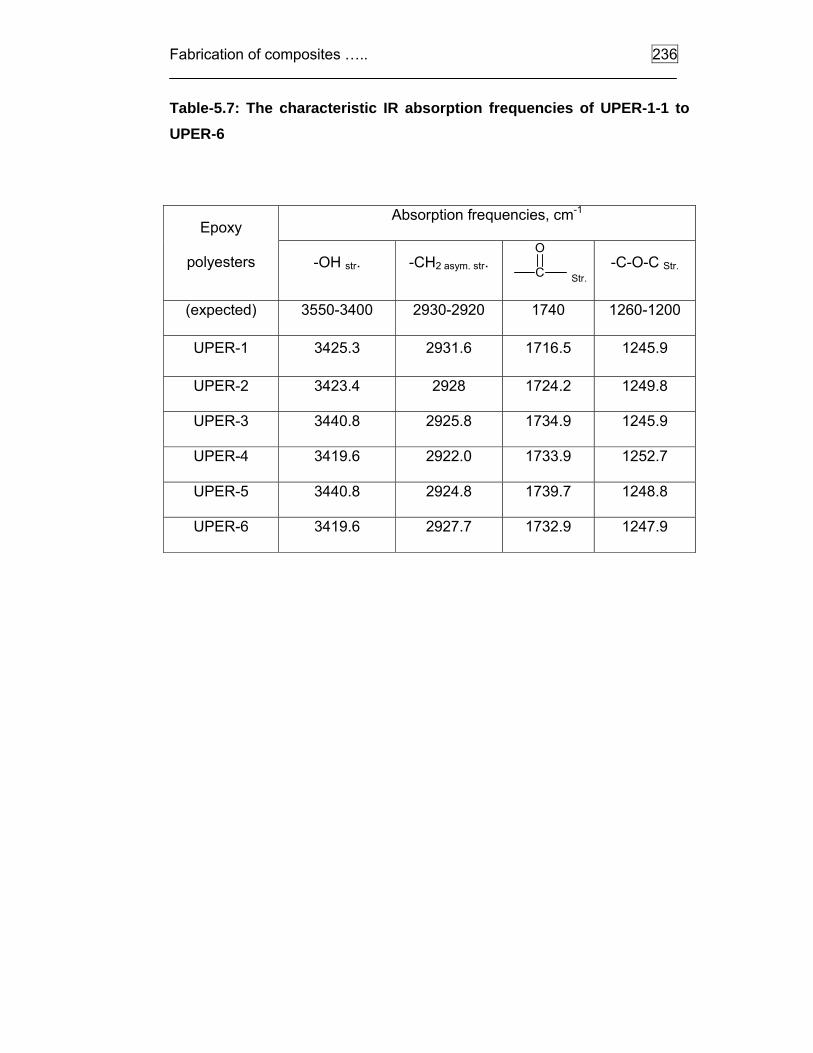
[C] IR Spectra IR (KBr pellets) of epoxy polyesters were scanned over the frequency
range from 4000-400 cm-1 and are presented in Figs.-5.1 to 5.6. Characteristic
absorption frequencies of epoxy polyesters are 3441-3420 –OHstr., 1740-1716
C
O
str., and 1253-1246 -C-O-Cstr., besides normal modes of vibrations of
alicyclic, aliphatic and aromatic groups confirming formation of epoxy
polyesters.
19. ASTM–D 1957-86 (2001), “Standard test method for hydroxyl value
of fatty oils and acids”.

Fabrication of composites ….. 233
Fig. 5.1: IR spectrum of UPER-1
Fig. 5.2: IR spectrum of UPER-2

Fabrication of composites ….. 234
Fig. 5.3: IR spectrum of UPER-3
Fig. 5.4: IR spectrum of UPER-4

Fabrication of composites ….. 235
Fig. 5.5: IR spectrum of UPER-5
Fig. 5.6: IR spectrum of UPER-6
Fabrication of composites ….. 236
Table-5.7: The characteristic IR absorption frequencies of UPER-1-1 to UPER-6
Epoxy
polyesters
Absorption frequencies, cm-1
-OH str. -CH2 asym. str. C
O
Str. -C-O-C Str.
(expected) 3550-3400 2930-2920 1740 1260-1200
UPER-1 3425.3 2931.6 1716.5 1245.9
UPER-2 3423.4 2928 1724.2 1249.8
UPER-3 3440.8 2925.8 1734.9 1245.9
UPER-4 3419.6 2922.0 1733.9 1252.7
UPER-5 3440.8 2924.8 1739.7 1248.8
UPER-6 3419.6 2927.7 1732.9 1247.9

Fabrication of composites ….. 237
SECTION – 4: Synthesis of Composites. This section of the thesis describes the fabrication of polyurethane-jute
composites. Woven jute fibers (Brown jute, Corchous Capsularis) were
purchased from local market. TDI (Toluene-2,4-diisocynate : Toluene-2,6-
diisocynate; 80:20) was supplied by Gujarat Narmada Valley Fertilizers
Limited, Bharuch and used as received.
In order to prepare jute-polyurethane composites, polyurethane matrix
material was 60% of woven jute fabric. Thus to a 250ml beaker UPER-1 /
UPER-4 (39 / 38.3 g) was dissolve in 75ml chloroform. To this solution
(11.7/11.5g) toluene diisocyanate in 25ml chloroform was added dropwise
with stirring at room temperature for 5min.
The resultant prepolyurethane solution was applied to 15cm x 15cm
jute fabric with the help of smooth brush by hand lay up technique. The
prepregs were allowed to dry in the sunlight for about 5 min. Eight such
prepregs were stacked one over the other and pressed between the two
preheated stainless steel plates under the hydraulic pressure of 30.4MPa at
room temperature / 150°C for 8h under heating and 4h at room temperature
using silicone spray as a mold releasing agent. Hereafter composites are
designated as Compo-A and Compo-B respectively.

Fabrication of composites ….. 238
SECTION–5: Physico-Chemical Characterization of Composites [A] Thermal analysis Most of the studies of polymers are generally carried out with dynamic
thermogravimetry. Normally the sample starts losing weight at a very slow
rate up to a particular temperature and there after, the rate of loss becomes
large over a narrow range of temperature. After this temperature, the loss in
weight levels off. TGA curves are characteristic for a given polymer because
of unique sequence of physico-chemical reactions, which occur over definite
temperature ranges and at the rates that are function of the polymer structure.
The change in weight is a result of the rupture and/or formation of various
physical and chemical bonds at elevated temperatures that lead to the
evolution of volatile products in the formation of heavier reaction products.
The shape of the curves depends on the kinetic parameters: reaction
order n, frequency factor A and activation energy Ea, the values of these
parameters have been shown to be of major importance to elucidate the
mechanism in polymer degradation [20]. The characteristic temperatures for
the assessment of the relative thermal stability of polymers are initial
decomposition temperature (T0), temperature of 10 % weight loss (T10),
temperature of maximum weight loss (Tmax) and temperature of final
decomposition (Tf). DTA or DSC technique provides much useful information
about physico-chemical changes occurring during heating of the polymeric
materials. Thermal analysis of polymers is useful in designing articles for
specific applications.
20. L. Reich, D. W. Levi, In: Peterlin, Goodman, Editors
Macromolecular Reviews, New York: Wiley-Interscience, 1, 173
1968.

Fabrication of composites ….. 239
Suresh et al. [21] have reported the thermal studies of novel polyols
from cardanol and developed polyurethanes. Polyols having a range of
hydroxyl values (140-265 mg of KOH/g) were prepared, and structure
characterization was carried out by spectroscopic techniques. Polyurethanes
were formulated by reaction of these polyols with diphenyl methane
diisocyanate (MDI) at an NCO/OH ratio of 1, and films were characterized for
thermal stability and viscoelastic properties by thermogravimetric analysis
(TGA) and dynamic rheometry, respectively. The dynamic mechanical studies
show a linear increase of the Tg value with an increase in the hydroxyl value
of the polyol. In TGA, when temperatures at 50% decomposition in nitrogen
atmosphere are compared.
Thermal studies of intercross-linked networks based on siliconized
polyurethane-epoxy/unsaturated polyester were reported by Prabhu and
Alagar [22]. Epoxy and unsaturated polyester (UP) resins were modified with
PU prepolymer and hydroxyl terminated polydimethylsiloxane (HTPDMS)
using γ-aminopropyl triethoxysilane (γ-APS) and vinyltriethoxysilane (VTES)
as silane cross-linkers and dibutyltindilaurate (DBTL) as a catalyst. Aromatic
polyamines adduct and aliphatic amines were used as curatives for epoxy and
methyl isobutyl ketone peroxide as curative for unsaturated polyester resin.
The coating materials were obtained in the form of tough films.
The introduction of PU into unmodified epoxy/UP coating systems
reduces the thermal stability due to the presence of thermally weak urethane
linkages whereas, the incorporation of 10 wt. % silicone into PU modified
epoxy/UP systems improved their thermal stability due to the partial ionic
nature, high bond energy and thermal stability of -Si-O-Si- linkage.
21. K. I. Suresh, V. S. Kishanprasad, “Synthesis, structure, and properties
of novel polyols from cardanol and developed polyurethanes”, Ind. and
Eng. Chem. Res., 43, 4504-4513, 2005.
22. L. A. Prabhu and M. Alagar, “Mechanical and thermal studies of
intercross-linked networks based on siliconized polyurethane-
epoxy/unsaturated polyester coatings”, Prog. In Org. Coat., 49, 236-
247, 2004.

Fabrication of composites ….. 240
DSC and TG of thermograms of composites were scanned respectively
on a Shimadzu DSC-60 and Perkin Elmer TGA Model No. Pyris-1 at
10°C/min. heating rate in an N2 atmosphere. DSC thermograms of Compo-A and Compo-B are presented in Figs.
5.12 and 5.13, respectively. Endotherm transition at 75°C (Compo-A) and
93°C (Compo-B) is due to glass transition and it is further confirmed by weight
loss in corresponding TG curve (Fig.-5.14).
From Fig. 5.14 and Table-5.8, it is evident that Compo-A followed two
steps degradation, while Compo-B followed three steps degradation. Compo-
A and Compo-B are thermally stable upto 210 and 245°C respectively. Energy
of activation is from 82 to 160 KJ.mol-1. Compo-A and Compo-B having 3.1
and 21.1 % residue at 550°C which proves that Compo-B has more complex
structure. Degradation reaction is a complex reaction and involves a variety of
reaction such as branching, rearrangement, crosslinking, etc. Urethane, ether
and azomethine linkages are weak points in the epoxy polyester urethanes.
Selective cleavage takes place, such weak linkages with evolution of carbon
dioxide and ammonia with the formation of free radicals. These radicals
further undergo recombination and degrade at elevated temperatures.
Kinetic parameters such as energy of activation (Ea), frequency factor
(A), order of reaction (n) and entropy change (∆S*) are determined according
to Anderson-Freeman method.
∆ ln dW/dt = n ∆ lnW – (Ea/R) ∆ (1/T) .....5.1
A = Eaβ / RT 2 eEa
/RT .....5.2
∆S* = R ln (Ah/kT) .....5.3
Where β is the heating rate, R is the gas constant, h is the Planck’s
constant, T is the temperature and k is the Boltzmann constant. The detail
calculations according to Eqn 5.3
Detail calculation for Compo-A and Compo-B according to Anderson-
Freeman method are mentioned in Table- 5.10 to 5.14. The plots of ∆ lnW
against ∆ ln dW/dt are shown in Fig. 5.7 to 5.11.

Fabrication of composites ….. 241
Table-5.8: TG data of Compo-A and Compo-B
Parameters Composite name Compo-A Compo-B
IDT,oC 210 355
245 345 480
Decomposition range, 0C
210-320 355-490
245-310 345-480 480-600
Tmax, 0C 280 435
275 435 545
% Wt.loss 23.4 32.3
14.9 19.8 25.2
% Residue at 5500C 3.1 21.1
Ea, kJ mol-1 131.4 158.8
107.3 82.3 159.6
n 1.5 2.2
0.92 1.0 1.3
A,s-1 8.86 x 10⁻⁶ 6.52 x 10⁻⁶
7.33 x 10⁻⁶
3.34 x 10⁻⁶ 4.89 x 10⁻⁶
∆S* JK-1 mol-1 -347 -351
-348 -358 -355
R2 0.964 0.959
0.971 0.980 0.970
Table-5.9: DSC data of Compo-A and Compo-B
Name Type Peak temp,
° C
Heat of
Transition,
∆H, J/g-1
∆H, kJmol-1
Compo-A Endothermic 75 -0.45 -0.14 x 10⁻³
Compo-B Endothermic 93 -6.61 -2.06 x 10⁻³

Fabrication of composites ….. 242
Table-5.10: Detail calculations for Compo-A according to Anderson-Freeman method
1/T, 103
% wt Loss dW/dt Active
Wt. lnW ln(dW/dt) ∆lnW ∆lndW/dt
Step -01 1.69 37.71 1.123 0.239 -1.430 0.116 -0.822 -0.235 1.70 37.41 1.421 0.544 -0.609 0.351 -0.623 -0.195 1.71 36.94 1.728 1.015 0.015 0.547 -0.473 -0.163 1.72 36.32 2.033 1.629 0.488 0.710 -0.373 -0.135 1.73 35.59 2.328 2.365 0.861 0.845 -0.303 -0.112 1.74 34.75 2.604 3.202 1.164 0.957 -0.253 -0.092 1.75 33.83 2.854 4.122 1.416 1.049 -0.214 -0.074 1.76 32.84 3.073 5.106 1.630 1.123 -0.184 -0.058 1.77 31.81 3.255 6.137 1.814 1.180 -0.160 -0.043 1.78 30.75 3.398 7.200 1.974 1.223 -0.140 -0.029 1.79 29.67 3.497 8.280 2.114 1.252 -0.123 -0.016 1.80 28.59 3.552 9.364 2.237 1.267 -0.109 -0.003 1.81 27.51 3.561 10.439 2.346 1.270 -0.096 0.010 1.82 26.46 3.526 11.494 2.442 1.260 -0.085 0.023 1.83 25.43 3.447 12.519 2.527 1.238 -0.076 0.035 1.84 24.45 3.328 13.504 2.603 1.202 -0.067 0.048 1.85 23.51 3.171 14.443 2.670 1.154 -0.060 0.061 1.86 22.62 2.983 15.329 2.730 1.093 -0.053 0.075 1.87 21.79 2.768 16.155 2.782 1.018 -0.046 0.089 1.88 21.03 2.533 16.918 2.828 0.929 -0.040 0.102 1.89 20.34 2.286 17.615 2.869 0.827 -0.035 0.115 1.90 19.71 2.037 18.243 2.904 0.712 -0.030 0.126 1.91 19.15 1.795 18.801 2.934 0.585 -0.026 0.133 1.92 18.66 1.571 19.290 2.960 0.452 -0.022 0.131 1.93 18.24 1.378 19.711 2.981 0.321 -0.018 0.115 1.94 17.88 1.229 20.066 2.999 0.206 -0.015 0.077 1.95 17.59 1.138 20.359 3.014 0.129 -0.012 0.016 1.96 17.36 1.120 20.595 3.025 0.113 -0.009 -0.062 1.97 17.17 1.192 20.779 3.034 0.175 3.034 0.175

Fabrication of composites ….. 243
Table-5.11: Detail calculations for Compo-A according to Anderson-Freeman method
1/T,
103
% wt
Loss dW/dt
Active
Wt. lnW ln(dW/dt) ∆lnW ∆lndW/dt
Step -02
1.32 72.35 2.736 1.291 0.255 1.007 -0.793 0.000
1.33 70.79 2.737 2.854 1.049 1.007 -0.457 -0.016
1.34 69.13 2.780 4.507 1.506 1.023 -0.323 -0.026
1.35 67.42 2.853 6.224 1.828 1.048 -0.249 -0.030
1.36 65.66 2.940 7.980 2.077 1.078 -0.201 -0.030
1.37 63.89 3.029 9.753 2.278 1.108 -0.167 -0.026
1.38 62.12 3.110 11.523 2.444 1.134 -0.141 -0.020
1.39 60.37 3.173 13.271 2.586 1.155 -0.121 -0.012
1.4 58.66 3.213 14.981 2.707 1.167 -0.105 -0.003
1.41 57.00 3.222 16.637 2.812 1.170 -0.091 0.008
1.42 55.41 3.197 18.228 2.903 1.162 -0.080 0.019
1.43 53.90 3.135 19.742 2.983 1.143 -0.070 0.032
1.44 52.47 3.037 21.170 3.053 1.111 -0.061 0.045
1.45 51.13 2.902 22.506 3.114 1.065 -0.054 0.060
1.46 49.90 2.733 23.743 3.167 1.005 -0.047 0.075
1.47 48.76 2.534 24.880 3.214 0.930 -0.041 0.092
1.48 47.73 2.312 25.914 3.255 0.838 -0.035 0.109
1.49 46.79 2.073 26.846 3.290 0.729 -0.031 0.126
1.5 45.96 1.828 27.678 3.321 0.603 -0.026 0.142
1.51 45.22 1.585 28.416 3.347 0.461 -0.023 0.154
1.52 44.58 1.358 29.065 3.370 0.306 -0.019 0.156
1.53 44.01 1.162 29.633 3.389 0.150 -0.017 0.140
1.54 43.51 1.010 30.131 3.406 0.010 -0.014 0.092
1.55 43.07 0.922 30.570 3.420 -0.081 -0.013 0.008
1.56 42.67 0.915 30.965 3.433 -0.089 -0.012 -0.099
1.57 42.31 1.010 31.331 3.445 0.010 -0.011 -0.197
1.58 41.95 1.230 31.687 3.456 0.207 3.456 0.207

Fabrication of composites ….. 244
Fig.5.7: The Freeman-Anderson plots of Compo-A (step-1 )
Fig.5.8: The Freeman-Anderson plots of Compo-A (step-2 )

Fabrication of composites ….. 245
Table-5.12: Detail calculations for Compo-B according to Anderson-Freeman method
1/T, 103
% wt Loss dW/dt Active
Wt. lnW ln(dW/dt) ∆lnW ∆lndW/dt
Step -01 1.74 40.37 1.789 1.49 0.400 0.582 -0.206 -0.104
1.75 40.03 1.986 1.83 0.606 0.686 -0.265 -0.107
1.76 39.47 2.209 2.39 0.871 0.793 -0.264 -0.097
1.77 38.75 2.435 3.11 1.134 0.890 -0.239 -0.082
1.78 37.91 2.645 3.95 1.373 0.973 -0.209 -0.065
1.79 36.99 2.821 4.87 1.583 1.037 -0.180 -0.045
1.80 36.03 2.952 5.83 1.763 1.083 -0.155 -0.026
1.81 35.06 3.030 6.80 1.918 1.108 -0.132 -0.006
1.82 34.09 3.048 7.77 2.050 1.115 -0.113 0.014
1.83 33.17 3.007 8.69 2.163 1.101 -0.096 0.033
1.84 32.29 2.909 9.57 2.259 1.068 -0.082 0.052
1.85 31.47 2.761 10.39 2.341 1.016 -0.069 0.071
1.86 30.73 2.572 11.13 2.410 0.945 -0.059 0.088
1.87 30.05 2.356 11.81 2.469 0.857 -0.050 0.100
1.88 29.44 2.132 12.42 2.519 0.757 -0.043 0.105
1.89 28.89 1.920 12.97 2.563 0.652 -0.038 0.095
1.90 28.39 1.746 13.47 2.601 0.557 -0.035 0.064
1.91 27.91 1.638 13.95 2.635 0.494 -0.033 0.005
1.92 27.44 1.630 14.42 2.668 0.488 -0.033 -0.075
1.93 26.95 1.757 14.91 2.702 0.563 2.702 0.563

Fabrication of composites ….. 246
Table-5.13: Detail calculations for Compo-B according to Anderson-Freeman method
1/T, 103
% wt Loss dW/dt Active
Wt. lnW ln(dW/dt) ∆lnW ∆lndW/dt
Step -02 1.34 63.92 1.561 0.956 -0.044 0.445 -0.735 -0.041
1.35 62.89 1.626 1.995 0.690 0.486 -0.413 -0.035
1.36 61.87 1.684 3.014 1.103 0.521 -0.286 -0.029
1.37 60.87 1.734 4.014 1.390 0.550 -0.218 -0.023
1.38 59.89 1.774 4.993 1.608 0.573 -0.175 -0.017
1.39 58.93 1.804 5.950 1.783 0.590 -0.146 -0.011
1.40 58.00 1.824 6.884 1.929 0.601 -0.124 -0.005
1.41 57.09 1.832 7.794 2.053 0.606 -0.108 0.001
1.42 56.20 1.830 8.680 2.161 0.604 -0.094 0.007
1.43 55.34 1.817 9.539 2.255 0.597 -0.084 0.013
1.44 54.51 1.792 10.372 2.339 0.584 -0.075 0.020
1.45 53.70 1.758 11.177 2.414 0.564 -0.067 0.026
1.46 52.93 1.713 11.953 2.481 0.538 -0.061 0.032
1.47 52.18 1.659 12.700 2.542 0.506 -0.055 0.038
1.48 51.46 1.597 13.416 2.596 0.468 -0.050 0.044
1.49 50.78 1.527 14.101 2.646 0.424 -0.045 0.050
1.50 50.13 1.452 14.754 2.691 0.373 -0.041 0.056
1.51 49.51 1.373 15.373 2.733 0.317 -0.037 0.062
1.52 48.92 1.290 15.959 2.770 0.255 -0.034 0.067
1.53 48.37 1.207 16.510 2.804 0.188 -0.031 0.071
1.54 47.85 1.125 17.025 2.835 0.118 -0.028 0.073
1.55 47.38 1.046 17.505 2.862 0.045 -0.025 0.073
1.56 46.93 0.973 17.947 2.887 -0.028 -0.022 0.069
1.57 46.53 0.908 18.351 2.910 -0.097 -0.020 0.061
1.58 46.16 0.854 18.717 2.929 -0.158 -0.017 0.048
1.59 45.84 0.814 19.044 2.947 -0.206 -0.015 0.029

Fabrication of composites ….. 247
Table-5.14: Detail calculations for Compo-B according to Anderson-Freeman method
1/T, 103
% wt Loss dW/dt Active
Wt. lnW ln(dW/dt) ∆lnW ∆lndW/dt
Step -03 1.15 89.65 1.820 0.429 -0.847 0.599 -1.439 -0.050
1.16 88.27 1.914 1.809 0.593 0.649 -0.620 -0.077
1.17 86.72 2.066 3.364 1.213 0.726 -0.405 -0.082
1.18 85.03 2.243 5.046 1.619 0.808 -0.300 -0.074
1.19 83.27 2.416 6.811 1.918 0.882 -0.235 -0.058
1.20 81.46 2.560 8.617 2.154 0.940 -0.191 -0.038
1.21 79.65 2.659 10.430 2.345 0.978 -0.158 -0.015
1.22 77.86 2.700 12.216 2.503 0.993 -0.133 0.008
1.23 76.13 2.677 13.949 2.635 0.985 -0.112 0.033
1.24 74.48 2.590 15.604 2.748 0.952 -0.095 0.059
1.25 72.92 2.442 17.162 2.843 0.893 -0.081 0.084
1.26 71.47 2.245 18.606 2.924 0.809 -0.069 0.108
1.27 70.15 2.015 19.927 2.992 0.701 -0.058 0.128
1.28 68.96 1.773 21.115 3.050 0.573 -0.049 0.136
1.29 67.91 1.547 22.169 3.099 0.436 -0.041 0.122
1.30 66.99 1.370 23.088 3.139 0.315 -0.034 0.068
1.31 66.20 1.280 23.878 3.173 0.247 -0.028 -0.032
1.32 65.53 1.321 24.547 3.201 0.278 3.201 0.278

Fabrication of composites ….. 248
Fig.5.9: The Freeman-Anderson plots of Compo-B (step-1 )
Fig.5.10: The Freeman-Anderson plots of Compo-B ( step-2 )

Fabrication of composites ….. 249
Fig.5.11: The Freeman-Anderson plots of Compo-B ( step-3 )
100.00 200.00 300.00Temp [C]
-2.00
-1.00
0.00
1.00
mWDSC
45.60 COnset
102.30 CEndset
74.98 CPeak
-0.00 kJ
-3.27 x10⁻⁵
kcal
heat
-0.50 mWPeak Height
Fig. 5.12: DSC thermogram of Compo-A at the heating rate of 10°C/min in an N2 atmosphere

Fabrication of composites ….. 250
100.00 200.00 300.00Temp [C]
-1.00
0.00
1.00mWDSC
58.17 COnset
81.94 CEndset
92.88 CPeak
-2.06 x10⁻⁵
kJ
-4.92 x10⁻⁶
kcal
heat
-0.08 mWPeak Height
Fig. 5.13: DSC thermogram of Compo-B at the heating rate of 10°C/min in an N2 atmosphere
Fig.-5.14: TG thermograms of Compo-A and Compo-B at the heating rate of 10°C/min in an N2 atmosphere

Fabrication of composites ….. 251
Mechanical properties
The foremost requirement for a designer of a composite product is the
data on the mechanical properties, which enable him to select the best suited
for the desired application. Recently, composites are being widely used as
load bearing and engineering applications by allowing various fibers of high
strength as a base for composite fabrication. By selection of appropriate
matrix-reinforcing systems, desired properties can be achieved.
During the service, composite has to suffer the cyclic stress, tensile,
flexural, impact forces, bending, friction, wear and different type of stresses on
it. Depending upon the mode of application, composite must be mechanically
strong to suit the job. The geometrical response to loading leads to a wide
range of mechanical properties grouped under stress-strain properties, visco-
elasticity and failure properties.
Various mechanical properties of composites depend upon type of
reinforcing fiber, type of curing mechanism and density of curing, fiber-matrix
adhesion, time and temperature of cure, molecular weight of polymer, fiber
strength, modulus, fiber length and orientation, compatibilizers and impact
modifiers, fiber content, presence of soft and hard segments, fiber loading etc.
Depending on the property to be measured, a large number of
standard test methods have been developed. However, they vary from each
other in terms of loading conditions, shape and size of the test specimens etc.
Gassan et al. [23] have fabricated the flex fiber reinforced polyurethane
composites and determined their mechanical properties. Flax fibers coated
with two types and various amounts of silicones. Coating conditions have
been found to affect strongly the composites properties. The effect of these
two types and different amounts of silicone on the impact toughness, flexural
strength and modulus, dynamic modulus and loss-energy and notch
sensitivity is determined.
Carvalho et al. [24] have evaluated the tensile and impact behavior of
jute fabrics-polyester composites as a function of the fabric style (knitted or
weaved cloths), fiber weight fraction, and direction of the applied load. The
tensile properties of plain-weave-fabric-reinforced composites (PWF) were
higher than those of plain weft knit cloth composites (WKT) and were
Fabrication of composites ….. 252
dependent on fiber content and test direction. The properties of the WKT,
however, were independent of these variables. The results obtained indicate
that the orthogonal fiber alignment of weaved cloths favors anisotropy, while
the interconnected loops in knit fabrics favors isotropy. The results also
indicated weak fiber-matrix interactions in both fabrics and a better fabric
impregnation for the plain weave fabric if compared with that of the knit fabric.
The impact strengths of both composites were higher than that of the matrix
and were shown to increase with fiber content. WKT-reinforced composites
showed better impact absorption capacity than PWF composites.
Sastra et al. [25] have determined the tensile properties of arenga
pinnata fiber as a natural fiber and epoxy resin as a matrix. For this the
arenga pinnata fibers were mixed with epoxy resin at the various fiber weight
percentages of 10%, 15%, and 20% arenga pinnata fiber and with different
fiber orientations such as long random, chopped random and woven roving.
Results from the tensile tests of arenga pinnata fiber reinforced epoxy
composite were that the 10 wt% woven roving arenga pinnata fiber showed
the highest value for maximum tensile properties.
23. J. Gassan, T. Dietz and A. K. Bledzki, “Effect of silicone interphase on
the mechanical properties of flax-polyurethane composites” Compos
Interfaces, 7, 103 -115, 2000.
24. L. H. de Carvalho, J. M. F. Cavalcante, J. R. M. d’Almeida,
“Comparison of the mechanical behavior of plain weave and plain weft
knit jute fabric-polyester-reinforced composites”, Polym. Plast. Technol.
Eng. 45, 791-797, 2006.
25. H. Y. Sastra, J. P. Siregar, S. M. Sapuan and M. M. Hamdan, “Tensile
properties of arenga pinnata fiber-reinforced epoxy composites”,
Polym. Plast. Technol. Eng., 45, 149-155, 2006.
Fabrication of composites ….. 253
The tensile strength and Young's modulus values for 10 wt.% of woven
roving arenga pinnata fiber composite are 51.725 MPa and 1255.825 MPa,
respectively. The results above indicated that the woven roving arenga
pinnata fiber has a better bonding between its fiber and matrix compared to
long random arenga pinnata fiber and chopped random arenga pinnata fiber.
Scanning electron microscopy (SEM) tests were also carried out after tensile
tests to observe the interface of fiber and matrix adhesion.
Wang et al. [26] have fabricated waterborne polyurethane (WPU)
composites and have studied the effect of crosslinking agent on the different
properties. Waterborne PU (WPU) and casein (1: 1 by weight) were blended
at 90°C for 30 min, and then were crosslinked by adding 1-10 wt % ethane
diol to prepare a series of sheets. The results indicated that crosslinked blend
sheets exhibited a certain degree of miscibility, and exhibited much higher
tensile strength and water resistivity than did the WPU, casein, and the
uncross linked blend from WPU and casein. When the ethane diol content
was 2 wt %, the tensile strength and elongation at break of crosslinked sheets
achieved 19.5 MPa and 148% in the dry state, and 5.0 MPa and 175% in the
wet state, respectively. A 2 wt % content of ethane diol played an important
role in the enhancement of mechanical properties, thermal stability, and water
resistivity of the blends of WPU and casein.
Cao et al. [27] have fabricated waterborne polyurethane (WPU)/starch
(ST) with different contents (10-90 wt %) composites and studied the effect of
different starch content on the various properties of the composites. The
results indicated that tensile strength of composite materials not only
depended on the starch content, but also related to the microstructure of
WPU.
26. N. Wang, Y. Lu, Y. Du and L. Zhang, “Properties of crosslinked
casein/waterborne polyurethane composites”, J. Appl Polym Sci., 91,
332-338, 2004.
27. X. Cao, J. Huang, G. Yang, Y. Wang and L. Zhang, “Structure-
properties relationship of starch/waterborne polyurethane composites”,
J. Appl Polym Sci., 90, 3325-3332, 2003.

Fabrication of composites ….. 254
The sample WPU2 (1.75 of NCO/OH molar ratio) exhibited hard-
segment order, but WPU1 (1.25 of NCO/OH molar ratio) had no hard-
segment order. The blend material from 80 wt % WPU1 and 20 wt % starch
exhibited better tensile strength (27 MPa), elongation at break (949%), and
toughness than others.
Fujii et al. [28] have fabricated bamboo reinforced polypropylene
composites for ecological purposes (Eco-composites) and have studied their
basic mechanical properties. The steam explosion technique was applied to
extract bamboo fibers from raw bamboo trees. The experimental results
showed that the bamboo fibers (bundles) had a sufficient specific strength,
which is equivalent to that of conventional glass fibers. The tensile strength
and modulus of PP based composites using steam-exploded fibers increased
about 15 and 30%, respectively, due to well impregnation and the reduction of
the number of voids, compared to the composite using fibers that were
mechanically extracted. The steam explosion technique was an effective
method to extract bamboo fibers for reinforcing thermoplastics.
The tensile strength (IS: 11298-Pt-2-87) and flexural strength (ASTM
D-790-2003) measurements were made on a Shimadzu Autograph AG-X
Series at a speed of 0.05mm/minute.
Compo-A (3.8mm thick) and Compo-B (4.1mm thick) possess 32.9 and
38.7 MPa tensile strengths; 20 and 50.9 MPa flexural strengths respectively.
From these data it is observed that Compo-B posses better tensile strength
and flexural strength. Fairly good tensile and flexural strengths of composites
signify their importance for low load bearing applications.
28. T. Fujii, Y. Yamamoto and K. Okubo, “Development of bamboo-based
polymer composites and their mechanical properties”, Compos. Part-A:
Appl. Sci. and Mfg., 35, 377-383, 2004.

Fabrication of composites ….. 255
Electrical Properties
Electric strength (IEC-60243-Pt-1-1998) and volume resistivity (ASTM
D-257-2007) measurements were made on a high voltage tester (Automatic
Electric-Mumbai) in air at 27°C by using 25/75mm brass electrodes and a
Hewlett Packard high resistance meter at 500 V DC after charging for 60 sec,
respectively.
Compo-A (3.8mm thick) and Compo-B (4.1mm thick) showed
respectively 1.3 and 1.9 kV/mm electric strength; and 7.6 x 10⁹ and 2.2 x 10¹¹
ohm.cm volume resistivity. Compo-B showed better electric and volume
resistivity. From volume resistivity data it is observed that Compo-B is much
more polar than Compo-A.
Fairly good electric properties are due to presence of polar groups in
epoxy polyester polyurethanes.

Fabrication of composites ….. 256
SECTION-3: Chemical Resistance Study of Composites
The unique combinations of properties found in polymers have made it
possible to use them in almost all areas of applications. Tailoring of polymer
molecules to specifically achieve the required performance properties has
further widened the scope of their applications. The performance and life span
of polymeric materials depend on various factors, their molecular
characteristics being the controlling one; exposure of polymers to different
environmental conditions impairs their useful properties.
The highest consumption area of the plastic material is in packaging.
This is mainly due to the superiority of plastic material over the other materials
in terms of inertness and stability to contacting chemicals like water, oxidizing
agents, oils, lubricants, industrial solvents and food stuffs. The selection of
particular plastic materials for specific industrial applications has to be based
on the chemical environment to which they will be exposed.
The interaction of chemicals with plastics can take place in different
ways, affecting adversely their useful properties at varying rates and at
varying degrees. The mechanisms involved can be chemical reaction,
solvation, absorption, plasticization and stress cracking. The strength of
chemical bonds, the degree of crystallinity, branching and polarity are the
deciding factors for the chemical resistance of polymers. Rise in temperature
increases the rate of chemical interaction.
Somani et al. [29] have studied the equilibrium swelling of
polyurethanes (PU) in various solvents in order to calculate their solubility
parameters. The kinetics of swelling and sorption were also been studied in
1,4-dioxane at 30°C. The PU was synthesized by reacting a novel polyol
(castor oil derivative and epoxy based resin) and one of the polyethylene
glycols (PEG-200, PEG-400, PEG-600) with different weight compositions,
with a toluene diisocyanate (TDI) adduct (derived from toluene diisocyanate
and R60 polyol). Different NCO/OH ratio viz. 1, 1.3 and 1.7 were employed in
the study. The results were found to vary with the weight composition of polyol
components, as well as the crosslink density of the samples. The sorption
behavior was also found to vary with the molecular weight of polyethylene
glycol employed in the preparations of the polyurethanes. Kinetic studies of

Fabrication of composites ….. 257
swelling revealed that the sorption was anomalous in nature. The diffusion
coefficient (D) increased with an increase in the NCO/OH ratio and decreased
with an increase in chain length of polyethylene glycol. The sorption
coefficient (S) decreased with an increase in crosslink density (NCO/OH) and
increased with increasing polyethylene glycol (i.e., PEG-200, PEG-400, and
PEG-600) moieties in the polyurethanes.
Ajithkumar et al. [30] have performed equilibrium swelling experiments
of interpenetrating polymer networks (IPNs) based on castor oil-based
polyurethanes (PU) and unsaturated polyester (UPE) in various solvents, in
order to calculate their solubility parameter. The kinetics of swelling and
sorption were also studied in chlorobenzene at 25°C. IPNs with various
weight compositions of PU and UPE (80:20, 50:50 and 20:80) (NCO/OH ratio)
viz. 1.2, 1.5 and 2.0 were used in the study. The results were found to vary
with the weight compositions of the components of the samples. The sorption
behavior also varies with the hydroxyl number (mol. wt.) of the polyol used in
the preparation of PU. The sorption was anomalous in nature in all the cases.
The diffusion coefficient (D) increased with both an increase in NCO/OH ratio
and UPE content, whereas the sorption coefficient (S) showed a reverse trend
in all the samples studied. A number of standard chemical resistance tests
have been developed which include tests for moisture and water absorption,
effects of immersion in chemicals, stain resistance and stress cracking.
29. K. P. Somani, N. K. Patel, S. S. Kansara and A. K. Rakshit, “Effect of
chain length of polyethylene glycol and crosslink density (NCO/OH) on
properties of castor oil based polyurethane elastomers”, J. Macromol.
Sci. Pure and Appl. Chem., 43, 797-811, 2006.
30. S. Ajithkumar, N. K. Patel and S. S. Kansara, “Sorption and diffusion of
organic solvents through interpenetrating polymer networks (IPNs)
based on polyurethane and unsaturated polyester”, Euro. Polym. J.,
36, 2387–2393, 2000.

Fabrication of composites ….. 258
( )( )2 2
22 20
2 18 11 exp2 1
x
J
j D tG
hjπ
π
∞
=
⎡ ⎤+= − −⎢ ⎥
+ ⎢ ⎥⎣ ⎦∑
4 mx
M tM Dh π
=
Most of these tests involve measurement of change in weight,
dimensions and appearance and mechanical properties before and after the
exposure to chemical reagents. Exposure time, temperature, concentration
and reactivity of the reagents are the important factors for the tests.
The most common methods used to determine chemical resistance are
described below.
(1) Chemical resistance by change in mass method (2) Chemical resistance by change in linear dimensions (3) Chemical resistance by change in mechanical properties Various models have been proposed for water absorption in
composites. It is well established that absorbed water in polymers and
composites plays a significant role in mechanical behavior and long term
durability. Assuming one-dimensional Fickian diffusion in composite, an
attempt has been made to determine diffusivity (Dx) in different environments.
Diffusivity is assumed to depend only on temperature and independent of the
moisture content as well as stress levels in composites. For one- dimensional
water absorption in semi-infinite plate exposed on both sides to same
environment, the amount of water absorbed is given by Eqn.5.4:
… 5.4
Where Dx = diffusivity, t = time (second) and h = sample thickness (m)
The water content in the sample at time t can be determined according to
Eqn.5.5:
… 5.5
Where Mt = % water absorbed at time t, Wm = weight of moist sample and Wd
= weight of dry sample. The solution of diffusion equation in terms of % water
absorption is given by eqn.5.6:
… 5.6
% 100W Wm dMt Wd
−= ×

Fabrication of composites ….. 259
( )2
2
4xm
hD slopeM
π⎛ ⎞
= ⎜ ⎟⎝ ⎠
Where Mm = equilibrium water content. Diffusivity in a given environment can
be determined from the initial slope of the plot of %M against t according to
Eqn. 5.7:
… 5.7
In present case assuming unidimensional Fickian diffusion, water
absorption in composites was carried in pure water, 10% HCl and 10% NaCl
at room temperature by a change in mass method. Preweighed samples were
immersed in distilled water, 10%HCl and 10%NaCl solutions at room
temperature. Samples were periodically taken out from the solutions, wiped
with tissue papers, reweighed and reimmersed in the solutions. The process
was carried out till equilibrium was established.
The plots % weight gains with the passage of time (t1/2) in different
environment at 27°C are presented in Figs.-5.15-5.17. Equilibrium water
content and equilibrium time are reported in Table-5.15.
Water uptake behavior of both the composites is HCl > water > NaCl.
High water uptake tendency in acidic environment is due to solvation effect
via H-bond formation. The lone pair of electrons is responsible for solvation
effect in the composites.
Diffusivity in composites was determined from initial slopes and also
reported in Table-5.15 by using Eqn.5.7. Diffusivity behavior is practically
almost same in both the samples. Comparatively low diffusivity in acidic
environment is due to strong solvation effect environment. High diffusivity in
saline environment is due to structure breaking tendency of sodium chloride.
Water penetration in composite is conducted mainly by diffusion
mechanism. The penetration of water in composites also occurs through
capillary flow along the fiber/matrix interface followed by diffusion from the
interface into the bulk resin and transported by micro cracks. Absorbed water
may induce irreversible changes like chemical degradation, cracking and
debonding. Cracking and blistering cause high water absorption, while
leaching of small molecules results in decrease in weight.

Fabrication of composites ….. 260
Water absorption in boiling water Water absorption in composites mainly depends on temperature and it
is independent on water content. The effect of boiling water on water
absorption in Compo-A and Compo-B with time is summarized in Table-5.15
and Fig.-5.16, from which it is evident that equilibrium reached after 7h in both
composites. Observed equilibrium water content in Compo-A and Compo-B
was 12.7 and 22.6 % respectively. Thus equilibrium time is reduced 24 and
20.6 times in Compo-A and Compo-B respectively without damaging
composites.
Table-5.15: Water uptake and diffusivity data of Compo-A and Compo-B at 27°C
Properties Water 10% HCl 10%NaCl
Compo-A
Equilibrium time, h 168 192 120
Equilibrium water content,% 10.8 20.2 9.1
Diffusivity Dx,10-12 ,m2/s 0.23 0.17 0.29
Compo-B
Equilibrium time, h 144 216 168
Equilibrium water content,% 16.7 22.1 14.3
Diffusivity Dx,10-12 ,m2/s 0.26 0.17 0.32

Fabrication of composites ….. 261
Table-5.16: The effect of boiling water on water absorption in composites with time
Time (h) % Weight change
Compo-A Compo-B
0 0 0
1 2.2 7.3
2 4.9 14.4
3 7.8 17.5
4 10 19.5
5 12.1 21.2
6 12.6 22.2
7 12.7 22.6
8 12.71 22.6
Fig.- 5.15 : The plots of % weight gain against t1/2 for Compo-A in different environments at 270C

Fabrication of composites ….. 262
Fig.- 5.16 : The plots of % weight gain against t1/2 for Compo-B in
different environments at 270C
Fig.- 5.17 : The plots of % weight gain against time t1/2 for Compo-A
and Compo-B in boiling water.


