71 CHAPTER 6 BLUE GREEN AND UV EMITTING ZnO NANOPARTICLES SYNTHESIZED THROUGH A NON AQUEOUS ROUTE 6.1 INTRODUCTION Several techniques such as chemical vapour deposition, electrochemical deposition, thermal decomposition, spray pyrolysis, hydrothermal method, direct chemical synthesis, synthesis through reverse micelles and solvothermal method are used to synthesize ZnO nanoparticles and thin films [121-128]. Yang et al., have reported synthesis of size controlled ZnO nanoparticles via thermal decomposition of zinc acetate using organic additives [123]. Nanoscale ZnO with specific shape or dimension is synthesized from zinc acetate precursor using organic additives as the modifying and protecting agents [129, 130]. Photoluminescence from ZnO shows two emission peaks: excitonic UV emission and defect related deep level (DL) emission in the visible region [131-133]. Room temperature PL spectra of annealed ZnO films prepared by thermal oxidation of Zn metallic films showed stronger UV emission for 410 °C annealed samples [131]. Cho and Chen et al., have reported the monotonic increase of UV emission with annealing temperature [134, 135]. Wang et al., have observed only UV emission and no visible luminescence from ZnO nanoparticles [136]. Different mechanisms have been invoked by many researchers. The exact mechanism is still in controversy. Raman scattering from ZnO nanostructures has been studied extensively [27, 72, 137]. Phonon confinement effect has been observed in ZnO nanoparticles of size 4.0 nm and 8.5 nm. The dependence of the
Transcript
71
CHAPTER 6
BLUE GREEN AND UV EMITTING ZnO NANOPARTICLES
SYNTHESIZED THROUGH A NON AQUEOUS ROUTE
6.1 INTRODUCTION
Several techniques such as chemical vapour deposition, electrochemical
deposition, thermal decomposition, spray pyrolysis, hydrothermal method, direct
chemical synthesis, synthesis through reverse micelles and solvothermal method are
used to synthesize ZnO nanoparticles and thin films [121-128]. Yang et al., have
reported synthesis of size controlled ZnO nanoparticles via thermal decomposition
of zinc acetate using organic additives [123]. Nanoscale ZnO with specific shape or
dimension is synthesized from zinc acetate precursor using organic additives as the
modifying and protecting agents [129, 130].
Photoluminescence from ZnO shows two emission peaks: excitonic UV
emission and defect related deep level (DL) emission in the visible region
[131-133]. Room temperature PL spectra of annealed ZnO films prepared by
thermal oxidation of Zn metallic films showed stronger UV emission for 410 °C
annealed samples [131]. Cho and Chen et al., have reported the monotonic increase
of UV emission with annealing temperature [134, 135]. Wang et al., have observed
only UV emission and no visible luminescence from ZnO nanoparticles [136].
Different mechanisms have been invoked by many researchers. The exact
mechanism is still in controversy. Raman scattering from ZnO nanostructures has
been studied extensively [27, 72, 137]. Phonon confinement effect has been
observed in ZnO nanoparticles of size 4.0 nm and 8.5 nm. The dependence of the
72
extent of peak shift and line broadening on the shape of phonon dispersion curve
was reported [27]. Raman spectra of 20 nm particles excited with 325 nm UV line
showed larger phonon frequency shifts which was attributed to laser heating [72,
137]. Different mechanisms like phonon confinement, laser heating and stress in the
nanoparticles are invoked to explain the peak shift observed in the Raman spectra of
ZnO nanoparticles. Defects also play their role in determining the intensities of
some Raman modes. PL and Raman scattering are very effective non destructive
tools to study the defect structure of the nanoparticles. In this chapter, synthesis of
ZnO nanoparticles through a non aqueous route without using any precipitating
agent or capping agent and detailed PL and Raman scattering investigations are
reported.
6.2 SYNTHESIS OF ZnO NANOPARTICLES
For the synthesis of ZnO nanoparticles, the chemicals were used without
further purification. Zinc acetate dihydrate (Zn(CH3COO)2 · 2H2O) was taken as a
zinc source and methanol was used as a solvent. 0.03 M zinc acetate was dissolved
in pure methanol. The solution was allowed to stir at 60 °C for 3 hours. The white
colored precipitated particles were centrifuged and washed with ethanol for several
times. The final product was dried for few hours at 100 °C. These nanoparticles
were annealed at 200 °C and 300 °C for further studies.
6.3 RESULTS AND DISCUSSIONS
6.3.1 Structural Studies
Structure and phase purity of the samples are identified from XRD
patterns. Figure 6.1 (a)-(c) shows the powder XRD patterns of the as synthesized
ZnO nanoparticles and samples annealed at 200 °C and 300 °C respectively. All the
diffracted peaks obtained are corresponding to (1 0 0), (0 0 2), (1 0 1), (1 0 2),
73
(1 1 0), (1 0 3), (2 0 0), (1 1 2) and (2 0 1) planes in the hexagonal phase of ZnO.
The XRD patterns of the ZnO nanoparticles are in good agreement with the values
of standard card (JCPDS NO 36-1451). No other impurity peaks are observed. From
the broadening of the XRD peaks, the average particle size is calculated using
Scherrer’s formula as 11 nm for the as prepared ZnO nanoparticles and 19 nm and
23 nm in the case of samples annealed at 200 °C and 300 °C respectively.
Figure 6.1 XRD patterns of ZnO nanoparticles (a) as prepared, (b) annealed
at 200 °C and (c) annealed at 300 °C.
74
Figure 6.2 TEM image of ZnO nanoparticles (a) as prepared, (b) annealed
at 200 °C , (c) 300 °C and (d) HRTEM image for ZnO at 300 °C.
Figure 6.2 (a) shows TEM image of as prepared ZnO nanoparticles. It
shows spherical particles of size various from 10 nm - 20 nm. TEM image
[Fig. 6.2 (b)] of ZnO nanoparticles annealed at 200 °C shows some elongated
75
structures along with spherical particles of 22 nm - 25 nm size. Figure 6.2 (c)
corresponds to the TEM image of ZnO nanoparticles annealed at 300 °C which
shows more elongated rod like structures along with some spherical particles of
30 nm - 40 nm size. Figure 6.2 (d) shows the HRTEM micrograph from which
lattice spacing has been measured as 0.30 nm corresponding to the (1 0 0) plane of
hexagonal ZnO.
6.3.2 Photoluminescence Studies
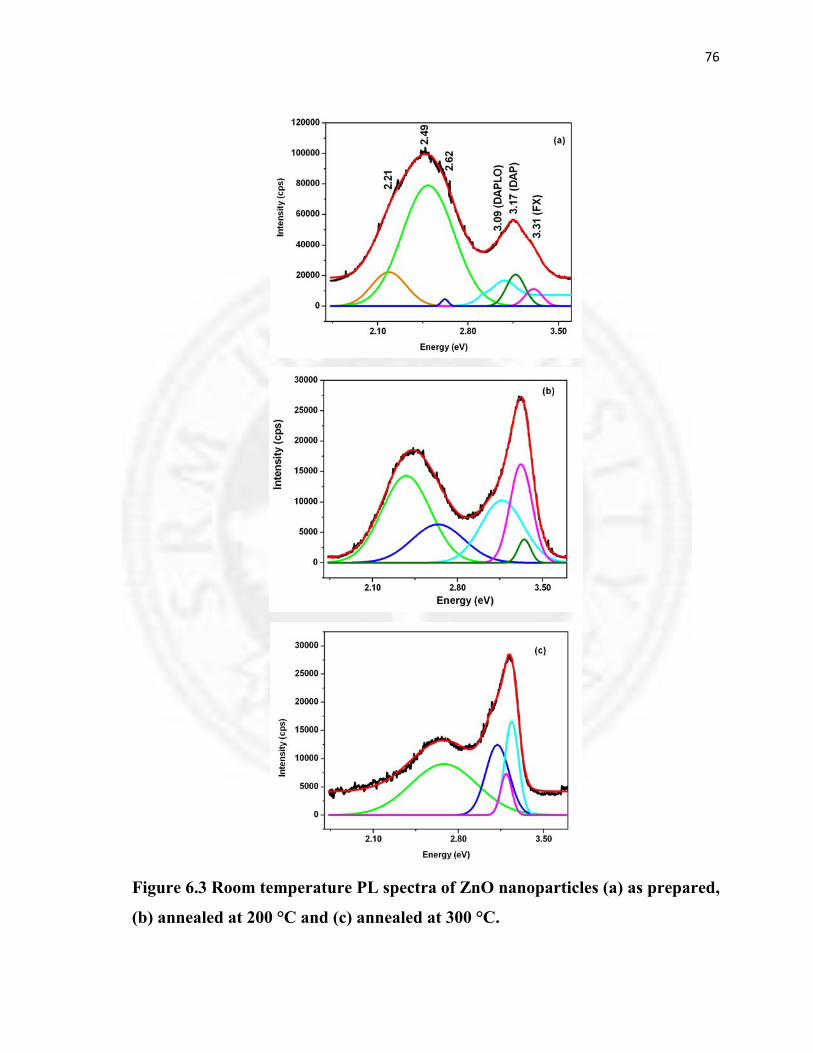
Figure 6.3 (a-c) shows the room temperature PL spectra of as prepared
ZnO nanoparticles and the samples annealed at 200 °C and 300 °C respectively. PL
spectra of as prepared and annealed ZnO nanoparticles at 200 °C and 300 °C show
sharp intense UV emission and broad visible DL emission. Compared to the strong
visible emission a less intense UV emission is observed in the case of as prepared
ZnO nanoparticles [Fig. 6.3 (a)]. Larger exciton binding energy (~60 meV) of ZnO
results in intense exciton emission even at room temperature. This explains the
strong UV emission observed in the present study even in the room temperature. UV
emission originates from free excitonic emission [138]. PL spectra recorded at low
temperatures show well resolved excitonic features clearly whereas, in the room
temperature PL spectrum all these components combine and results in a broad
emission peak in the UV region. By fitting this broad UV emission peak using
Gaussian line-shape three transition energies are derived from fitted components as
3.31 eV, 3.17 eV and 3.09 eV which are assigned to free exciton, (FX), donor-
acceptor pairs (DAP) and its LO phonon replica respectively.
76
Figure 6.3 Room temperature PL spectra of ZnO nanoparticles (a) as prepared,
(b) annealed at 200 °C and (c) annealed at 300 °C.
77
On annealing, marginal increase of UV emission and drastic quenching
of visible emission are observed. The UV emission shows red shift and its FWHM
value decreased from 156 meV to 133 meV on annealing at 300 °C where the
particle size is 30 nm - 40 nm. Cho et al. [134], have also reported similar reduction
of FWHM of UV emission from 107 meV to 23 meV on annealing from 700 °C to
1000 °C where the particle sizes varies from 53 nm to 61 nm. Gaussian fitting of the
visible emission in the as prepared sample shows three transitions at yellow
(2.21 eV), green (2.49 eV) and blue (2.62 eV) regions. Oxygen interstitials (Oi-) are
responsible for the yellow emission [139]. Mechanism responsible for green
emission is the recombination of a delocalized electron close to the conduction band
with a deeply trapped hole in the singly ionized oxygen vacancy (Vo+) [121, 139].
Blue emission at 2.62 eV is ascribed to electronic transition from donor energy level
of zinc interstitial to acceptor energy level of zinc vacancies [140]. In the as
prepared sample it is observed at 2.62 eV. On annealing blue emission shifts to
2.68 eV and becomes prominent in the 300 °C annealed sample.
Wang et al., have observed weak UV emission, orange and green
emission [133]. Cho et al., have observed single exciton peak around 390 nm (3.18
eV) without DL emission and an increase in intensity for the samples annealed
above 500 °C and no change for annealing below 500 ˚C was reported [134]. Chen
et al., have reported a strong NBE emission around 375 nm (3.3 eV) and a weak
emission around 510 nm (2.43 eV) [135]. PL spectra of annealed ZnO films
prepared by thermal oxidation of Zn metallic films showed UV emission for 410 °C
annealed samples [131]. Wang et al., observed only UV emission from ZnO
nanoparticles [136].
UV, blue, green and yellow emissions are observed in the as prepared
ZnO nanoparticles. The yellow emission gets completely quenched on annealing at
78
200 °C, whereas, the intensity of the other emissions are comparatively reduced
(6 times reduction in intensity as compared to the as prepared ZnO nanoparticles).
Annealing at 300 °C, causes removal of green emission. In the as prepared sample
the stronger DL emission arises from the intrinsic defects only. Contribution from
extrinsic defects and impurities is not possible in this case because the synthesis
method involves no precipitating agents or capping agents. Smaller the particle size
larger will be the surface to volume ratio and hence large number of defect states
created on the surface of the nanoparticles giving rise to enhanced surface
luminescence in the visible region. Hence the surface luminescence dominates in the
as prepared sample which gets quenched on annealing whereas marginal increase in
UV emission is observed on annealing.
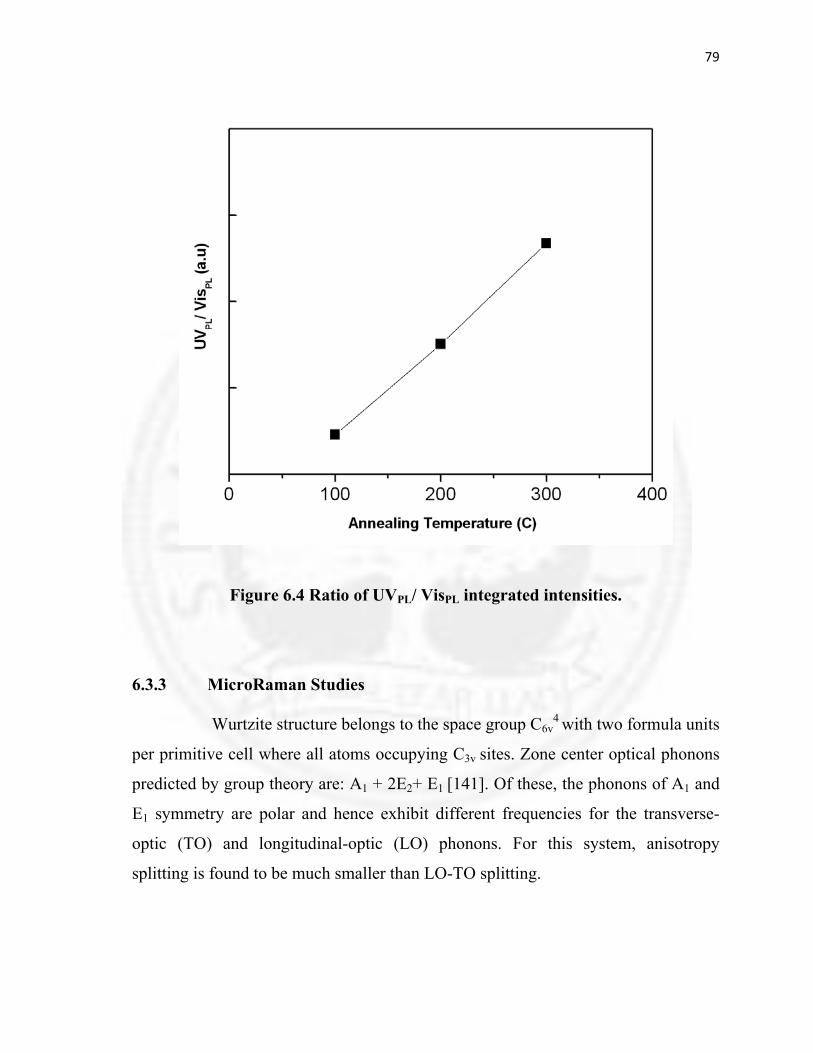
Figure 6.4 shows the ratio of intensities of ultraviolet photoluminescence
to that of visible photoluminescence (UVPL/ VisPL) integrated intensities. The ratio
of intensities of these two peaks is found to increase on annealing. Quenching of
visible emission on annealing is responsible for this. Optical performance depends
on the UVPL/VisPL ratio. A higher ratio has been achieved on annealing.
79
Figure 6.4 Ratio of UVPL/ VisPL integrated intensities.
6.3.3 MicroRaman Studies
Wurtzite structure belongs to the space group C6v4
with two formula units
per primitive cell where all atoms occupying C3v sites. Zone center optical phonons
predicted by group theory are: A1 + 2E2+ E1 [141]. Of these, the phonons of A1 and
E1 symmetry are polar and hence exhibit different frequencies for the transverse-
optic (TO) and longitudinal-optic (LO) phonons. For this system, anisotropy
splitting is found to be much smaller than LO-TO splitting.
80
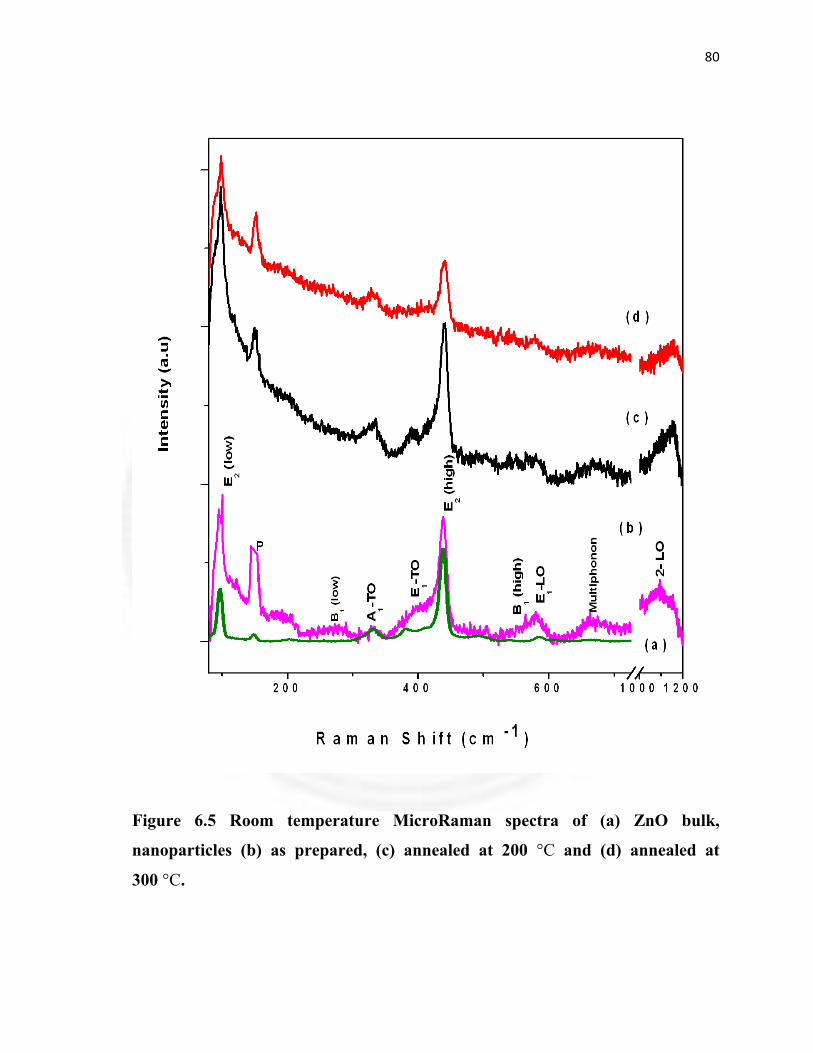
Figure 6.5 Room temperature MicroRaman spectra of (a) ZnO bulk,
nanoparticles (b) as prepared, (c) annealed at 200 °C and (d) annealed at
300 °C.
81
Figure 6.4 (a-d) shows the microRaman spectra of ZnO bulk,
nanoparticles, as prepared and annealed at 200 °C and 300 °C respectively. The
microRaman spectra of the ZnO nanoparticles show non polar and polar phonon
modes such as E2 (low), E2 (high), A1-TO, A1-LO, E1-TO, E1-LO, multi phonon
Raman peaks and also some weak peaks. The Raman spectra are fitted to Lorentzian
line shape and the components derived from fitting give the frequencies of the
observed Raman modes. Table 6.1 shows the Raman mode frequencies of ZnO
nanoparticles. Corresponding bulk phonon frequencies are also given in the table for
comparison.
Table: 6.1 Raman modes in ZnO nanoparticles
Phonon modes
Raman mode frequences
Nano ZnO (cm-1)
Bulk ZnO (cm-1)
E2 (low) 97 97
B1 (low) 270 - A1(TO) 382.9 383
E1(TO) 410.4 411
E2 (high) 438 438
B1 (high) 540 -
A1(LO) 565 570
E1(LO) 581 587
Multiphonon 665 665
2-LO 1096 -
82
All the Raman modes predicted by group theory are observed in the Raman spectra.
E2 (low) mode arises from the vibration of heavy zinc sublattice and E2 (high) arises
due to the vibration of oxygen sublattice. The polar E1 LO phonon is also observed
in the present study. Normally this mode is observed only under resonance
conditions. Prominent E1 LO peak has been observed only when the Raman
spectrum of 4 nm ZnO nanoparticles was excited using 363.8 nm laser line which is
Resonance Raman Scattering and is not observed when excited using 457.9 nm and
476.5 nm lines which are non resonance conditions [27]. Wang et al., have reported
the observation of E1LO multiphonons when excited using 325 nm laser which is
also a resonance condition [136]. Moreover, the observation of this mode depends
on the orientation and polarization of incident and scattered light in single crystals
[142].
In the present study, it is observed that E1 LO phonon appears with less intensity,
since the spectrum is excited using 488 nm laser which is non resonance condition.
A multiphonon mode which is a combination mode of A1LO + E2 (low) is observed
at 665 cm-1 and 2-LO phonon is observed at ~ 1096 cm-1. Broad and less intense
peaks are observed in the region of 270 cm-1 and 540 cm-1. Ab initio calculations of
the lattice dynamics in ZnO shows that the anomalous Raman modes at 275 cm-1 and
552 cm-1 are assigned to B1 (low) and B1 (high) silent modes respectively. The
observation of the B1 silent mode in the Raman spectra is due to the disorder-
activated Raman scattering (DARS) which is induced by breakdown of the
translational symmetry of the lattice defects or impurities [143]. The peaks observed
at 270 cm-1 and 540 cm-1 are assigned to silent modes B1(low) and B1(high) which
appear as a result of DARS. These modes have been observed in the as prepared
sample and their intensity is found to deceases on annealing which strengthens the
arguments that the defects on the surface are responsible for the appearance of these
modes. On annealing, crystalline quality is improved which results in the increase of
83
UV emission, quenching of green luminescence and decrease in DARS in the ZnO
nanoparticles.
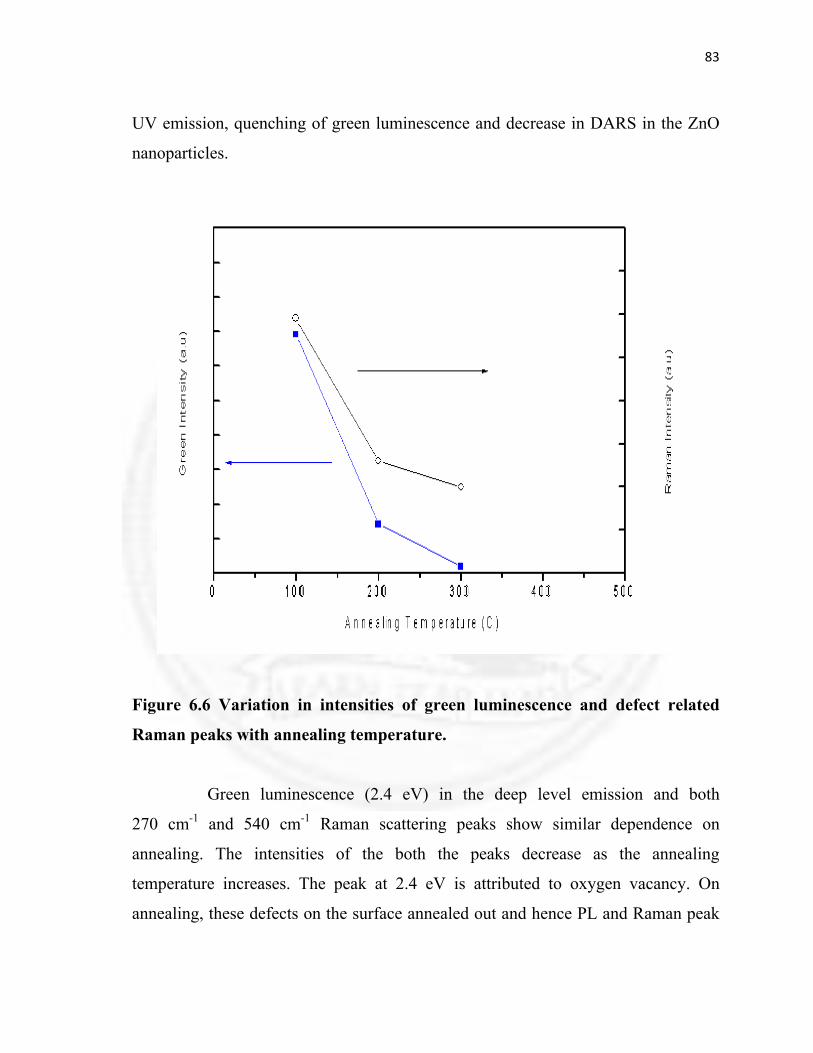
Figure 6.6 Variation in intensities of green luminescence and defect related
Raman peaks with annealing temperature.
Green luminescence (2.4 eV) in the deep level emission and both
270 cm-1 and 540 cm-1 Raman scattering peaks show similar dependence on
annealing. The intensities of the both the peaks decrease as the annealing
temperature increases. The peak at 2.4 eV is attributed to oxygen vacancy. On
annealing, these defects on the surface annealed out and hence PL and Raman peak
84
intensities decreases. Hence, the origin of green luminescence in PL and Raman
peaks at 270 cm-1 and 540 cm-1 is the same. Figure 6.6 shows the variation of
intensity of green luminescence and defect related Raman peaks with annealing
temperature. Both show similar decreasing trend confirming the surface defects
being the origin for both.
6.4 CONCLUSIONS
ZnO nanoparticles were synthesized through non aqueous route without
using any precipitating agents or capping agents. Wurtzite structure and phase purity
were confirmed by XRD and TEM. TEM images showed spherical particles and
elongated structures in the as prepared and the annealed samples. Room temperature
PL spectra showed UV emission arising from FX, DAP and it’s LO phonon replica.
Defect level luminescences in blue, green and yellow regions were assigned to
transitions arising from zinc and oxygen vacancies and interstitials. By annealing,
the yellow and green luminescences were quenched and blue luminescence was
persistent. MicroRaman spectrum of ZnO nanoparticles showed all the polar and
non-polar Raman modes and multi phonon modes were also observed. DARS
resulted in the appearance of B1 silent modes in the Raman spectra which