1 IAEA International Atomic Energy Agency This set of 170 slides is based on Chapter 6 authored by E.B. Podgorsak of the IAEA textbook (ISBN 92-0-107304-6): Radiation Oncology Physics: A Handbook for Teachers and Students Objective: To familiarize students with basic principles of dose calculations in external beam radiotherapy with photon beams. Chapter 6 External Photon Beams: Physical Aspects Slide set prepared in 2006 (updated Aug2007) by E.B. Podgorsak (McGill University, Montreal) Comments to S. Vatnitsky: [email protected]IAEA Radiation Oncology Physics: A Handbook for Teachers and Students - 6.(2/170) CHAPTER 6. TABLE OF CONTENTS 6.1. Introduction 6.2. Quantities used in describing a photon beam 6.3. Photon beam sources 6.4. Inverse square law 6.5. Penetration of photon beams into a phantom or patient 6.6. Radiation treatment parameters 6.7. Central axis depth doses in water: SSD set-up 6.8. Central axis depth doses in water: SAD set-up 6.9. Off-axis ratios and beam profiles 6.10. Isodose distributions in water phantoms 6.11. Single field isodose distributions in patients 6.12. Clarkson segmental integration 6.13. Relative dose measurements with ionization chambers 6.14. Delivery of dose with a single external beam 6.15. Shutter correction time
Transcript
1
IAEAInternational Atomic Energy Agency
This set of 170 slides is based on Chapter 6 authored by
E.B. Podgorsak
of the IAEA textbook (ISBN 92-0-107304-6):
Radiation Oncology Physics:
A Handbook for Teachers and Students
Objective:
To familiarize students with basic principles of dose calculations in
• Characteristic x rays (electron - orbital electron interaction)
Used in x-ray machines and linacs.
• Annihilation radiation (positron annihilation)
Used in positron emission tomography (PET) imaging.
3
IAEA Radiation Oncology Physics: A Handbook for Teachers and Students - 6.2 Slide 1 (5/170)
6.2 QUANTITIES USED IN DESCRIBING PHOTON BEAMS
Radiation dosimetry deals with two distinct entities:
• Description of photon radiation beam in terms of the number and
energies of all photons constituting the beam (photon beam
spectrum).
• Description of the amount of energy per unit mass (absorbed
dose) the photon beam may deposit in a given medium, such as
air, water, or biological material.
IAEA Radiation Oncology Physics: A Handbook for Teachers and Students - 6.2.1 Slide 1 (6/170)
6.2 QUANTITIES USED IN DESCRIBING PHOTON BEAMS6.2.1 Photon fluence and photon fluence rate
Photon fluence
• dN is the number of photons that enter an imaginary sphere of
cross-sectional area dA.
• Unit of photon fluence is cm-2.
Photon fluence rate is defined as the photon
fluence per unit time.
• Unit of photon fluence rate is cm-2 . s-1.
=
dN
dA
d
dt= =
4
IAEA Radiation Oncology Physics: A Handbook for Teachers and Students - 6.2.2 Slide 1 (7/170)
6.2 QUANTITIES USED IN DESCRIBING PHOTON BEAMS6.2.2 Energy fluence and energy fluence rate
Energy fluence
• dE is the amount of energy crossing a unit area dA.
• Unit of energy fluence is .
Energy fluence rate is defined as the energy
fluence per unit time.
• Unit of energy fluence rate is
=
dE
dA
MeV cm-2
d
dt= =
MeV cm2
s1.
IAEA Radiation Oncology Physics: A Handbook for Teachers and Students - 6.2.3 Slide 1 (8/170)
6.2 QUANTITIES USED IN DESCRIBING PHOTON BEAMS6.2.3 Air kerma in air
For a monoenergetic photon beam in air the air kerma
in air at a given point away from the source is
is the mass-energy transfer coefficient for air at photon
energy .
(Kair)
air
tr trair air
air air
( )K hμ μ
= =
μtr( / )
h
5
IAEA Radiation Oncology Physics: A Handbook for Teachers and Students - 6.2.3 Slide 2 (9/170)
6.2 QUANTITIES USED IN DESCRIBING PHOTON BEAMS6.2.3 Air kerma in air
Kerma consists of two components: collision and radiation
Collision kerma is proportional to photon fluence
and energy fluence
is the mass-energy absorption coefficient for air at photon
energy .
Kcol
col ab abK h
μ μ= =
(μab/ )
h
K = Kcol
+ Krad
IAEA Radiation Oncology Physics: A Handbook for Teachers and Students - 6.2.3 Slide 3 (10/170)
6.2 QUANTITIES USED IN DESCRIBING PHOTON BEAMS6.2.3 Air kerma in air
Relationship between and
is the radiation fraction, i.e., fraction of charged particle energy
lost to bremsstrahlung rather than being deposited in the
medium.
(μab/ ) (μtr
/ )
μab =
μtr (1 g),
g
6
IAEA Radiation Oncology Physics: A Handbook for Teachers and Students - 6.2.4 Slide 1 (11/170)
6.2 QUANTITIES USED IN DESCRIBING PHOTON BEAMS6.2.4 Exposure in air
Collision air kerma in air and exposure in air X
is the average energy required to produce an ion pair in dry air.
Special unit of exposure is the roentgen R
col airair air( )
WK X
e=
(Kair
col)air
air( / )W e
=air( / ) 33.97 J/C.W e
(1 R = 2.58 104 C/kg
air)
(Kair
col)air
= 2.58 10 4 C
kgair
33.97 J
CX = 0.876
cGy
RX
IAEA Radiation Oncology Physics: A Handbook for Teachers and Students - 6.2.5 Slide 1 (12/170)
6.2 QUANTITIES USED IN DESCRIBING PHOTON BEAMS6.2.5 Dose to small mass of medium in air
The concept “dose to small mass of medium in air”
also referred to as “dose in free space” is based
on measurement of air kerma in air.
is subject to same limitations as exposure X and
collision air kerma in air Thus it is:
• Defined only for photons.
• Defined only for photon energies below 3 MeV.
D
med
D
med
(Kair
col)air
.
7
IAEA Radiation Oncology Physics: A Handbook for Teachers and Students - 6.2.5 Slide 2 (13/170)
6.2 QUANTITIES USED IN DESCRIBING PHOTON BEAMS6.2.5 Dose to small mass of medium in air
the dose to small mass of medium in air is deter-
mined from ionization chamber signal measured at
point P in air.
The ionization chamber must:
• Incorporate appropriate buildup cap.
• Possess an exposure calibration coefficient NX or air kerma
in air calibration coefficient NK.
D
med,
IAEA Radiation Oncology Physics: A Handbook for Teachers and Students - 6.2.5 Slide 3 (14/170)
6.2 QUANTITIES USED IN DESCRIBING PHOTON BEAMS6.2.5 Dose to small mass of medium in air
Steps involved in the determination of from MP
• MP signal measured at point P in air.
• XP exposure at point P in air.
• air kerma in air at point P.
• collision kerma to , an infinitesimal mass of medium at P.
• collision kerma to a spherical mass of medium with radius
rmed at P.
• dose to small mass of medium at point P.
D
med
MP
XP
(Kair
)air
(Km
)air
(Kmed
)air
Dmed
Step: (1) (2) (3) (4) (5)
air air( )K
m air( )K
med air( )K
D
med
m
8
IAEA Radiation Oncology Physics: A Handbook for Teachers and Students - 6.2.5 Slide 4 (15/170)
6.2 QUANTITIES USED IN DESCRIBING PHOTON BEAMS6.2.5 Dose to small mass of medium in air
Steps involved in the calculation of D
med
IAEA Radiation Oncology Physics: A Handbook for Teachers and Students - 6.2.5 Slide 5 (16/170)
6.2 QUANTITIES USED IN DESCRIBING PHOTON BEAMS6.2.5 Dose to small mass of medium in air
Determination of
• is a correction factor accounting for the photon beam
attenuation in the spherical mass of medium with radius rmed just
large enough to provide electronic equilibrium at point P.
• is given by:
• For water as the medium for cobalt-60 gamma
rays and equal to 1 for lower photon energies.
D
med
m
abmed med P med med P
air
cGy0.876 ( ) ( )
RD k r X f k r X
μ=
med( )k r
μ
=
abmed
med
med( ) er
k rmed( )k r
=med( ) 0.985k r
9
IAEA Radiation Oncology Physics: A Handbook for Teachers and Students - 6.3 Slide 1 (17/170)
6.3 PHOTON SOURCES FOR EXTERNAL BEAM THERAPY
Photon sources with regard to type of photons:
• Gamma ray sources
• X-ray sources
Photon sources with regard to photon energies:
• Monoenergetic sources
• Heterogeneous sources
Photon sources with regard to intensity distribution:
• Isotropic
• Non-isotropic
IAEA Radiation Oncology Physics: A Handbook for Teachers and Students - 6.3 Slide 2 (18/170)
6.3 PHOTON SOURCES FOR EXTERNAL BEAM THERAPY
For a given photon source, a plot of number of photons
per energy interval versus photon energy is referred to
as the photon spectrum.
All photons in a monoenergetic photon beam have the
same energy . h
10
IAEA Radiation Oncology Physics: A Handbook for Teachers and Students - 6.3 Slide 3 (19/170)
6.3 PHOTON SOURCES FOR EXTERNAL BEAM THERAPY
Photons in a heterogeneous x-ray beam form a distinct
spectrum,
• Photons are present in all energy intervals from 0 to a
maximum value which is equal to the monoenergetic
kinetic energy of electrons striking the target.
• The two spikes in the
spectrum represent
characteristic x rays;
the continuous spectrum
from 0 to represents
bremsstrahlung photons.
maxh
maxh
IAEA Radiation Oncology Physics: A Handbook for Teachers and Students - 6.3 Slide 4 (20/170)
6.3 PHOTON SOURCES FOR EXTERNAL BEAM THERAPY
Gamma ray sources are usually isotropic and produce
monoenergetic photon beams.
X-ray targets are non-isotropic sources and produce
heterogeneous photon spectra.
• In the superficial and orthovoltage energy region the x-ray
emission occurs predominantly at 90o to the direction of the
electron beam striking the x-ray target.
• In the megavoltage energy region the x-ray emission in the
target occurs predominantly in the direction of the electron
beam striking the target (forward direction).
11
IAEA Radiation Oncology Physics: A Handbook for Teachers and Students - 6.4 Slide 1 (21/170)
6.4 INVERSE SQUARE LAW
In external beam radiotherapy:
• Photon sources are
often assumed to be
point sources.
• Beams produced by
photon sources are
assumed to be divergent.
tan =a / 2
fa
=b / 2
fb
IAEA Radiation Oncology Physics: A Handbook for Teachers and Students - 6.4 Slide 2 (22/170)
6.4 INVERSE SQUARE LAW
Photon source S emits
photons and produces a
photon fluence at a
distance fa and a photon
fluence at distance fb.
Number of photons Ntot
crossing area A is equal
to the number of photons
crossing area B.
A
B
N
tot=
AA =
BB = const
12
IAEA Radiation Oncology Physics: A Handbook for Teachers and Students - 6.4 Slide 3 (23/170)
6.4 INVERSE SQUARE LAW
We assume that ,
i.e., no photon interactions take
place in air. Therefore:
Quantities
all follow the inverse square law
N
tot= const
A
B
=B
A=
b2
a2
=fb
2
fa
2
X (fa)
X (fb)
=(K
air
col(fa))
air
(Kair
col(fb))
air
=D
med
Dmed
=fb
fa
2
X , (Kair
col)air
, and Dmed
IAEA Radiation Oncology Physics: A Handbook for Teachers and Students - 6.5 Slide 1 (24/170)
6.5 PENETRATION OF PHOTON BEAMS INTO PATIENT
A photon beam propagating through air or vacuum is
governed by the inverse square law.
A photon beam propagating through a phantom or
patient is affected not only by the inverse square law
but also by the attenuation and scattering of the photon
beam inside the phantom or patient.
The three effects (inverse square law, attenuation, and
scattering) make the dose deposition in a phantom or
patient a complicated process and its determination a
complex task.
13
IAEA Radiation Oncology Physics: A Handbook for Teachers and Students - 6.5 Slide 2 (25/170)
6.5 PENETRATION OF PHOTON BEAMS INTO PATIENT
For a successful outcome of patient radiation treatment
it is imperative that the dose distribution in the target
volume and surrounding tissues is known precisely and
accurately.
This is usually achieved through the use of several
empirical functions that link the dose at any arbitrary
point inside the patient to the known dose at the beam
calibration (or reference) point in a phantom.
IAEA Radiation Oncology Physics: A Handbook for Teachers and Students - 6.5 Slide 3 (26/170)
6.5 PENETRATION OF PHOTON BEAMS INTO PATIENT
Dosimetric functions are usually measured with suitable
radiation detectors in tissue equivalent phantoms.
Dose or dose rate at the reference point is determined
for, or in, water phantoms for a specific set of reference
conditions, such as:
• Depth in phantom z
• Field size A
• Source-surface distance (SSD).
14
IAEA Radiation Oncology Physics: A Handbook for Teachers and Students - 6.5 Slide 4 (27/170)
6.5 PENETRATION OF PHOTON BEAMS INTO PATIENT
Typical dose distribution for an external photon beam
follows a known general pattern:
• The beam enters the patient
on the surface where it delivers
a certain surface dose Ds.
• Beneath the surface the dose
first rises rapidly, reaches a
maximum value at a depth zmax,
and then decreases almost
exponentially until it reaches a
value Dex at the patient’s exit
point.
IAEA Radiation Oncology Physics: A Handbook for Teachers and Students - 6.5.1 Slide 1 (28/170)
6.5 PENETRATION OF PHOTON BEAMS INTO PATIENT6.5.1 Surface dose
Surface dose:
• For megavoltage x-ray beams thesurface dose is generally muchlower (skin sparing effect) than themaximum dose at zmax.
• For superficial and orthovoltagebeams zmax = 0 and the surfacedose equals the maximum dose.
• The surface dose is measured withparallel-plate ionization chambersfor both chamber polarities, withthe average reading between thetwo polarities taken as the correctsurface dose value.
15
IAEA Radiation Oncology Physics: A Handbook for Teachers and Students - 6.5.1 Slide 2 (29/170)
6.5 PENETRATION OF PHOTON BEAMS INTO PATIENT6.5.1 Surface dose
Contributors to surface dose Ds:• Photons scattered from the
collimators, flattening filter and air.
• Photons backscattered from thepatient.
• High energy electrons produced byphoton interactions in air and anyshielding structures in the vicinity ofthe patient.
Typical values of surface dose:• 100% superficial and orthovoltage
• 30% cobalt-60 gamma rays
• 15% 6 MV x-ray beams
• 10% 18 MV x-ray beams
IAEA Radiation Oncology Physics: A Handbook for Teachers and Students - 6.5.2 Slide 1 (30/170)
6.5 PENETRATION OF PHOTON BEAMS INTO PATIENT6.5.2 Buildup region
Buildup dose region:
• The region between the surface (z = 0) and depth z = zmax inmegavoltage photon beams is called the dose buildup region.
• The dose buildup results fromthe relatively long range ofsecondary charged particlesthat first are released in thepatient by photon interactionsand then deposit their kineticenergy in the patient throughCoulomb interactions.
• CPE does not exist in thedose buildup region.
16
IAEA Radiation Oncology Physics: A Handbook for Teachers and Students - 6.5.3 Slide 1 (31/170)
6.5 PENETRATION OF PHOTON BEAMS INTO PATIENT6.5.3 Depth of dose maximum
Depth of dose maximum zmax depends upon:
• Photon beam energy (main effect)
• Field size (secondary effect)
For a given field size:
• zmax increases with photonbeam energy.
• For 5x5 cm2 fields, thenominal values of zmax are:
IAEA Radiation Oncology Physics: A Handbook for Teachers and Students - 6.5.3 Slide 2 (32/170)
6.5 PENETRATION OF PHOTON BEAMS INTO PATIENT6.5.3 Depth of dose maximum zmax
At a given beam energy:
• For fields smaller than 5x5 cm2,zmax increases with increasingfield size because of in-phantomscatter.
• For field 5x5 cm2, zmax reachesits nominal value.
• For fields larger than 5x5 cm2,zmax decreases with increasingfield size because of collimatorand flattening filter scatter.
17
IAEA Radiation Oncology Physics: A Handbook for Teachers and Students - 6.5.3 Slide 3 (33/170)
6.5 PENETRATION OF PHOTON BEAMS INTO PATIENT6.5.3 Exit dose
The dose delivered to the patient at the beam exit point iscalled the exit dose.
Close to the beam exit point the dose distribution curvesslightly downwards from the dose curve obtained for ainfinitely thick phantom asa result of missing scattercontribution for pointsbeyond the dose exit point.
The effect is small andgenerally ignored.
IAEA Radiation Oncology Physics: A Handbook for Teachers and Students - 6.6 Slide 1 (34/170)
6.6 RADIATION TREATMENT PARAMETERS
The main parameters in external beam dose delivery withphoton beams are:
• Depth of treatment z.
• Fields size A.
• Source-skin distance (SSD) in SSD setups.
• Source-axis distance (SAD) in SAD setups.
• Photon beam energy
• Number of beams used in dose delivery to the patient.
• Treatment time for orthovoltage and teletherapy machines.
• Number of monitor units (MUs) for linacs.
h .
18
IAEA Radiation Oncology Physics: A Handbook for Teachers and Students - 6.6 Slide 2 (35/170)
6.6 RADIATION TREATMENT PARAMETERS
Point P is at zmax on central axis.
Point Q is arbitrary point atdepth z on the central axis.
Field size A is defined on patient’ssurface.
AQ is the field size at point Q.
SSD = source-skin distance.
SCD = source-collimator distance
IAEA Radiation Oncology Physics: A Handbook for Teachers and Students - 6.6 Slide 3 (36/170)
6.6 RADIATION TREATMENT PARAMETERS
Several functions are in use for linking the dose at areference point in a water phantom to the dose atarbitrary points inside the patient.
• Some of these functions can be used in the whole energyrange of interest in radiotherapy from superficial throughorthovoltage and cobalt-60 to megavoltage.
• Others are only applicable at energies of cobalt-60 and below.
• Some functions are only used at cobalt-60 energy and above.
Cobalt-60 serves as a transition point linking variousdosimetry techniques.
19
IAEA Radiation Oncology Physics: A Handbook for Teachers and Students - 6.6 Slide 4 (37/170)
6.6 RADIATION TREATMENT PARAMETERS
Dosimetric functions used in the whole photon energy range:• Percentage depth dose (PDD)
• Relative dose factor (RDF)
Dosimetric functions used at cobalt-60 and below:• Peak scatter factor (PSF)
• Collimator factor (CF)
• Scatter factor (SF)
• Scatter function (S)
• Tissue air ratio (TAR)
• Scatter air ratio (SAR)
Dosimetric functions used at cobalt-60 and above:• Tissue maximum ratio (TMR)
• Tissue phantom ratio (TPR)
• Scatter maximum ratio (SMR)
IAEA Radiation Oncology Physics: A Handbook for Teachers and Students - 6.6.1 Slide 1 (38/170)
6.6 RADIATION TREATMENT PARAMETERS6.6.1 Radiation beam field size
Four groups of field shape are used in radiotherapy:• Square (produced with collimators installed in therapy machine).
• Rectangular (produced with collimators installed in therapymachine).
• Circular (produced with special collimators attached to treatmentmachine).
• Irregular (produced with custom made shielding blocks or withmultileaf collimators).
For any arbitrary radiation field and equivalent squarefield or equivalent circular field may be found. The equi-valent field will be characterized with similar beamparameters and functions as the arbitrary radiation field.
20
IAEA Radiation Oncology Physics: A Handbook for Teachers and Students - 6.6.1 Slide 2 (39/170)
6.6 RADIATION TREATMENT PARAMETERS6.6.1 Radiation beam field size
Radiation fields are divided into two categories:geometric and dosimetric (physical).
• According to the ICRU, the geometric field size is defined as “theprojection of the distal end of the machine collimator onto aplane perpendicular to the central axis of the radiation beam asseen from the front center of the source.”
• The dosimetric field size (also called the physical field size) isdefined by the intercept of a given isodose surface (usually 50%but can also be up to 80%) with a plane perpendicular to thecentral axis of the radiation beam at a defined distance from thesource.
IAEA Radiation Oncology Physics: A Handbook for Teachers and Students - 6.6.1 Slide 3 (40/170)
6.6 RADIATION TREATMENT PARAMETERS6.6.1 Radiation beam field size
Equivalent square for rectangular field:
• An arbitrary rectangular field with sidesa and b will be approximately equal to asquare field with side aeq when both fieldshave the same area/perimeter ratio(Day’s rule).
Equivalent circle for square field:
• An arbitrary square field with side awill be equivalent to a circular field withradius req when both fields have thesame area.
a
eq=
2ab
a + b
req
=a
ab
2(a + b)=
aeq
2
4aeq
a
eq
2= r
eq
2
21
IAEA Radiation Oncology Physics: A Handbook for Teachers and Students - 6.6.2 Slide 1 (41/170)
Exposure in air Xair, air kerma in air (Kair)air and doseto small mass of medium in air consist of twocomponents:
• Primary component is the major component.It originates in the source, comes directly from the source, anddoes not depend on field size.
• Scatter component is a minor, yet non-negligible, component.It represents the scatter from the collimator, air and flatteningfilter (in linacs) and depends on the field size A.
D
med
IAEA Radiation Oncology Physics: A Handbook for Teachers and Students - 6.6.2 Slide 2 (42/170)
For a given photon beam with energy at a given SSD,the dose at point P (at depth zmax) depends on field sizeA; the larger is the field size the larger is the dose.
The ratio of the dose at point P for field size A to the doseat point P for field size 10x10 cm2 is called the relativedose factor RDF or total scatter factor Sc,p in Khan’snotation or machine output factor OF:
h
RDF(A,h ) = Sc,p
(A,h ) =D
P(z
max,A,f ,h )
DP(z
max,10,f ,h )
26
IAEA Radiation Oncology Physics: A Handbook for Teachers and Students - 6.6.4 Slide 2 (51/170)
When extra shielding is used on an accessory tray or amultileaf collimator (MLC) is used to shape the radiationfield on the patient’s surface into an irregular field B, thenthe is in the first approximation given as:
• Field A represents the field set by the machine collimator.
• Field B represents the actual irregular field on patient’s surface.
RDF(B,h ) = CF(A,h ) SF(B,h )
RDF(B,h )
28
IAEA Radiation Oncology Physics: A Handbook for Teachers and Students - 6.7.1 Slide 1 (55/170)
6.7 CENTRAL AXIS DEPTH DOSES IN WATER: SSD SETUP6.7.1 Percentage depth dose
Central axis dose distributions inside the patient areusually normalized to Dmax = 100% at the depth of dosemaximum zmax and then referred to as percentage depthdose (PDD) distributions.
PDD is thus defined as follows:
• DQ and are the dose and dose rate, respectively, at arbitrarypoint Q at depth z on the beam central axis.
• DP and are the dose and dose rate, respectively, at referencepoint P at depth zmax on the beam central axis.
PDD(z,A,f ,h ) = 100D
Q
DP
=D
Q
DP
QD
PD
IAEA Radiation Oncology Physics: A Handbook for Teachers and Students - 6.7.1 Slide 2 (56/170)
6.7 CENTRAL AXIS DEPTH DOSES IN WATER: SSD SETUP6.7.1 Percentage depth dose
The percentage depth dose depends on four parameters:
• Depth in phantom z
• Field size A on patient’s surface
• Source-surface distance f = SSD
• Photon beam energy
PDD ranges in value from• 0 at
• To 100 at
PDD(z,A,f ,h ) = 100D
Q
DP
=D
Q
DP
h
z
=max
z z
29
IAEA Radiation Oncology Physics: A Handbook for Teachers and Students - 6.7.1 Slide 3 (57/170)
6.7 CENTRAL AXIS DEPTH DOSES IN WATER: SSD SETUP6.7.1 Percentage depth dose
The dose at point Q in the patient consists of two compo-nents: primary component and scatter component.
• The primary component is expressed as:
is the effective linear attenuation coefficient for the primarybeam in the phantom material (for example, for a cobalt-60beam in water is 0.0657 cm-1).
PDDpri = 100D
Q
pri
DP
pri= 100
f + zmax
f + z
2
eμeff (z zmax )
μeff
μ
eff
IAEA Radiation Oncology Physics: A Handbook for Teachers and Students - 6.7.1 Slide 4 (58/170)
6.7 CENTRAL AXIS DEPTH DOSES IN WATER: SSD SETUP6.7.1 Percentage depth dose
The dose at point Q in the patient consists of two compo-nents: primary component and scatter component.
• The scatter component at point Q reflects the relative contributionof the scattered radiation to the dose at point Q. It depends in acomplicated fashion on various parameters such as depth, fieldsize and source-skin distance.
• Contrary to the primary component in which the photoncontribution to the dose at point Q arrives directly from the source,the scatter dose is delivered by photons produced throughCompton scattering in the patient, machine collimator, flatteningfilter or air.
30
IAEA Radiation Oncology Physics: A Handbook for Teachers and Students - 6.7.1 Slide 5 (59/170)
6.7 CENTRAL AXIS DEPTH DOSES IN WATER: SSD SETUP6.7.1 Percentage depth dose
For a constant A, f, and ,
• PDD(z,A,f, ) increases
with z from the surface to
z = zmax (buildup region).
• For z > zmax, PDD(z,A,f, )
decreases with z.
h
h
h
IAEA Radiation Oncology Physics: A Handbook for Teachers and Students - 6.7.1 Slide 6 (60/170)
6.7 CENTRAL AXIS DEPTH DOSES IN WATER: SSD SETUP6.7.1 Percentage depth dose
For a constant z, f, and , PDD(z,A,f, ) increases withincreasing field size A because of increased scattercontribution to points on the central axis.
h h
31
IAEA Radiation Oncology Physics: A Handbook for Teachers and Students - 6.7.1 Slide 7 (61/170)
6.7 CENTRAL AXIS DEPTH DOSES IN WATER: SSD SETUP6.7.1 Percentage depth dose
Dependence of high energy photon beams on field size
IAEA Radiation Oncology Physics: A Handbook for Teachers and Students - 6.7.1 Slide 8 (62/170)
6.7 CENTRAL AXIS DEPTH DOSES IN WATER: SSD SETUP6.7.1 Percentage depth dose
In high energy photon beams, the depth of dose maximumzmax also depends on field size A:
• For a given beam energy themaximum zmax occurs for5x5 cm2.
• For fields smaller than 5x5 cm2
the in-phantom scatter affects zmax; the smaller is the field A,the shallower is zmax.
• For fields larger than 5x5 cm2
scatter from collimator andflattening filter affect zmax;the larger is the field A, theshallower is zmax.
32
IAEA Radiation Oncology Physics: A Handbook for Teachers and Students - 6.7.1 Slide 9 (63/170)
6.7 CENTRAL AXIS DEPTH DOSES IN WATER: SSD SETUP6.7.1 Percentage depth dose
For a constant z, A, and , PDD(z,A,f, ) increases withincreasing f because of a decreasing effect of depth zon the inverse square factor, which governs the primarycomponent of the photon beam.
h h
IAEA Radiation Oncology Physics: A Handbook for Teachers and Students - 6.7.1 Slide 10 (64/170)
6.7 CENTRAL AXIS DEPTH DOSES IN WATER: SSD SETUP6.7.1 Percentage depth dose
For a constant
z, A, and f,
PDD(z,A,f, )
beyond zmax
increases with
beam energy
because of a
decrease in beam
attenuation, i.e.,
increase in beam
penetrating power.
h
h
33
IAEA Radiation Oncology Physics: A Handbook for Teachers and Students - 6.7.1 Slide 12 (65/170)
6.7 CENTRAL AXIS DEPTH DOSES IN WATER: SSD SETUP6.7.1 Percentage depth dose
Example: Cobalt-60 beam
IAEA Radiation Oncology Physics: A Handbook for Teachers and Students - 6.7.2 Slide 1 (66/170)
6.7 CENTRAL AXIS DEPTH DOSES IN WATER: SSD SETUP6.7.2 Scatter function
The scatter component at point Q is determined as follows:
The scatter component depends on four parameters:
• Depth in phantom z
• Field size A
• Source-surface distance f
• Photon beam energy
= D
P PSF(A,h )
PDD(z,A,f ,h )
100D
P PSF(0,h )
PDD(z,0,f ,h )
100
Scatter component at Q = Total dose at Q Primary dose at Q =
h
34
IAEA Radiation Oncology Physics: A Handbook for Teachers and Students - 6.7.2 Slide 2 (67/170)
6.7 CENTRAL AXIS DEPTH DOSES IN WATER: SSD SETUP6.7.2 Scatter function
IAEA Radiation Oncology Physics: A Handbook for Teachers and Students - 6.7.2 Slide 4 (69/170)
6.7 CENTRAL AXIS DEPTH DOSES IN WATER: SSD SETUP6.7.2 Scatter function
For constant A, f, andthe scatter function Sfirst increases with z,reaches a peak andthen slowly decreaseswith a further increasein z.
The larger is the fieldsize, the deeper is thedepth of the peak andthe larger is scatterfunction.
h ,
IAEA Radiation Oncology Physics: A Handbook for Teachers and Students - 6.7.2 Slide 5 (70/170)
6.7 CENTRAL AXIS DEPTH DOSES IN WATER: SSD SETUP6.7.2 Scatter function
For a constant z,f, and thescatter functionS increaseswith field size A.
At large fieldsizes the scatterfunction Ssaturates.
h
36
IAEA Radiation Oncology Physics: A Handbook for Teachers and Students - 6.7.2 Slide 6 (71/170)
6.7 CENTRAL AXIS DEPTH DOSES IN WATER: SSD SETUP6.7.2 Scatter function
The dose at a givendepth in phantom hastwo components:primary and scatter.
The larger is thedepth in phantom,the smaller is therelative primarycomponent and thelarger is the relativescatter component.
IAEA Radiation Oncology Physics: A Handbook for Teachers and Students - 6.7.2 Slide 7 (72/170)
6.7 CENTRAL AXIS DEPTH DOSES IN WATER: SSD SETUP6.7.2 Scatter function
Dependence ofscatter function Son SSD.
For a constant z,A, and thescatter functionS increaseswith SSD.
h ,
37
IAEA Radiation Oncology Physics: A Handbook for Teachers and Students - 6.8 Slide 1 (73/170)
6.8 CENTRAL AXIS DEPTH DOSES IN WATER: SAD SETUP
SAD setups are used in treatment of deep seated tumourswith multiple beams or with rotational beams.
In comparison with constant SSD setup that relies on PDDdistributions, the SAD setup is more practical and relies onother dose functions such as:
• Tissue-air ratio (TAR)
• Tissue-phantom ration (TPR)
• Tissue-maximum ratio (TMR)
IAEA Radiation Oncology Physics: A Handbook for Teachers and Students - 6.8.1 Slide 1 (74/170)
6.8 CENTRAL AXIS DEPTH DOSES IN WATER: SAD SETUP6.8.1 Tissue-air ratio
Tissue-air ratio (TAR) wasintroduced by Johns tosimplify dose calculations inrotational radiotherapy butis now also used fortreatment with multiplestationary beams.
The SSD varies from onebeam to another; however,the source-axis distanceSAD remains constant.
38
IAEA Radiation Oncology Physics: A Handbook for Teachers and Students - 6.8.1 Slide 2 (75/170)
6.8 CENTRAL AXIS DEPTH DOSES IN WATER: SAD SETUP6.8.1 Tissue-air ratio
In contrast to PDD which depends on fourparameters, TAR depends on three beam parameters:
• Depth of isocentre z
• Field size at isocentre AQ
• Beam energy
TAR does not depend on the SSD in the SSDrange from 50 cm to 150 cm used in radiotherapy.
The field size AQ is defined at point Q which is normallyplaced into the isocentre of the treatment machine.
h
(z,AQ,h )
(z,A,f ,h )
IAEA Radiation Oncology Physics: A Handbook for Teachers and Students - 6.8.1 Slide 3 (76/170)
6.8 CENTRAL AXIS DEPTH DOSES IN WATER: SAD SETUP6.8.1 Tissue-air ratio
TAR is defined as the ratio:
of the dose DQ at point Q on the central axis in thepatient to the dose to small mass of water in air at thesame point Q in air
(z,AQ,h )
D
Q
TAR(z,AQ,h ) =
DQ
DQ
39
IAEA Radiation Oncology Physics: A Handbook for Teachers and Students - 6.8.1 Slide 4 (77/170)
6.8 CENTRAL AXIS DEPTH DOSES IN WATER: SAD SETUP6.8.1 Tissue-air ratio
Zero area field is a hypothetical radiation field in which thedose at depth z in phantom is entirely due to primaryphotons, since the volume that can scatter radiation is zero.
Zero area TAR(z,AQ, )
is given by a simple
exponential function:
For cobalt-60 beam:
•
•
h
TAR(z,0,h ) = eμ
eff(z z
max)
μ = 1eff (Co) 0.0657 cm
TAR(10,0,Co) = 0.536
IAEA Radiation Oncology Physics: A Handbook for Teachers and Students - 6.8.1 Slide 5 (78/170)
6.8 CENTRAL AXIS DEPTH DOSES IN WATER: SAD SETUP6.8.1 Tissue-air ratio
The concept of “dose to small mass of medium” is notrecommended for beam energies above cobalt-60.
Consequently, the concept of TAR is not used for beamenergies above cobalt-60 gamma rays.
TARs are most reliably measured with ionizationchambers; however, the measurements are much morecumbersome than those of PDD, because in TARmeasurement the source-chamber distance must bekept constant.
40
IAEA Radiation Oncology Physics: A Handbook for Teachers and Students - 6.8.1 Slide 6 (79/170)
6.8 CENTRAL AXIS DEPTH DOSES IN WATER: SAD SETUP6.8.1 Tissue-air ratio
For a constant AQ and , the TAR decreases with anincreasing z beyond zmax.
h
IAEA Radiation Oncology Physics: A Handbook for Teachers and Students - 6.8.1 Slide 7 (80/170)
6.8 CENTRAL AXIS DEPTH DOSES IN WATER: SAD SETUP6.8.1 Tissue-air ratio
For a constant z and , the TAR increases with anincreasing field size AQ .
h
41
IAEA Radiation Oncology Physics: A Handbook for Teachers and Students - 6.8.1 Slide 8 (81/170)
6.8 CENTRAL AXIS DEPTH DOSES IN WATER: SAD SETUP6.8.1 Tissue-air ratio
For a constant z and AQ, the tissue-air ratio TAR(z,AQ, )
• Increases with increasing energy at relatively large depths z.
• Decreases with increasing energy at small depths z.
h
h
IAEA Radiation Oncology Physics: A Handbook for Teachers and Students - 6.8.2 Slide 1 (82/170)
6.8 CENTRAL AXIS DEPTH DOSES IN WATER: SAD SETUP6.8.2 Relationship between TAR and PDD
Basic definitions:
•
•
PDD(z,A,f ,h ) = 100D
Q
DP
TAR(z,AQ,h ) =
DQ
DP
D
Q= D
P
PDD(z,A,f ,h )
100= D
Q TAR(z,A
Q,h )
2
P P Q
max
PSF( , ) PSF( , )f z
D D A h D A hf z
+= =
+
2
Q
max
PDD( , , , )TAR( , , ) PSF( , )
100
z A f h f zz A h A h
f z
+=
+
42
IAEA Radiation Oncology Physics: A Handbook for Teachers and Students - 6.8.2 Slide 2 (83/170)
6.8 CENTRAL AXIS DEPTH DOSES IN WATER: SAD SETUP6.8.2 Relationship between TAR and PDD
Special case at z = zmax
gives PDD(zmax,A,f, ) = 100
2
Q
max
PDD( , , , )TAR( , , ) PSF( , )
100
z A f h f zz A h A h
f z
+=
+
TAR(zmax
,AP,h ) PSF(A,h )
h
IAEA Radiation Oncology Physics: A Handbook for Teachers and Students - 6.8.2 Slide 3 (84/170)
6.8 CENTRAL AXIS DEPTH DOSES IN WATER: SAD SETUP6.8.2 Relationship between TAR and PDD
• Since the TAR does not depend on SSD, a single TAR tablefor a given photon beam energy may be used to cover allpossible SSDs used clinically.
• Alternatively, PDDs for any arbitrary combination of z, A and f= SSD may be calculated from a single TAR table.
2
Q
max
PDD( , , , )TAR( , , ) PSF( , )
100
z A f h f zz A h A h
f z
+=
+
43
IAEA Radiation Oncology Physics: A Handbook for Teachers and Students - 6.8.2 Slide 4 (85/170)
6.8 CENTRAL AXIS DEPTH DOSES IN WATER: SAD SETUP6.8.2 Relationship between TAR and PDD
TAR versus PDD relationship:
PDD versus TAR relationship:
2
Q
max
PDD( , , , )TAR( , , ) PSF( , )
100
z A f h f zz A h A h
f z
+=
+
2
Q maxTAR( , , )
PDD( , , , ) 100PSF( , )
z A h f zz A f h
A h f z
+=
+
IAEA Radiation Oncology Physics: A Handbook for Teachers and Students - 6.8.2 Slide 5 (86/170)
6.8 CENTRAL AXIS DEPTH DOSES IN WATER: SAD SETUP6.8.2 Relationship between TAR and PDD
PDDs at two different SSDs (SSD1 = f1 and SSD2 = f2):
Identical field size A at the two SSDs (on phantom surface):
1
2
1
2
2
1 max
Q 1
2 maxQ
2
PDD( , , , )
PDD( , , , )
TAR( , , )
TAR( , , )
z A f h
z A f h
f z
z A h f z
f zz A h
f z
=
+
+=
+
+
Mayneord factor
44
IAEA Radiation Oncology Physics: A Handbook for Teachers and Students - 6.8.2 Slide 6 (87/170)
6.8 CENTRAL AXIS DEPTH DOSES IN WATER: SAD SETUP6.8.2 Relationship between TAR and PDD
PDDs at two different SSDs (SSD1 = f1 and SSD2 = f2):
Identical field size AQ at depth z in the phantom:
1
2
2
1 max
2 1
2 max1
2
PDD( , , , )
PDD( , , , )
PSF( , )
PSF( , )
z A f h
z A f h
f z
A h f z
f zA h
f z
=
+
+=
+
+
Mayneord factor
IAEA Radiation Oncology Physics: A Handbook for Teachers and Students - 6.8.3 Slide 1 (88/170)
6.8 CENTRAL AXIS DEPTH DOSES IN WATER: SAD SETUP6.8.3 Scatter-air ratio SAR
TAR(z,AQ, ) consists of two components:
• Primary component TAR(z,0, ) for zero field size
• Scatter component referred to as scatter-air ratio SAR(z,AQ, )
The SAR gives the scattercontribution to the dose at pointQ in a water phantom per 1 cGyof dose to a small mass of waterat point Q in air.
h
h
h
SAR(z,A
Q,h ) = TAR(z,A
Q,h ) TAR(z,0,h )
45
IAEA Radiation Oncology Physics: A Handbook for Teachers and Students - 6.8.4 Slide 1 (89/170)
6.8 CENTRAL AXIS DEPTH DOSES IN WATER: SAD SETUP6.8.4 Relationship between SAR and scatter function S
Using the relationships:
we obtain the following relationship between SAR and S
=Q QSAR( , , ) TAR( , , ) TAR( ,0, )z A h z A h z h
IAEA Radiation Oncology Physics: A Handbook for Teachers and Students - 6.8.5 Slide 1 (90/170)
6.8 CENTRAL AXIS DEPTH DOSES IN WATER: SAD SETUP6.8.5 Tissue-phantom ratio TPR and Tissue-maximum ratio TMR
For isocentric setups with megavoltage photon energiesthe concept of tissue-phantom ratio TPR was developed.
Similarly to TAR the TPR depends upon z, AQ, and .
TPR is defined as:
• DQ is the dose at
point Q
at depth z
• DQref is the dose
at depth zref.
h
TPR(z,AQ,h ) =
DQ
DQ
ref
46
IAEA Radiation Oncology Physics: A Handbook for Teachers and Students - 6.8.5 Slide 2 (91/170)
6.8 CENTRAL AXIS DEPTH DOSES IN WATER: SAD SETUP6.8.5 Tissue-phantom ratio TPR and Tissue-maximum ratio TMR
Tissue-maximum ratio TMR is a special TPR for zref = zmax.
TMR is defined as:
• DQ is the dose
at point Q
at depth z
• DQmax is
the dose
at depth zmax.
TMR(z,AQ,h ) =
DQ
DQ
max
IAEA Radiation Oncology Physics: A Handbook for Teachers and Students - 6.8.5 Slide 3 (92/170)
6.8 CENTRAL AXIS DEPTH DOSES IN WATER: SAD SETUP6.8.5 Tissue-phantom ratio TPR and Tissue-maximum ratio TMR
Just like the TAR, the TPR and TMR depend on threeparameters: z, AQ, and but do not depend on the SADor SSD.
• The range of TMR is from 0 for to 1 for z = zmax.
• For constant AQ and the TMR decreases with increasing z.
• For constant z and the TMR increases with increasing AQ.
• For constant z and AQ the TMR increases with increasing
z
h
h
h
h .
47
IAEA Radiation Oncology Physics: A Handbook for Teachers and Students - 6.8.6 Slide 1 (93/170)
6.8 CENTRAL AXIS DEPTH DOSES IN WATER: SAD SETUP6.8.6 Relationship between TMR and PDD
A simple relationship between TMR(z,AQ, ) andcorresponding PDD(z,A,f, ) can be derived from thebasic definitions of the two functions:
h
h
PDD(z,A,f ,h ) = 100D
Q
DP
TMR(z,AQ,h ) =
DQ
DQ
max
IAEA Radiation Oncology Physics: A Handbook for Teachers and Students - 6.8.6 Slide 2 (94/170)
6.8 CENTRAL AXIS DEPTH DOSES IN WATER: SAD SETUP6.8.6 Relationship between TMR and PDD
2
P P Q
max
PSF( , ) PSF( , )f z
D D A h D A hf z
+= =
+
D
Qmax
= DQ
PSF(AQ,h )
2
Q
Q max
PDD( , , , ) PSF( , )TMR( , , )
100 PSF( , )
z A f h A h f zz A h
A h f z
+=
+
D
Q= D
P
PDD(z,A,f ,h )
100= D
Qmax
TMR(z,AQ,h )
48
IAEA Radiation Oncology Physics: A Handbook for Teachers and Students - 6.8.6 Slide 3 (95/170)
6.8 CENTRAL AXIS DEPTH DOSES IN WATER: SAD SETUP6.8.6 Relationship between TMR and PDD
General relationship between TMR and PDD
In the first approximation, ignoring the PSF ratio, we geta simpler and practical relationship between TMR andPDD:
2
Q
Q max
PDD( , , , ) PSF( , )TMR( , , )
100 PSF( , )
z A f h A h f zz A h
A h f z
+=
+
2
Q
max
PDD( , , , )TMR( , , )
100
z A f h f zz A h
f z
+
+
IAEA Radiation Oncology Physics: A Handbook for Teachers and Students - 6.8.7 Slide 1 (96/170)
6.8 CENTRAL AXIS DEPTH DOSES IN WATER: SAD SETUP6.8.7 Scatter-maximum ratio SMR
TMR(z,AQ, ) can be separated into the primary compo-nent TMR(z,0, ) and the scatter component called thescatter-maximum ratio SMR(z,AQ, ).
SMR(z,AQ, ) is essentially SAR(z,AQ, ) for photonenergies of cobalt-60 and above.
• where is the effective attenuation coefficient for the mega-voltage photon beam energy.
h
h
h
h h
SMR(z,AQ,h ) = TAR(z,A
Q,h ) TMR(z,0,h ) =
= TMR(z,AQ,h ) PSF(A
Q,h ) e
μeff
(z zmax
)
μeff
49
IAEA Radiation Oncology Physics: A Handbook for Teachers and Students - 6.8.7 Slide 2 (97/170)
6.8 CENTRAL AXIS DEPTH DOSES IN WATER: SAD SETUP6.8.7 Scatter-maximum ratio SMR
PSF(AQ, ) is very difficult to measure but it can beexpressed as:
SMR(z,AQ, ) is then expressed as:
SMR(z,AQ,h ) = TAR(z,A
Q,h ) TMR(z,0,h ) =
= TMR(z,AQ,h ) PSF(A
Q,h ) e
μeff
(z zmax
)
h
PSF(A
Q,h ) =
PSF(AQ,h )
PSF(10,h )
PSF(10,h )
PSF(0,h )=
SF(AQ,h )
SF(0,h )
h
SMR(z,A
Q,h ) = TMR(z,A
Q,h )
SF(AQ,h )
SF(0,h )TMR(z,0,h )
IAEA Radiation Oncology Physics: A Handbook for Teachers and Students - 6.9 Slide 1 (98/170)
6.9 OFF-AXIS RATIOS AND BEAM PROFILES
Dose distributions along the beam central axis are usedin conjunction with off-axis beam profiles to deliver anaccurate dose description inside the patient.
The off-axis data are usually given with beam profilesmeasured perpendicularly to the beam central axis at agiven depth in a phantom.
The depths of measurement are typically at:
• Depths z = zmax and z = 10 cm for verification of machinecompliance with machine specifications.
• Other depths required by particular computerized treatmentplanning system used in the department.
50
IAEA Radiation Oncology Physics: A Handbook for Teachers and Students - 6.9 Slide 2 (99/170)
6.9 OFF-AXIS RATIOS AND BEAM PROFILES
Example of beam profiles measured at various depths inwater for two field sizes (10x10 cm2 and 30x30 cm2) of a10 MV x-ray beam for SSD = 100 cm.
• Doses are normalized
to 100 at zmax on thecentral axis of the beam.
• The central axis profilevalues are scaled bythe appropriate PDDvalue for the two fields.
IAEA Radiation Oncology Physics: A Handbook for Teachers and Students - 6.9 Slide 3 (100/170)
6.9 OFF-AXIS RATIOS AND BEAM PROFILES
Combining a central axis dose distribution with off-axisdata results in a volume dose matrix that provides 2-Dand 3-D information on the dose distribution in thepatient.
The off-axis ratio (OAR) is usually defined as the ratioof dose at an off-axis point to the dose on the centralbeam axis at the same depth in a phantom.
51
IAEA Radiation Oncology Physics: A Handbook for Teachers and Students - 6.9 Slide 4 (101/170)
6.9 OFF-AXIS RATIOS AND BEAM PROFILES
Megavoltage beam profiles consist of three regions:
• Central region represents the central portion of the profileextending from the central axis to within 1 cm to 1.5 cm of thegeometric field edges of the beam.
• Penumbra is the region close to geometric field edges wherethe dose changes rapidly and depends on field definingcollimators, the finite size of the focal spot (source size) andthe lateral electronic disequilibrium.
• Umbra is the region outside of the radiation field, far removedfrom the field edges. The dose in this region is low and resultsfrom radiation transmitted through the collimator and headshielding.
IAEA Radiation Oncology Physics: A Handbook for Teachers and Students - 6.9 Slide 5 (102/170)
6.9 OFF-AXIS RATIOS AND BEAM PROFILES
For each of the three beam profile regions there arespecific requirements to optimize the clinical photon beam:
• The dose profile in the central region should meet flatness andsymmetry specifications.
• The dose profile in the penumbral region should have a rapid falloffwith increasing distance from the central axis (narrow penumbra)to optimize beam sharpness at the target edge.
• The dose profile in the umbral region should be close to zero doseto minimize the dose delivered to tissues outside the targetvolume.
52
IAEA Radiation Oncology Physics: A Handbook for Teachers and Students - 6.9 Slide 6 (103/170)
6.9 OFF-AXIS RATIOS AND BEAM PROFILES
Ideal dose profile:• Central region:
constant dose fromtarget centre to edgeof target.
• Penumbra: zero width.
• Umbra: zero dose.
Actual dose profile:• Central region: profile flat in 80% of central portion of the field.
• Penumbra is typically defined as the distance between 80% and 20%
dose on the beam profile normalized to 100% at the central axis.
• Umbra is typically less than 1% of the dose on the central axis.
IAEA Radiation Oncology Physics: A Handbook for Teachers and Students - 6.9 Slide 7 (104/170)
6.9 OFF-AXIS RATIOS AND BEAM PROFILES
Geometric or nominal field size is:
• Indicated by the optical light field of the treatment machine.
• Usually defined as the separation between the 50% dose levelpoints on the beam profile measured at the depth of dosemaximum zmax.
53
IAEA Radiation Oncology Physics: A Handbook for Teachers and Students - 6.9 Slide 8 (105/170)
6.9 OFF-AXIS RATIOS AND BEAM PROFILES
In the central region, the off-axis points of the beam profile are affected:
• For cobalt-60 beams,
by the inverse square
law dose fall-off and
the increased phantom
thickness as the
off-axis distance
increases.
• For linacs, by the energy
of electrons striking
the target, by the atomic
number of the target,
and the atomic number
and shape of the flattening
filter.
IAEA Radiation Oncology Physics: A Handbook for Teachers and Students - 6.9 Slide 9 (106/170)
6.9 OFF-AXIS RATIOS AND BEAM PROFILES
The total penumbra is referred to as the physical penumbraand consists of three components:
• Geometric penumbraresults from the finitesource size.
• Scatter penumbraresults from in-patientphoton scatteroriginating inthe open field.
• Transmission penumbraresults from beamtransmitted throughthe collimation device.
54
IAEA Radiation Oncology Physics: A Handbook for Teachers and Students - 6.9.1 Slide 1 (107/170)
6.9 OFF-AXIS RATIOS AND BEAM PROFILES6.9.1 Beam flatness
Beam flatness F is assessed by finding the maximumDmax and minimum Dmin dose point values on the beamprofile within the central 80% of the beam width.
Beam flatness F is defined as:
Standard linac specifications require that whenmeasured in a water phantom at a depth z = 10 cm withSSD = 100 cm for the largest field size available (typi-cally 40x40 cm2).
F = 100D
maxD
min
Dmax
+ Dmin
F 3%
IAEA Radiation Oncology Physics: A Handbook for Teachers and Students - 6.9.1 Slide 2 (108/170)
6.9 OFF-AXIS RATIOS AND BEAM PROFILES6.9.1 Beam flatness
Compliance with the flatness specifications at a depthz = 10 cm in water results in:
• Over-flattening at zmax, manifesting itself in the form of horns inthe profile.
• Under-flattening at depths exceeding z = 10 cm. This under-flattening becomes progressively worse as the depth zincreases beyond z = 10 cm.
Over-flattening and under-flattening of beam profiles iscaused by the lower beam effective energies in off-axisdirections compared with the central axis direction.
55
IAEA Radiation Oncology Physics: A Handbook for Teachers and Students - 6.9.1 Slide 3 (109/170)
6.9 OFF-AXIS RATIOS AND BEAM PROFILES6.9.1 Beam flatness
Typical profiles measured in water with a 40x40 cm2
field at SSD = 100 cm. The data for depths z = 10 cmand z = zmax are used for verification of compliance withstandard machine specifications.
F = 100D
maxD
min
Dmax
+ Dmin
IAEA Radiation Oncology Physics: A Handbook for Teachers and Students - 6.9.2 Slide 1 (110/170)
6.9 OFF-AXIS RATIOS AND BEAM PROFILES6.9.2 Beam symmetry
Beam symmetry S is usually determined at zmax to
achieve maximum sensitivity.
Typical symmetry specifications for a 40x40 cm2 field:
• Any two dose points on a beam profile, equidistant from thecentral axis point, should be within 2% of each other.
• Areas under the zmax beam profile on each side (left andright) of the central axis extending to the 50% dose level(normalized to 100% at the central axis point) aredetermined.
56
IAEA Radiation Oncology Physics: A Handbook for Teachers and Students - 6.9.2 Slide 2 (111/170)
6.9 OFF-AXIS RATIOS AND BEAM PROFILES6.9.2 Beam symmetry
S is calculated from
and should be less than 2%.
Practical options for determination of areas under theprofile curve with a hard copy of the profile are:• Using a planimeter
or
• Counting squares on graph paper.
= 100area
leftarea
right
arealeft
+ arearight
S
IAEA Radiation Oncology Physics: A Handbook for Teachers and Students - 6.9.2 Slide 3 (112/170)
6.9 OFF-AXIS RATIOS AND BEAM PROFILES6.9.2 Beam symmetry
The areas under thezmax profile can often
be determined using
an automatic softwareoption on the water
tank scanning device(3-D isodose plotter).
= 100area
leftarea
right
arealeft
+ arearight
S
57
IAEA Radiation Oncology Physics: A Handbook for Teachers and Students - 6.10 Slide 1 (113/170)
6.10 ISODOSE DISTRIBUTIONS IN WATER PHANTOMS
Physical characteristics of radiation beams are usuallymeasured in phantoms under standard conditions:
• Homogeneous, unit density phantom
• Flat phantom surface
• Perpendicular beam incidence
Central axis depth dose data in conjunction with doseprofiles contain complete 2-D and 3-D information aboutthe radiation beam.
IAEA Radiation Oncology Physics: A Handbook for Teachers and Students - 6.10 Slide 2 (114/170)
6.10 ISODOSE DISTRIBUTIONS IN WATER PHANTOMS
Planar and volumetric dose distributions are usuallydisplayed with isodose curves and isodose surfaces,which connect points of equal dose in a volume ofinterest.
The isodose curves and surfaces are usually drawn atregular intervals of absorbed dose and are expressedas a percentage of the dose at a specific referencepoint.
58
IAEA Radiation Oncology Physics: A Handbook for Teachers and Students - 6.10 Slide 3 (115/170)
6.10 ISODOSE DISTRIBUTIONS IN WATER PHANTOMS
An isodose chart for a given single beam consists of afamily of isodose curves usually drawn at regularincrements of PDD.
Two normalization conventions are in use:
• For SSD set-ups, all isodose values are normalized to 100% atpoint P on the central beam axis (point of dose maximum).
• For SAD set-ups, the isodose values are normalized to 100%at the isocentre.
Isodose charts for SSD set-up are thus plots of PDDvalues; isodose charts for SAD set-up are plots ofeither TAR or TMR values.
IAEA Radiation Oncology Physics: A Handbook for Teachers and Students - 6.10 Slide 4 (116/170)
6.10 ISODOSE DISTRIBUTIONS IN WATER PHANTOMS
For SSD set-ups, all isodosevalues are normalized to 100%at point P on the central beamaxis (point of dose maximumat depth zmax).
59
IAEA Radiation Oncology Physics: A Handbook for Teachers and Students - 6.10 Slide 5 (117/170)
6.10 ISODOSE DISTRIBUTIONS IN WATER PHANTOMS
For SAD set-ups, the isodosevalues are normalized to 100%at the isocentre.
IAEA Radiation Oncology Physics: A Handbook for Teachers and Students - 6.10 Slide 6 (118/170)
6.10 ISODOSE DISTRIBUTIONS IN WATER PHANTOMS
Parameters that affect the single beam isodose
distribution are:
• Beam quality
• Source size
• Beam collimation
• Field size
• Source-skin distance
• Source-collimator distance
60
IAEA Radiation Oncology Physics: A Handbook for Teachers and Students - 6.10 Slide 7 (119/170)
6.10 ISODOSE DISTRIBUTIONS IN WATER PHANTOMS
Treatment with single photon beams is seldom used
except for superficial tumours treated with superficial
or orthovoltage x rays.
Deep-seated tumours are usually treated with a
combination of two or more megavoltage photon
beams.
IAEA Radiation Oncology Physics: A Handbook for Teachers and Students - 6.10 Slide 8 (120/170)
6.10 ISODOSE DISTRIBUTIONS IN WATER PHANTOMS
Isodose distributions for various photon radiation beams:orthovoltage x rays, cobalt-60 gamma rays, 4 MV x rays, 10 MV x rays
61
IAEA Radiation Oncology Physics: A Handbook for Teachers and Students - 6.10 Slide 9 (121/170)
6.10 ISODOSE DISTRIBUTIONS IN WATER PHANTOMS
Isodose charts are measured with:
• Ionization chambers
• Solid state detectors such as diodes
• Standard radiographic film
• Radiochromic film
In addition to direct measurements, isodose charts may
also be generated by calculations using various algo-
rithms for treatment planning, most commonly with com-
mercially available treatment planning (TP) systems.
IAEA Radiation Oncology Physics: A Handbook for Teachers and Students - 6.11 Slide 1 (122/170)
6.11 SINGLE FIELD ISODOSE DISTRIBUTIONS IN PATIENTS
Phantom measurements are normally characterized by:
• Flat phantom surface
• Perpendicular beam incidence
• Homogeneous, unit density phantom
62
IAEA Radiation Oncology Physics: A Handbook for Teachers and Students - 6.11 Slide 2 (123/170)
6.11 SINGLE FIELD ISODOSE DISTRIBUTIONS IN PATIENTS
Clinical situations are usually more complex:
• The patient’s surface may be curved or of irregular shape,requiring corrections for contour irregularities.
• The beam may be obliquely incident on patient’s surfacerequiring corrections for oblique beam incidence.
• Some tissues such as lung and bone have densities that differsignificantly from that of water, requiring corrections for tissueheterogeneities (also called inhomogeneities).
IAEA Radiation Oncology Physics: A Handbook for Teachers and Students - 6.11 Slide 3 (124/170)
6.11 SINGLE FIELD ISODOSE DISTRIBUTIONS IN PATIENTS
Isodose distributions in patients are determined by oneof two radically different approaches:
• Correction-based algorithms use depth dose data measured inwater phantoms with a flat surface and normal incidence inconjunction with various methods to correct for irregular patientcontours, oblique beam incidence, and different tissuedensities.
• Model-based algorithms obviate the correction problem bymodeling the dose distributions from first principles andaccounting for all geometrical and physical characteristics ofthe particular patient and treatment.
63
IAEA Radiation Oncology Physics: A Handbook for Teachers and Students - 6.11.1 Slide 1 (125/170)
6.11 SINGLE FIELD ISODOSE DISTRIBUTIONS IN PATIENTS
6.11.1 Corrections for irregular contours and beam obliquity
Radiation beam striking an irregular or sloping patientsurface produces an isodose distribution that differsfrom the standard distributions obtained with normalbeam incidence on a flat phantom surface.
Two approaches are used to deal with this problem:
• The flat phantom / normal incidence isodose distribution is cor-rected numerically to obtain the actual dose distribution in thepatient.
• To achieve flat phantom / normal incidence distributions in apatient the physical effect can be compensated for through theuse of wedges, bolus materials or special compensators.
IAEA Radiation Oncology Physics: A Handbook for Teachers and Students - 6.11.1 Slide 2 (126/170)
6.11 SINGLE FIELD ISODOSE DISTRIBUTIONS IN PATIENTS
6.11.1 Corrections for irregular contours and beam obliquity
Methods for correcting the standard flat surface / normalincidence isodose distributions for contour irregularitiesand oblique beam incidence are:
• Effective SSD method
• TAR or TMR method
• Isodose shift method
These methods are applicable for:
• Megavoltage x rays with angles of incidence up to 45o.
• Orthovoltage beams with angles of incidence up to 30o.
64
IAEA Radiation Oncology Physics: A Handbook for Teachers and Students - 6.11.1 Slide 3 (127/170)
6.11 SINGLE FIELD ISODOSE DISTRIBUTIONS IN PATIENTS
6.11.1 Corrections for irregular contours and beam obliquity
Effective SSD method
• PDDcorr at point S is normalizedto 100% dose at point P on the beamcentral axis and calculated from:
• is the PDD understandard conditions with the flat surface CC’.
• Parameter h is the thickness of missing tissue, while parameter-h represents the thickness of excess tissue.
2
maxcorr
max
PDD PDD ( , , , ) f z
z A f hf h z
+=
+ +
PDD (z,A,f ,h )
IAEA Radiation Oncology Physics: A Handbook for Teachers and Students - 6.11.1 Slide 4 (128/170)
6.11 SINGLE FIELD ISODOSE DISTRIBUTIONS IN PATIENTS
6.11.1 Corrections for irregular contours and beam obliquity
Effective SSD method fordetermination of dose atarbitrary point S in patient:
• Isodose chart is shifted tothe flat surface level at theCC’ contour.
• The PDD value for point S isread to get PDD’.
• The reading is corrected
by an inverse square
factor.2
maxcorr
max
PDD PDD ( , , , ) f z
z A f hf h z
+=
+ +
65
IAEA Radiation Oncology Physics: A Handbook for Teachers and Students - 6.11.1 Slide 5 (129/170)
6.11 SINGLE FIELD ISODOSE DISTRIBUTIONS IN PATIENTS
6.11.1 Corrections for irregular contours and beam obliquity
TAR method or TMR method
• PDDcorr is given as:
• AQ is the field size at point S at adistance (f + h + z) from the source.
• T stands for either TAR or TMR,and an assumption is made thatTARs and TMRs do not depend on SSD.
• PDD’’ represents the PDD at depth (h + z) for a standard flatphantom with the surface at C”C”.
• Parameter h is missing (positive h) or excessive (negative h)tissue.
= ++
Qcorr
Q
( , , )PDD PDD ( , , , )
( , , )
T z A hz h A f h
T z h A h
IAEA Radiation Oncology Physics: A Handbook for Teachers and Students - 6.11.1 Slide 6 (130/170)
6.11 SINGLE FIELD ISODOSE DISTRIBUTIONS IN PATIENTS
6.11.1 Corrections for irregular contours and beam obliquity
Isodose shift method
The value of the dose at point S
is shifted on a line parallel to the
beam central axis by (h x k).
• Parameter h is the thickness of
missing (+) or excess (-) tissue.
• For missing tissue (h > 0) the
isodose is shifted away from the
source; for excess tissue (h < 0) the
isodose is shifted toward the
source.
• Parameter k depends on beam
energy and is smaller than 1.
Beam quality k
Co-60 to 5 MV 0.7
5 MV to 15 MV 0.6
15 MV to 30 MV 0.5
66
IAEA Radiation Oncology Physics: A Handbook for Teachers and Students - 6.11.2 Slide 1 (131/170)
6.11 SINGLE FIELD ISODOSE DISTRIBUTIONS IN PATIENTS
6.11.2 Missing tissue compensation
Wedge filters are used to even out the isodose surfacesfor photon beams striking relatively flat patient surfacesunder an oblique beam incidence.
Two types of wedge filter are in use:
• Physical wedge is made of lead, brass, or steel. When placed ina radiation beam, the wedge causes a progressive decrease inthe intensity across the beam and a tilt of isodose curves undernormal beam incidence.
• Dynamic wedge provides the wedge effect on isodose curvesthrough a closing motion of a collimator block during irradiation.
IAEA Radiation Oncology Physics: A Handbook for Teachers and Students - 6.11.2 Slide 2 (132/170)
6.11 SINGLE FIELD ISODOSE DISTRIBUTIONS IN PATIENTS
6.11.2 Missing tissue compensation
Two parameters are ofimportance for wedges:
• Wedge transmission factor isdefined as the ratio of doses atzmax in a water phantom on thebeam central axis (point P) withand without the wedge.
• Wedge angle is defined as theangle through which an iso-dose curve at a given depth inwater (usually 10 cm) is tiltedat the central beam axis underthe condition of normal beamincidence.
67
IAEA Radiation Oncology Physics: A Handbook for Teachers and Students - 6.11.2 Slide 3 (133/170)
6.11 SINGLE FIELD ISODOSE DISTRIBUTIONS IN PATIENTS
6.11.2 Missing tissue compensation
Physical wedges are usually available with wedgeangles of 15o, 30o, 45o, and 60o.
Dynamic wedges are available with any arbitrary wedgeangle in the range from 0o to 60o.
Physical wedge filters may alter the x-ray beam quality,causing
• Beam hardening at energies of 6 - 10 MV
• Beam softening at energies above 15 MV.
IAEA Radiation Oncology Physics: A Handbook for Teachers and Students - 6.11.2 Slide 4 (134/170)
6.11 SINGLE FIELD ISODOSE DISTRIBUTIONS IN PATIENTS
6.11.2 Missing tissue compensation
Bolus is tissue equivalent material placed directly ontothe patient’s skin surface:
• To even out irregular patient contour.
• To provide a flat surface for normal beam incidence.
In principle, the use of bolus is straightforward andpractical; however, it suffers a serious drawback: formegavoltage photon beams it results in the loss of theskin sparing effect in the skin covered with the bolus(i.e., skin sparing effect occurs in the bolus rather thanin the patient).
68
IAEA Radiation Oncology Physics: A Handbook for Teachers and Students - 6.11.2 Slide 5 (135/170)
6.11 SINGLE FIELD ISODOSE DISTRIBUTIONS IN PATIENTS
6.11.2 Missing tissue compensation
Compensators are used to produce the same effect asthe bolus yet preserve the skin sparing effect of mega-voltage photon beams.
Compensator is a custom-made device that mimics theshape of the bolus but is placed in the radiation beamat some 15 cm - 20 cm from the skin surface topreserve the skin sparing properties of the radiationbeam.
IAEA Radiation Oncology Physics: A Handbook for Teachers and Students - 6.11.2 Slide 6 (136/170)
6.11 SINGLE FIELD ISODOSE DISTRIBUTIONS IN PATIENTS
6.11.2 Missing tissue compensation
Typical compensator materials are:
• Lead
• Special low melting point alloys such as cerrobend (Lipowitz’smetal).
• Water equivalent materials such as wax.
Since compensators are placed at some distance fromthe skin surface, their shape must be adjusted for:
• Beam divergence
• Linear attenuation coefficient of the compensator material.
• Reduction in scatter at various depths in patient.
69
IAEA Radiation Oncology Physics: A Handbook for Teachers and Students - 6.11.3 Slide 1 (137/170)
6.11 SINGLE FIELD ISODOSE DISTRIBUTIONS IN PATIENTS
6.11.3 Corrections for tissue inhomogeneities
Radiation beams used in patient treatment traversevarious tissues that may differ from water in density andatomic number.
This may result in isodose distributions that differsignificantly from those obtained with water phantoms.
The effects of inhomogeneities (also referred to asheterogeneities) on the dose distributions depend upon:
• Amount, density and atomic number of the inhomogeneity.
• Quality of the radiation beam.
IAEA Radiation Oncology Physics: A Handbook for Teachers and Students - 6.11.3 Slide 2 (138/170)
6.11 SINGLE FIELD ISODOSE DISTRIBUTIONS IN PATIENTS
6.11.3 Corrections for tissue inhomogeneities
The effects of inhomogeneities on dose distributions fallinto two distinct categories:
• Those that increase or decrease the attenuation of the primarybeam and this affects the distribution of the scattered radiation.
• Those that increase or decrease the secondary electron fluence.
Three separate regions are considered with regard toinhomogeneities:
• Region (1): the point of interest is in front of the inhomogeneity.
• Region (2): the point of interest P is inside the inhomogeneity.
• Region (3): Point of interest P is beyond the inhomogeneity.
70
IAEA Radiation Oncology Physics: A Handbook for Teachers and Students - 6.11.3 Slide 3 (139/170)
6.11 SINGLE FIELD ISODOSE DISTRIBUTIONS IN PATIENTS
6.11.3 Corrections for tissue inhomogeneities
Region (1), point P1:
The dose is not affected by theinhomogeneity, since the primary beamis not affected and neither is the scattercomponent.
Region (2), point P2:The dose is mainly affected by changesin the secondary electron fluence and toa lesser extent by changes in theprimary beam attenuation.
Region (3), point P3:
The dose is mainly affected by changesin the primary beam attenuation and lessby changes in scatter.
IAEA Radiation Oncology Physics: A Handbook for Teachers and Students - 6.11.3 Slide 4 (140/170)
6.11 SINGLE FIELD ISODOSE DISTRIBUTIONS IN PATIENTS
6.11.3 Corrections for tissue inhomogeneities
Four empirical methods have been developed for cor-recting the water phantom dose to obtain the dose atpoints P3 in region (3) beyond the inhomogeneity:
• TAR method
• Power law TAR method
• Equivalent TAR method
• Isodose shift method
71
IAEA Radiation Oncology Physics: A Handbook for Teachers and Students - 6.11.3 Slide 5 (141/170)
6.11 SINGLE FIELD ISODOSE DISTRIBUTIONS IN PATIENTS
6.11.3 Corrections for tissue inhomogeneities
At depths beyond healthy lung (density 0.3 g/cm3) thedose in soft tissues will increase.
At depths beyond bone (density 1.6 g/cm3) the dose insoft tissues will decrease.
In comparison with dose measured in a uniform waterphantom, the dose in soft tissue:
• Will increase beyond healthy lung (density 0.3 g/cm3).
• Will decrease beyond bone (density 1.6 g/cm3).
IAEA Radiation Oncology Physics: A Handbook for Teachers and Students - 6.11.3 Slide 6 (142/170)
6.11 SINGLE FIELD ISODOSE DISTRIBUTIONS IN PATIENTS
6.11.3 Corrections for tissue inhomogeneities
Corrections per cm for dose beyond healthy lung are:
4% 3% 2% 1%
for Co-60 4 MV 10 MV 20 MV
Shielding effect of bone depends strongly on beam energy:
• Effect is significant at low x-ray energies because of a strongphotoelectric effect presence
• Effect is essentially negligible in the low megavoltage energy rangewhere Compton effect predominates
• Effect begins to increase with energy at energies above 10 MV as aresult of pair production.
72
IAEA Radiation Oncology Physics: A Handbook for Teachers and Students - 6.11.4 Slide 1 (143/170)
6.11 SINGLE FIELD ISODOSE DISTRIBUTIONS IN PATIENTS
6.11.4 Model based algorithms
Model based algorithms for computation of dose distri-
bution in a patient are divided into three categories:
• Primary dose plus first order Compton scatter method is a
rudimentary method assuming a parallel beam of monoenergetic
photons and ignoring inhomogeneities and all scattering above
the first order.
• Convolution-superposition method accounts for indirect nature of
dose deposition from photon interactions, separating the primary
interactions from the transport of scattered photons and charged
particles produced through primary photon interactions.
• Monte Carlo method uses well established probability distri-
butions governing individual interactions of photons and secon-
dary charged particles and their transport through the patient.
IAEA Radiation Oncology Physics: A Handbook for Teachers and Students - 6.11.4 Slide 2 (144/170)
6.11 SINGLE FIELD ISODOSE DISTRIBUTIONS IN PATIENTS
6.11.4 Model based algorithms
Monte Carlo simulation can be used directly to computephoton dose distributions for a given patient and treat-ment geometry.
The current limitation of direct Monte Carlo calculationsis the time required to calculate the large number ofhistories needed to reduce stochastic or random uncer-tainties to acceptable levels.
73
IAEA Radiation Oncology Physics: A Handbook for Teachers and Students - 6.11.4 Slide 3 (145/170)
6.11 SINGLE FIELD ISODOSE DISTRIBUTIONS IN PATIENTS
6.11.4 Model based algorithms
Advances in computer technology will, within a fewyears, reduce Monte Carlo calculation times toacceptable levels and make Monte Carlo methods thestandard approach to radiotherapy treatment planning.
The electron densities for various tissues of individualpatients are obtained with CT scanners or CTsimulators and form an essential component of anyMonte Carlo based dose distribution calculation.
IAEA Radiation Oncology Physics: A Handbook for Teachers and Students - 6.12 Slide 1 (146/170)
6.12 CLARKSON SEGMENTAL INTEGRATION
The dose functions (PDD, TMR, PSF, etc.) used intreatment planning are generally given for square fieldsand an assumption is made that for all non-squareradiation fields (rectangular, circular, irregular) anequivalent square field can be determined.
Determination of equivalent square field for rectangularand circular fields is simple; however, for irregular fieldsit can be quite difficult.
74
IAEA Radiation Oncology Physics: A Handbook for Teachers and Students - 6.12 Slide 2 (147/170)
6.12 CLARKSON SEGMENTAL INTEGRATION
Clarkson segmental integration is based on circular fielddata and used in determination of equivalent square fieldas well as various dose functions for a given irregular field.
Clarkson method resolvesthe irregular field into sectorsof circular fields centred atthe point of interest Q in thephantom or patient.
• For manual calculations sectorangular width is 10o.
• For computer driven calculationssector angular width is 5o or less.
IAEA Radiation Oncology Physics: A Handbook for Teachers and Students - 6.12 Slide 3 (148/170)
6.12 CLARKSON SEGMENTAL INTEGRATION
An assumption is made that a
sector with a given field
radius contributes 1/N of the
total circular field value to the
value of a given function F for
irregular field at point Q.
N is number of sectors in a
full circular field of 360o.
• N = 36 for manual calculations.
• N = 72 for computer calculations.
75
IAEA Radiation Oncology Physics: A Handbook for Teachers and Students - 6.12 Slide 4 (149/170)
6.12 CLARKSON SEGMENTAL INTEGRATION
The value of a given dosefunction F for an irregularfield that in generaldepends on:
• Depth z of point Q
• Shape of the irregular field
• SSD = f
• Beam energy
is determined from thesegmental integrationexpression:
h
F(z, irregular field, f ,h ) =
1
NF(z,r
i
i=1
N
,f ,h )
IAEA Radiation Oncology Physics: A Handbook for Teachers and Students - 6.12 Slide 5 (150/170)
6.12 CLARKSON SEGMENTAL INTEGRATION
Two sectors are highlighted:
• A simple sector with a simplecontribution to the sum
• A composite sector consisting ofthree components to yield thefollowing contribution to the sum
1
NF(z,r
i,f ,h )
1
NF(z,r
a,f ,h ) F(z,r
b,f ,h ) + F(z,r
c,f ,h )
76
IAEA Radiation Oncology Physics: A Handbook for Teachers and Students - 6.12 Slide 6 (151/170)
Once the value of a dose function for a given irregularfield is determined through the Clarkson integrationmethod, the equivalent square for the given irregularfield can be determined by finding, in tabulated squarefield data, the square field that will give the same valuefor the dose function.
This square field is then defined as the equivalentsquare for the given irregular field.
6.12 CLARKSON SEGMENTAL INTEGRATION
IAEA Radiation Oncology Physics: A Handbook for Teachers and Students - 6.12 Slide 7 (152/170)
The segmental integration technique was originallyproposed by Clarkson in the 1940s and developedfurther by Johns and Cunningham in the 1960s fordetermining the scatter component of the dose at anarbitrary point of interest in the patient, either inside oroutside the direct radiation field.
• Originally, the Clarkson integration method was used with flatradiation beams (orthovoltage and cobalt-60).
• When used with linac beams, the dependence of primarybeam flatness on depth in patient for off axis points must beaccounted for.
6.12 CLARKSON SEGMENTAL INTEGRATION
77
IAEA Radiation Oncology Physics: A Handbook for Teachers and Students - 6.13 Slide 1 (153/170)
6.13 RELATIVE DOSE MEASUREMENTS WITH IONIZATION
CHAMBERS
Dose parameters for radiotherapy treatment are mostcommonly measured with ionization chambers thatcome in many sizes and geometrical shapes.
• Usually each task of dose determination is carried out withionization chambers designed for the specific task at hand.
• In many situations the measured chamber signal must becorrected with correction factors that depend upon influencequantities, such as chamber air temperature and pressure,chamber polarity and applied voltage, and photon beamenergy.
IAEA Radiation Oncology Physics: A Handbook for Teachers and Students - 6.13 Slide 2 (154/170)
6.13 RELATIVE DOSE MEASUREMENTS WITH IONIZATION
CHAMBERS
78
IAEA Radiation Oncology Physics: A Handbook for Teachers and Students - 6.13 Slide 3 (155/170)
6.13 RELATIVE DOSE MEASUREMENTS WITH IONIZATION
CHAMBERS
Doses and doserates at referencepoints in a phantomfor megavoltagephoton beams aremeasured withrelatively large volume(0.6 cm3) cylindricalionization chambers inorder to obtain areasonable signal andgood signal to noiseratio.
IAEA Radiation Oncology Physics: A Handbook for Teachers and Students - 6.13 Slide 4 (156/170)
6.13 RELATIVE DOSE MEASUREMENTS WITH IONIZATION
CHAMBERS
Relative dosedistributions forphoton beamsbeyond zmax areusually measuredwith small volume(0.1 cm3) ionizationchambers in order toobtain good spatialresolution.
79
IAEA Radiation Oncology Physics: A Handbook for Teachers and Students - 6.13 Slide 5 (157/170)
6.13 RELATIVE DOSE MEASUREMENTS WITH IONIZATION
CHAMBERS
Surface doses and doses in the buildup region forphoton beams are usually measured with parallel-plateionization chambers incorporating:
• Thin polarizing electrode window for measuring surface dose.
• Small electrode separation ( 1 mm) for better spatial resolution.
The measured depth dose curves in the buildup regiondepend on the chamber polarity and this dependence iscalled the polarity effect of ionization chambers.
IAEA Radiation Oncology Physics: A Handbook for Teachers and Students - 6.13 Slide 6 (158/170)
6.13 RELATIVE DOSE MEASUREMENTS WITH IONIZATION
CHAMBERS
In the buildup region of megavoltage photon beams,positive parallel-plate chamber polarity produces alarger signal than the negative polarity (polarity effect).
The difference in signalsis most pronounced onthe phantom surface andthen diminishes withdepth until it disappearscompletely at depths ofzmax and beyond.
80
IAEA Radiation Oncology Physics: A Handbook for Teachers and Students - 6.14 Slide 1 (159/170)
6.14 DELIVERY OF DOSE WITH A SINGLE EXTERNAL BEAM
Outputs for x ray machines andradionuclide teletherapy unitsare usually given in centigrayper minute (cGy/min) at zmax ina phantom at a nominal source-surface distance SSD.
Outputs for linacs are usuallygiven in centigray per monitorunit (cGy/MU) at zmax in aphantom at a nominal source-surface distance SSD.
IAEA Radiation Oncology Physics: A Handbook for Teachers and Students - 6.14 Slide 2 (160/170)
6.14 DELIVERY OF DOSE WITH A SINGLE EXTERNAL BEAM
Transmission ionization chambersin linacs are usually adjusted suchthat the beam output (dose rate)corresponds to:
• 1 cGy/MU
• at zmax in phantom (point P)
• for a 10x10 cm2 field
• at SSD = 100 cm.
P max( ,10,100, ) 1 cGy/MUD z h =
81
IAEA Radiation Oncology Physics: A Handbook for Teachers and Students - 6.14 Slide 3 (161/170)
6.14 DELIVERY OF DOSE WITH A SINGLE EXTERNAL BEAM
the dose rate
at point P for an SSD of 100 cm
for an arbitrary field size A is
obtained by multiplying
with the relative dose factor
P max( , ,100, ),D z A h
P max( ,10,100, ) 1 cGy/MUD z h =
RDF(A,h ) :
DP(z
max,A,100,h ) =
= DP(z
max,10,100,h ) RDF(A,h )
IAEA Radiation Oncology Physics: A Handbook for Teachers and Students - 6.14 Slide 4 (162/170)
6.14 DELIVERY OF DOSE WITH A SINGLE EXTERNAL BEAM
The number of monitor units (in MUs) required todeliver a tumour dose TD at point Q using a single SSDfield, SSD of 100 cm, and field size A is:
Note:
stands for tumour dose rate.
P max
TD TD
TD ( ,10,100, ) RDF( , ) PDD( , , , )D z h A h z A f h=MU =
= = P maxQTD ( ,10, , ) RDF( , ) PDD( , , , )D D z f h A h z A f h
TD
=P max( ,10,100, ) 1 cGy/MUD z h
MU
82
IAEA Radiation Oncology Physics: A Handbook for Teachers and Students - 6.14 Slide 5 (163/170)
6.14 DELIVERY OF DOSE WITH A SINGLE EXTERNAL BEAM
The number of monitor units (in MUs) required todeliver a tumour dose TD at point Q using a single SADfield, SAD of 100 cm, and field size AQ is:
Note:
2
ref
P max SSD Q
TDTD
TD ( ,10,100 , ) RDF( , ) TPR( , , )
f z
f
D z h A h z A h
+
=MU =
MU
+
Qref ref Q SAD
2
refP max SSD
( , ,100 , )
( ,10,100 , ) RDF( , )
D z A h
f zD z h A h
f
IAEA Radiation Oncology Physics: A Handbook for Teachers and Students - 6.14 Slide 6 (164/170)
6.14 DELIVERY OF DOSE WITH A SINGLE EXTERNAL BEAM
DQref
(zref
,AQ,100
SAD,h ) D
P(z
max,10,100
SSD,h ) RDF(A,h )
f + zref
f
2
=
P max( ,10,100, )
1 cGy/MU
D z h
=
=
P max
P max
)
( ,10,100, )
RDF( ,
( , ,100, )D z A h
D z h
A h
=
=
=
maxref
Qref Qmax
For ,
TPR TMR
and
z z
D D
83
IAEA Radiation Oncology Physics: A Handbook for Teachers and Students - 6.15 Slide 1 (165/170)
6.15 EXAMPLE OF DOSE CALCULATION
Given calculate :
General answer
for SSD approach:
=( , , ,Co) (15,15,80,Co)D z A f D (10,20,140,Co)D
IAEA Radiation Oncology Physics: A Handbook for Teachers and Students - 6.15 Slide 2 (166/170)
6.15 EXAMPLE OF DOSE CALCULATION
Given calculate :
General answer
for SAD approach:
=( , , ,Co) (15,15,80,Co)D z A f D (10,20,140,Co)D
2(10,20,140,Co) TAR(10,21.4,Co) CF(11.4,Co) 95
TAR(15,17.8,Co) CF(15,Co) 150(15,15,80,Co)
D
D=
84
IAEA Radiation Oncology Physics: A Handbook for Teachers and Students - 6.16 Slide 1 (167/170)
6.16 SHUTTER CORRECTION TIME
In radiotherapy machines that use an electrical timer formeasuring the dose delivery (radiotherapy x-ray unitsand teletherapy cobalt-60 machines), account must betaken of possible end effects (shutter correction time)resulting from switching the beam on and off.
• In radiotherapy x-ray machines the beam output builds up fromzero to its full value as the generating voltage builds up in thefirst few seconds of the treatment.
• In radionuclide teletherapy machines the source is moved intoposition at the start of treatment and is returned to its safeposition at the end of treatment causing end effects in beamoutput.
IAEA Radiation Oncology Physics: A Handbook for Teachers and Students - 6.16 Slide 2 (168/170)
6.16 SHUTTER CORRECTION TIME
The shutter correction time is defined as the time thatmust be added to, or subtracted from, the calculatedtreatment time Tc to deliver accurately the prescribeddose to the patient.
For a given timer-controlled radiotherapy machine theshutter correction time is typically determined bymeasuring two doses (D1 and Dn) at a given point Q in aphantom.
s
85
IAEA Radiation Oncology Physics: A Handbook for Teachers and Students - 6.16 Slide 3 (169/170)
6.16 SHUTTER CORRECTION TIME
The shutter correction time is typically determined bymeasuring two doses (D1 and Dn) at a given point Q in aphantom:
• D1 is measured with a relatively long exposure time T (of the orderof 5 min), contains one end effect and is governed by:
• Dn is measured cumulatively with n dose segments, each havingan exposure time T/n. The dose Dn thus contains n end effects; thecumulative beam-on time is again equal to T, and Dn is:
s
= + =+
11 s
s
( ) or D
D D T DT
= + =+
nn s
s
( ) or D
D D T n DT n
IAEA Radiation Oncology Physics: A Handbook for Teachers and Students - 6.16 Slide 4 (170/170)
6.16 SHUTTER CORRECTION TIME
Solving the equation for the true dose rate
The shutter correction time is:
• For Dn > D1,
• For Dn = D1,
• For Dn < D1,
Typical shutter correction times are of the order of 1 s.


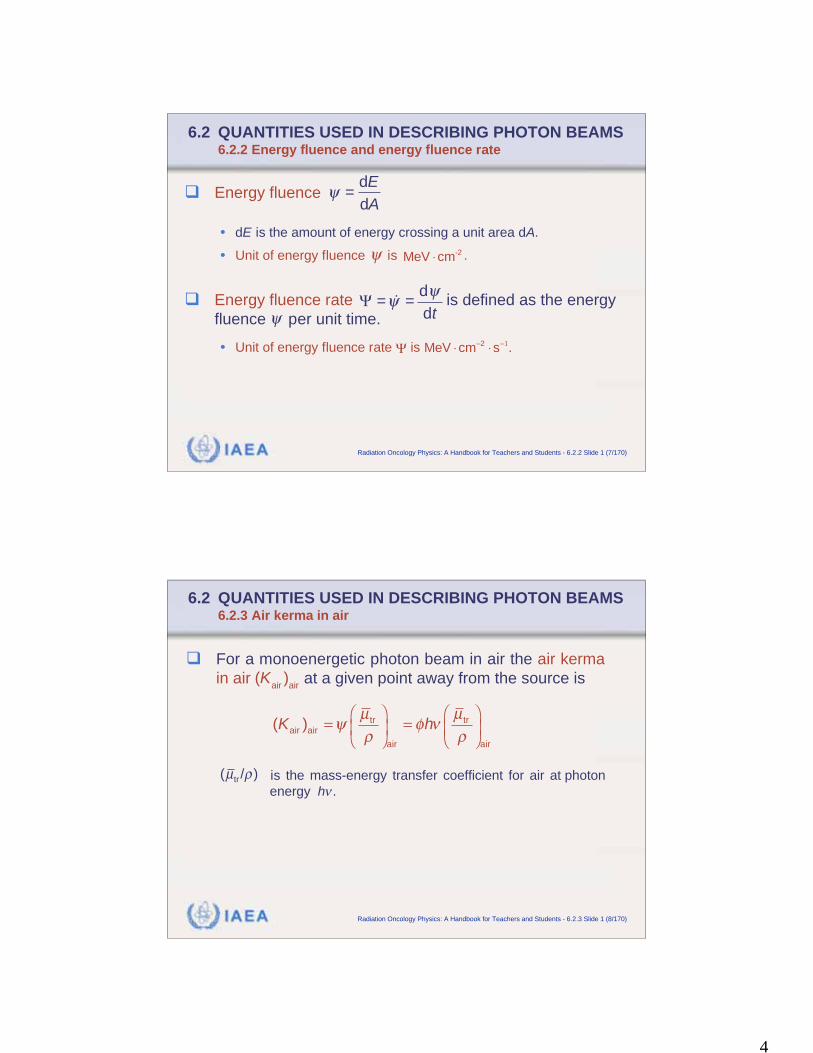


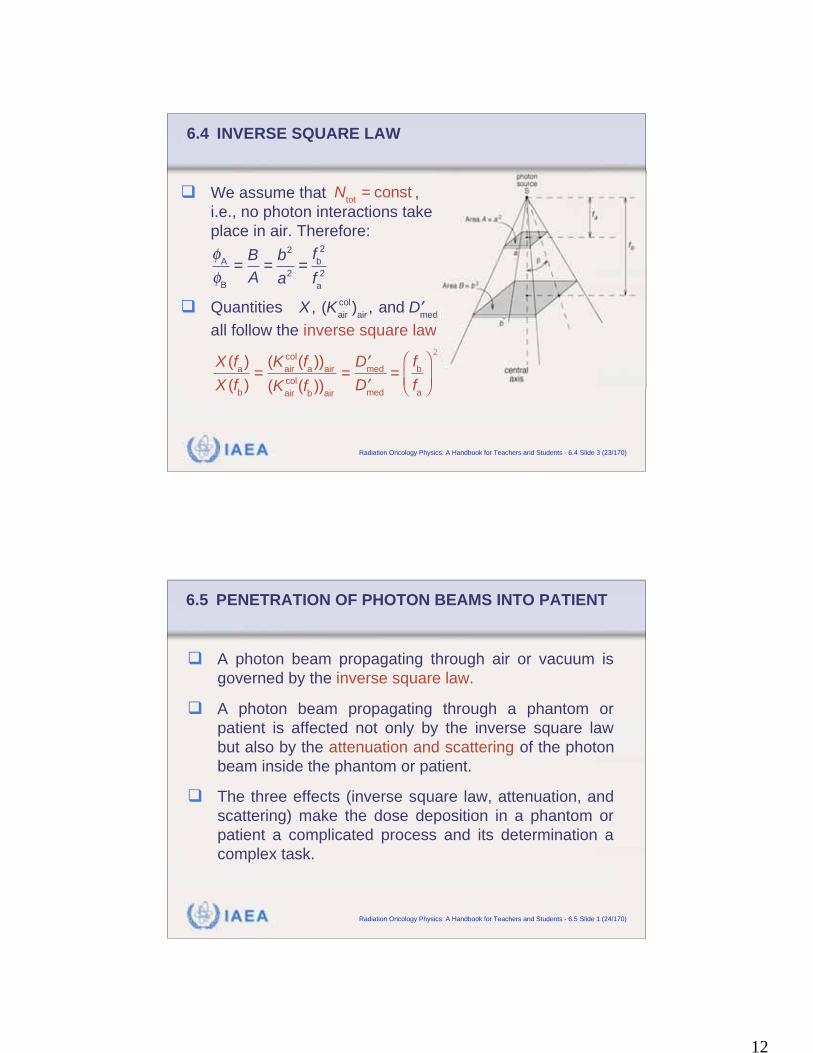


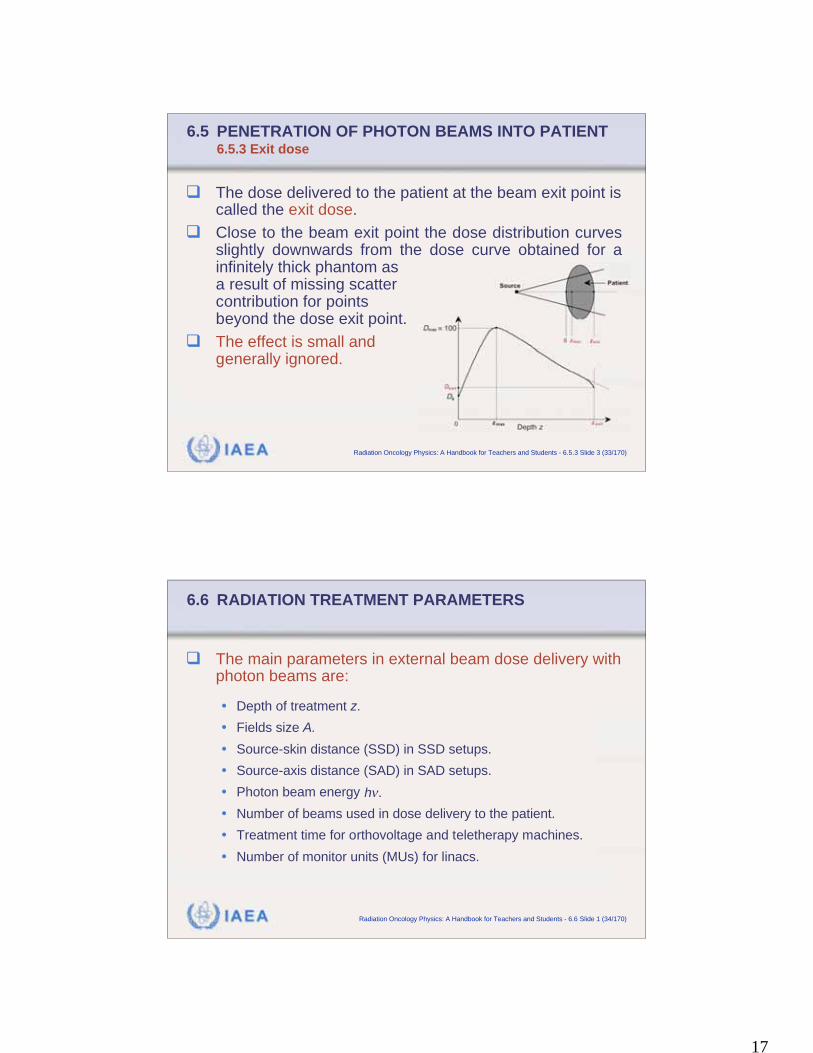

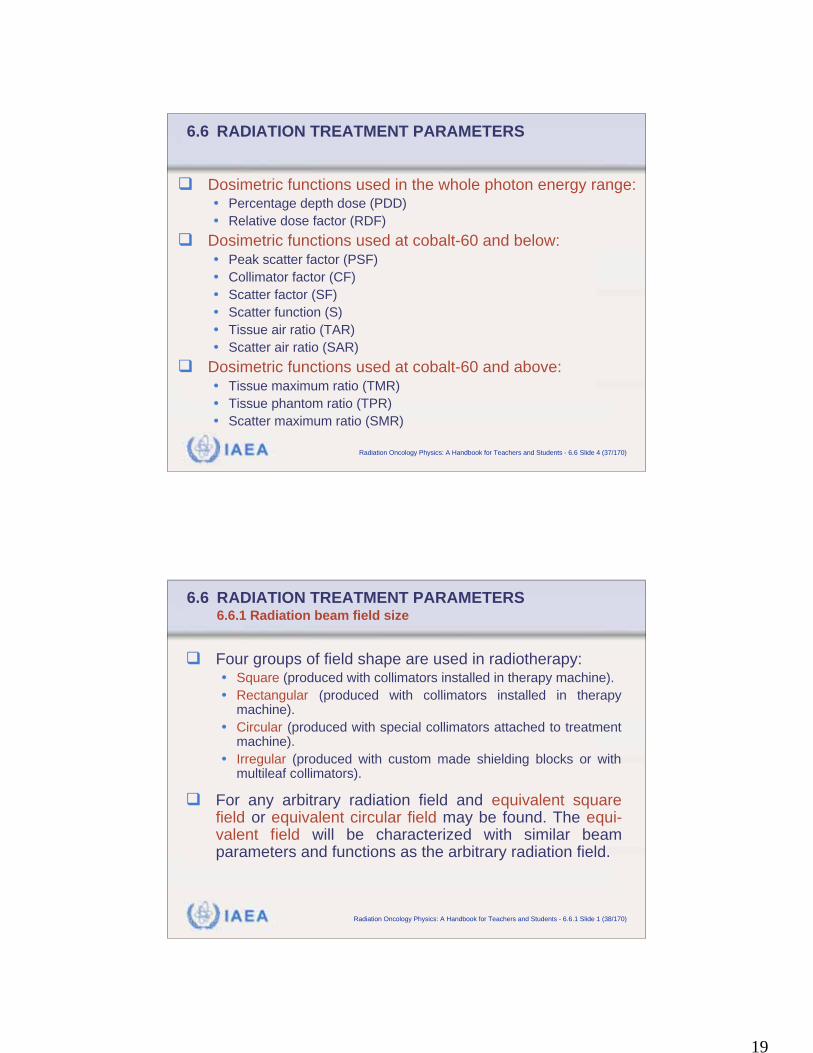


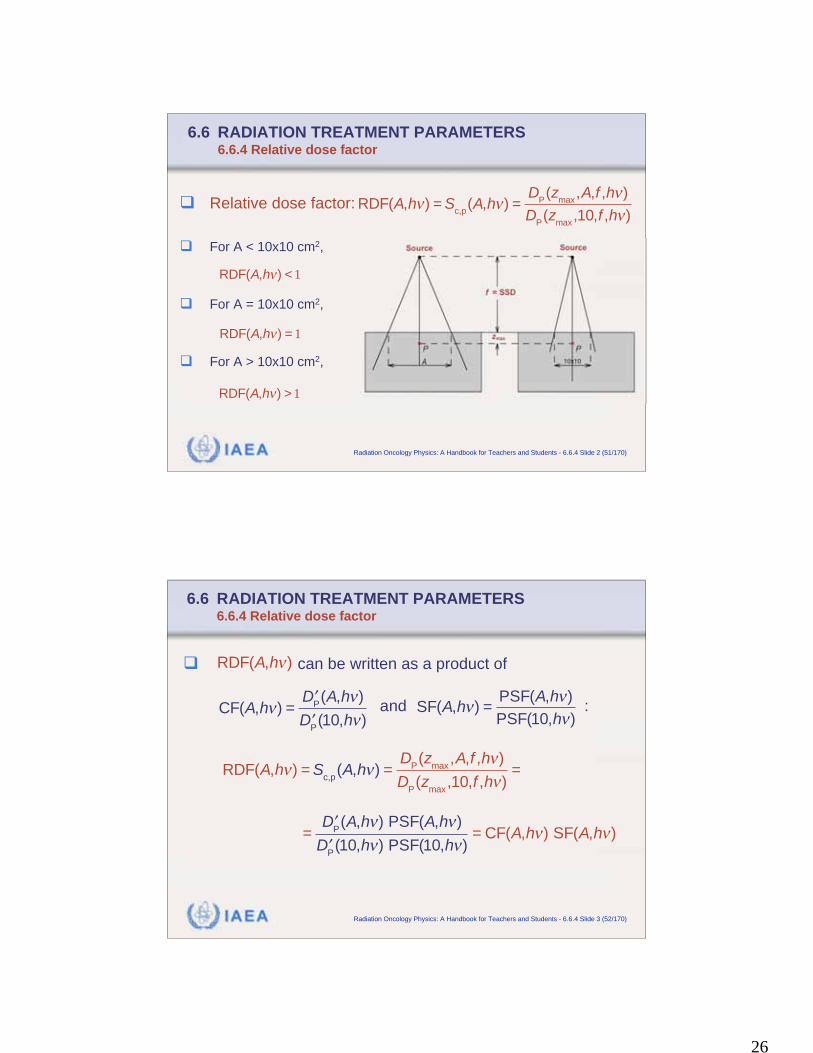


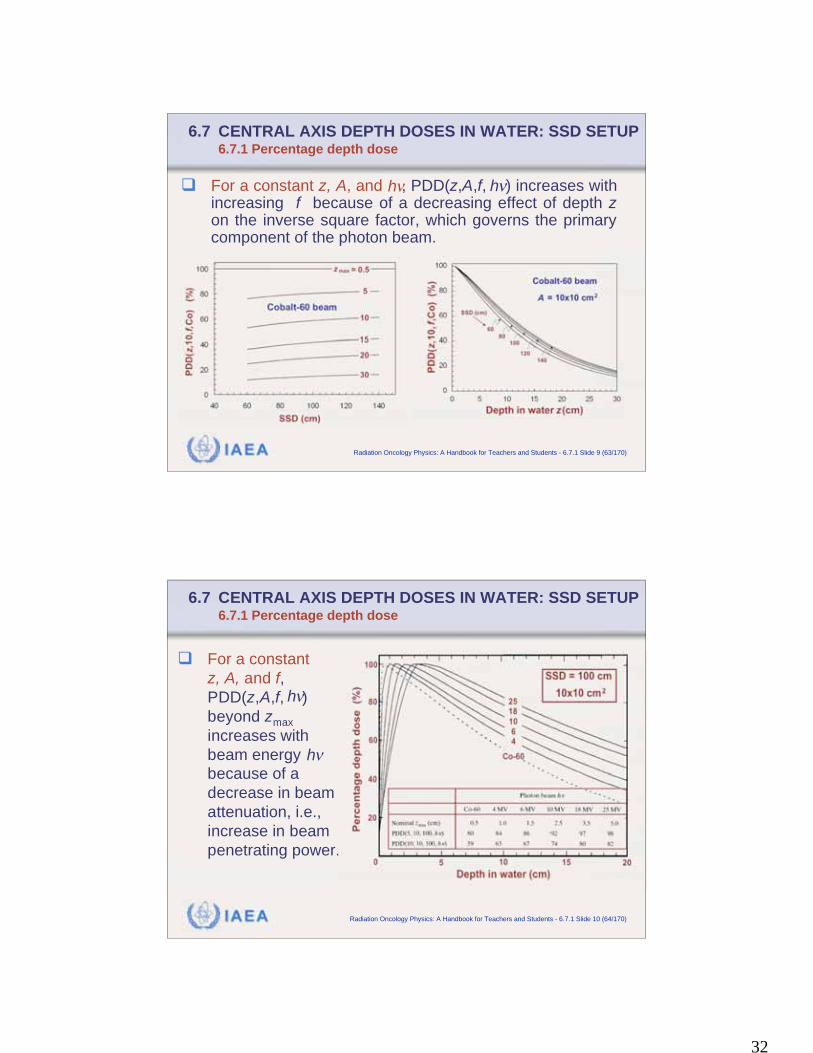


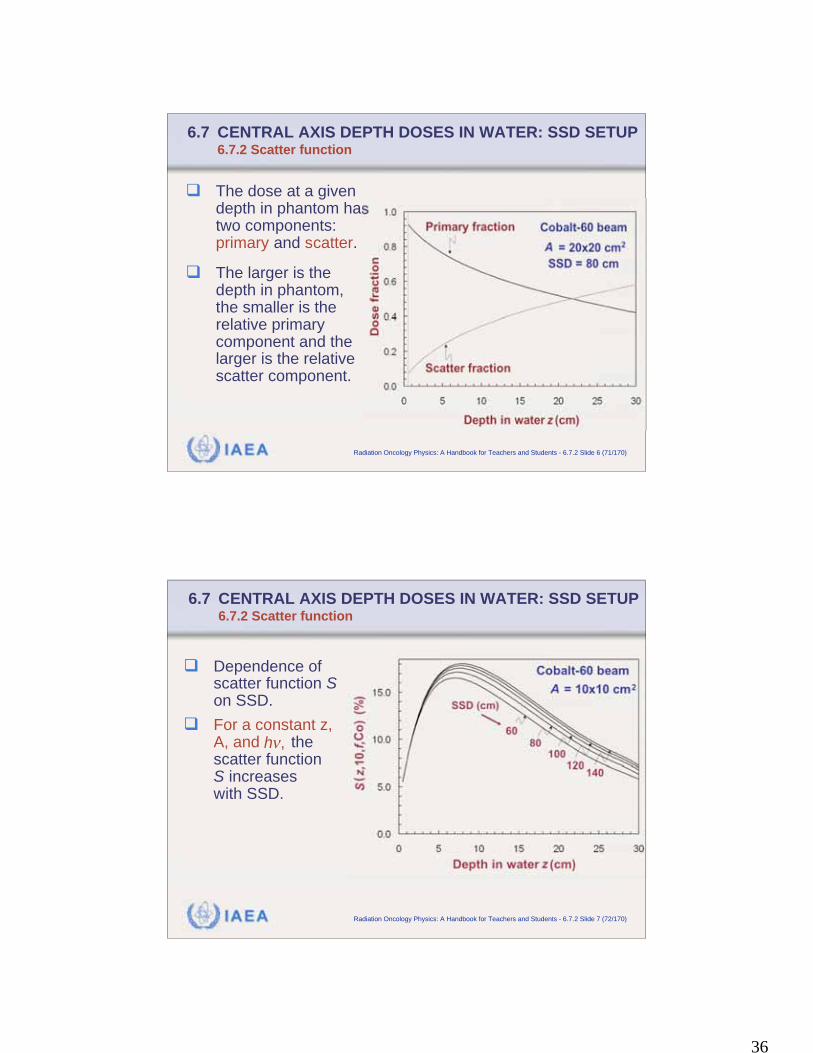


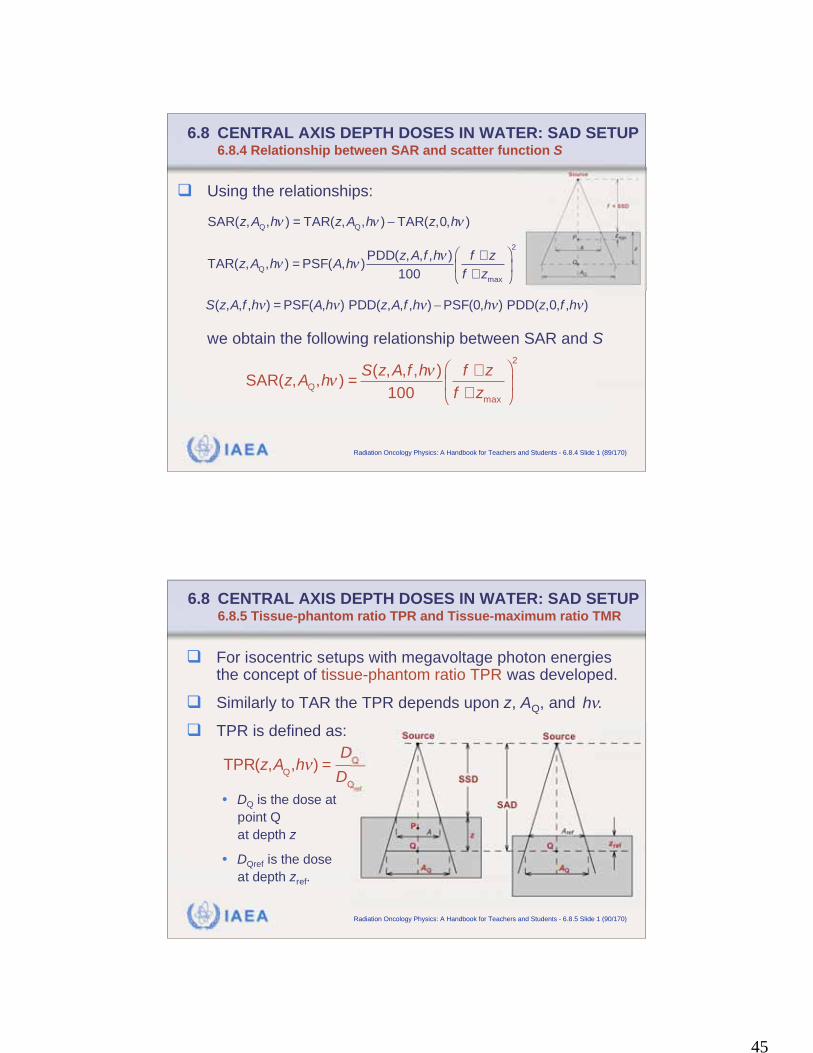


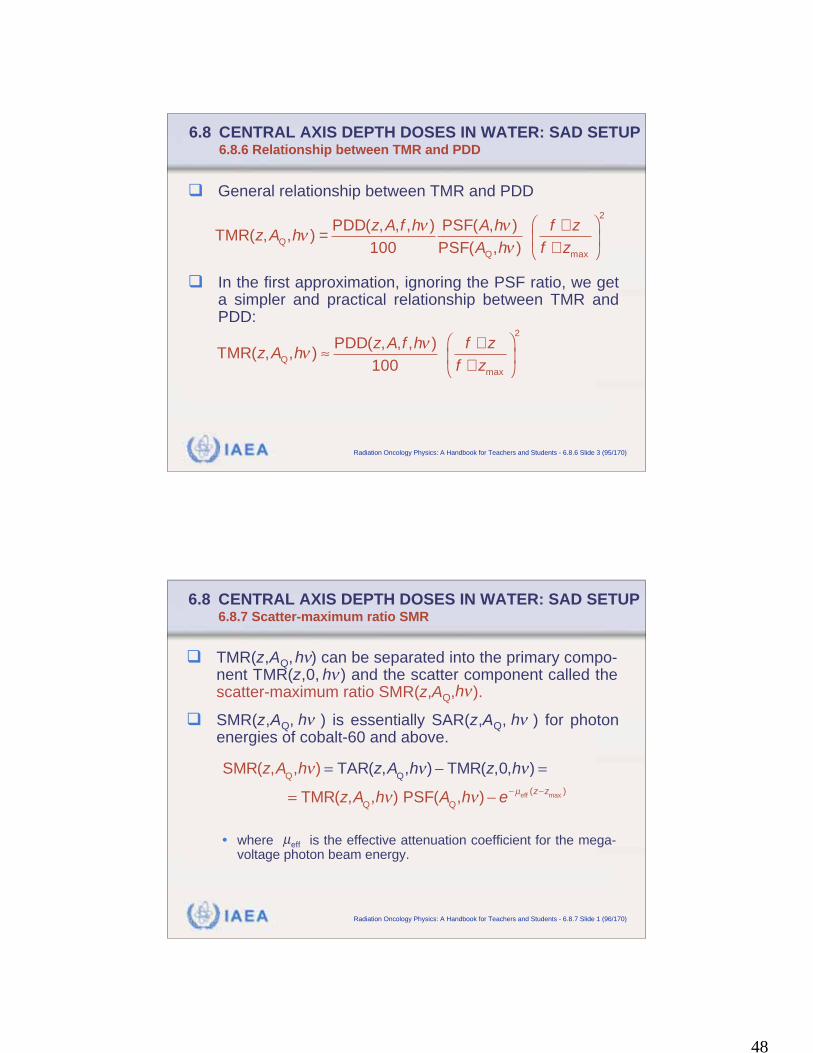


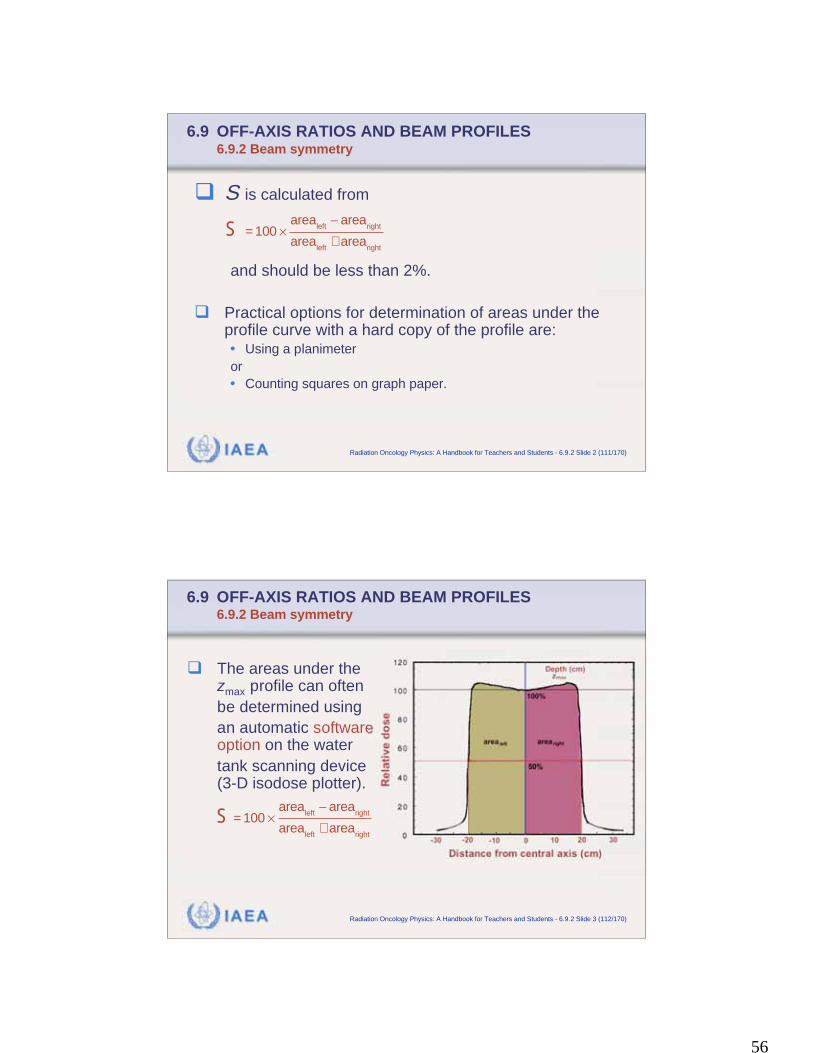

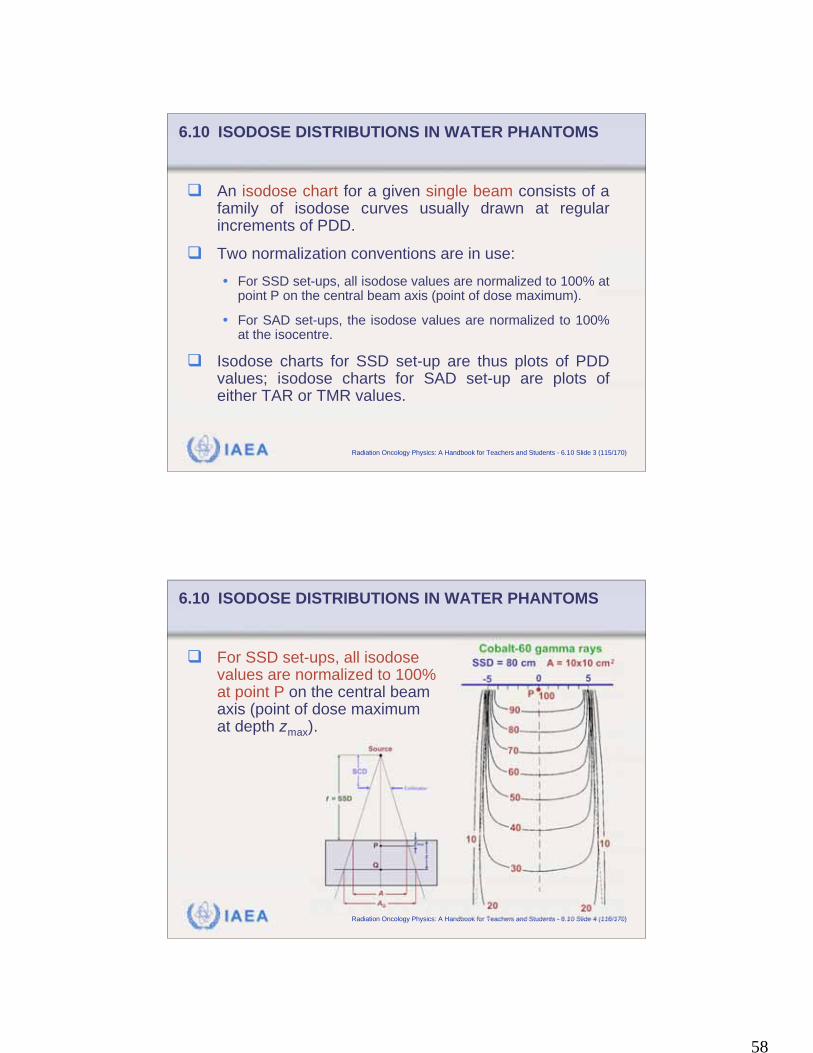


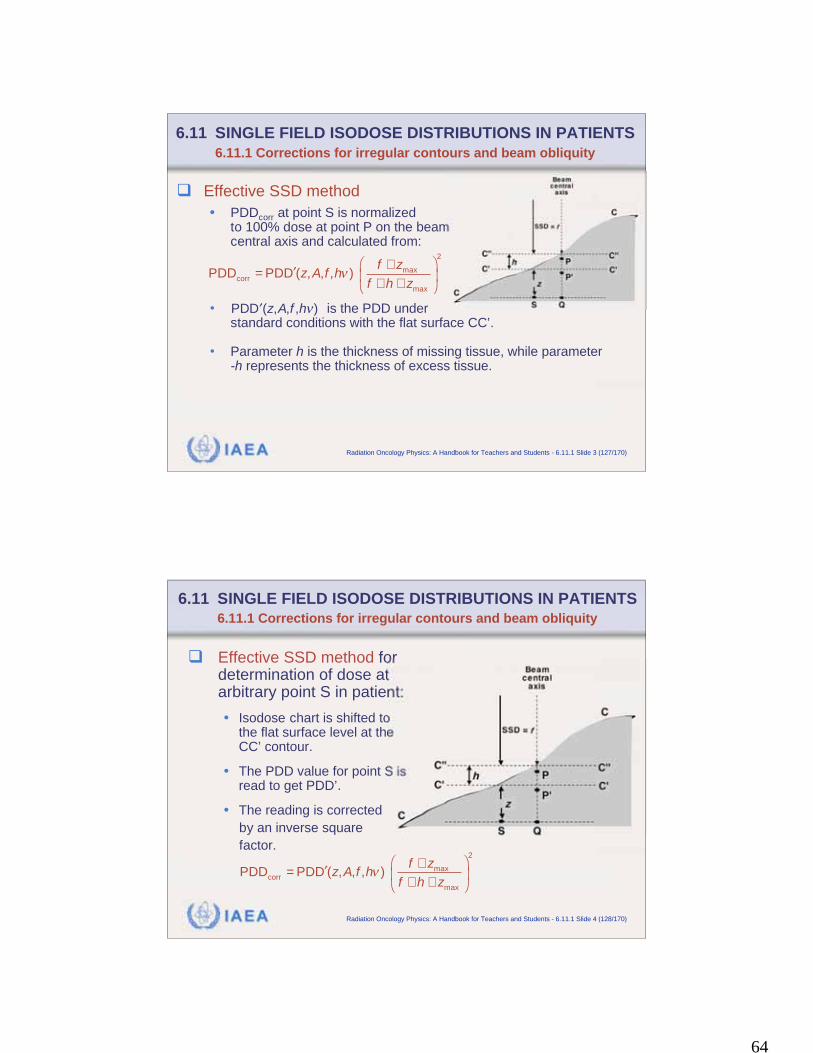
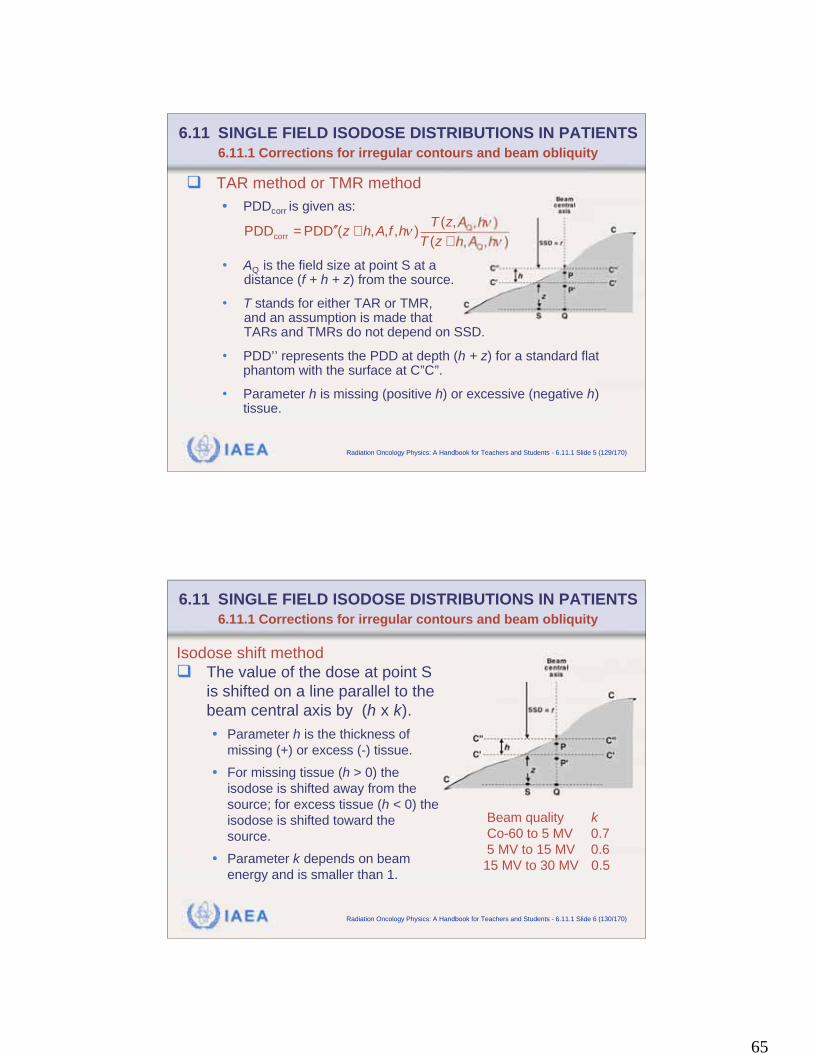


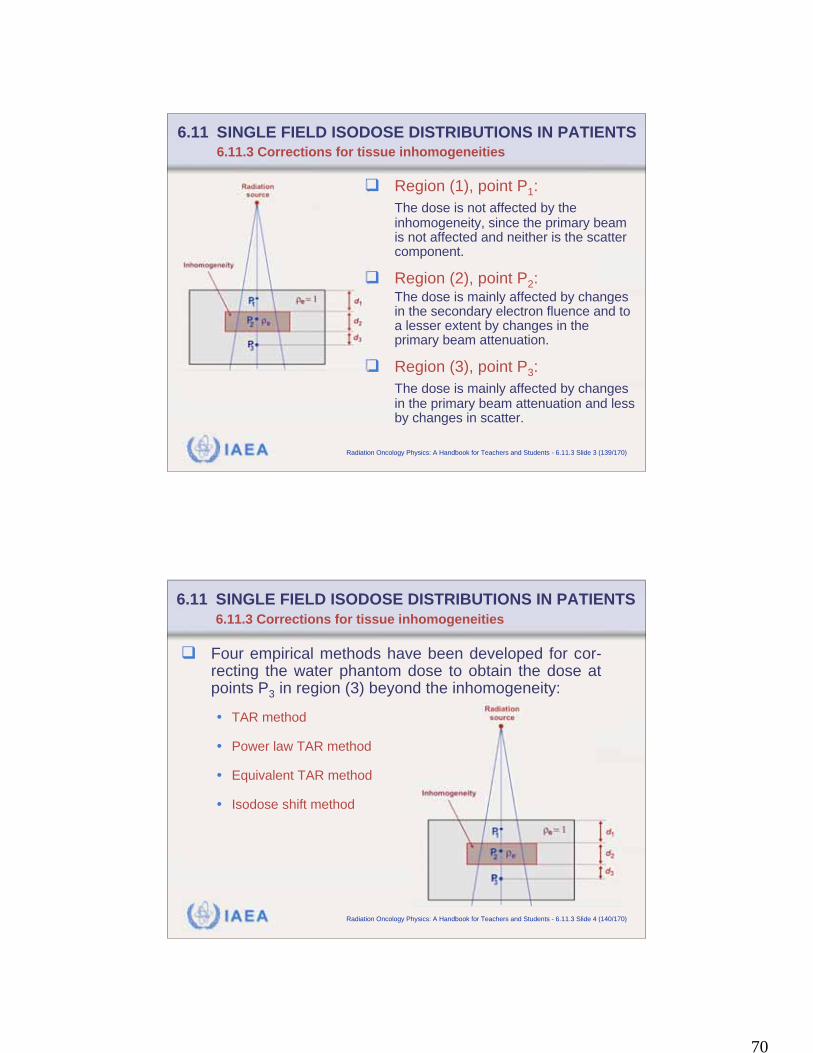


![Observations on mr. [E.B.] Elliott's Horæ Apocalypticæpreteristarchive.com/Books/pdf/1852_strange_answering-elliott.pdfTitle: Observations on mr. [E.B.] Elliott's Horæ Apocalypticæ](https://static.documents.pub/doc/80x56/5e697daec40bd542907694e2/observations-on-mr-eb-elliotts-horf-apocalypticf-title-observations.jpg)


