+ All Categories
Home > Documents > CHAPTER 6 GROUNDWATER HYDROCHEMISTRY AND...

CHAPTER 6 GROUNDWATER HYDROCHEMISTRY AND...

Date post: 01-Jun-2020
Category:
Upload: others
View: 17 times
Download: 0 times
Share this document with a friend
40
69 CHAPTER 6 GROUNDWATER HYDROCHEMISTRY AND HYDROCHEMICAL PROCESSES 6.1 GENERAL Groundwater contains a wide range of dissolved solids and contain small amount of dissolved organic matter and gases. Groundwater, which is always in motion through aquifers and it interacts with the aquifer material in the subsurface environment. During this movement groundwater may dissolve, transport and deposit mineral matter. These changes are mainly based on the surface and subsurface environment. The ionic composition of groundwater is controlled by the chemical composition of rain, composition of infiltrating surface water, properties of soil and rock in which the groundwater moves, contact time and contact surface between groundwater and geological material along its flow path, rate of geochemical (oxidation/reduction ion exchange, dissolution, evaporation, precipitation) process and microbiological process. Generally, the chemical quality of groundwater depends, to a large extent, on the host of rock constituting the aquifers (Eriksson and Khunakassen, 1966). Geologically the Tondiar basin is underlain by rocks of Archean age consisting of granites, gneiss and charnockites. Hydrogeochemical studies of groundwater were carried out to determine the groundwater nature in the Tondiar River Basin, Southern India. Groundwater samples were collected from September 2005 to November 2006, from 45 wells located in the study area. These samples were analysed for concentration of major ions, trace elements and nutrients. In this chapter the interpretation made from the study of major ions are discussed. About
Transcript

69

CHAPTER 6

GROUNDWATER HYDROCHEMISTRY

AND HYDROCHEMICAL PROCESSES

6.1 GENERAL

Groundwater contains a wide range of dissolved solids and contain

small amount of dissolved organic matter and gases. Groundwater, which is

always in motion through aquifers and it interacts with the aquifer material in

the subsurface environment. During this movement groundwater may

dissolve, transport and deposit mineral matter. These changes are mainly

based on the surface and subsurface environment. The ionic composition of

groundwater is controlled by the chemical composition of rain, composition

of infiltrating surface water, properties of soil and rock in which the

groundwater moves, contact time and contact surface between groundwater

and geological material along its flow path, rate of geochemical

(oxidation/reduction ion exchange, dissolution, evaporation, precipitation)

process and microbiological process. Generally, the chemical quality of

groundwater depends, to a large extent, on the host of rock constituting the

aquifers (Eriksson and Khunakassen, 1966). Geologically the Tondiar basin is

underlain by rocks of Archean age consisting of granites, gneiss and

charnockites. Hydrogeochemical studies of groundwater were carried out to

determine the groundwater nature in the Tondiar River Basin, Southern India.

Groundwater samples were collected from September 2005 to November

2006, from 45 wells located in the study area. These samples were analysed

for concentration of major ions, trace elements and nutrients. In this chapter

the interpretation made from the study of major ions are discussed. About

70

four hundred groundwater samples of the study area were collected and

analysed for EC, pH, Ca2+, Mg2+, Na+, K+, HCO3-, CO3

2-, Cl- and SO42-.

6.2 PHYSICAL PARAMETERS OF GROUNDWATER

The most common physical parameters were measured in the field

at the time of sampling are EC, pH, Eh provides useful preliminary

information of the area. The groundwater is generally colourless, odourless

and taste it varies according to locations. The spatial distribution of the

groundwater pH during July 2006 is given in Figure 6.1 and it varies from 6.5

to 8.3, with a mean value of 6.9. pH of water is a very important indication of

its quality, which is controlled by the amount of dissolved Carbondioxide,

carbonates and bicarbonates. Addition of salts to water may cause rapid rise

in pH. The CaCo3 increases the pH of water making it alkaline. Ghandour et

al reported (1985) pH decreases with increasing salinity. The pH values of the

groundwater samples are within permissible limit (BIS, 2003) in this area.

The central part of the study area has relatively high pH. In general the

groundwater is alkaline in nature. The EC of groundwater of the study area

ranges from 625 to 4688 μS/cm, with the mean value of 1958 μS/cm. The

spatial variation of EC (μS/cm) in the months of March 2006 and November

2006 are given in the Figure 6.2 and 6.3. Groundwater of the well situated in

Pennagar, Desur, Konagampattu, Rettani, Pelampattu have high EC value.

The groundwaters in these locations are slightly saline in nature and this is

due to the bedrock formation, agricultural activities and local pollution occurs

as isolated patches of this area. There is not much difference in the EC value

between March 2006 and November 2006. During the monsoon period the EC

is slightly reduced due to the rainfall recharge. The minimum EC value is

found in the Northeastern part of the study area (Korrakottai) and northern

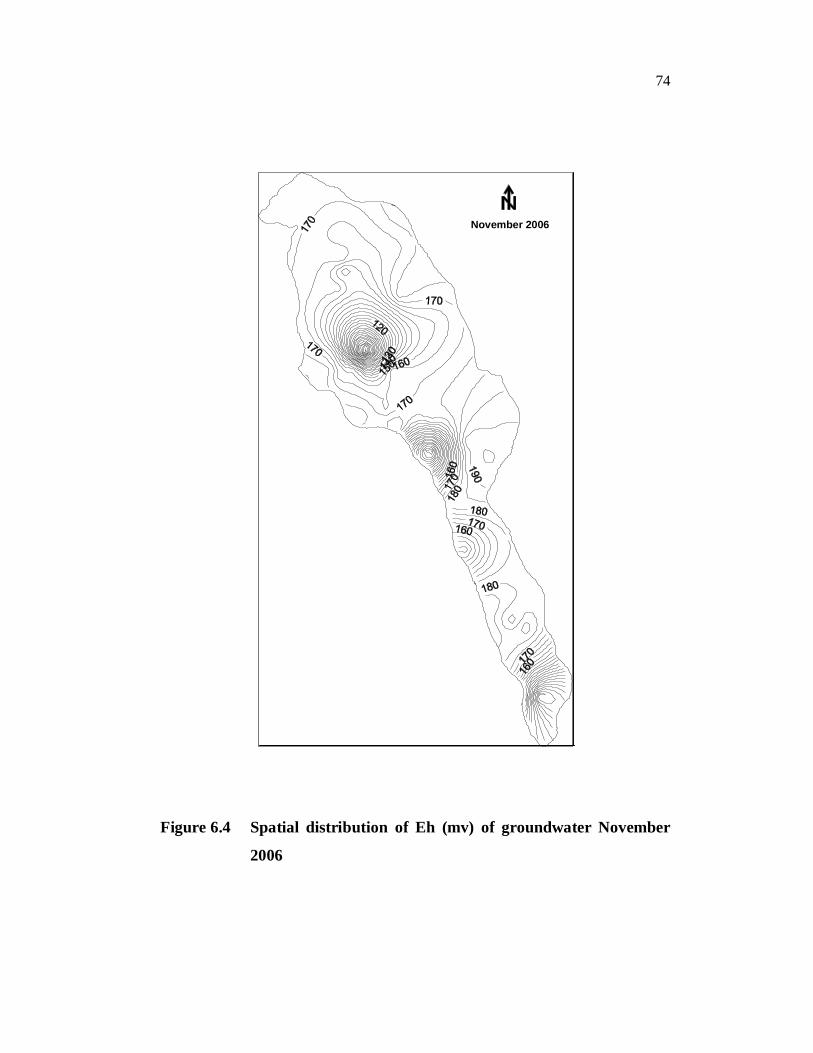
part of the basin (Kottupakkam). The redox potential indicates the oxidation

and reduction process in the groundwater. The redox potential (Eh) generally

varies from 26mv to 207mv as shown in Figure 6.4.

71

July 2006

Figure 6.1 Spatial distribution of pH of groundwater July 2006

72

March 2006

Figure 6.2 Spatial distribution of EC(S/cm) of groundwater March 2006

73

November 2006

Figure 6.3 Spatial distribution of EC(S/cm) of groundwater

November 2006

74

November 2006

Figure 6.4 Spatial distribution of Eh (mv) of groundwater November

2006

75

0

100

200

300

400

500

600

Conc

entra

tion

(mg/

l)

Na K Ca Mg Cl HCO3 CO3 SO4

MeanMinimumMaximum

6.3 MAJOR ION CHEMISTRY

The study of major ion concentration of the groundwater of this

area will provide information about the hydrochemical status of an aquifer.

The ranges of concentration of major ions in groundwater of the study area

are given in Figure 6.5. The concentrations of dissolved major cations and

anions in the groundwater vary both regionally and seasonally. The general

order of dominance of cations is Na+>Ca2+>Mg2+>K+ and for anions is HCO3-

>Cl->SO42->CO3

-. Thus Na+ and HCO3- are the dominant ions present in

groundwater of this area.

Figure 6.5 Range of concentration of major

6.4 SEASONAL VARIATION OF MAJOR IONS

In general groundwater quality will change due to the variation in

rainfall recharge, exploitation of groundwater, variation in land use, irrigation

return flow, geochemical reaction and geological formation. These factors

play a major role in seasonal variation of ionic composition in groundwater in

this area. The composition of the infiltrating rain water depends on the

76

frequency of rainfall, soil environment, agriculture pattern and thickness of

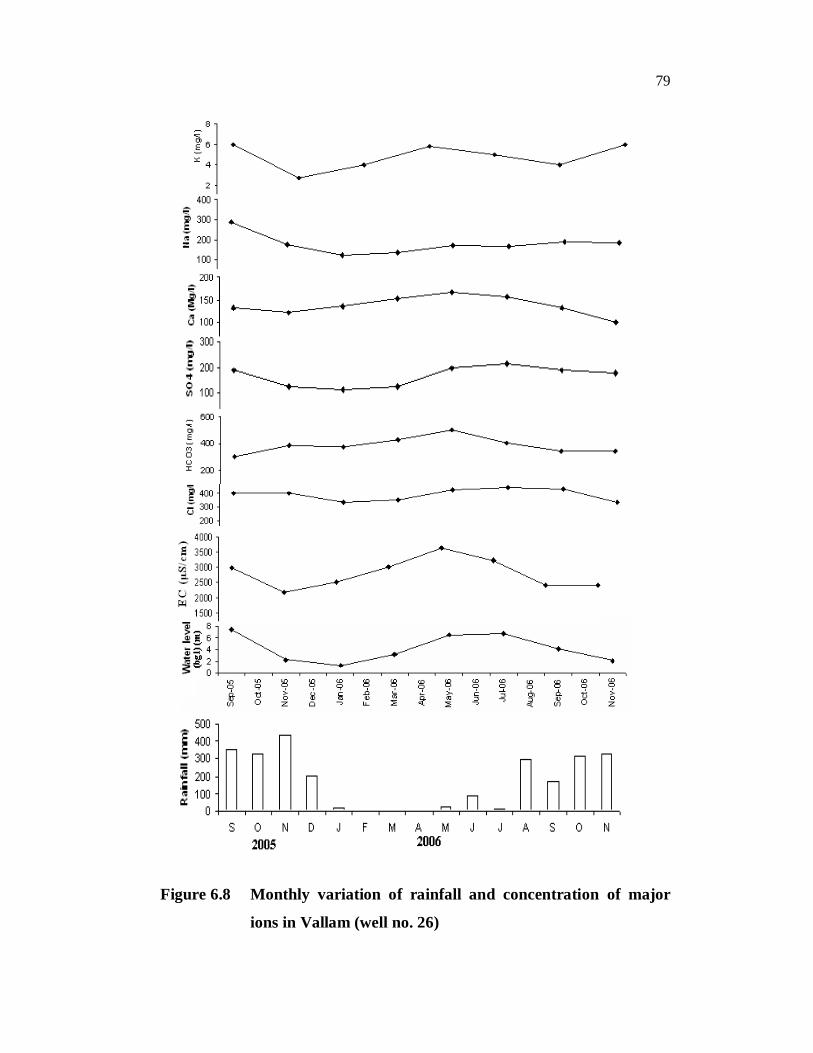
vadose zone (Scheytt 1997). The monthly variation of the major ions

concentration of groundwater of three representative wells of this area

illustrated in the Figures 6.6, 6.7 and 6.8 along with the rainfall and

groundwater level. The EC and the concentration of major ions of

groundwater of this area vary significantly with respect to time. In the study

area rainfall recharge occurs generally from the month of October to January

and comparatively high evaporation occurs from the month of March to May.

These two factors play a major role for the seasonal variation of major ions.

Monthly variation in major ion chemistry of the wells located in hard rock

formation respond to rainfall more quickly due to the intensive of weathering

and fracturing of hard rocks. The comparison between rainfall and water

level indicates the rise in water level when the monthly rainfall exceeds

300mm. The rise in groundwater level in this area during the Northeast

monsoon has resulted in decrease in ionic concentrations due to the dilution.

The recharge process reduces the ionic concentration of groundwater.

However, during the non-monsoon period, increase in major ion

concentration is observed, due to the lowering of water level and the

evaporation process. The concentration of the most of the major ions follows

the water level fluctuation pattern. Similar results were observed in the hard

rock aquifers of Guntur district, Andhra Pradesh, southern India (Subba

2005). However, in a few wells there is a slight increase in ionic

concentration with rise in water level due to local pollution (animal solid

waste storage and human waste) and due the dissolution of precipitated salts.

In the hard rock area the water table generally fluctuates within the weathered

and fractured rock zone in semi-confined conditions. Major ion concentration

increases due to dissolution of precipitates present along flow path during

recharge. Thus the seasonal variations of the study area is mainly controlled

by the recharge process and strongly influenced by the bedrock geology, but

may also be attributed to the impact of agricultural pollution.

77

Figure 6.6 Monthly variation of rainfall and concentration of major

ions in Pennagar (well no.6)

78

20

40

60

80

100

SO4

(mg/

l)

Figure 6.7 Monthly variation of rainfall and concentration of major

ions in Chendur (well no.40)

79

Figure 6.8 Monthly variation of rainfall and concentration of major

ions in Vallam (well no. 26)

80

6.5 SPATIAL VARIATION OF MAJOR IONS

The major ion concentrations of groundwater of the study area vary

spatially according to groundwater recharge due to variation in amount of

precipitation, irrigation return flow, agricultural activities and geochemical

reactions of the formation. Sodium, among the alkalis, is a predominant

chemical constituent of the natural water. The sodium ion is the dominant

cation (Figure 6.9) of the study area and it varies from 10 to 457 mg/l.

Maximum concentration of sodium ion is found along the northwestern and

southern part of the study area. Potassium range from 1 to 159 mg/l and it

varies from season to season. The occurrence of potassium is found less in

nature and therefore, it is found at lower concentrations than sodium.

Maximum concentration of the potassium is observed in the well nos 16 and

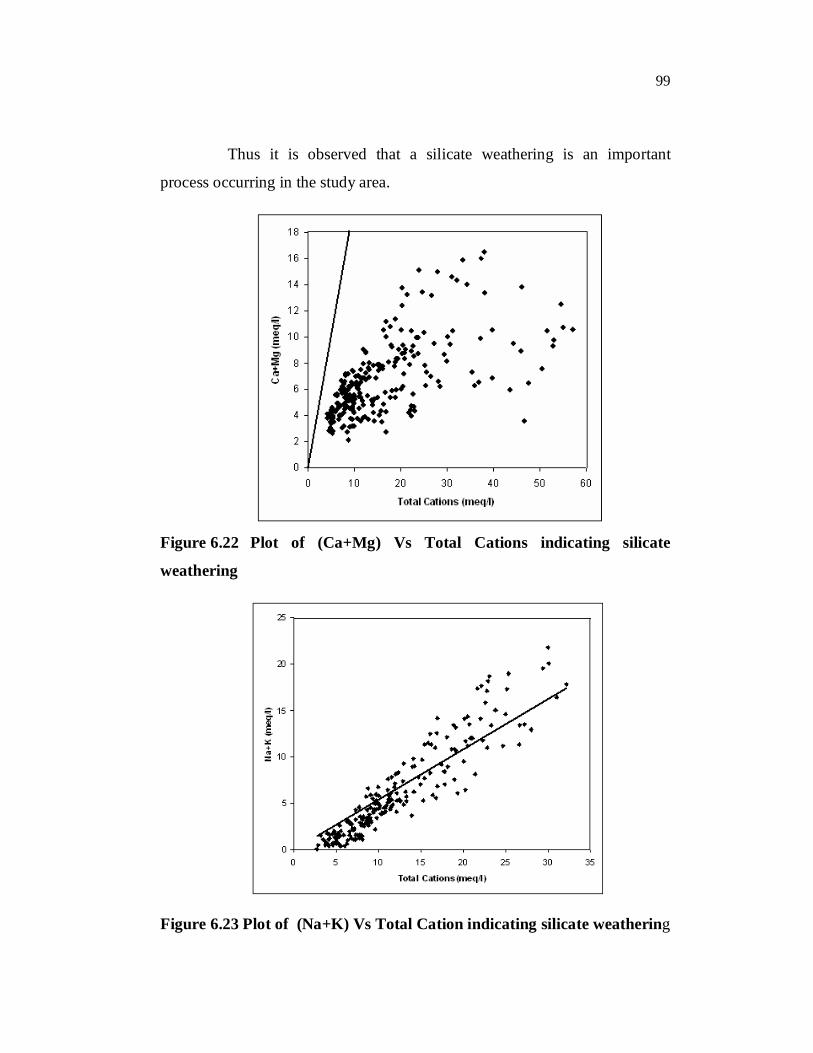
29. High concentration of sodium and relatively low concentration of

potassium in the groundwater might be due to the weathering of silicates. This

type of low proportion of potassium and high sodium has been reported by

few researchers (Mohan et al 2000).

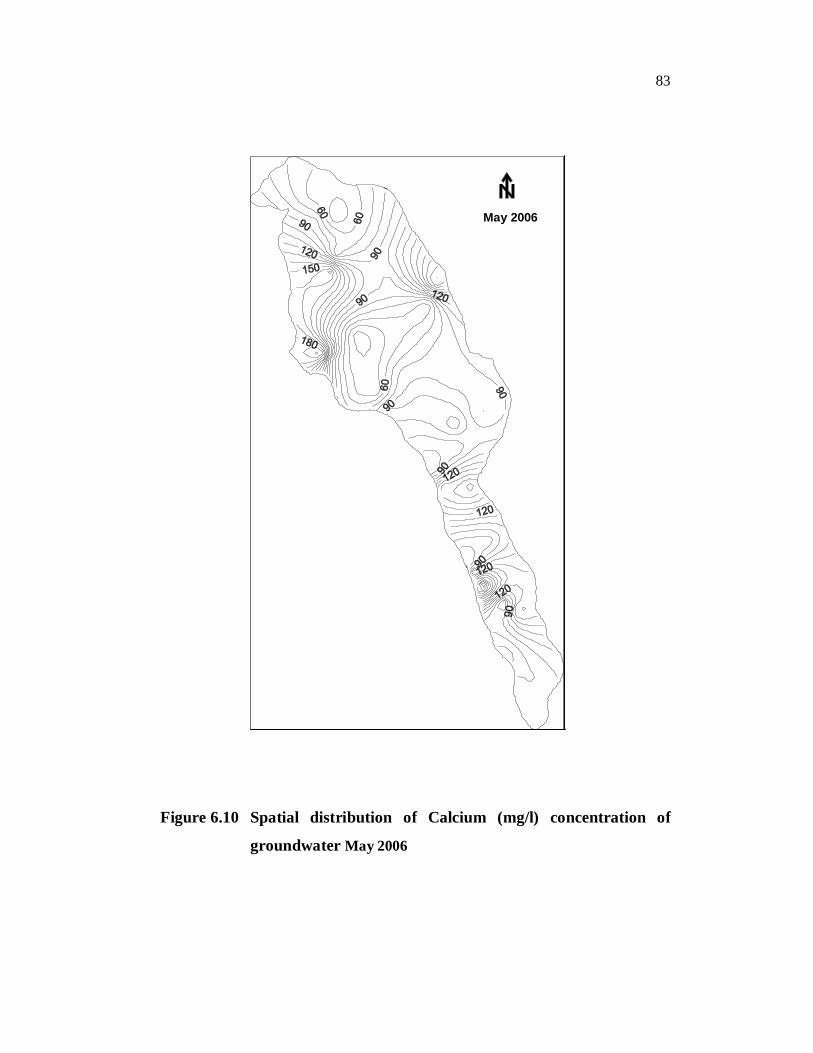
Calcium is a common and widespread element and it is distributed

widely in soils and rocks. Calcium is the second dominant cation in the

groundwater of this region and it ranges from 35 to 218 mg/l (Figure 6.10).

Usually the groundwater in the hard rock regions has the higher concentration

of calcium. The maximum concentration of calcium is found in the north

western and south western parts of this area. Magnesium concentration ranges

from 10 to 67 mg/l with the mean value of 28 mg/l (Figure 6.11). There is not

much variation in the concentration of the magnesium ion of the groundwater

samples. Magnesium content is generally controlled by the presence of CO2.

The primary source of carbonate and bicarbonate ions in groundwater is the

dissolved carbondioxide in rainwater (Karnath, 1989). Bicarbonate (Figure

6.12) values ranges from 192 to 665 mg/l and is the dominant anions of the

81

study area. Higher concentration of bicarbonate in the study area might be due

to the weathering of silicate rocks and bicarbonate in present I the infiltrating

rainwater. Almost the entire area has high concentration of the bicarbonate.

The alkalinity of the water in this area is caused by dissolved bicarbonate

salts. The concentration of bicarbonate ions decrease slightly after the

monsoon. Carbonate concentration in groundwater of the study area ranges

from 0 to 53 mg/l. Maximum concentration of the carbonate is observed in the

well no: 24. In this well carbonate is present during the monsoon season

when there is flow in the river and during the rest of the period the carbonate

is absent. Thus carbonate is usually present only during the rainy season in

two wells of this area.

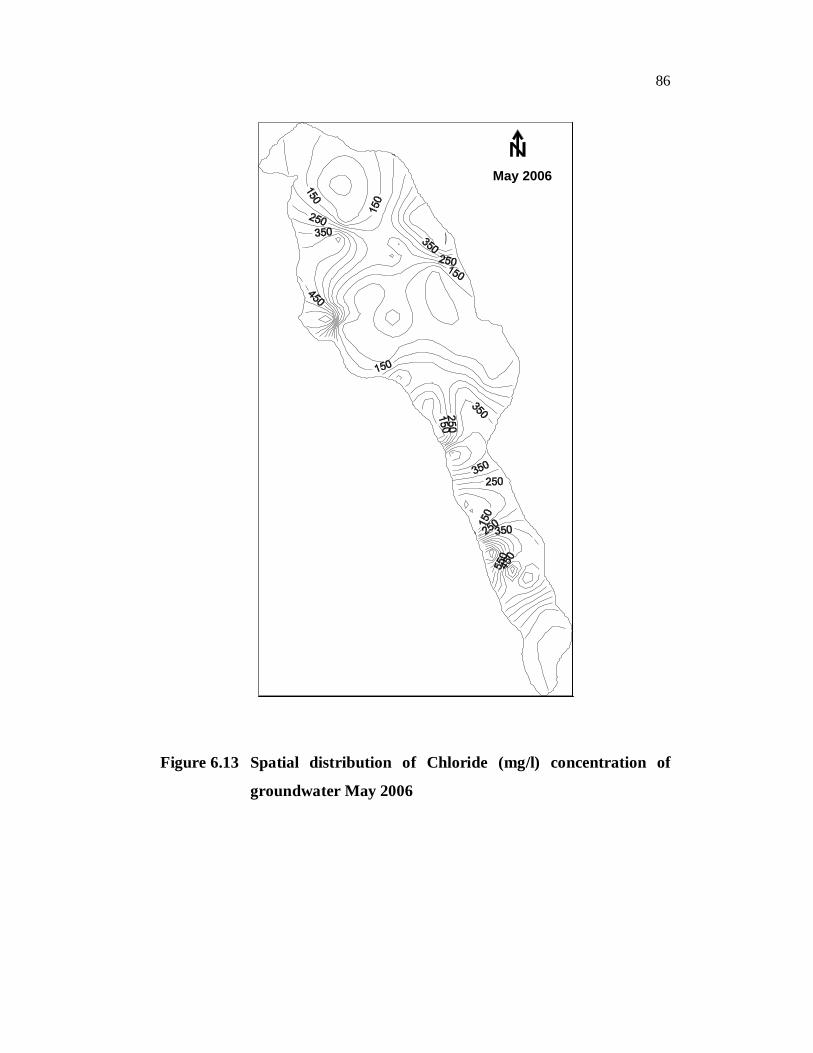
Figure 6.13 shows chloride concentration ranges from 26 to 899

mg/l. Chloride is considered as a strong acid compared to other ions. The

maximum concentration is found in the well nos 6 and 33 in northwestern and

south western part of the study area. The chloride concentration of

groundwater of the wells located in gneiss rock formations is higher than that

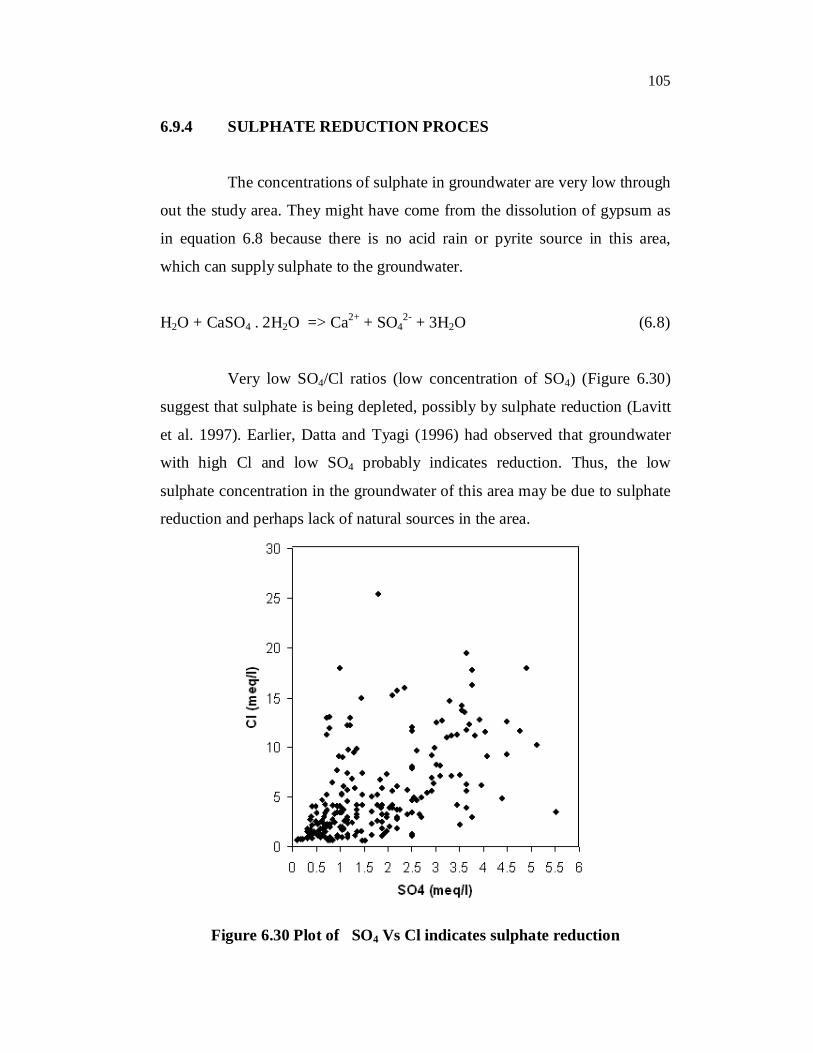
of the wells located in the Charnockite rock formations. Sulphate is widely

distributed in reduced form in both metamorphic and sedimentary rocks as a

metallic Sulphide through it is not a major constituent of the earth’s outer

crust. Sulphate concentration in groundwater of this area ranges from 10 to

400 mg/l. The well no 37 has the higher Sulphate concentration which is

located in the southern part of the area. Sulphate concentration in natural

water is less than chloride and the same is observed in the groundwater of the

study area also. Sulphate concentration in this area is influenced by the

agriculture patterns, since the man-made chemical fertilisers are used in this

area. In general the regional variations of all major ions behave more or less

in a similar manner. Thus the higher concentration is observed in the

Northwest and Southwest part of the study area. Low concentration is

observed in the northern part and northeastern of the study area. In most of

82

May 2006

the months, as there is no flow in the Tondiar River, the concentration of ions

in groundwater is high. The tanks can store water only for 1 or 2 months.

Hence the ionic concentration is high most of the months, except during the

month of November to January. During the month of October to November

there is heavy rain which dilutes the groundwater by the recharge process.

Hence, the concentration of certain ions decreases and there is also increase of

certain ions like potassium and nitrate due to the applications of fertilizers.

Figure 6.9 Spatial distribution of Sodium (mg/l) concentration of

groundwater May 2006

83

May 2006

Figure 6.10 Spatial distribution of Calcium (mg/l) concentration of

groundwater May 2006

84

Figure 6.11 Spatial distribution of Magnesium (mg/l) concentration of

groundwater May 2006

May 2006

85

Figure 6.12 Spatial distribution of Bicarbonate (mg/l) concentration of

groundwater (May 2006)

May 2006

86

Figure 6.13 Spatial distribution of Chloride (mg/l) concentration of

groundwater May 2006

May 2006

87

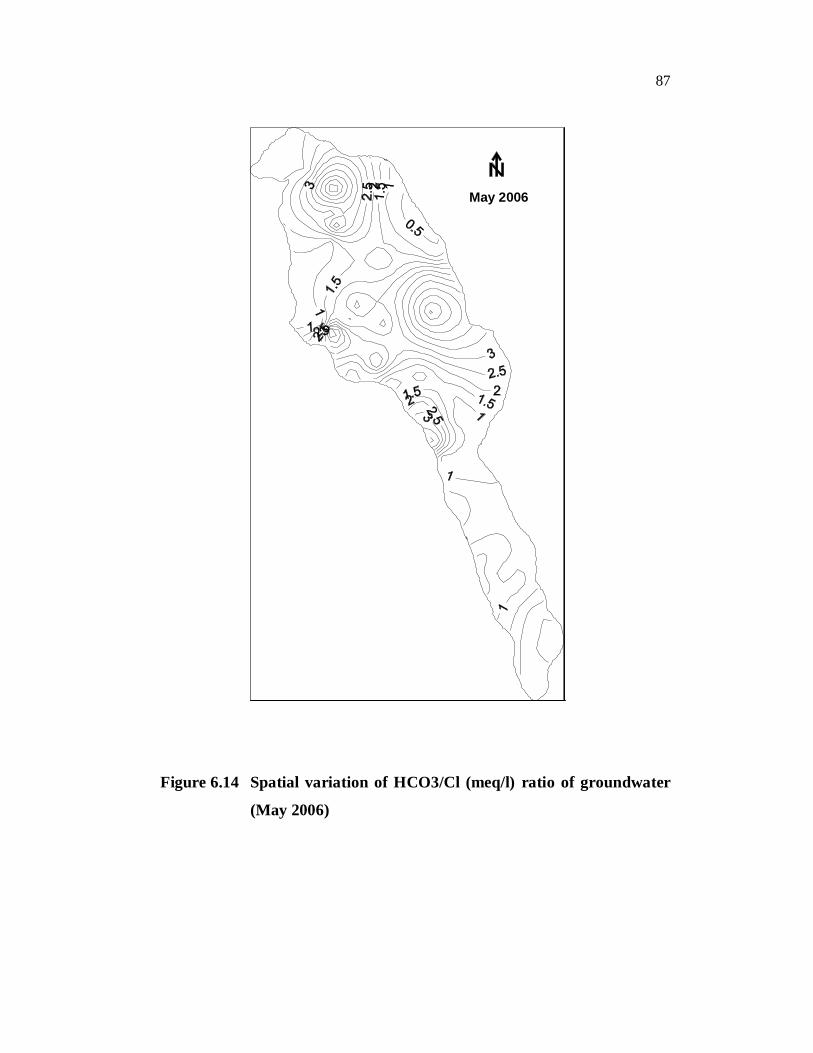
Figure 6.14 Spatial variation of HCO3/Cl (meq/l) ratio of groundwater

(May 2006)

May 2006

88

6.6 VARIATION RATIO BETWEEN HCO3/Cl

The Figure 6.15 shows the rational variation in the ratio between

chloride and bicarbonate. This variation generally follows the direction of

groundwater flow. Uphari and Toth (1989) observed the groundwater evolves

from bicarbonate dominate facies in the recharge area to Chloride dominate

facies in the discharge area. Similar results were observed in the study area.

When the groundwater flows towards the discharge area (Tondiar River

during summer season) the younger water gets enriched in Chloride. During

the groundwater flow, the groundwater becomes more mineralized as it

dissolves more aquifer material. This was clearly revealed by the regional

variation in HCO3/Cl ratio of groundwater. The ratio decreases towards

southern part and clearly shows recharge area and groundwater flow towards.

The Bicarbonate may be derived from the soil zone CO2 and at the

time of weathering of the parent materials (Hudson 1997, Mohan et al 2000).

Bicarbonate may also derive from the dissolution of Carbonates and Silicates

present in the study area. The soil zone consists of roots, decay matter,

organic matter which in turn combines with the rainwater/infiltrating water to

form Bicarbonates by the following reactions

CO2 + H2O H2CO3 (6.1)

H2CO3 H + + HCO3- (6.2)

The source of high concentration of Bicarbonates may also be

derived from the dissolution of soil CO2 during the percolation of irrigation as

well as rain water and also silicates present in this area.

Chloride is considered as a strong acid compared to other ions.

However, the chloride concentration is comparatively higher in a few wells

located in the gneiss formation. In general the chloride concentration is low in

89

0

1

2

3

4

5

6

7

8

0 2 4 6 8 10 12 14 16 18 20 22 24 26 28 30 32 34 36 38 40 42 44Well No.

HC

O3/

Cl (

meq

/l)

Wells in Gneiss rock formations

Wells in Charnockite rock formations

the wells in the charnockite areas. Chloride concentration of water samples

indicates that the possible sources may be due to the irrigation return flow and

rainfall recharge. The HCO3/Cl (meq/l) molar ratio is generally less than 4 in

groundwater of hard rocks; however in few wells in the hard rock formation is

higher (Figure 6.15)

Figure 6.15 HCO3/Cl ratio groundwater samples

6.7 HDROCHEMICAL FACIES OF GROUNDWATER

The geochemical nature of groundwater can be understood by

plotting the concentrations of major cations and anions in the piper trilinear

diagram. The trilinear diagram of Piper (1953) is very useful in bringing out

the chemical relationship in groundwater. This is useful to understand the

total chemical character of groundwater samples in terms of cations and

anions pairs. The study area is most dominant cations is sodium and the most

dominant anions is Bicarbonate. Four major hydrochemical facies have been

identified from the Piper diagram (Figure 6.16) based on the major ion

chemistry of groundwater of this area. They are:

90

i) CaHCO3 Type

ii) NaCl Type

iii) Mixed CaMgCl Type

iv) Mixed CaNaHCO3 Type

Figure 6.16 Piper diagram for classifying groundwater types

91

The CaHCO3 (Carbonate hardness) type and NaCl (primary

salinity) type of water are the dominate type of water in the study area. The

above type of water might have been derived from the groundwater recharge,

irrigation return flow and ion exchange process. There is no difference in the

distribution of various hydrochemical facies between the groundwater of

occurring in gneiss and charnockite formation. Schoeller’s (1965) diagram

(Figure.6.17) also shows that the groundwaters in the study area have similar

composition irrespective of geological formation. This Figure also indicates

the similarity in the chemical ratios of concentrations, which indicate that the

groundwater flow makes the groundwater is more or less similar in nature.

Figure 6.17 Scholler diagram for groundwater samples (January 2006)

92

6.8 HDROCHEMISTRY AND LAND USE

Most part of the study area is under intensive cultivation, human

settlement and the other part is isolated hillocks and forest mostly in the

northern part of the study area. Hence, the land use variation is reflected in the

hydrochemistry of this area as in other place. (Cain et al. 1989). Variation of

groundwater quality in an area is a function of physical and chemical

parameters that are greatly influenced by geological formations and

anthropogenic activities. At several sites the spatial variation between the land

use and hydrochemistry was observed. Well nos. 9 and 13 is the well contains

the mostly fresh water in the study area, as it is located near the hillocks in the

northwestern part of the study area. As there is no human settlement around

this well, and the soil is deep red soil and there is very less agricultural

cultivation and mostly dry crops cultivation and also somewhat close to the

forest area The wells located very close to the human settlement, saline soil

and also to the intensive agriculture cultivation have very high salinity. In few

wells the aquifer it self in saline nature and this is due the geological

formation and the nature of soil is saltiest

As almost entire area is being intensively cultivated and irrigated

and it is importance of understand its effect on hydrochemistry. This area has

been subjected to the application of excessive inorganic fertilisers for almost

two decades. In the case of agricultural areas, these activities may generate

great quantities the ionic concentration of potassium and nitrate of some wells

are generally higher located in agricultural fields than the domestic wells.

Generally domestic wells are constructed in this study area inside the Tanks

and away from the human settlement.

93

6.9 HYDROGEOCHEMICAL PROCESS

Hydrogeochemical process occurring within groundwater zone by

interaction with aquifer minerals result in the chemical nature of water.

Geochemical processes are very important as they control the composition of

the groundwater in the aquifer system. The geochemical processes are

responsible for the seasonal and regional variation in groundwater quality as

discussed earlier. The geochemical process changes the groundwater quality

during its flow from the recharge area. The geochemical properties of various

groundwater bodies are determined by the chemistry of water in the recharge

area as well as the subsurface formation. The various geochemical processes

that are responsible for the chemical character of the groundwater of this area

are discussed below.

6.9.1 MECHANISMS CONTROLLING GROUNDWATER

QUALITY

Gibbs (1970) proposed a diagram to understand the relationship of the

chemical components of waters and classified the groundwater chemistry

resulting due to three mechanisms as shown in (Figure 6.18). This plot

explains the relationship between water chemistry and aquifer lithology. Such

a relationship, help to identify the factors controlling the groundwater

chemistry. The Fig 6.18 suggests that the chemical weathering of rock-

forming minerals is influencing the groundwater quality. As most of the

points plot in the region of rock water interaction, this is likely to be the

dominant process controlling the groundwater chemistry of this area.

However, some points also fall in the region near the evaporation, indicating

that this process is also responsible for the groundwater chemistry.

94

Figure 6.18 Gibbs diagram

Evaporation is the natural process that would increase the

concentration of the ions in groundwater. Thus evaporation is an important

process that increases the concentration of ions, especially during the dry

period and the evaporation increases the water will tend move toward salinity.

This would cause increase in concentration of ions in surface and subsurface

water. When evaporation is a dominant takes place, entire area this would

enrich the concentration ions and increases salinity in soil zone, due to decline

of the groundwater table level Evaporation is a dominant process in the entire

study area as this area fall in semi- arid region, where the ionic concentration

increases with lowering of water level. The presence of such linear

relationship between sodium-to-chloride ratio vs EC is indicative of

concentration by evaporation or evapotranspiration as reported by Jankowski

and Acworth 1997. The plot shows the Na/Cl vs EC (Figure 6.19) would give

a straight line, which would then be an effective indicator of concentrations of

95

ions by evaporation or evapotranspiration. Thus, evaporation is an important

process that increases the concentration of ions, during dry period and

groundwater diluted during subsequent monsoon recharge.

Similarly sodium vs chloride plot (Figure 6.20) indicates that most

of samples plot above the fresh water evaporation line. This indicates that

evaporation may not be the major process controlling groundwater quality.

Hence, sodium in the groundwater might have been derived from some other

processes. If halite dissolution is responsible for sodium, Na/Cl molar ratio

should be approximately equal to 1, where as ratio greater than 1 indicates

that Na is released from silicate weathering reaction (Meybeck 1987).

Samples having Na/Cl ratio greater than one (Figure 6.19) indicates excess

sodium, which might have come from silicate weathering. If Silicate

weathering is a probable source of sodium, the water samples would have

HCO3 as the most abundant anions (Rogers 1989).In the present study,

bicarbonate is the dominant anions. Hence silicate weathering may be the

reason for sodium in groundwater. Samples having Na/Cl ratio approximately

less than one indicate the possibility of some other chemical sources.

Figure 6.19 Plot of Na/Cl (meq/l) Vs EC (μS/cm)

96

Figure 6.20 Plot of Na(meq/l) Vs Cl (meq/l)

6.9.2 SILICATE WEATHERING PROCESS

Silicate weathering process is an important process that is expected

to control the groundwater chemistry in the hard rock formation. The

groundwater occurring in the hard rock formation generally has high

concentration of major ions due to the weathering of rocks. Groundwater in

the Tondiar river basin comprises of hard rocks and these rocks are highly

weathered and fractured. Silicate weathering is understood by the

relationships between the major ions present in the groundwater. In this area

sodium is the dominant cation next to calcium in the groundwater of the study

area. A relationship between (Ca+Mg) vs HCO3 diagram shown in Figure

6.21 indicates that most of the data points fall above the1:1 equiline, although

few points below the equiline.

97

Figure 6.21 Plot of (Ca+Mg) Vs HCO3 plot indicating silicate weathering

It suggests that an excess of alkalinity of the waters have been

balanced alkalies. The excess of alkaline earth elements (Ca + Mg) over

HCO3 in samples reflect an extra source of calcium and magnesium ions. It

might have been balanced by Cl- and SO42-or supplied by silicate weathering.

The ratio will be close to unity, if the dissolution of calcite, dolomite and

gypsum is the dominant reaction in aquifer system. The data points toward the

Y axis (Figure 6.21) indicate high concentration of Ca+Mg over HCO3 which

is mainly balanced by ion exchange process .The (Ca+Mg) vs Total cations

(TZ) shows that the data lie far below the theroritical line (1:1) as shown in

(Figure 6.22) depicating an increasing contribution of alkalies to the major

ions. But a few groundwater samples of wells located in the hard rock regions

have higher concentration of (Na +K) than (Ca+Mg).The Na+K vs Total

cations scatter diagram (Fig. 6.23) of the study area shows sample points

98

falling both along and above the Na+K = 0.5 Total cations. This suggests that

the cations in the groundwater might have been derived from silicate

weathering. Datta and Tyagi (1996) observed that the contribution of cations

may be derived from silicate weathering when Na+K = 0.5 Total cations. The

slightly lower concentration of (Na+K) is likely to be caused by Ca/Na

exchange process, which might have reduced the amount of Na in the

groundwater. Since this region comprise of composite gneiss and charnockite,

weathering of silicates might be the possible source of ions. Weathering of

silicate rocks resulting in high Na and K has also been reported in the hard

rock regions Naini Industrial area, Uttar Pradesh by Mohan eta al (2000).

Silicate dissolution is the probable source of Na in the study area

because water that derives solutes primarily by silicate weathering has high

HCO3, which is the most abundant anion in this area (Equiline 1:1). A Na/Cl

ratio approximately equal to 1 is usually attributed to halite dissolution.,

where as ratio greater than 1 is Na is released from silicate weathering A

molar ratio Na/Cl ratio >1 (Figure 6.24) is due to Na is released due to silicate

weathering reactions while the molar ratio of Na/Cl <1 are due to the halite

dissolution (Meybeck 1987).In the study area the molar ratio of Na/Cl of the

groundwater samples generally ranges from 0.04 to 4.72 with an average of

1.10. Figure 6.24 shows that the value of Cl as a function of Na in the

groundwater. The dissolution of halite in water release equal concentrations

of Na and Cl into the solution and the figure 6.24 the data point s are clustered

around the equiline 1:1 This indicates that silicate weathering is the source of

sodium.

2NaAlSi3O8 +2H2CO3 +9H2O =› Al2Si2O5 (OH)4 +2Na+ +4H4SiO4 +2HCO3

(6.3)

(Albite) (Silicate weathering) (Kaolinite)

99

Thus it is observed that a silicate weathering is an important

process occurring in the study area.

Figure 6.22 Plot of (Ca+Mg) Vs Total Cations indicating silicate

weathering

Figure 6.23 Plot of (Na+K) Vs Total Cation indicating silicate weathering

100

Figure 6.24 Plot of Na Vs Cl plots explaining the mixing process

6.9.3 ION EXCHANGE PROCESS

Under certain conditions, the ions attracted to a solid surface may

be exchanged for other ions in aqueous solution. This process is known as ion

exchange process, but in some natural soil (Clay) cation exchange is dominant

and the clay has high percentage of colloidal sized particle.

A plot of Na vs Cl concentration of groundwater of the study area

with 1:1 line is given in Figure 6.25. The sample points fall above and below

the 1:1 line. The sample points plotting below the 1:1 line indicate the

depletion of sodium with respect to chloride. Similarly the sample points

plotting above the 1:1 line indicate the increase of sodium with respect to

chloride. Both the process shows the evidence of cation exchange process

(Jankowski and Acworth 1997; Salama 1993). Excess of Ca and Mg in

groundwater may be due to the exchange of Na in water by Ca and Mg in clay

particle. The cation exchange process is explained by the following reaction

Ca+2Na (exchanged) ↔2Na+ + Ca (exchanged) (6.4)

Mg2+ +2Na (exchanged) ↔2Na+ +Mg (exchange) (6.5)

101

Where (exchanged) denotes the cation exchanged on water or soil.

Figure 6.25 plot of Cl Vs Na indicating ion exchange process

Figure 6.26 Relations between Ca+Mg and SO4+HCO3

102

Figure 6.27 Relations between Ca+Mg-HCO3-SO4 and Na-Cl

The plot of SO4+HCO3 vs Ca+Mg (Figure 6.26) shows that the

most of the groundwater samples from hard rock formation are clustered

around the 1:1 line, if the dissolution of calcite, dolomite and gypsum are

dominant reaction in a system. Excess of calcium and magnesium in

groundwater of hard rock formation may be due to the exchange of sodium in

water by calcium and magnesium in clay material

The plot of Na-Cl vs Ca+Mg-HCO3-SO4 (Figure 6.27) also help to

identify the ion exchange process in the aquifer system. Na-Cl (meq/l)

represents the amount of Na gained or lost relative to that provided the halite

dissolution, whereas Ca +Mg-HCO3 (meq/l) represents the amount of Ca and

Mg gained or lost relative to that provided by gypsum, calcite and dolomite

dissolution. If ion exchange is a significant composition-controlling process,

the relation between should be linear slope (Jankowski et al 1997). In the

study area, the groundwater samples plotted in the plot have a slope of -0.31,

which indicates certain extent of reverse ion exchange. This confirms that Ca,

103

Mg and Na concentration are interrelated to reverse ion exchange process.

Further, to discriminate which ion (Ca or Mg) controls the hydrochemical

reactions, two indices of Base Exchange (IBE), namely the chloroalkaline

indices (CAI1 and CAI2) where estimated and presented below.

The ion exchange between the groundwater and its host

environment during residence or travel can be understood by studying the

chloro-alkaline indices. To know the direction of exchange during the path of

groundwater through the aquifer, Schoeller (1965) suggested 2 chloro-

alkaline indices CAI1 and CaI2 (May 2006) to indicate the exchange of ions

between groundwater and its host environment. The ion exchange and reverse

ion exchange was confirmed using chloro-alkaline indices.

CAI1 = Cl-(Na+K)/Cl (6.6)

CAI2 = Cl-(Na+K)/SO4 + HCO3 + CO3 + NO3 (6.7)

(All values are measured in meq/l)

When there is an ion exchange between Na or K in groundwater

with Mg or Ca in the aquifer material (rock/weathered layer), both of the

indices are positive, indicating ion exchange of sodium in groundwater with

calcium or magnesium in the weathered material. While in reverse exchange

both indices are negative when there is an exchange of Mg or Ca in the waters

with Na and K in the rocks. The chloroalkaline indices (CAI1 and CAI2) are

used to evaluate the event of base-exchange process during rock water

interaction. In the study area, the value of these indices varies between

positive and negative values (Figure 6.28, 6.29). There is no systematic

seasonal variation in the values of indices. So the ion exchange reactions

seem to occur in both the directions depending on the season, groundwater

flow path, mixing of water and evaporation process. Thus the cation exchange

104

process is one of the important geochemical processes that control the

groundwater chemistry of the area.

Figure 6.28 Variation in Chloro-alkaline indices (CAI) in all the wells

indicates indicating the Ion exchange process

Figure 6.29 Schoeller Classification of Groundwater

May 2006

Positive areas

Negative areas

LEGEND

105

6.9.4 SULPHATE REDUCTION PROCES

The concentrations of sulphate in groundwater are very low through

out the study area. They might have come from the dissolution of gypsum as

in equation 6.8 because there is no acid rain or pyrite source in this area,

which can supply sulphate to the groundwater.

H2O + CaSO4 . 2H2O => Ca2+ + SO42- + 3H2O (6.8)

Very low SO4/Cl ratios (low concentration of SO4) (Figure 6.30)

suggest that sulphate is being depleted, possibly by sulphate reduction (Lavitt

et al. 1997). Earlier, Datta and Tyagi (1996) had observed that groundwater

with high Cl and low SO4 probably indicates reduction. Thus, the low

sulphate concentration in the groundwater of this area may be due to sulphate

reduction and perhaps lack of natural sources in the area.

Figure 6.30 Plot of SO4 Vs Cl indicates sulphate reduction

106

6.10 GROUNDWATER REDOX POTENTIAL

Oxidation/reduction (Redox) reaction potential of groundwater (Eh)

plays an important role in the geochemical processes that occur in

groundwater. Redox is defined as the transfer of the electrons. Redox

reactions are enormously important in aqueous environmental geochemistry

Eh measurements are useful in identifying the redox zones as its value

decreases with increases in residence time (Champ et al 1979) and reported

that Eh values above 300mV indicate that sulphate would be stable in this

area and it is a recharge area. High Eh values indicate the regions of good

recharge and low Eh values are the regions of less recharge or discharge.

Figure 6.31 shows the relation between Eh and pH were used to determine the

groundwater conditions of the study area. The groundwater samples of the

study area have high Eh value more than 557mV in the well no.34 and the

lowest Eh value of the groundwater measured is 65mV at the sampling

borehole no.36, but this borehole will give during the monsoon period of

September 2006 as -65mV and the colour of the groundwater is yellow in

colour throughout the sampling period. Eh values <100mV suggest that the

redox conditions are low enough for sulphate reduction to occur (Champ et al

1979).Oxidation and reduction of sulphate and iron is a common process in an

aquifer system. The pH vs Eh diagram shows (Figure 6.31) that how Eh in

groundwater is governed in the upper range by oxidation of water to O2 and

lower range by reduction of hydrogen ions to H2.The groundwater samples of

the study area fall under ferrous (Fe2+) i.e reduction state and Fe(OH)2 i.e

oxidation states.

Fe3+ + e- = Fe 2+ reduction state (6.9)

Fe(OH)3 + e- + H+ = Fe(OH)2 + H2O Oxidation state (6.10)

From Figure 6.31 it is concluded that both oxidation and reduction states are

taking places in the study area.

107

Figure 6.31 pH-Eh diagram (May 2006)

6.11 MIXING OF SURFACE AND GROUNDWATER

River, tanks/lakes and ponds are the important sources of the

surface water resource in this area. In order to determine the interaction

between surface water and groundwater, water samples were collected from

surface water bodies located in the study area. These samples were analysed

for the chemical constituents. The chemical composition of the groundwater

along the Tondiar River is similar to the river water during the monsoon

period (Table 6.1). The results confirm the mixing between surface water and

groundwater.

Similar the comparison of groundwater quality of pond and well

was made in (Table 6.2) is similar. This indicates the effect of recharge from

the ponds located in this region results in groundwater with low total

dissolved solids. The storage in pond will be there generally for four months

from the onset of monsoon.

108

Table 6.1 Comparisons of the groundwater and River water quality

(November 2005)

S.No EC Na K Ca Mg Cl HCO3 So4

Well No.24 883 65 2.5 44 19 70 281 50

River water 738 69 4 31 22 99 210 85

All values in mg/l except EC (μS/cm)

Table 6.2 Comparisons of the Pond and Tank water quality

(January 2006)

S.No EC Na K Ca Mg Cl HCO3 CO3 So4

Pond water

(Korrakottai)

490 41 3.4 37 18 46 302 9 14

Well no 19 486 24 2 42 12 31 353 0 15

All values in mg/l except EC (μS/cm)

The mixing process of various water is responsible for the chemical

composition of groundwater in this region. The plot of Na and Cl

concentration of groundwater indicate that the points fall on or near the 1: 1

indicating the dominance of mixing processes (Figure 6.24). The groundwater

samples of the study area falls as a single group along mixing line. This

shows that mixing of freshwater recharge with the existing water is the major

mechanism taking place in the study area. Some of the samples in this area

have high chloride concentration, which may be restricted flow.

Thus in general, the groundwater chemistry of this area is

controlled by mixing water, evaporation, rock water interaction and ion

exchange process.


Recommended