75 Chapter 6 Interaction between Dry Amylopectin and Ethylene Glycol or Glycerol, Measured by 13 C Inverse Recovery Cross Polarisation NMR Spectroscopy A.L.M. Smits, P.H. Kruiskamp, J.J.G. van Soest, J.F.G. Vliegenthart [Submitted to be published] Abstract The interaction between dry amylopectin and ethylene glycol or glycerol is studied with Inverse Recover Cross Polarisation solid state NMR spectroscopy, for examining the mobility within the system. Upon storage at room temperature for a period of days up to months, the interaction developed. The plasticiser mobility decreased, for ethylene glycol as well as for glycerol, and the amylopectin carbon C6 mobility increased. The mobility of the other amylopectin carbons generally did not change, which means that the interaction mainly occurs at carbon C6. This is a new insight on how starch-plasticiser interactions take place on a molecular level. Upon heating, the interaction develops fast, after which crystal perfection is suggested to take place during storage at room temperature. Ethylene glycol as well as glycerol mobilise the amylopectin chains. For ethylene glycol, the amylopectin mobility remains even 16 months after heat treatment. For glycerol, however, 16 months after heat treatment amylopectin has immobilised again. It is proposed that the small ethylene glycol molecules, which can easily penetrate the ordered amylopectin chains, prevent the amylopectin chains from becoming immobilised. The larger glycerol molecules are hindered in penetrating the crystal structure of amylopectin and primarily interact at the edges of the crystalline lamellae. Therefore, they are unable to prevent immobilisation of the amylopectin chains.
Transcript
75
Chapter 6
Interaction between Dry Amylopectin and Ethylene
Glycol or Glycerol, Measured by 13C Inverse
Recovery Cross Polarisation NMR Spectroscopy
A.L.M. Smits, P.H. Kruiskamp, J.J.G. van Soest, J.F.G. Vliegenthart
[Submitted to be published]
Abstract
The interaction between dry amylopectin and ethylene glycol or glycerol is studied
with Inverse Recover Cross Polarisation solid state NMR spectroscopy, for examining
the mobility within the system. Upon storage at room temperature for a period of days
up to months, the interaction developed. The plasticiser mobility decreased, for
ethylene glycol as well as for glycerol, and the amylopectin carbon C6 mobility
increased. The mobility of the other amylopectin carbons generally did not change,
which means that the interaction mainly occurs at carbon C6. This is a new insight on
how starch-plasticiser interactions take place on a molecular level.
Upon heating, the interaction develops fast, after which crystal perfection is suggested
to take place during storage at room temperature. Ethylene glycol as well as glycerol
mobilise the amylopectin chains. For ethylene glycol, the amylopectin mobility
remains even 16 months after heat treatment. For glycerol, however, 16 months after
heat treatment amylopectin has immobilised again. It is proposed that the small
ethylene glycol molecules, which can easily penetrate the ordered amylopectin chains,
prevent the amylopectin chains from becoming immobilised. The larger glycerol
molecules are hindered in penetrating the crystal structure of amylopectin and
primarily interact at the edges of the crystalline lamellae. Therefore, they are unable to
prevent immobilisation of the amylopectin chains.
Chapter 6
76
Introduction
Biopolymers such as starch have been studied as replacements of synthetic polymers,
for environmental and cost-related reasons. Starch can be processed into thermoplastic
materials using thermal and mechanical forces. Water and polyol plasticisers, such as
glycerol or ethylene glycol, are added to enable melting below the decomposition
temperature. During storage of these thermoplastic materials, retrogradation and
recrystallisation occur. Some plasticisers are known to reduce these ageing processes.
To understand this influence of plasticisers, it is important to investigate their
interactions with starch.
Previously, it was reported that the interaction between dry starch polysaccharides and
the plasticisers ethylene glycol or glycerol could be observed with 13C solid state
CP/MAS and HP/DEC NMR spectroscopy [1-3]. Upon heating, a fast interaction took
place. During storage at room temperature the interaction proceeded dependent on
starch crystallinity and plasticiser mobility. The plasticiser was partly immobilised by
the interaction and appeared in the CP/MAS spectra, while the HP/DEC signal
decreased and broadened.
In the present study, the interactions between dry amylopectin and the plasticisers
ethylene glycol or glycerol are further investigated, using 13C solid state Inverse
Recovery Cross Polarisation (IRCP) NMR spectroscopy. With this method it is fairly
straightforward to visualise differences in the dynamics of the carbon atoms. It is a
relatively simple technique that proves to be valuable for investigating starch-
plasticiser interactions.
Experimental
Sample preparation
Amylopectin obtained from granular potato starch, with a remainder of 5% amylose
(Amylopectin-UG) was provided by Avebe (Foxhol, the Netherlands). Glycerol
(≤0.1% H2O) was obtained by Fluka (Neu-Ulm, Germany) and ethylene glycol
(≤0.05% H2O) by Acros (Geel, Belgium).
The crystalline amylopectin was dried under reduced pressure in a vacuum-oven at
70°C. The dried material (<3% H2O) was mixed manually under a nitrogen gas flow
with glycerol or ethylene glycol. The plasticiser concentration was 4.3 mmol
plasticiser/g amylopectin, corresponding to 28.6 wt% for glycerol and 21.3 wt% for
Interaction of dry amylopectin with ethylene glycol or glycerol: IRCP
77
ethylene glycol. The samples were stored airtight. The samples are analysed directly
after mixing, and during storage at room temperature, while the interaction develops.
Alternatively, the interaction is enforced by heat treatment, after which the samples
are examined. Samples exposed to heat treatment were heated for 30 min at 165°C in
a small, airtight container.
Analyses
Solid state 13C NMR spectra were collected on a Bruker AMX 400 spectrometer
operating at 100.63 MHz. Samples were spun at the magic angle (54.7°) with respect
to the static magnetic field. Carbon chemical shifts relative to tetramethylsilane
(TMS) were determined from the spectra, using solid glycine at room temperature as
external reference. Samples were packed into 7-mm ceramic rotors and spun at 4 kHz.
In 13C cross-polarisation magic angle spinning (CP/MAS) experiments the cross
polarisation time was set to 500 µs.
In the IRCP pulse sequence [4], a relatively long cross polarisation period of 5 ms is
used, in order to maximise the polarisation of the 13C nuclei, followed by a phase
inversion pulse. The dynamics of inversion is similar to the polarisation dynamics in a
standard CP sequence, and is therefore strongly dependent on the 13C-1H dipolar
coupling. Consequently, the inversion recovery sequence is very sensitive to the local
proton environment and to molecular motion [5]. By using a variable inversion time
of 10 µs-10 ms, the evolution of magnetisation of the CHn groups is obtained. The
magnetisation starts with an optimum value, and decreases with increasing inversion
time.
Two different models can be used to describe the spin dynamics associated with the
IRCP method [6-9]. The first model is used for systems with a small dipolar coupling
such as non-protonated groups or systems with an important molecular motion (type I
magnetisation). In this model the magnetisation can be described by a single
exponential decrease. The second model describes systems with a strong
heteronuclear dipolar coupling, like rigid CHn groups (type II magnetisation). The
magnetisation can be described, at least for the first ms of inversion time, by a more
complex equation. The cross polarisation is not a single exponential process, but
involves two processes with different time scales. The magnetisation decreases
Chapter 6
78
rapidly in the first tens of microseconds (up to ~50 µs), and then reaches the minimum
value more slowly. The IRCP method is widely used for spectral editing, in which
signals are subsequently nulled using different inversion times [6,7,9-11]. Another
application is to distinguish between mobile and immobile domains or functional
groups in solids [12-14], and to explore local intra- and intermolecular dipolar
interactions [4,8].
In all NMR experiments, 13C CP/MAS, high power decoupling (HP/DEC), and IRCP,
the recycle delay was set to 4 s [15].
Results and Discussion
Ethylene glycol interaction during storage at room temperature
IRCP NMR experiments are performed on freshly mixed amylopectin and ethylene
glycol. The integral values of the 13C peaks as a function of the phase inversion time
at day 1 are shown in Figure 6.1.
-1.50
-1.00
-0.50
0.00
0.50
1.00
0 1 2 3 4 5 6 7 8 9 10
Ti (ms)
Relative Integral T1 C1T1 C235
T1 C4T1 C6
T1 Glycol
Figure 6.1 Relative integral values of the 13C IRCP NMR signals of freshly mixed
amylopectin with ethylene glycol as a function of the phase inversion time.
The behaviour of the magnetisation of ethylene glycol with increasing inversion time
is very different from amylopectin. The ethylene glycol carbon shows a behaviour
consistent with a model exhibiting a small dipolar coupling, like systems with an
important molecular motion (type I). The amylopectin carbons show a behaviour
consistent with a model of strong heteronuclear coupling, like rigid CHn groups
(type II). This has to be expected, since ethylene glycol is highly mobile in the fresh
Interaction of dry amylopectin with ethylene glycol or glycerol: IRCP
79
mixture, while the solid amylopectin is rigid. Since carbon C6 has two directly bound
protons, in contrast to the other amylopectin carbons that only have one proton, the
C6 curve is steeper and has a deeper minimum value (in agreement with Bonhomme
et al. [11]).
The mixture is followed with IRCP for 14 days. Within this period, the ethylene
glycol-amylopectin interaction has reached equilibrium. Differential Scanning
Calorimetry (DSC) measurements previously showed that less than 10% of the
interaction enthalpy is observed after one day of storage, and less than 5% after four
days [1]. The integral values of the signals of the ring carbons of amylopectin (C1,
C2/C3/C5 and C4) show no significant change in 14 days. For ethylene glycol and
amylopectin C6 the development of the curves during storage is depicted in
Figure 6.2. The ethylene glycol curve, although still showing behaviour of a mobile
system, has changed gradually during the 14 days of storage. It appears that the curve
has become a mixture of type I and type II magnetisation. This can be explained by
considering that ethylene glycol is immobilised during the interaction with
amylopectin, as was previously observed with 13C CP/MAS and HP/DEC NMR
spectroscopy [1-3]. The amylopectin C6 curve has also changed considerably, its
minimum value being increased from –1.5 to –0.8. This demonstrates that C6 is
involved in the interaction process. While the change of the ethylene glycol curve is
rather gradual, for C6 the change mainly takes place within 1 day.
-1.50
-1.00
-0.50
0.00
0.50
1.00
0 1 2 3 4 5 6 7 8 9 10
Ti (ms)
Relative Integral T1 C6 day 1 T1 Glycol day 1
T1 C6 day 2 T1 Glycol day 2
T1 C6 day 3 T1 Glycol day 3
T1 C6 day 12 T1 Glycol day 12T1 C6 day 14 T1 Glycol day 14
Figure 6.2 Development of the IRCP curves during storage,
for amylopectin carbon C6 and for ethylene glycol.
Chapter 6
80
(ppm) 4 06 08 0100120
day 1
day 2
day 3
day 14
day 12
ethylene glycol
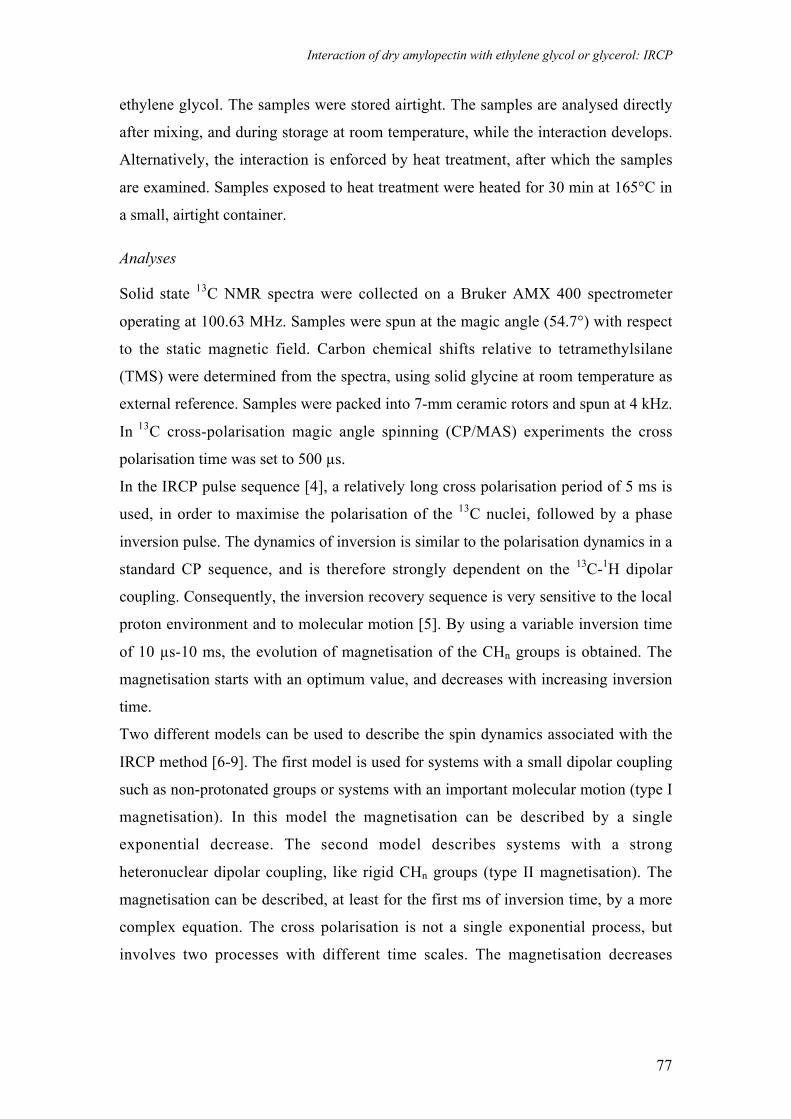
Figure 6.3 CP/MAS NMR spectra of amylopectin with ethylene glycol
during storage at room temperature at days 1, 2, 3, 12, and 14.
(ppm) 4 06 08 0100120
day 1
day 2
day 3
day 14
day 12
ethylene glycol
Figure 6.4 HP/DEC NMR spectra of amylopectin with ethylene glycol
during storage at room temperature at days 1, 2, 3, 12, and 14.
Interaction of dry amylopectin with ethylene glycol or glycerol: IRCP
81
CP/MAS and HP/DEC spectra were also recorded of these samples during storage at
room temperature (Figures 6.3 and 6.4). The CP/MAS spectra show that ethylene
glycol is immobilised during the first 3 days. After 12 days, the signal has broadened,
indicating that the interaction has become less ordered. In the HP/DEC spectra, the
ethylene glycol signal has become broader during storage. An increase of the
amylopectin signals is observed during storage, indicating a mobilisation of
amylopectin caused by the interaction with ethylene glycol. Although the interaction
between ethylene glycol and amylopectin has reached equilibrium in a few days, some
molecular rearrangements (crystal perfection) proceed in a secondary process, as was
shown earlier [1].
Glycerol interaction during storage at room temperature
For freshly mixed glycerol and amylopectin the IRCP curves of the amylopectin
carbons are similar to those of freshly mixed ethylene glycol and amylopectin
(Figure 6.5). The signal at 71 ppm of the central carbon of glycerol overlaps largely
with the amylopectin C2/C3/C5 signal, making it impossible to integrate this peak.
The IRCP curve of the glycerol signal at 63.3 ppm is a little steeper than that of
ethylene glycol in the previous paragraph, indicating that glycerol is somewhat less
mobile. As was found for the interaction of amylopectin with ethylene glycol, the
curves of amylopectin C1, C2/C3/C5 and C4 do not change during storage.
-2.00
-1.50
-1.00
-0.50
0.00
0.50
1.00
0 1 2 3 4 5 6 7 8 9 10
Ti (ms)
Relative Integral T1 C1
T1 C235T1 C4T1 C6T1 Glycerol
Figure 6.5 Relative integral values of the 13C IRCP NMR signals of freshly mixed
amylopectin and glycerol as a function of the phase inversion time.
For glycerol, the signal of the terminal carbon atoms is depicted.
Chapter 6
82
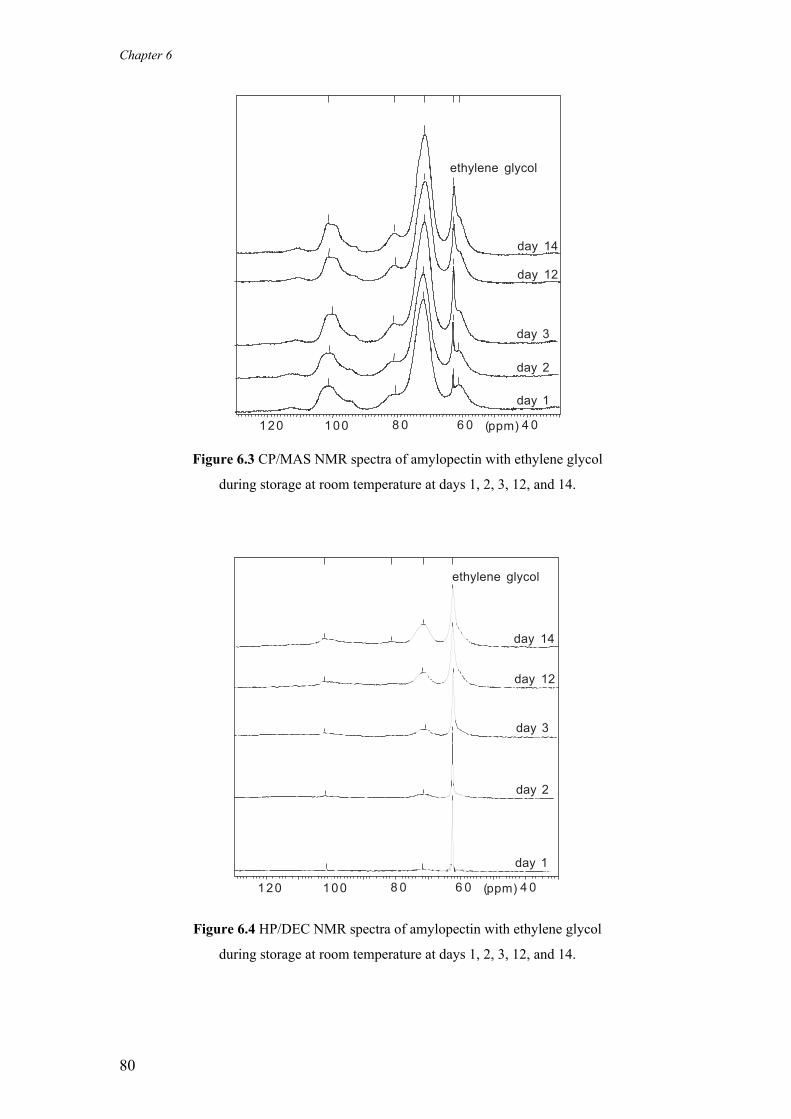
The development of the curves of amylopectin C6 and of the terminal glycerol carbon
atoms during storage at room temperature is depicted in Figure 6.6. There is hardly
any change in the glycerol curve during 25 days of storage. It seems that the mobility
is slightly increased at day 2, after which it remains stable. It may be that glycerol was
temporarily somewhat restrained during the physical mixing process. The curve of the
amylopectin C6 does change significantly during storage, but not as quickly as with
ethylene glycol. Its minimum value increased gradually from –2.0 to –1.4 during the
first 25 days. This more gradual change is in agreement with the fact that glycerol
does not interact with amylopectin as fast as ethylene glycol does, in line with
previous findings [1-3].
-2.00
-1.50
-1.00
-0.50
0.00
0.50
1.00
0 1 2 3 4 5 6 7 8 9 10
Ti (ms)
Relative Integral T1 C6 day 1 T1 Glycerol day 1T1 C6 day 2 T1 Glycerol day 2
T1 C6 day 3 T1 Glycerol day 3
T1 C6 day 25 T1 Glycerol day 25
T1 C6 9.5 months T1 Glycerol 9.5 months
Figure 6.6 Development of the IRCP curves during storage, for amylopectin
carbon C6 and for the terminal glycerol carbon atoms.
After 25 days of storage, the HP/DEC and CP/MAS spectra show that only a small
part of the glycerol has interacted with amylopectin (Figure 6.7). Just a small glycerol
signal is observed in CP/MAS, and in HP/DEC there is a slight broadening of the
glycerol signals. After several months, the IRCP experiment shows a considerable
immobilisation of glycerol, while the C6 curve does not change remarkably. The
HP/DEC spectrum after 9 months of storage at room temperature confirms the
immobilisation of glycerol as observed with IRCP.
Interaction of dry amylopectin with ethylene glycol or glycerol: IRCP
83
100.54 80.55 72.59 63.27 61.33
(ppm) 4 06 08 0100120
72.68 63.27
(ppm) 4 06 08 0100120
Figure 6.7 Solid state CP/MAS (left) and HP/DEC (right) NMR spectra of
amylopectin with glycerol, after storing 25 days at room temperature.
Ethylene glycol interaction after heat treatment
Samples were heated to accomplish the interaction between amylopectin and ethylene
glycol. The integral values of the 13C peaks as a function of the phase inversion time
of the amylopectin/ethylene glycol samples, measured a few hours after heat
treatment, are given in Figure 6.8. The amylopectin curves are much shallower than
those observed for the mixtures stored at room temperature, with a minimum value of
about –0.25.
-0.50
-0.30
-0.10
0.10
0.30
0.50
0.70
0.90
0 1 2 3 4 5 6 7 8 9 10
Ti (ms)
Relative Integral T1 C1T1 C235
T1 C4
T1 C6
T1 Glycol
Figure 6.8 Relative integral of the 13C IRCP NMR signals of amylopectin
and ethylene glycol as a function of the phase inversion time,
several hours after heating for 30 min at 165°C.
Chapter 6
84
The HP/DEC spectra of the heated amylopectin/ethylene glycol samples are depicted
in Figure 6.9. A few hours after heat treatment the ethylene glycol signal is less
intense and broader than that of a sample before heating. The mobility of amylopectin
as detected with HP/DEC is similar to that of the sample stored for 12 days at room
temperature. The IRCP curves of these samples are not similar at all, though. Because
the IRCP measurements are done with a large cross polarisation time, in order to
obtain maximum magnetisation, only the mobility of relatively rigid regions is
measured. It might be that during heat treatment a dislocation of the CHn groups of
amylopectin has taken place due to the interaction with ethylene glycol.
(ppm) 4 06 08 0100120
day 1
day 14
16 months
ethylene glycol
Figure 6.9 HP/DEC NMR spectra of amylopectin with ethylene glycol after heating
for 30 min at 165°C, after a few hours (day 1), 13 days, and 16 months.
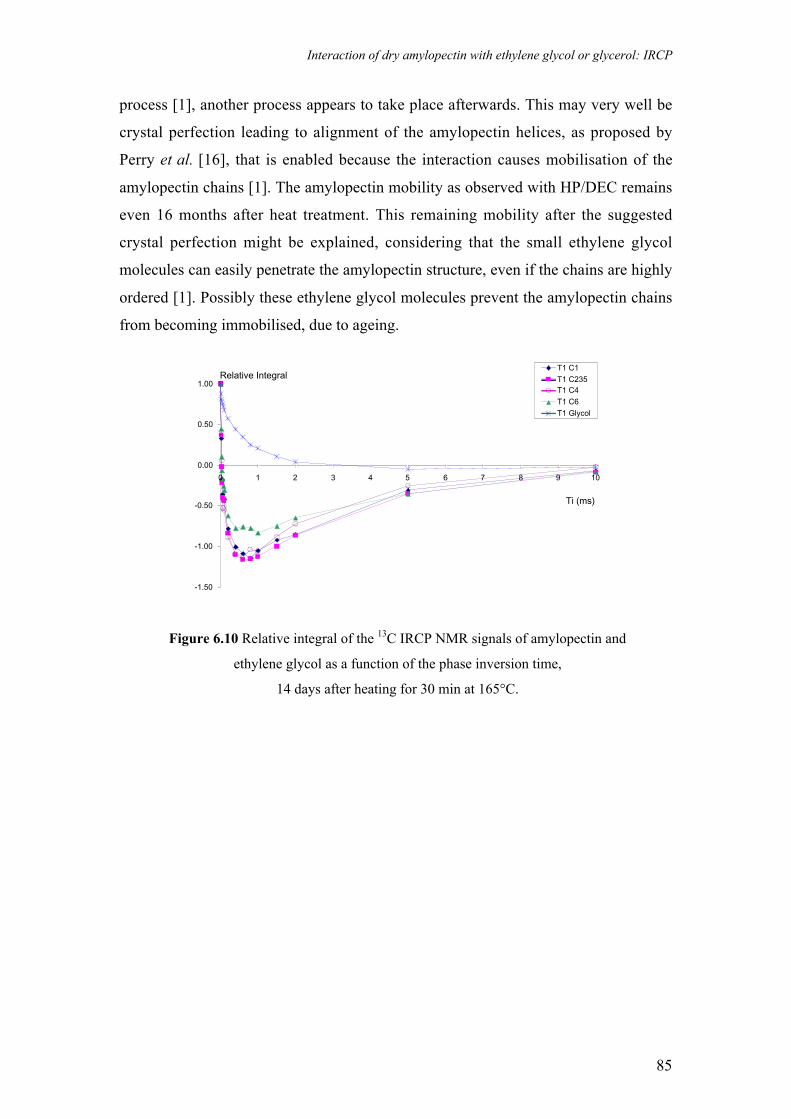
The IRCP curves of the integral values measured 14 days after heat treatment
(Figure 6.10), are similar to those after 14 days of storage at room temperature. At day
14 after heat treatment the amylopectin HP/DEC signals have become eminent,
implying that amylopectin has become significantly mobile. After 16 months, no
significant changes in the IRCP curves are detected compared to the measurement at
day 14 after heat treatment. Apparently the process caused by heating the sample is
not finished directly after heating, but takes up to 14 days. Since the interaction
between amylopectin and ethylene glycol has reached equilibrium during the heating
Interaction of dry amylopectin with ethylene glycol or glycerol: IRCP
85
process [1], another process appears to take place afterwards. This may very well be
crystal perfection leading to alignment of the amylopectin helices, as proposed by
Perry et al. [16], that is enabled because the interaction causes mobilisation of the
amylopectin chains [1]. The amylopectin mobility as observed with HP/DEC remains
even 16 months after heat treatment. This remaining mobility after the suggested
crystal perfection might be explained, considering that the small ethylene glycol
molecules can easily penetrate the amylopectin structure, even if the chains are highly
ordered [1]. Possibly these ethylene glycol molecules prevent the amylopectin chains
from becoming immobilised, due to ageing.
-1.50
-1.00
-0.50
0.00
0.50
1.00
0 1 2 3 4 5 6 7 8 9 10
Ti (ms)
Relative IntegralT1 C1
T1 C235T1 C4
T1 C6
T1 Glycol
Figure 6.10 Relative integral of the 13C IRCP NMR signals of amylopectin and
ethylene glycol as a function of the phase inversion time,
14 days after heating for 30 min at 165°C.
Chapter 6
86
Glycerol interaction after heat treatment
Mixtures of amylopectin and glycerol were subjected to heat treatment in order to
accomplish the interaction between amylopectin and glycerol. The IRCP curves,
measured one day after heating the sample are given in Figure 6.11. The results are
similar to the IRCP curves of amylopectin with ethylene glycol, measured directly
after heating, although the amylopectin curves are even shallower. The minimum
value of the amylopectin curves is about –0.1. The HP/DEC spectra of the heated
amylopectin/glycerol samples are depicted in Figure 6.12. Due to the heat treatment,
the intensity of the signal of the terminal glycerol carbon atoms is reduced and
glycerol is immobilised considerably.
-0.50
-0.30
-0.10
0.10
0.30
0.50
0.70
0.90
0 1 2 3 4 5 6 7 8 9 10
Ti (ms)
Relative Integral T1 C1T1 C235
T1 C4T1 C6
T1 Glycerol
Figure 6.11 Relative integral of the 13C IRCP NMR signals of amylopectin and glycerol as
a function of the phase inversion time, 1 day after heating for 30 min at 165°C.
At day 15 after heat treatment (Figure 6.13), the IRCP curves of amylopectin are less
shallow, but still not as deep as was observed during storage at room temperature.
Apparently, due to glycerol, the process of crystal perfection [1,16], induced by heat
treatment, is slower than with ethylene glycol as plasticiser. The IRCP curve of the
signal of the terminal glycerol carbon atoms does show significant immobilisation. At
day 15 after heat treatment, the HP/DEC signals of amylopectin are clearly visible,
indicating that amylopectin has become mobile.
Interaction of dry amylopectin with ethylene glycol or glycerol: IRCP
87
(ppm) 4 06 08 0100120
day 2
day 15
16 months
glycerol
Figure 6.12 HP/DEC NMR spectra of amylopectin with glycerol after heating for 30 min
at 165°C, after 1 day, 14 days, and 16 months.
-0.50
-0.30
-0.10
0.10
0.30
0.50
0.70
0.90
0 1 2 3 4 5 6 7 8 9 10
Ti (ms)
Relative Integral T1 C1T1 C235
T1 C4T1 C6
T1 Glycerol
Figure 6.13 Relative integral of the 13C IRCP NMR signals of amylopectin and
the terminal glycerol carbon atoms as a function of the phase inversion time,
at day 15 after heating for 30 min at 165°C.
Chapter 6
88
In Figure 6.14 the IRCP measurement 16 months after heating is depicted, which
shows that the C6 curve has become relatively shallow compared to the other
amylopectin curves, similar to C6 of the amylopectin/ethylene glycol mixture after
storage or heat treatment. However, the C4 curve has also undergone a significant
change. Its minimum has changed from –1.0 before heat treatment to –2.1 at 16
months after heat treatment. In contrast to the mixture of amylopectin with ethylene
glycol, the HP/DEC spectrum 16 months after heat treatment shows that the mobility
of amylopectin has practically disappeared, while glycerol has regained mobility.
Interestingly, now that amylopectin is again immobilised, IRCP results show that C6
still appears to be more mobile than the other amylopectin carbons, while C4 seems to
be more rigid.
-2.50
-2.00
-1.50
-1.00
-0.50
0.00
0.50
1.00
0 1 2 3 4 5 6 7 8 9 10
Ti (ms)
Relative Integral T1 C1
T1 C235
T1 C4
T1 C6
T1 Glycerol
Figure 6.14 Relative integral of the 13C IRCP NMR signals of amylopectin and
the terminal glycerol carbon atoms as a function of the phase inversion time,
16 months after heating for 30 min at 165°C.
The CP/MAS spectra show that the immobilisation of glycerol gradually increased
during storage (Figure 6.15). The CP/MAS signal became narrower 16 months after
heat treatment, suggesting that the glycerol molecules that interact with amylopectin,
do so in a more ordered way.
Interaction of dry amylopectin with ethylene glycol or glycerol: IRCP
89
Amylopectin is initially mobilised by the interaction with glycerol, while glycerol is
partly immobilised by this interaction. During continued storage after heat treatment,
amylopectin is immobilised again. This is probably caused by the continuation of the
process of crystal perfection [16]. Unlike ethylene glycol the larger glycerol
molecules are hindered in penetrating the crystals [1]. They primarily interact at the
edges of the crystalline lamellae, and are therefore unable to prevent immobilisation
of the amylopectin chains.
(ppm) 4 06 08 0100120
day 2
day 15
16 months
glycerol
Figure 6.15 CP/MAS NMR spectra of amylopectin with glycerol after heating
for 30 min at 165°C, after 1 day, 14 days, and 16 months.
Conclusions
These results show that Inverse Recovery Cross Polarisation solid state NMR
spectroscopy is a useful technique for examining changes in the molecular mobility in
starch systems. New insights were gained on how starch-plasticiser interactions take
place on a molecular level. When the interaction between dry amylopectin and
ethylene glycol or glycerol develops, the plasticiser mobility decreases and the
amylopectin carbon C6 mobility increases. The mobilities of the other amylopectin
carbons do not change significantly, showing that the interaction mainly occurs at
Chapter 6
90
carbon C6. Chemical modification at the amylopectin carbon C6 can be used to
increase the affinity to plasticiser molecules, in order to reduce starch retrogradation.
Upon heating, the interaction develops fast, after which crystal perfection is suggested
to take place due to this interaction. The process of crystal perfection is slower for
glycerol than for ethylene glycol. Whereas the ethylene glycol molecules penetrate the
crystalline structure, the larger glycerol molecules are hindered in penetrating the
crystals.
When ingredients are premixed prior to processing, the resulting increase in molecular
mobility of amylopectin may influence conditions such as flow properties and
resistance to shear. After processing, the occurrence of crystal perfection gives the
product more strength. The interactions between starch and ethylene glycol or
glycerol may reduce starch retrogradation or recrystallisation, which would improve
the control of the mechanical properties of the product.
References
1 . A.L.M. Smits, P.H. Kruiskamp, J.J.G. van Soest, J.F.G. Vliegenthart, ‘Interactionbetween dry starch and plasticisers glycerol or ethylene glycol, measured by DSC andsolid state NMR spectroscopy’, Chapter 4, to be published,
2. A.L.M. Smits, S.H.D. Hulleman, J.J.G. van Soest, H. Feil and J.F.G. Vliegenthart, ‘Theinfluence of polyols on the molecular organisation in starch-based plastics’, Polym. Adv.Technol. 10 (1999), p 570-573,
3. P.H. Kruiskamp, A.L.M. Smits, J.J.G. van Soest, J.F.G. Vliegenthart, ‘The influence ofplasticiser on the molecular organisation in dry amylopectin measured by differentialscanning calorimetry and solid state nuclear magnetic resonance spectroscopy’, J. Ind.Microbiol. Biotech. 26 (2001), p 90-93,
4. F. Babonneau, J. Maquet, C. Bonhomme, R. Richter, G. Roewer, D. Bahloul, ‘29Si and13C NMR investigation of the polysilane-to-poly(carbosilane) conversion ofpoly(methylchlorosilanes) using Cross-Polarization and Inversion-Recovery Cross-Polarization techniques’, Chem. Mater. 8 (1996), p 1415-1428,
5. X. Wu, S. Zhang, ‘Selective polarization inversion and depolarization of 13C in crossrelaxation in NMR’, Chem. Phys. Lett. 156 (1989), p 79-81,
6. X. Wu, K.W. Zilm, ‘Complete spectral editing in CP/MAS NMR’, J. Magn. Reson. A 102(1993), p 205-213,
7. R. Sangill, N. Rastrup-Andersen, H. Bildsøe, H.J. Jakobsen, N.C. Nielsen, ‘Optimizedspectral editing of 13C MAS NMR spectra of rigid solids using Cross-Polarizationmethods’, J. Magn. Reson. A. 107 (1994), p 67-78,
8 . J. Hirschinger, M. Hervé, ‘Cross-polarization dynamics and spin diffusion in somearomatic compounds’, Solid State NMR 3 (1994), p 121-135,
9. C.Gervais, F. Babonneau, J. Maquet, C. Bonhomme, D. Massiot, E. Framery M. Vaultier,‘15N Cross-Polarization using the Inversion-Recovery Cross-Polarization technique and11B Magic Angle Spinning NMR studies of reference compounds containing B-N Bonds’,Magn. Reson. Chem. 36 (1998), p 407-414,
10. X. Wu, S.T. Burns, K.W. Zilm, ‘Spectral editing in CP/MAS NMR. Generatingsubspectra based on proton multiplicities’, J. Magn. Reson. A 111 (1994), p 29-36,
Interaction of dry amylopectin with ethylene glycol or glycerol: IRCP
91
11. C. Bonhomme, P. Tolédano, J. Maquet, J. Livage, L. Bonhomme-Coury, ‘Studies ofoctameric vinylsilasesquioxane by carbon-13 and silicon-29 cross polarization nuclearmagnetic resonance spectroscopy’, J. Chem. Soc. Dalton Trans.7 (1997), p 1617-1626,
12. P. Tekely, J.J. Delpuech, ‘Mobility and hydrogen distribution in coal as revealed bypolarization inversion in high-resolution solid state 13C CP/MAS NMR’, Fuel 68 (1989),p 947-949,
13. D.G. Cory, W.M. Ritchey, ‘Inversion Recovery Cross-Polarization NMR in solidsemicrystalline polymers’, Macromolecules 22 (1989), p 1611-1615,
14. C. Bonhomme, F. Babonneau, J. Maquet, J. Livage, M. Vaultier, E. Framery, ‘Studies ofmodel organic and inorganic compounds by 15N CP/MAS NMR using InversionRecovery Cross Polarization’, J. Chim. Phys. 92 (1995), p 1881-1884,
15. M.J. Gidley, ‘High-resolution solid-state NMR of food materials’, Trends in Food Sci. &Tech. 3 (1992), p 231-236,
16. P.A. Perry and A.M. Donald, ‘The role of plasticization in starch granule assembly’,Biomacromolecules 1 (2000), p 424-432.