MONITORING AND ASSESSMENT 6-1 January 24, 1995 Updated February 2008 CHAPTER 6 MONITORING AND ASSESSMENT INTRODUCTION The effectiveness of a water quality control program cannot be judged without information supplied by a comprehensive monitoring and assessment program. The State Board, the Regional Boards, and other federal, state, and local agencies monitor water quality throughout the state. Coordination among the agencies is essential to identify data gaps and supplement monitoring efforts as necessary. The results of these programs show where water quality problems exist now and where problems can be expected based on quality trends over time. Monitoring activities in the Santa Ana Region were described as part of Chapter 5 (Plan Assessment) in the 1983 Basin Plan. In this Plan, the discussion has been expanded and updated. New programs have been added and obsolete programs have been deleted. Additionally, this chapter provides a brief description of the databases being used to store and analyze the data collected. This chapter also describes the periodic water quality assessments which are conducted on a statewide basis, using the monitoring data collected. STATE MONITORING PROGRAMS The State Board is the lead agency for statewide monitoring activities. The State Board coordinates extensively with the California Departments of Fish and Game, Water Resources, Health Services, and various federal agencies in its monitoring activities. The objectives of the State’s surveillance and monitoring program are as follows: • To measure the achievement of water quality goals and objectives specified in the Basin Plan; • To measure the specific effects of water quality changes on established beneficial uses; • To measure background conditions of water quality; • To determine long-term trends in water quality; • To locate and identify sources of water pollution that pose an acute, accumulative, and/or chronic threat to the environment; • To provide information needed to compare receiving water quality to mass emissions of pollutants from waste discharge;
Transcript
MONITORING AND ASSESSMENT 6-1 January 24, 1995 Updated February 2008
CHAPTER 6
MONITORING AND ASSESSMENT INTRODUCTION The effectiveness of a water quality control program cannot be judged without information supplied by a comprehensive monitoring and assessment program. The State Board, the Regional Boards, and other federal, state, and local agencies monitor water quality throughout the state. Coordination among the agencies is essential to identify data gaps and supplement monitoring efforts as necessary. The results of these programs show where water quality problems exist now and where problems can be expected based on quality trends over time. Monitoring activities in the Santa Ana Region were described as part of Chapter 5 (Plan Assessment) in the 1983 Basin Plan. In this Plan, the discussion has been expanded and updated. New programs have been added and obsolete programs have been deleted. Additionally, this chapter provides a brief description of the databases being used to store and analyze the data collected. This chapter also describes the periodic water quality assessments which are conducted on a statewide basis, using the monitoring data collected. STATE MONITORING PROGRAMS The State Board is the lead agency for statewide monitoring activities. The State Board coordinates extensively with the California Departments of Fish and Game, Water Resources, Health Services, and various federal agencies in its monitoring activities. The objectives of the State’s surveillance and monitoring program are as follows:
• To measure the achievement of water quality goals and objectives specified in the Basin Plan;
• To measure the specific effects of water quality changes on established
beneficial uses;
• To measure background conditions of water quality;
• To determine long-term trends in water quality;
• To locate and identify sources of water pollution that pose an acute, accumulative, and/or chronic threat to the environment;
• To provide information needed to compare receiving water quality to mass
emissions of pollutants from waste discharge;
MONITORING AND ASSESSMENT 6-2 January 24, 1995 Updated February 2008
• To provide data for determining compliance with permit conditions and to support enforcement actions, if necessary;
• To measure wasteloads discharged to receiving waters and to identify
their effects, and in water quality limited segments, to prepare wasteload allocations necessary to achieve water quality control;
• To provide data needed to carry on the continuing planning process;
• To measure the effects of water rights decisions on water quality and to
guide the State Board in its responsibility to regulate unappropriated water for the control of quality;
• To provide a clearinghouse for the collection and dissemination of water
quality data gathered by other agencies and private parties cooperating in the program; and
• To prepare reports on water quality conditions as required by federal and
state regulations and other users requesting water quality data. The monitoring program provides for collection and analysis of samples and the reporting of water quality data. It includes laboratory support and quality assurance, storage of data for rapid and systematic retrieval and preparation of reports and data summaries. Most important is the interpretation and evaluation of data leading to recommendations for action. The State monitoring program focuses on fresh and marine surface waters. The goal of the State monitoring program is to provide an overall, continuing assessment of water quality in the state. Historically, conventional parameter such as minerals, nutrients, and dissolved oxygen were considered to be the most important parameters. More recently, toxic substances have received increasing attention in federal and state water pollution control activities. The State and Regional Boards are intensifying their efforts to investigate the presence of toxic substances in surface waters and the effects of these substances on aquatic biota. The State program consists of a toxicity monitoring program, the Inland Surface Waters Toxicity Testing Program, and two toxic substances monitoring programs – the Toxic Substances Monitoring Program and State Mussel Watch. Inland Surface Waters Toxicity Testing Program The goal of this program, which was initiated in 1990, is to evaluate the extent, magnitude, nature and sources of toxicity in the waters of the State. Emphasis is on those waters where toxicity is associated with unregulated discharges such as runoff from agriculture, mining or urban areas. As part of this program, a toxicity
MONITORING AND ASSESSMENT 6-3 January 24, 1995 Updated February 2008
testing facility at the University of California, Davis was established to conduct State and Regional Board studies. The Regional Board performs the sampling of the waterbodies in the region and supplies the testing facility with the samples. The toxicity test measures the combined effects of toxics in the water and is not used to separate and identify a specific toxic substance. Toxicity is determined by using water column examples from a waterbody under lab conditions. Appropriate test organisms are observed for their response by using growth, reproduction or mortality as indicators. Two types of toxicity tests are used, acute and chronic, which involve measuring responses in different life stages of the test organisms. In the Santa Ana Region, Big Bear Lake and its tributaries, the Anaheim and Newport Bay Watersheds, Lake Elsinore, and some creeks have been sampled for toxicity as part of this program. Toxic Substances Monitoring Program The Toxic Substances Monitoring Program (TSMP) was initiated in 1976 by the State Board. The TSMP was organized to provide a uniform statewide approach to the detection and evaluation of the occurrence of toxic substances in fresh and estuarine waters of the state. The TSMP primarily targets waterbodies with known or suspected impaired water quality and is not intended to give an overall water quality assessment. Data obtained from the TSMP is used to focus the Regional Board’s attention on those waterbodies impacted by toxic pollutants. Special TSMP or other studies are then conducted to investigate the source(s) of the pollutants. The State Board has contracted with the Department of Fish and Game to perform the monitoring and chemical analyses associated with this program. The presence of toxic substances often cannot be determined by water column sampling due to the low concentrations of toxicants in the water. Also, a number of toxic substances are not water soluble, but can be found associated with sediment or organic matter. The process of bioaccumulation acts to concentrate toxicants through the aquatic food web, sometimes many hundreds of times the levels actually in water. Therefore, in the TSMP the flesh of fish and other aquatic organisms (mainly crayfish) is analyzed to indicate whether any toxic substance is present. Fish livers are analyzed for metals, including arsenic, cadmium, chromium, copper, lead, nickel, silver, and zinc; fish muscle tissue (filet) is analyzed for mercury and selenium. In addition, fish filet and crayfish tail are analyzed for 45 synthetic organic compounds, which include pesticides and PCBs (Table 6-1). When very small-sized fish are available, only whole-body analyses are conducted. The objectives of the Toxic Substances Monitoring Program are as follows:
MONITORING AND ASSESSMENT 6-4 January 24, 1995 Updated February 2008
• To develop statewide baseline data and to demonstrate trends in the occurrence of toxic elements and organic substances in the aquatic biota;
• To assess impacts of accumulated toxicants upon the usability of State waters by man;
• To assess impacts of accumulated toxicants upon the aquatic biota; and • Where problem concentrations of toxicants are detected, to attempt to
identify sources of toxicants and to relate concentrations found in the biota to concentrations found in the water.
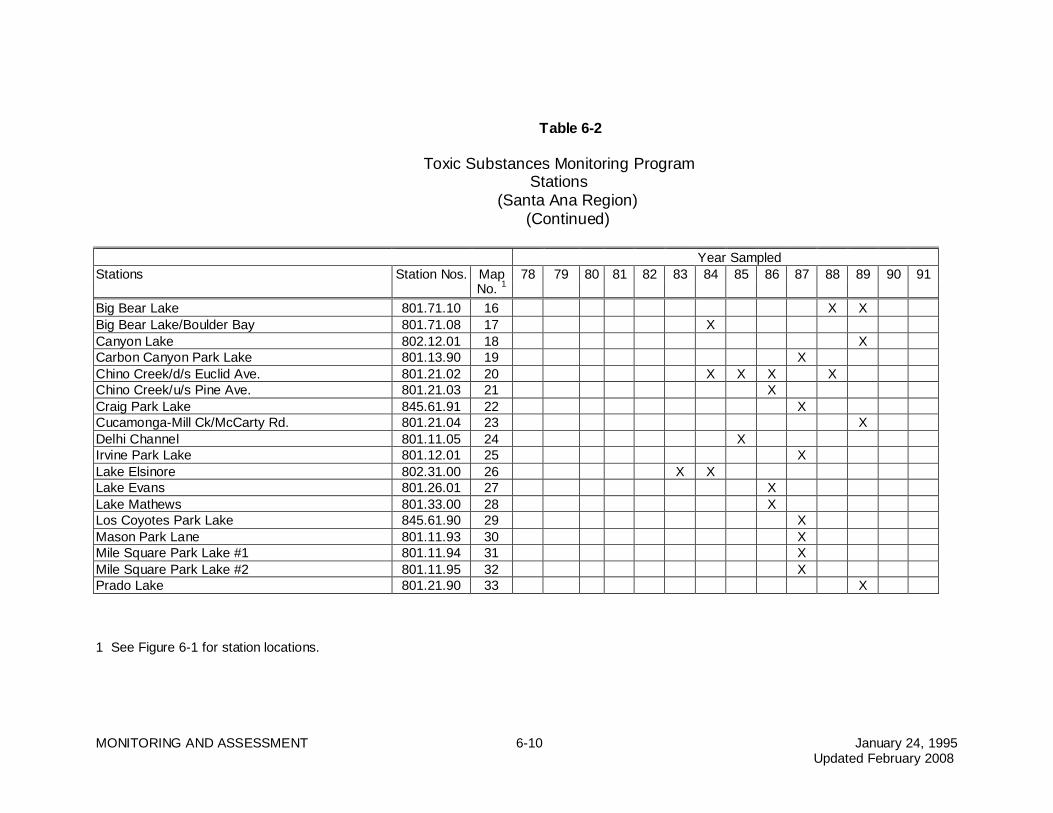
Based upon the priorities identified by the Regional Board and the TSMP, the number and location of the sampling stations and the constituents investigated vary each year. When the program began, streams and lakes were ranked according to various criteria established to indicate their importance to the state in terms of water quality. The priority I, or highest priority, waterbodies were included in the first phase of monitoring. The Santa Ana River was included in this list and the station at Prado Dam has been sampled annually since the program began. The monitoring was expanded to include four other stations on the Santa Ana River and two of its tributaries, Chino and Cucamonga Creeks. A number of sites in the Newport Bay Watershed have also been sampled, largely in response to findings by the State Mussel Watch Program (see below) of high levels of organics and metals in the Bay itself. The results of this TSMP sampling led to an intensive study of toxics in San Diego Creek in 1985. Several stations were added to the program to monitor Anaheim Bay and its tributaries because of similar concerns. A number of the lakes in the region, including several park lakes, have also been sampled in this program. Table 6-2 lists the TSMP sampling sites in the Santa Ana Region (1978-1991). Reports which describe the statewide TSMP sampling program sites, the constituents investigated, and the results have been published annually since 1977. A ten-year data summary was published in 1987. State Mussel Watch Program The State Mussel Watch (SMW) program is the state’s long term marine water quality monitoring program, initiated in 1977. The SMW program provides the state with data showing trends in coastal and estuarine water quality. The Regional Board uses the data from SMW to establish the presence or absence of toxic substances and to monitor the variation in the concentrations detected at the various locations. Using this information, the Regional Board then attempts to locate the sources of the contamination. As with the Toxic Substances Monitoring Program, the State Board contracts with the Department of Fish and Game to perform the sampling and analysis.
• The primary goal of the SMW program are as follows: • To provide long-term monitoring of certain toxic substances levels in
coastal marine waters;
MONITORING AND ASSESSMENT 6-5 January 24, 1995 Updated February 2008
• To provide an important element in comprehensive water quality monitoring strategy; and
• To identify on a year-to-year basis specific areas where concentrations of toxic materials are higher than normal.
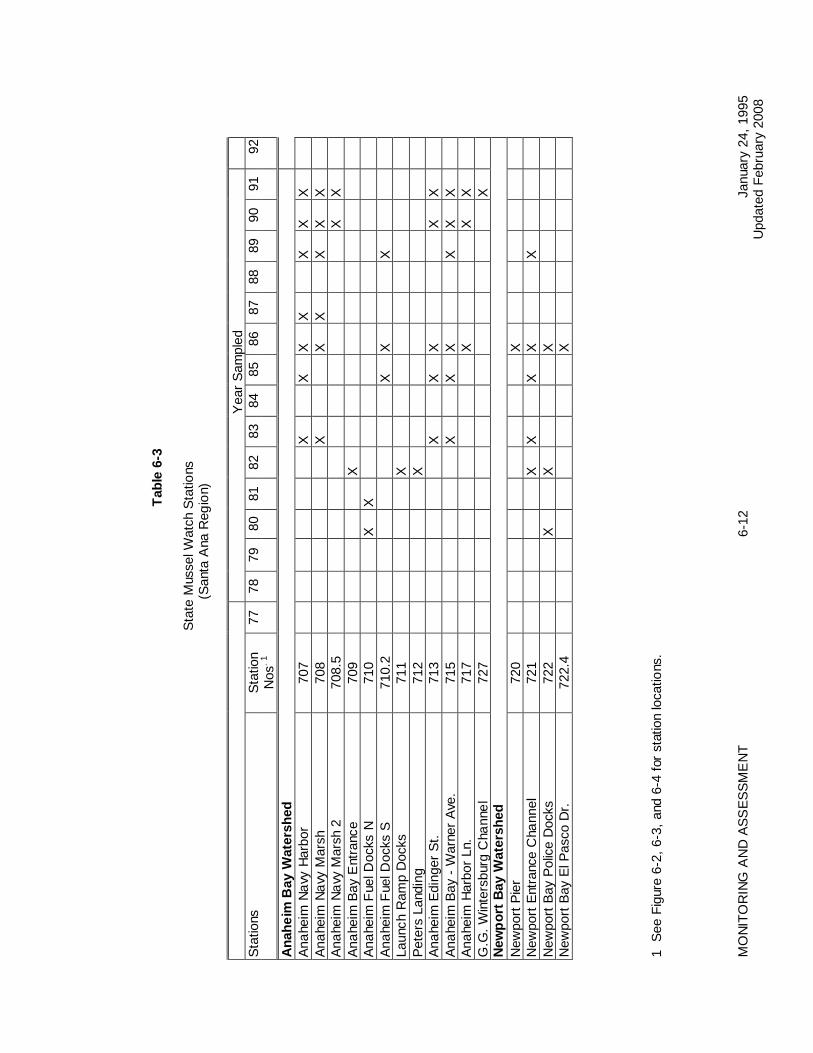
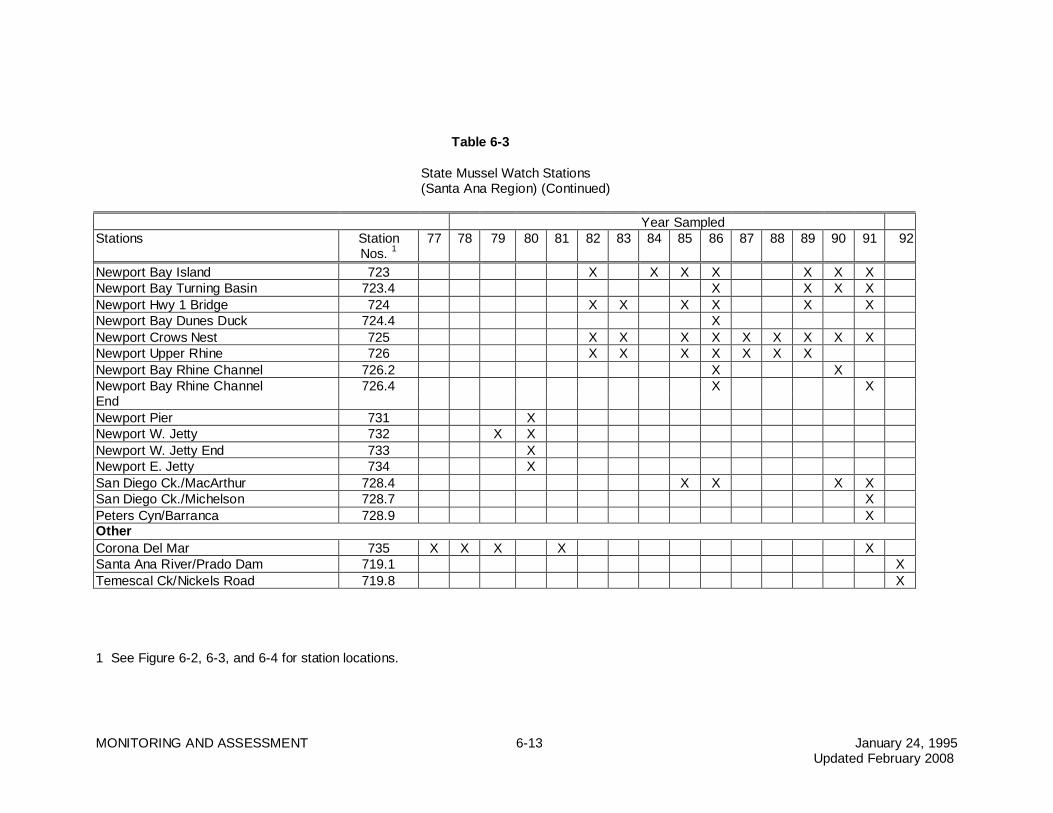
Mussels were chosen for the State Mussel Watch program because: (1) they are common along the California coast; (2) they are immobile in nature, permitting a localized measurement of water quality; (3) they have the ability to concentrate pollutants above ambient seawater levels; and (4) they provide a time-averaged sample. Where freshwater tributaries are suspected sources of toxics, freshwater clams are used. The trace metals analyzed in mussel and clam tissues are similar to those investigated by the Toxic Substances Monitoring Program and include aluminum, cadmium, chromium, copper, lead, manganese, mercury, nickel, silver, and zinc. Synthetic organic compounds analyzed are listed in Table 6-1. As with the Toxic Substances Monitoring Program, the number and location of SMW sites investigated varies each year, according to program needs and resource constraints. Several key areas in the Santa Ana Region are frequently sampled in this program (See Table 6-3). Anaheim Bay/Huntington Harbour area sampling locations include the Anaheim Navy Harbor, Anaheim Navy Marsh, Anaheim Bay at Edinger Street, and Anaheim Bay at Warner Avenue. In the Newport area, the most frequently sampled stations include Newport Bay Island, Newport Bay at Hwy 1 Bridge, Newport Bay at Crows Nest, Rhine Channel, and Newport Bay/Upper Rhine Channel. As with the TSMP, statewide SMW reports are published annually and a ten-year data summary for 1977-1987 is available. REGIONAL MONITORING PROGRAMS The regional monitoring programs are grouped with local agencies’ programs because they are, for the most part, cooperative efforts. The sampling frequency, sampling stations, constituents, and other details vary from year to year, depending on needs and budgets of the Regional Board and local agencies. The regional monitoring effort consists of the following: 1. Surface Water Monitoring 2. Groundwater Monitoring 3. Compliance Monitoring 4. Complaint Investigation 5. Intensive Surveys 6. Aerial Surveillance 7. Stormwater Monitoring
MONITORING AND ASSESSMENT 6-6 January 24, 1995 Updated February 2008
Surface Water Monitoring With the exception of the annual sampling of the Santa Ana River at Prado Dam, the Regional Board’s surface water monitoring program is not strictly formalized. The sampling frequency, locations, constituents, and other details vary from year to year depending on identified problems and needs, and on staff and funding availability. A number of other agencies conduct surface water monitoring programs in the region, including water purveyors, wastewater dischargers, and flood control agencies. The Regional Board makes every effort to coordinate its monitoring activities with these other agencies to maximize the collection and exchange of data, as well as the use of resources. This Basin Plan specifies water quality objectives applicable to Reach 3 of the Santa Ana River for TDS, nitrogen, and other constituents which are set on the baseflow of the River (see Chapter 4). To determine compliance with these objectives, the Basin Plan requires that sampling of the River be conducted annually at Prado Dam. As directed by the Basin Plan, Board staff conducts the sampling during August, when the quantity and quality of baseflow is most consistent. Staff then reports the results to the Board. The results of this program are used to assess the effectiveness of the Board’s regulatory programs and to determine whether changes, such as revisions to the TDS and nitrogen wasteload allocations, are necessary. Groundwater Monitoring The regional groundwater monitoring program depends upon the cooperation of local agencies to ensure that data are collected. The Region’s municipal water supply districts sample their potable water wells to assure that the public health regulations are met. The sample results are also submitted to the Regional Board. This Region relies greatly on groundwater computer models for basin planning studies. The groundwater quality data is collected by numerous agencies. The Regional Board contributes to the collection effort. All data will be collected in a computer database compiled by the Santa Ana Watershed Project Authority. Compliance Monitoring Under this program, data is collected and used to determine compliance with discharge requirements and receiving water standards, and to support enforcement actions and waste discharge prohibitions. The data are collected from self-monitoring reports generated by waste dischargers and from compliance monitoring reports prepared by Regional Board staff. Self-monitoring reports submitted to the Regional Board are reviewed, and if violations are noted, appropriate action is taken, ranging from administrative
MONITORING AND ASSESSMENT 6-7 January 24, 1995 Updated February 2008
enforcement to judicial abatement, depending on the circumstances. Self-monitoring report data have also been used to develop pollutant loads and to measure general water quality conditions in the receiving water.
MONITORING AND ASSESSMENT 6-8 January 24, 1995 Updated February 2008
Table 6-1
Synthetic Organic Compounds Analyzed in the State Mussel Watch
and Toxic Substances Monitoring Programs
Aldrin p,p'-DDMU delta-Lindane Chlorbenside o,p'-DDT Total Lindane 2
alpha-Chlordane p,p'-DDT Methoxychlor gamma-Chlordane Total DDT Methyl Parathion
1 These constituents are analyzed only in the State Mussel Watch Program 2 These constituents are analyzed only in the Toxic Substances Monitoring Program
MONITORING AND ASSESSMENT 6-9 January 24, 1995 Updated February 2008
Table 6-2 Toxic Substances Monitoring Program Stations (Santa Ana Region)
Year Sampled Stations Station Nos. Map 78 79 80 81 82 83 84 85 86 87 88 89 90 91
No. 1 Anaheim Bay Watershed Bolsa Chica Channel/Westminster Ave. 801.11.08 1 X X X E.G.G. Wintersburg Chnl/Beach Blvd. 801.11.90 2 X E.G.G. Wintersburg Chnl/Gothard St. 801.11.02 3 X X Huntington Harbour/Anaheim Bay 801.11.00 4 X Ocean View Chnl/Beach Blvd. 801.11.03 5 X X Ocean View Chnl/Brookhurst St. 801.11.91 6 X Ocean View Chnl/Newhope St. 801.11.92 7 X Westminster Chnl/Graham St. 801.11.01 8 X X Newport Bay Watershed Newport Bay 801.11.97 9 X Peters Canyon Channel 801.11.96 10 X X X San Diego Ck/Barranca Pkwy 801.11.09 11 X X X San Diego Ck/Laguna Rd. 801.11.13 12 X San Diego Ck/Michelson Dr. 801.11.07 13 X X X X X X X X X San Diego Ck/Upper Newport Bay 801.11.04 14 X X X Other Anza Channel 801.26.03 15 X X
1 See Figure 6-1 for station locations.
MONITORING AND ASSESSMENT 6-10 January 24, 1995 Updated February 2008
Big Bear Lake 801.71.10 16 X X Big Bear Lake/Boulder Bay 801.71.08 17 X Canyon Lake 802.12.01 18 X Carbon Canyon Park Lake 801.13.90 19 X Chino Creek/d/s Euclid Ave. 801.21.02 20 X X X X Chino Creek/u/s Pine Ave. 801.21.03 21 X Craig Park Lake 845.61.91 22 X Cucamonga-Mill Ck/McCarty Rd. 801.21.04 23 X Delhi Channel 801.11.05 24 X Irvine Park Lake 801.12.01 25 X Lake Elsinore 802.31.00 26 X X Lake Evans 801.26.01 27 X Lake Mathews 801.33.00 28 X Los Coyotes Park Lake 845.61.90 29 X Mason Park Lane 801.11.93 30 X Mile Square Park Lake #1 801.11.94 31 X Mile Square Park Lake #2 801.11.95 32 X Prado Lake 801.21.90 33 X
1 See Figure 6-1 for station locations.
MONITORING AND ASSESSMENT 6-11 January 24, 1995 Updated February 2008
Table 6-2 Toxic Substances Monitoring Program Stations (Santa Ana Region) (Continued) Year Sampled
Santa Ana River/Featherly Park 801.13.03 34 X Santa Ana River/Hammer Ave. 801.21.05 35 X Santa Ana River/Imperial Hwy 801.13.00 36 X Santa Ana River/Prado Dam 801.25.00 37 X X X X X X X X X X X X X Santa Ana River/USGS Gage 801.21.09 38 X X Yorba Park Lake 801.13.91 39 X
1 See Figure 6-1 for station locations.
MO
NIT
OR
ING
AN
D A
SS
ES
SM
EN
T
6-
12
Janu
ary
24, 1
995
Upd
ated
Feb
ruar
y 20
08
Tab
le 6
-3
S
tate
Mus
sel W
atch
Sta
tions
(
San
ta A
na R
egio
n)
Y
ear
Sam
pled
S
tatio
ns
Sta
tion
77
78
79
80
81
82
83
84
85
86
87
88
89
90
91
92
N
os. 1
A
nahe
im B
ay W
ater
shed
Ana
heim
Nav
y H
arbo
r 70
7
X
X
X
X
X
X
X
A
nahe
im N
avy
Mar
sh
708
X
X
X
X
X
X
A
nahe
im N
avy
Mar
sh 2
70
8.5
X
X
A
nahe
im B
ay E
ntra
nce
709
X
Ana
heim
Fue
l Doc
ks N
71
0
X
X
Ana
heim
Fue
l Doc
ks S
71
0.2
X
X
X
La
unch
Ram
p D
ocks
71
1
X
P
eter
s La
ndin
g 71
2
X
A
nahe
im E
ding
er S
t. 71
3
X
X
X
X
X
A
nahe
im B
ay -
War
ner
Ave
. 71
5
X
X
X
X
X
X
Ana
heim
Har
bor
Ln.
717
X
X
X
G
.G. W
inte
rsbu
rg C
hann
el
727
X
New
por
t B
ay W
ater
shed
New
port
Pie
r
720
X
New
port
Ent
ranc
e C
hann
el
721
X
X
X
X
X
New
port
Bay
Pol
ice
Doc
ks
722
X
X
X
New
port
Bay
El P
asco
Dr.
72
2.4
X
1 S
ee F
igur
e 6-
2, 6
-3, a
nd 6
-4 fo
r st
atio
n lo
catio
ns.
MONITORING AND ASSESSMENT 6-13 January 24, 1995 Updated February 2008
Table 6-3 State Mussel Watch Stations (Santa Ana Region) (Continued) Year Sampled
Newport Bay Island 723 X X X X X X X Newport Bay Turning Basin 723.4 X X X X Newport Hwy 1 Bridge 724 X X X X X X Newport Bay Dunes Duck 724.4 X Newport Crows Nest 725 X X X X X X X X X Newport Upper Rhine 726 X X X X X X X Newport Bay Rhine Channel 726.2 X X Newport Bay Rhine Channel 726.4 X X End Newport Pier 731 X Newport W. Jetty 732 X X Newport W. Jetty End 733 X Newport E. Jetty 734 X San Diego Ck./MacArthur 728.4 X X X X San Diego Ck./Michelson 728.7 X Peters Cyn/Barranca 728.9 X Other Corona Del Mar 735 X X X X X Santa Ana River/Prado Dam 719.1 X Temescal Ck/Nickels Road 719.8 X
1 See Figure 6-2, 6-3, and 6-4 for station locations.
MONITORING AND ASSESSMENT 6-14 January 24, 1995 Updated February 2008
MONITORING AND ASSESSMENT 6-15 January 24, 1995 Updated February 2008
MONITORING AND ASSESSMENT 6-16 January 24, 1995 Updated February 2008
MONITORING AND ASSESSMENT 6-17 January 24, 1995 Updated February 2008
MONITORING AND ASSESSMENT 6-18 January 24, 1995 Updated February 2008
Compliance Monitoring (Continued form page 6-6) The lowest concentration by which permit compliance is reliably measured is called the Practical Quantification Level (PQL). The PQL is used and taken into account when establishing waste discharge limits. PQLs will be developed using all available information, and will be established based upon information obtained from regional laboratories. The Regional Board requires the initiation of a Toxicity Reduction Evaluation (TRE) if a discharge consistently exceeds its chronic toxicity effluent limit. The Regional Board, to date, has interpreted the “consistency exceeds” trigger as the failures of three successive monthly toxicity tests, each conducted on separate samples. Initiation of the TRE has also been conditioned on a determination that a sufficient level of toxicity exists to permit effective application of the analytical techniques required by a TRE. The Regional Board also encourages the development of scientifically sound toxicity test quality control and standardized interpretation criteria to improve the accuracy and reliability of chronic toxicity demonstrations. Compliance monitoring also involves staff inspections of regulated and unregulated sites and includes observations made by staff members and/or results of analyses performed on samples collected by staff members. Complaint Investigation This program involves the investigation of complaints from citizens and public governmental agencies regarding the discharge of wastes or creation of nuisance conditions. It is a Regional Board responsibility which includes field studies, preparation of reports and letters, and other necessary follow-up actions to document observed conditions and to initiate appropriate corrective actions. Intensive Surveys Intensive monitoring surveys provide detailed water quality data to locate and evaluate violations of receiving water standards and to make wasteload allocations. They usually involved localized, intermittent sampling at higher than normal frequency. These surveys are performed in water quality-limited segments or hydrologic units which require additional sampling data to supplement the routine monitoring program results. The surveys are specially designed to evaluate water quality problems. Beneficial use surveys are executed to aid in the review of the Basin Plan’s water quality standards. This periodic review, entitled a “triennial review,” is required in the
MONITORING AND ASSESSMENT 6-19 January 24, 1995 Updated February 2008
Clean Water Act. Intensive surveys have been performed on the middle Santa Ana River, Lake Elsinore, Lytle Creek, Mill Creek, San Diego Creek, Newport Bay, Huntington Harbour, and Strawberry Creek. The Clean Lakes Program is specified in Section 314 of the Clean Water Act, and requires that all publicly owned freshwater lakes be identified and classified according to their trophic conditions. If a lake’s condition is not known, a Clean Lakes Program survey may be performed to assess its water quality condition. If the trophic quality of the lake is determined not to protect its beneficial uses, the pollution sources and potential restorative measures are to be identified. The above actions may be conducted under a Clean Lake grant received from the federal government. Clean lake grant-funded studies of Lake Elsinore and Big Bear Lake are currently in progress. Aerial Surveillance Aerial surveillance is used primarily to gather photographic records of discharges and water quality conditions in the Region. Aerial surveillance is particularly effective because of the overall view of a facility that is obtained and because many facilities can be observed in a short period of time. Municipal Stormwater Monitoring The stormwater permitting program has been established to protect the water quality of the waterbodies which receive stormwater runoff. See Chapter 5 for a complete description of this program. Sampling of first-flush phenomena has indicated that stormwater discharges contain significant amounts of pollutants. Therefore, the Region’s municipal stormwater permits require the permittees to develop comprehensive management and monitoring programs. Because each permit generally covers a large number of waterbodies, the required monitoring program is in two phases. Phase I requires the discharger to sample those receiving waters where the beneficial uses are threatened or impaired due to runoff of stormwater and urban nuisance water. Under Phase II the dischargers will be required to develop stormwater management and monitoring programs for the remaining waterbodies included under the permit. Stormwater discharges from urbanized areas consist mainly of surface runoff emanating from residential, commercial, and industrial areas. In addition, there are stormwater discharges from agricultural and other land uses. The constituents of concern in these discharges include: total and fecal coliform, enterococcus, total suspended solids, biochemical oxygen demand, chemical oxygen demand, total organic carbon, oil and grease, heavy metals, nutrients, base/neutral and acid extractibles, pesticides, herbicides, petroleum hydrocarbon products, and/or those causing extremely high or low pH.
MONITORING AND ASSESSMENT 6-20 January 24, 1995 Updated February 2008
The objectives of the stormwater monitoring programs are to: 1) define the type, magnitude, and sources of pollutants in the stormwater discharges within the permittee’s jurisdiction so that appropriate pollution prevention and correction measures can be identified; 2) evaluate the effectiveness of pollution prevention and correction measures; and 3) evaluate compliance with water quality objectives established for the stormwater system or its components. QUALITY ASSURANCE / QUALITY CONTROL The purpose of the Quality Assurance Program is to ensure that data generated from environmental measurement studies are technically sound and legally defensible. A State Quality Assurance (QA) Program Plan was prepared under authority of the State Board in April 1990 describing how the State and Regional Boards will implement and manage the QA program. This Plan was approved by the State Board and the US EPA, Region IX, to meet requirements for federal funding. The federal regulation requiring the State to develop and implement a QA Program is written in EPA Order 5360.1, April 3, 1993. The mandate is identified in 40 CFR 30.503 (July 1, 1987) requiring State agencies involved in environmentally-related measurement projects to develop and implement a Quality Assurance Program for programs partially or fully supported by Federal funds. This mandate further requires that a QA Program Plan be developed that describes how a State agency will implement and manage a QA Program. It also requires that a QA Project Plan be prepared and approved prior to the start of any field or laboratory activities. A State’s QA Program Plan must be approved by the federal award official before federal funds can be released. QA Project Plans are approved by a state’s designated QA Officer and are available for federal review. The State Board has appointed a QA Program Manager to direct and coordinate the overall program. Each State Board division and Regional Board has appointed a QA Officer to administer their respective QA responsibilities. The State and Regional Boards jointly administer the program but the State Board has lead responsibility for managing the overall program and reporting to EPA. The Regional Board’s QA Officer interacts with project managers on the required preparation of QA Project Plans for studies involving field and laboratory activities. The Project Plans should outline project objectives, data quality objectives in which management decisions will be based, and field and laboratory procedures that will be used to achieve the objectives. Once completed, the Plan must be reviewed and approved by an agency QA Officer or, when problems arise, by the State Board QA Program Manager before any field work can begin. Guidelines on Plan preparation have been distributed to the State and Regional Board QA Officers.
MONITORING AND ASSESSMENT 6-21 January 24, 1995 Updated February 2008
ASSESSMENT PROGRAMS There are several statewide water quality assessments which are performed periodically. The assessments are used to evaluate the effectiveness of the Regional Boards’ water quality programs to determine if making any changes are needed. Water Quality Assessment The Water Quality Assessment (WQA) is a catalog of the State’s waterbodies and their water quality condition. The WQA identifies the water quality condition as good, intermediate, impaired or unknown. The data used to categorize waterbodies in the WQA are obtained from the various monitoring programs identified previously. All Regional Boards adopted their regional WQA at public meetings and submitted them to the State Board for inclusion in the State WQA. In addition, for impaired and high priority waters, factsheets were prepared to provide additional detail. The State Board intends the WQA to be updated on a regular basis, generally every two years. The WQA serves many different purposes. The WQA, a public document, reports the condition of the State’s waterbodies in a summary format. The lists of impaired waterbodies, included in the WQA, satisfy several Clean Water Act listing requirements. These federal lists are identified by the applicable Clean Water Act (CWA) section or Code of Federal Regulation (CFR) number. These include: • CWA 303(d) – Water Quality Limited Segments where water quality objectives
will not be met even with the Best Available Treatment/Best Control Technology (BAT/BCT)
• CFR 131.11 – Segments which may be affected by or warrant concern due to
toxics • CWA 314 – Lake Priorities • CWA 319 – Nonpoint Source Impacted Waters • CWA 304(I) (“Long List”) – Waters designated as impaired because narrative or
numeric objectives are violated or beneficial uses are impaired similar to CWA Section 303(d).
• CWA 304(s) (“Short List”) – Waters not meeting water quality objectives
because of toxics from point source discharges • CWA 304(m) (“Mini List”) – Waters not meeting water quality objectives because
of toxics from either point or nonpoint sources.
MONITORING AND ASSESSMENT 6-22 January 24, 1995 Updated February 2008
WQA Water Quality Condition Classification For each region, the individual waterbodies are listed. They are identified by water resource type, i.e., bays and harbors, wetlands, coastal waters, estuaries, lakes and reservoirs, groundwater, rivers and streams, and saline lakes. An entire waterbody may be classified with one water quality condition or divided by segments into more than one. Good: waters that support and enhance the designated beneficial uses.
Waterbodies classified as good may be designated a high priority if a threat to water quality is present.
Intermediate: waters that support designated beneficial uses while there is
occasional degradation of water quality. Waterbodies suspected of impairment but for which there is inadequate data to conclude impairment are also given this classification.
Impaired: waters not reasonably expected to attain or maintain applicable water
quality standards. Standards include both numeric and narrative water quality objectives and the beneficial uses the objectives are intended to protect.
Unknown: waters with unknown water quality where limited or no direct
observations are available. The WQA also provides the foundation for the State Board’s Clean Water Strategy process. The current regional WQA and the associated factsheets are included as Appendix VII. Clean Water Strategy The Clean Water Strategy (CWS) is a process that the State Board implemented to assure that staff and fiscal resources are directed at the highest priority water quality issues throughout California. The primary objective of the CWS is to more effectively define and respond to priorities as revealed by the best available water quality information. A CWS goal is to link State and Regional Board programs together in directing actions on individual waterbodies. The CWS relies on the Water Quality Assessment condition ratings to provide the technical information necessary to identify waterbodies needing protection or prevention actions, additional assessment or cleanup activities. In addition to the Water Quality Assessment, the regions determined the relative resource value of their waterbodies to recognize the relative importance of individual waters when compared to each other. The regions developed priority waterbody lists which are based upon the severity of their water quality problems or needs and relative resource values, from which the State Board assembled a statewide priority list based upon the same criteria.
MONITORING AND ASSESSMENT 6-23 January 24, 1995 Updated February 2008
There are six phases involved in implementing the Clean Water Strategy. As of this date, phases 1 and 2 have been completed. The State Board has begun a pilot study to determine the feasibility of phases 3 through 6. Phase 1: Obtain the best information 2: Compare and prioritize waterbody concerns 3: Prioritize actions to address concerns 4: Allocate new resources 5: Implement strategy goals 6: Review results 305(b) Report The 305(b) Report, also known as the National Water Quality Inventory Report, is a summary of all states’ water quality reports compiled by the Environmental protection Agency. The report is prepared biennially from information that states are required to submit pursuant to Section 305(b)(1) of the Clean Water Act. The State Board prepares the State report using information taken from the WQA. The State 305(b) Report includes: (a) a description of the water quality of major navigable waters in the State during the preceding years; (b) and analysis of the extent to which significant navigable waters provide for the protection and propagation of a balanced population of shellfish, fish, and wildlife, and allow recreational activities in and on the water; (c) an analysis of the extent to which elimination of the discharge of pollutants is being employed or will be needed; and (d) estimates of the environmental impact, the economic and social costs necessary to achieve the “no discharge” objective of the Clean Water Act, the economic and social benefits of such achievement, and the dates of such achievement. The report also recommends programs which must be implemented to achieve the CWA goals. DATA MANAGEMENT Regional Modeling Efforts SAGIS/ADSS: The Santa Ana Watershed Project Authority Planning Department has devised a modeling program and system called the Advanced Decision Support System (ADSS) to aid in the development of long-range plans to meet water quality and quantity objectives (ARC/INFO is the trademark of the Environmental Systems Research Institute’s copyrighted program. Although this product is mentioned in the Basin Plan, the Santa Ana Regional Board is not endorsing any commercial products). The ADSS creates a central data storage facility standardizing data collection, storage, and retrieval. The core of the ADSS is the Santa Ana
MONITORING AND ASSESSMENT 6-24 January 24, 1995 Updated February 2008
Geographic Information Systems (SAGIS). SAGIS is an ARC/INFO¹-based water resource analysis and graphic tool written in ARC Marco Language. SAGIS includes a library of various geographic overlays to create custom base maps for water resource data. The system also allows the user to view data stored in tabular form and plot the results versus time. SAGIS will produce a variety of water quality and quantity analysis maps and plots. SAGIS includes a comprehensive landuse database of the Santa Ana River Basin to project future water needs. Regional Databases STORET: STORET, which stands for STOrage and RETrieval, is a national database system that contains environmental monitoring data relating to the water quality within this Regional Board’s boundaries and throughout the United States. These data are the result of field and laboratory analyses performed on samples gathered from streams, lakes, estuaries, groundwater, and other waterbodies. The STORET system resides on an IBM 3090 mainframe computer maintained by the US EPA at the National Computer Center in North Carolina. The original database has evolved into a more comprehensive system capable of performing a broad range of analyses, as well as serving as the depository for data. In California, stations are sampled, in part, by the following agencies: California Department of Water Resources, U.S. Geographical Survey, California Department of Health Services, and the Regional Boards. The Regional Boards, as well as the State Board, EPA, and other regulatory agencies utilize the STORET database to examine the causes and effects of water pollution, to measure compliance with water quality objectives and maintenance of beneficial uses, and to determine water quality trends. SABRINA: Another part of the ADSS is the Santa Ana Relational Database Management System, or SABRINA. Developed by SAWPA, SABRINA is a menu-driven application written in a database language and stores the data used by SAGIS. ¹ ARC/INFO is the trademark of the Environmental Systems Research Institute’s copyrighted program. Although this product is mentioned in the Basin Plan, the Santa Ana Regional Board is not endorsing any commercial products.
MONITORING AND ASSESSMENT 6-25 January 24, 1995 Updated February 2008
REFERENCES California Regional Water Quality Control Board – Santa Ana Region, “Newport Bay Clean Water Strategy – A Report and Recommendations for Future Actions,” September, 1989. California State Water Resources Control Board, “California State Mussel Watch, Ten Year Data Summary 1977-1987, WQMR No. 87-3,” May, 1988. California Regional Water Quality Control Board, Santa Ana Region, Staff Report, “State Mussel Watch Results, 1987-1988 and 1988-1989, Item 21,” February 9, 1990. California Sate Water Resources Control Board, “Toxic Substances Monitoring Program, 1988-89, 91-1WQ,” June, 1991. California State Water Resources Control Board, “Toxic Substances Monitoring Program, Ten year Summary Report 1978-1987, 90-1WQ,” August, 1990. California Regional Water Quality Control Board, Santa Ana Region, “Newport Bay Clean Water Strategy, A Report and Recommendations for Future Action,” September, 1989. United Sates Environmental Protection Agency, “STORET Documentation for Menu-Driven User Interface,” February, 1992.