161 6.1 Why Use Net Present Value? This chapter, as well as the next two, focuses on capital budgeting, the decision-making process for accepting or rejecting projects. This chapter develops the basic capital budget- ing methods, leaving much of the practical application to subsequent chapters. But we don’t have to develop these methods from scratch. In Chapter 4, we pointed out that a dol- lar received in the future is worth less than a dollar received today. The reason, of course, is that today’s dollar can be reinvested, yielding a greater amount in the future. And we showed in Chapter 4 that the exact worth of a dollar to be received in the future is its present value. Furthermore, Section 4.1 suggested calculating the net present value of any project. That is, the section suggested calculating the difference between the sum of the present values of the project’s future cash flows and the initial cost of the project. The net present value (NPV) method is the first one to be considered in this chapter. We begin by reviewing the approach with a simple example. Then, we ask why the method leads to good decisions. CHAPTER 6 Net Present Value and Other Investment Rules Find out more about cap- ital budgeting for small businesses at www. missouribusiness.net. In 2005, the automobile market in North America faced chronic overcapacity. By some estimates, General Motors may have had as many as 15 factories more than it needed. But not all automobile manufacturers faced this problem. For example, Toyota Motors announced plans for its seventh North American assembly plant, and then began a search for a site to accommodate its eighth North American plant. Each plant represents an investment of $1 billion or more. For example, Toyota’s truck factory in southern Indiana was built at a cost of $2.5 billion. Toyota’s new plants are an example of a capital budgeting decision. Decisions such as these, with a price tag of over $1 billion each, are obviously major undertakings, and the risks and rewards must be carefully weighed. In this chapter, we discuss the basic tools used in making such decisions. In Chapter 1, we saw that increasing the value of the stock in a company is the goal of financial management. Thus, what we need to know is how to tell whether a particular investment will achieve that. This chapter considers a variety of techniques that are used in practice for this purpose. More important, it shows how many of these techniques can be misleading, and it explains why the net present value approach is the right one.
Transcript
161
6.1 Why Use Net Present Value?This chapter, as well as the next two, focuses on capital budgeting, the decision-making process for accepting or rejecting projects. This chapter develops the basic capital budget-ing methods, leaving much of the practical application to subsequent chapters. But we don’t have to develop these methods from scratch. In Chapter 4, we pointed out that a dol-lar received in the future is worth less than a dollar received today. The reason, of course, is that today’s dollar can be reinvested, yielding a greater amount in the future. And we showed in Chapter 4 that the exact worth of a dollar to be received in the future is its present value. Furthermore, Section 4.1 suggested calculating the net present value of any project. That is, the section suggested calculating the difference between the sum of the present values of the project’s future cash fl ows and the initial cost of the project. The net present value (NPV) method is the fi rst one to be considered in this chapter. We begin by reviewing the approach with a simple example. Then, we ask why the method leads to good decisions.
C H A P T E R
6 Net Present Value and Other Investment Rules
Find out more about cap-ital budgeting for small
businesses at www.missouribusiness.net.
In 2005, the automobile market in North America faced chronic overcapacity. By some estimates, General Motors may have had as many as 15 factories more than it needed. But not all automobile manufacturers faced this problem. For example, Toyota Motors announced plans for its seventh North American assembly plant, and then began a search for a site to accommodate its eighth North American plant. Each plant represents an investment of $1 billion or more. For example, Toyota’s truck factory in southern Indiana was built at a cost of $2.5 billion. Toyota’s new plants are an example of a capital budgeting decision. Decisions such as these, with a
price tag of over $1 billion each, are obviously major under takings, and the risks and rewards must be carefully weighed. In this chapter, we discuss the basic tools used in making such decisions. In Chapter 1, we saw that increasing the value of the stock in a company is the goal of fi nancial management. Thus, what we need to know is how to tell whether a particular investment will achieve that. This chapter con siders a variety of techniques that are used in practice for this purpose. More important, it shows how many of these techniques can be misleading, and it explains why the net present value approach is the right one.
ros05902_ch06.indd 161ros05902_ch06.indd 161 9/25/06 9:56:45 AM9/25/06 9:56:45 AM
The basic investment rule can be generalized thus:
Accept a project if the NPV is greater than zero.
Reject a project if NPV is less than zero.
We refer to this as the NPV rule. Why does the NPV rule lead to good decisions? Consider the following two strategies available to the managers of Alpha Corporation:
1. Use $100 of corporate cash to invest in the project. The $107 will be paid as a divi-dend in one year.
2. Forgo the project and pay the $100 of corporate cash as a dividend today.
If strategy 2 is employed, the stockholder might deposit the dividend in a bank for one year. With an interest rate of 6 percent, strategy 2 would produce cash of $106 (� $100 � 1.06) at the end of the year. The stockholder would prefer strategy 1 because strategy 2 produces less than $107 at the end of the year. Our basic point is this: Accepting positive NPV projects benefi ts the stockholders. How do we interpret the exact NPV of $0.94? This is the increase in the value of the fi rm from the project. For example, imagine that the fi rm today has productive assets worth $V and has $100 of cash. If the fi rm forgoes the project, the value of the fi rm today would simply be:
$V � $100
If the fi rm accepts the project, the fi rm will receive $107 in one year but will have no cash today. Thus, the fi rm’s value today would be:
$
$
.V +
107
1 06
The difference between these equations is just $0.94, the present value of Equation 6.1. Thus: The value of the fi rm rises by the NPV of the project. Note that the value of the fi rm is merely the sum of the values of the different projects, divisions, or other entities within the fi rm. This property, called value additivity, is quite important. It implies that the contribution of any project to a fi rm’s value is simply the NPV of the project. As we will see later, alternative methods discussed in this chapter do not generally have this nice property.
EX
AM
PL
E 6
.1 Net Present Value The Alpha Corporation is considering investing in a riskless project cost-ing $100. The project receives $107 in one year and has no other cash fl ows. The discount rate is 6 percent. The NPV of the project can easily be calculated as
$. $
$.
94 100107
1 06= − +
(6.1)
From Chapter 4, we know that the project should be accepted because its NPV is positive. Had the NPV of the project been negative, as would have been the case with an interest rate greater than 7 percent, the project should be rejected.
ros05902_ch06.indd 162ros05902_ch06.indd 162 9/25/06 9:56:47 AM9/25/06 9:56:47 AM
Chapter 6 Net Present Value and Other Investment Rules 163
One detail remains. We assumed that the project was riskless, a rather implausible as-sumption. Future cash fl ows of real-world projects are invariably risky. In other words, cash fl ows can only be estimated, rather than known. Imagine that the managers of Alpha expect the cash fl ow of the project to be $107 next year. That is, the cash fl ow could be higher, say $117, or lower, say $97. With this slight change, the project is risky. Suppose the project is about as risky as the stock market as a whole, where the expected return this year is per-haps 10 percent. Then 10 percent becomes the discount rate, implying that the NPV of the project would be:
− = − +$ . $
$
.2 73 100
107
1 10
Because the NPV is negative, the project should be rejected. This makes sense: A stockholder of Alpha receiving a $100 dividend today could invest it in the stock market, expecting a 10 percent return. Why accept a project with the same risk as the market but with an expected return of only 7 percent? Conceptually, the discount rate on a risky project is the return that one can expect to earn on a fi nancial asset of comparable risk. This discount rate is often referred to as an opportunity cost because corporate investment in the project takes away the stockholder’s opportunity to invest the dividend in a financial asset. If the actual calculation of the discount rate strikes you as extremely diffi cult in the real world, you are probably right. Although you can call a bank to find out the current interest rate, whom do you call to find the expected return on the market this year? And, if the risk of the project differs from that of the market, how do you make the adjustment? However, the calculation is by no means impossible. We forgo the calculation in this chapter, but we present it in later chapters of the text. Having shown that NPV is a sensible approach, how can we tell whether alternative methods are as good as NPV? The key to NPV is its three attributes:
1. NPV uses cash fl ows. Cash fl ows from a project can be used for other corporate pur-poses (such as dividend payments, other capital budgeting projects, or payments of corporate interest). By contrast, earnings are an artifi cial construct. Although earn-ings are useful to accountants, they should not be used in capital budgeting because they do not represent cash.
2. NPV uses all the cash fl ows of the project. Other approaches ignore cash fl ows beyond a particular date; beware of these approaches.
3. NPV discounts the cash fl ows properly. Other approaches may ignore the time value of money when handling cash fl ows. Beware of these approaches as well.
6.2 The Payback Period Method
Defi ning the RuleOne of the most popular alternatives to NPV is payback. Here is how payback works: Con-sider a project with an initial investment of �$50,000. Cash fl ows are $30,000, $20,000, and $10,000 in the fi rst three years, respectively. These fl ows are illustrated in Figure 6.1. A useful way of writing down investments like the preceding is with the notation
(�$50,000, $30,000, $20,000, $10,000)
ros05902_ch06.indd 163ros05902_ch06.indd 163 9/25/06 9:56:47 AM9/25/06 9:56:47 AM
164 Part II Valuation and Capital Budgeting
The minus sign in front of the $50,000 reminds us that this is a cash outfl ow for the inves-tor, and the commas between the different numbers indicate that they are received—or if they are cash outfl ows, that they are paid out—at different times. In this example we are assuming that the cash fl ows occur one year apart, with the fi rst one occurring the moment we decide to take on the investment. The fi rm receives cash fl ows of $30,000 and $20,000 in the fi rst two years, which add up to the $50,000 original investment. This means that the fi rm has recovered its invest-ment within two years. In this case two years is the payback period of the investment. The payback period rule for making investment decisions is simple. A particular cutoff date, say two years, is selected. All investment projects that have payback periods of two years or less are accepted, and all of those that pay off in more than two years—if at all—are rejected.
Problems with the Payback MethodThere are at least three problems with payback. To illustrate the fi rst two problems, we consider the three projects in Table 6.1. All three projects have the same three-year payback period, so they should all be equally attractive—right? Actually, they are not equally attractive, as can be seen by a comparison of different pairs of projects.
Problem 1: Timing of Cash Flows within the Payback Period Let us compare project A with project B. In years 1 through 3, the cash fl ows of project A rise from $20 to $50, while the cash fl ows of project B fall from $50 to $20. Because the large cash fl ow of $50 comes earlier with project B, its net present value must be higher. Nevertheless, we just saw that the payback periods of the two projects are identical. Thus, a problem with the payback method is that it does not consider the timing of the cash fl ows within the payback period. This example shows that the payback method is inferior to NPV because, as we pointed out earlier, the NPV method discounts the cash fl ows properly.
Problem 2: Payments after the Payback Period Now consider projects B and C, which have identical cash fl ows within the payback period. However, project C is clearly preferred because it has a cash fl ow of $60,000 in the fourth year. Thus, another problem
Table 6.1Expected Cash Flows for Projects A through C ($)
$30,000 $20,000 $10,000Figure 6.1Cash Flows of an Investment Project
ros05902_ch06.indd 164ros05902_ch06.indd 164 9/25/06 9:56:48 AM9/25/06 9:56:48 AM
Chapter 6 Net Present Value and Other Investment Rules 165
with the payback method is that it ignores all cash fl ows occurring after the payback period. Because of the short-term orientation of the payback method, some valuable long-term projects are likely to be rejected. The NPV method does not have this fl aw because, as we pointed out earlier, this method uses all the cash fl ows of the project.
Problem 3: Arbitrary Standard for Payback Period We do not need to refer toTable 6.1 when considering a third problem with the payback method. Capital markets help us estimate the discount rate used in the NPV method. The riskless rate, perhaps proxied by the yield on a Treasury instrument, would be the appropriate rate for a riskless investment. Later chapters of this textbook show how to use historical returns in the capital markets to estimate the discount rate for a risky project. However, there is no comparable guide for choosing the payback cutoff date, so the choice is somewhat arbitrary.
Managerial PerspectiveThe payback method is often used by large, sophisticated companies when making rela-tively small decisions. The decision to build a small warehouse, for example, or to pay for a tune-up for a truck is the sort of decision that is often made by lower-level management. Typically, a manager might reason that a tune-up would cost, say, $200, and if it saved $120 each year in reduced fuel costs, it would pay for itself in less than two years. On such abasis the decision would be made. Although the treasurer of the company might not have made the decision in the same way, the company endorses such decision making. Why would upper management con-done or even encourage such retrograde activity in its employees? One answer would be that it is easy to make decisions using payback. Multiply the tune-up decision into 50 such decisions a month, and the appeal of this simple method becomes clearer. The payback method also has some desirable features for managerial control. Just as important as the investment decision itself is the company’s ability to evaluate the man-ager’s decision-making ability. Under the NPV method, a long time may pass before one decides whether a decision was correct. With the payback method we know in two years whether the manager’s assessment of the cash fl ows was correct. It has also been suggested that fi rms with good investment opportunities but no avail-able cash may justifi ably use payback. For example, the payback method could be used by small, privately held fi rms with good growth prospects but limited access to the capital markets. Quick cash recovery enhances the reinvestment possibilities for such fi rms. Finally, practitioners often argue that standard academic criticisms of payback overstate any real-world problems with the method. For example, textbooks typically make fun of payback by positing a project with low cash infl ows in the early years but a huge cash infl ow right after the payback cutoff date. This project is likely to be rejected under the payback method, though its acceptance would, in truth, benefit the firm. Project C in our Table 6.1 is an example of such a project. Practitioners point out that the pattern of cash flows in these textbook examples is much too stylized to mirror the real world. In fact, a number of execu-tives have told us that for the overwhelming majority of real-world projects, both payback and NPV lead to the same decision. In addition, these executives indicate that if an invest-ment like project C were encountered in the real world, decision makers would almost cer-tainly make ad hoc adjustments to the payback rule so that the project would be accepted. Notwithstanding all of the preceding rationale, it is not surprising to discover that as the decisions grow in importance, which is to say when fi rms look at bigger projects, NPV becomes the order of the day. When questions of controlling and evaluating the manager become less important than making the right investment decision, payback is used less fre-quently. For big-ticket decisions, such as whether or not to buy a machine, build a factory, or acquire a company, the payback method is seldom used.
ros05902_ch06.indd 165ros05902_ch06.indd 165 9/25/06 9:56:49 AM9/25/06 9:56:49 AM
166 Part II Valuation and Capital Budgeting
Summary of PaybackThe payback method differs from NPV and is therefore conceptually wrong. With its arbi-trary cutoff date and its blindness to cash fl ows after that date, it can lead to some fl agrantly foolish decisions if it is used too literally. Nevertheless, because of its simplicity, as well as its other mentioned advantages, companies often use it as a screen for making the myriad minor investment decisions they continually face. Although this means that you should be wary of trying to change approaches such as the payback method when you encounter them in companies, you should probably be care-ful not to accept the sloppy financial thinking they represent. After this course, you would do your company a disservice if you used payback instead of NPV when you had a choice.
6.3 The Discounted Payback Period MethodAware of the pitfalls of payback, some decision makers use a variant called the discounted payback period method. Under this approach, we fi rst discount the cash fl ows. Then we ask how long it takes for the discounted cash fl ows to equal the initial investment. For example, suppose that the discount rate is 10 percent and the cash fl ows on a proj-ect are given by:
(�$100, $50, $50, $20)
This investment has a payback period of two years because the investment is paid back in that time. To compute the project’s discounted payback period, we fi rst discount each of the cash fl ows at the 10 percent rate. These discounted cash fl ows are:
The discounted payback period of the original investment is simply the payback period for these discounted cash fl ows. The payback period for the discounted cash fl ows is slightly less than three years because the discounted cash fl ows over the three years are $101.80 (� $45.45 � 41.32 � 15.03). As long as the cash fl ows and discount rate are positive, the discounted payback period will never be smaller than the payback period because discount-ing reduces the value of the cash fl ows. At fi rst glance discounted payback may seem like an attractive alternative, but on closer inspection we see that it has some of the same major fl aws as payback. Like payback, discounted payback fi rst requires us to make a somewhat magical choice of an arbitrary cutoff period, and then it ignores all cash fl ows after that date. If we have already gone to the trouble of discounting the cash fl ows, any small appeal to simplicity or to managerial control that payback may have has been lost. We might just as well add up all the discounted cash fl ows and use NPV to make the decision. Although discounted payback looks a bit like NPV, it is just a poor compromise between the payback method and NPV.
6.4 The Average Accounting Return Method
Defi ning the RuleAnother attractive, but fatally fl awed, approach to fi nancial decision making is the average accounting return. The average accounting return is the average project earnings after taxes and depreciation, divided by the average book value of the investment during its life.
ros05902_ch06.indd 166ros05902_ch06.indd 166 9/25/06 9:56:50 AM9/25/06 9:56:50 AM
Chapter 6 Net Present Value and Other Investment Rules 167
It is worth examining Table 6.2 carefully. In fact, the fi rst step in any project assess-ment is a careful look at projected cash fl ows. First-year sales for the store are estimated to be $433,333. Before-tax cash fl ow will be $233,333. Sales are expected to rise and expenses are expected to fall in the second year, resulting in a before-tax cash fl ow of $300,000. Competition from other stores and the loss in novelty will reduce before-tax cash fl ow to $166,667, $100,000, and $33,333, respectively, in the next three years. To compute the average accounting return (AAR) on the project, we divide the average net income by the average amount invested. This can be done in three steps.
Step 1: Determining Average Net Income Net income in any year is net cash fl ow minus depreciation and taxes. Depreciation is not a cash outfl ow.1 Rather, it is a charge refl ecting the fact that the investment in the store becomes less valuable every year. We assume the project has a useful life of fi ve years, at which time it will be worthless. Because the initial investment is $500,000 and because it will be worthless in fi ve years, we assume that it loses value at the rate of $100,000 each year. This steady loss in value of $100,000 is called straight-line depreciation. We subtract both depreciation and taxes from before-tax cash fl ow to derive net income, as shown in Table 6.2. Net income is $100,000
1Depreciation will be treated in more detail in the next chapter.
EX
AM
PL
E 6
.2 Average Accounting Return Consider a company that is evaluating whether to buy a store in a new mall. The purchase price is $500,000. We will assume that the store has an estimated life of five years and will need to be completely scrapped or rebuilt at the end of that time. The projected yearly sales and expense fi gures are shown in Table 6.2.
Table 6.2 Projected Yearly Revenue and Costs for Average Accounting Return
Average net income =+ +($ , , ,100 000 150 000 50 0000 0 50 000
550 000
+ −=
, )$ ,
Average investment =+
=$ ,
$ ,500 000 0
2250 000
AAR = =$ ,$ ,
%50 000250 000
20
*Corporate tax rate � tc. The tax rebate in year 5 of �$16,667 occurs if the rest of the fi rm is profi table. Here the loss in the project reduces the taxes of the entire fi rm.
In spite of its fl aws, the average accounting return method is worth examining because it is used frequently in the real world.
in the fi rst year, $150,000 in year 2, $50,000 in year 3, zero in year 4, and �$50,000 in the last year. The average net income over the life of the project is therefore:
Step 2: Determining Average Investment We stated earlier that, due to depreciation, the investment in the store becomes less valuable every year. Because depreciation is $100,000 per year, the value at the end of year zero is $500,000, the value at the end of year 1 is $400,000, and so on. What is the average value of the investment over the life of the investment? The mechanical calculation is:
We divide by 6, not 5, because $500,000 is what the investment is worth at the beginning of the fi ve years and $0 is what it is worth at the beginning of the sixth year. In other words, there are six terms in the parentheses of Equation 6.2.
Step 3: Determining AAR The average return is simply:
AAR = =
$ ,
$ ,%
50 000
250 00020
If the fi rm had a targeted accounting rate of return greater than 20 percent, the project would be rejected; if its targeted return were less than 20 percent, it would be accepted.
Analyzing the Average Accounting Return MethodBy now you should be able to see what is wrong with the AAR method. The most important flaw with AAR is that it does not work with the right raw materi-als. It uses net income and book value of the investment, both of which come from the accounting books. Accounting numbers are somewhat arbitrary. For example, certain cash outfl ows, such as the cost of a building, are depreciated under current accounting rules. Other flows, such as maintenance, are expensed. In real-world situations, the decision to de-preciate or expense an item involves judgment. Thus, the basic inputs of the AAR method, income and average investment, are affected by the accountant’s judgment. Conversely, the NPV method uses cash flows. Accounting judgments do not affect cash flow. Second, AAR takes no account of timing. In the previous example, the AAR would have been the same if the $100,000 net income in the fi rst year had occurred in the last year. However, delaying an infl ow for fi ve years would have lowered the NPV of the investment. As mentioned earlier in this chapter, the NPV approach discounts properly. Third, just as payback requires an arbitrary choice of the cutoff date, the AAR method offers no guidance on what the right targeted rate of return should be. It could be the dis-count rate in the market. But then again, because the AAR method is not the same as the present value method, it is not obvious that this would be the right choice. Given these problems, is the AAR method employed in practice? Like the payback method, the AAR (and variations of it) is frequently used as a “backup” to discounted cash fl ow methods. Perhaps this is so because it is easy to calculate and uses accounting num-bers readily available from the fi rm’s accounting system. In addition, both stockholders and the media pay a lot of attention to the overall profi tability of a fi rm. Thus, some managers
(6.2)
ros05902_ch06.indd 168ros05902_ch06.indd 168 9/25/06 9:56:52 AM9/25/06 9:56:52 AM
Chapter 6 Net Present Value and Other Investment Rules 169
may feel pressured to select projects that are profi table in the near term, even if the projects come up short in terms of NPV. These managers may focus on the AAR of individual proj-ects more than they should.
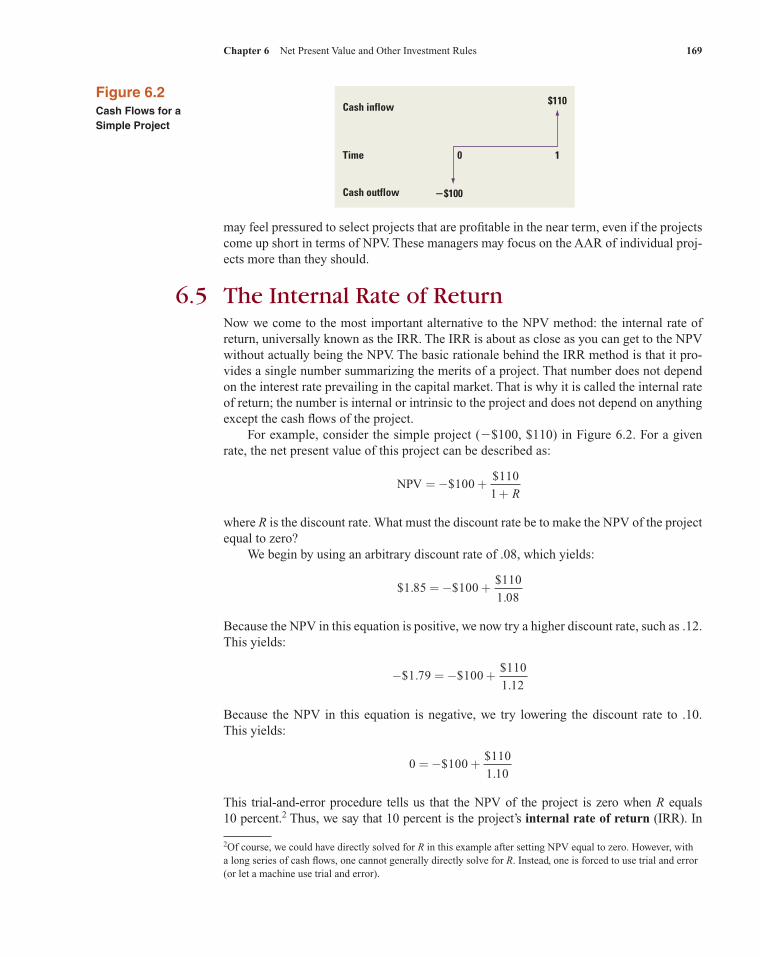
6.5 The Internal Rate of ReturnNow we come to the most important alternative to the NPV method: the internal rate of return, universally known as the IRR. The IRR is about as close as you can get to the NPV without actually being the NPV. The basic rationale behind the IRR method is that it pro-vides a single number summarizing the merits of a project. That number does not depend on the interest rate prevailing in the capital market. That is why it is called the internal rate of return; the number is internal or intrinsic to the project and does not depend on anything except the cash fl ows of the project. For example, consider the simple project (�$100, $110) in Figure 6.2. For a given rate, the net present value of this project can be described as:
NPV = − +
+$
$100
110
1 R
where R is the discount rate. What must the discount rate be to make the NPV of the project equal to zero? We begin by using an arbitrary discount rate of .08, which yields:
$ . $
$
.1 85 100
110
1 08= − +
Because the NPV in this equation is positive, we now try a higher discount rate, such as .12. This yields:
− = − +$ . $
$
.1 79 100
110
1 12
Because the NPV in this equation is negative, we try lowering the discount rate to .10. This yields:
0 100
110
1 10= − +$
$
.
This trial-and-error procedure tells us that the NPV of the project is zero when R equals 10 percent.2 Thus, we say that 10 percent is the project’s internal rate of return (IRR). In
Figure 6.2Cash Flows for a Simple Project
2Of course, we could have directly solved for R in this example after setting NPV equal to zero. However, with a long series of cash fl ows, one cannot generally directly solve for R. Instead, one is forced to use trial and error (or let a machine use trial and error).
Cash inflow
Time
Cash outflow �$100
0 1
$110
ros05902_ch06.indd 169ros05902_ch06.indd 169 9/25/06 9:56:53 AM9/25/06 9:56:53 AM
170 Part II Valuation and Capital Budgeting
Figure 6.3Cash Flows for a More Complex Project
Discount Rate NPV
20% $10.65 30 �18.39
general, the IRR is the rate that causes the NPV of the project to be zero. The implication of this exercise is very simple. The fi rm should be equally willing to accept or reject the project if the discount rate is 10 percent. The fi rm should accept the project if the discount rate is below 10 percent. The fi rm should reject the project if the discount rate is above10 percent. The general investment rule is clear:
Accept the project if the IRR is greater than the discount rate. Reject the project if the IRR is less than the discount rate.
We refer to this as the basic IRR rule. Now we can try the more complicated example (�$200, $100, $100, $100) in Figure 6.3. As we did previously, let’s use trial and error to calculate the internal rate of return. We try 20 percent and 30 percent, yielding the following:
3One can derive the IRR directly for a problem with an initial outflow and up to four subsequent inflows. In the case of two subsequent inflows, for example, the quadratic formula is needed. In general, however, only trial and error will work for an outflow and five or more subsequent inflows.
After much more trial and error, we find that the NPV of the project is zero when the dis-count rate is 23.37 percent. Thus, the IRR is 23.37 percent. With a 20 percent discount rate, the NPV is positive and we would accept it. However, if the discount rate were 30 percent, we would reject it. Algebraically, IRR is the unknown in the following equation:3
0 200
100
1
100
1
100
1= − +
++
++
+$
$ $
(
$
(IRR IRR) IRR)2 3
Figure 6.4 illustrates what the IRR of a project means. The figure plots the NPV as a function of the discount rate. The curve crosses the horizontal axis at the IRR of 23.37 percent because this is where the NPV equals zero. It should also be clear that the NPV is positive for discount rates below the IRR and negative for discount rates above the IRR. This means that if we accept projects like this one when the discount rate is less than the IRR, we will be accepting positive NPV projects. Thus, the IRR rule coincides exactly with the NPV rule. If this were all there were to it, the IRR rule would always coincide with the NPV rule. This would be a wonderful discovery because it would mean that just by computing the
Cash inflow
Time
Cash outflow �$200
0 1 2 3
$100 $100 $100
ros05902_ch06.indd 170ros05902_ch06.indd 170 9/25/06 9:56:54 AM9/25/06 9:56:54 AM
Chapter 6 Net Present Value and Other Investment Rules 171
IRR for a project we would be able to tell where it ranks among all of the projects we are considering. For example, if the IRR rule really works, a project with an IRR of 20 percent will always be at least as good as one with an IRR of 15 percent. But the world of finance is not so kind. Unfortunately, the IRR rule and the NPV rule are the same only for examples like the one just discussed. Several problems with the IRR approach occur in more complicated situations.
6.6 Problems with the IRR Approach
Defi nition of Independent and Mutually Exclusive ProjectsAn independent project is one whose acceptance or rejection is independent of the accep-tance or rejection of other projects. For example, imagine that McDonald’s is considering putting a hamburger outlet on a remote island. Acceptance or rejection of this unit is likely to be unrelated to the acceptance or rejection of any other restaurant in its system. The remote-ness of the outlet in question ensures that it will not pull sales away from other outlets. Now consider the other extreme, mutually exclusive investments. What does it mean for two projects, A and B, to be mutually exclusive? You can accept A or you can accept B or you can reject both of them, but you cannot accept both of them. For example, A might be a decision to build an apartment house on a corner lot that you own, and B might be a decision to build a movie theater on the same lot. We now present two general problems with the IRR approach that affect both indepen-dent and mutually exclusive projects. Then we deal with two problems affecting mutually exclusive projects only.
Two General Problems Affecting Both Independent and Mutually Exclusive ProjectsWe begin our discussion with project A, which has the following cash flows:
(�$100, $130)
Figure 6.4Net Present Value (NPV) and Discount Rates for a More Complex Project
10 20 30 40
IRR
23.37
�$18.39
$0
$10.65
$100
Discount rate (%)N
PV
The NPV is positive for discount rates below the IRR and negative for discount rates above the IRR.
ros05902_ch06.indd 171ros05902_ch06.indd 171 9/25/06 9:56:55 AM9/25/06 9:56:55 AM
172 Part II Valuation and Capital Budgeting
The IRR for project A is 30 percent. Table 6.3 provides other relevant information about the project. The relationship between NPV and the discount rate is shown for this project in Figure 6.5. As you can see, the NPV declines as the discount rate rises.
Problem 1: Investing or Financing? Now consider project B, with cash flows of:
($100, �$130)
These cash flows are exactly the reverse of the flows for project A. In project B, the firm receives funds first and then pays out funds later. While unusual, projects of this type do exist. For exam-ple, consider a corporation conducting a seminar where the participants pay in advance. Because large expenses are frequently incurred at the seminar date, cash inflows precede cash outflows. Consider our trial-and-error method to calculate IRR:
− = + −
= + −
= +
$ $$
.
$ $$
.
$ . $
4 100130
1 25
0 100130
1 30
3 70 1100130
1 35−
$
.
As with project A, the internal rate of return is 30 percent. However, notice that the net present value is negative when the discount rate is below 30 percent. Conversely, the net pres-ent value is positive when the discount rate is above 30 percent. The decision rule is exactly
Table 6.3 The Internal Rate of Return and Net Present Value
Project A Project B Project C
Dates: 0 1 2 0 1 2 0 1 2
Cash flows �$100 $130 $100 �$130 �$100 $230 �$132IRR 30% 30% 10% and 20%NPV @10% $18.2 �$18.2 0Accept if market rate �30% �30% �10% but �20%Financing or investing Investing Financing Mixture
Figure 6.5 Net Present Value and Discount Rates for Projects A, B, and C
NPV
NPV
NPVDiscount
rate (%)Discountrate (%)
Discountrate (%)
Project A
$30
030
�$30
30
Project B
10 20
�$100
�$2
Approaches� 100 when R
Project C
Project A has a cash outfl ow at date 0 followed by a cash infl ow at date 1. Its NPV is negatively related to the discount rate.Project B has a cash infl ow at date 0 followed by a cash outfl ow at date 1. Its NPV is positively related to the discount rate.Project C has two changes of sign in its cash fl ows. It has an outfl ow at date 0, an infl ow at date 1, and an outfl ow at date 2.Projects with more than one change of sign can have multiple rates of return.
ros05902_ch06.indd 172ros05902_ch06.indd 172 9/25/06 9:56:55 AM9/25/06 9:56:55 AM
Chapter 6 Net Present Value and Other Investment Rules 173
the opposite of our previous result. For this type of a project, the following rule applies:
Accept the project when the IRR is less than the discount rate. Reject the project when the IRR is greater than the discount rate.
This unusual decision rule follows from the graph of project B in Figure 6.5. The curve is upward sloping, implying that NPV is positively related to the discount rate. The graph makes intuitive sense. Suppose the firm wants to obtain $100 immediately. It can either (1) accept project B or (2) borrow $100 from a bank. Thus, the project is actu-ally a substitute for borrowing. In fact, because the IRR is 30 percent, taking on project B is tantamount to borrowing at 30 percent. If the firm can borrow from a bank at, say, only 25 percent, it should reject the project. However, if a firm can borrow from a bank only at, say, 35 percent, it should accept the project. Thus project B will be accepted if and only if the discount rate is above the IRR.4
This should be contrasted with project A. If the firm has $100 of cash to invest, it can either (1) accept project A or (2) lend $100 to the bank. The project is actually a substitute for lending. In fact, because the IRR is 30 percent, taking on project A is tantamount to lending at 30 percent. The firm should accept project A if the lending rate is below 30 per-cent. Conversely, the firm should reject project A if the lending rate is above 30 percent. Because the firm initially pays out money with project A but initially receives money with project B, we refer to project A as an investing type project and project B as a financing type project. Investing type projects are the norm. Because the IRR rule is reversed for financing type projects, be careful when using it with this type of project.
Problem 2: Multiple Rates of Return Suppose the cash flows from a project are:
(�$100, $230, �$132)
Because this project has a negative cash flow, a positive cash flow, and another negative cash flow, we say that the project’s cash flows exhibit two changes of sign, or “flip-flops.” Although this pattern of cash flows might look a bit strange at first, many projects require outflows of cash after receiving some inflows. An example would be a strip-mining project. The first stage in such a project is the initial investment in excavating the mine. Profits from operating the mine are received in the second stage. The third stage involves a further investment to reclaim the land and satisfy the requirements of environmental protection legislation. Cash flows are negative at this stage. Projects financed by lease arrangements may produce a similar pattern of cash flows. Leases often provide substantial tax subsidies, generating cash inflows after an initial investment. However, these subsidies decline over time, frequently leading to negative cash flows in later years. (The details of leasing will be discussed in a later chapter.) It is easy to verify that this project has not one but two IRRs, 10 percent and 20 percent.5 In a case like this, the IRR does not make any sense. What IRR are we to use—10 percent
4This paragraph implicitly assumes that the cash flows of the project are risk-free. In this way we can treat the borrow-ing rate as the discount rate for a firm needing $100. With risky cash flows, another discount rate would be chosen. However, the intuition behind the decision to accept when the IRR is less than the discount rate would still apply.5The calculations are
− + −
− + −
$100$230
1.1
$132
(1.1)$100 209.09 109.09
2
0=
and
− + −
− + −
$100$230
1.2
$132
(1.2)$100 191.67 91.67
2
0=Thus, we have multiple rates of return.
ros05902_ch06.indd 173ros05902_ch06.indd 173 9/25/06 9:56:56 AM9/25/06 9:56:56 AM
174 Part II Valuation and Capital Budgeting
or 20 percent? Because there is no good reason to use one over the other, IRR simply can-not be used here. Why does this project have multiple rates of return? Project C generates multiple internal rates of return because both an inflow and an outflow occur after the initial investment. In gen-eral, these flip-flops or changes in sign produce multiple IRRs. In theory, a cash flow stream with K changes in sign can have up to K sensible internal rates of return (IRRs above �100 per-cent). Therefore, because project C has two changes in sign, it can have as many as two IRRs. As we pointed out, projects whose cash flows change sign repeatedly can occur in the real world.
NPV Rule Of course, we should not be too worried about multiple rates of return. After all, we can always fall back on the NPV rule. Figure 6.5 plots the NPV of project C (�$100, $230, �$132) as a function of the discount rate. As the figure shows, the NPV is zero at both 10 percent and 20 percent and negative outside the range. Thus, the NPV rule tells us to accept the project if the appropriate discount rate is between 10 percent and 20 percent. The project should be rejected if the discount rate lies outside this range.
Modified IRR As an alternative to NPV, we now introduce the modified IRR (MIRR) method, which handles the multiple IRR problem by combining cash flows until only one change in sign remains. To see how it works, consider project C again. With a discount rate of, say, 14 percent, the value of the last cash flow, �$132, is:
�$132/1.14 � �$115.79
as of date 1. Because $230 is already received at that time, the “adjusted” cash flow at date 1 is $114.21 (� $230 � 115.79). Thus, the MIRR approach produces the following two cash flows for the project:
(�$100, $114.21)
Note that by discounting and then combining cash flows, we are left with only one change in sign. The IRR rule can now be applied. The IRR of these two cash flows is 14.21 percent, implying that the project should be accepted given our assumed discount rate of 14 percent. Of course, project C is relatively simple to begin with: It has only three cash flows and two changes in sign. However, the same procedure can easily be applied to more complex projects—that is, just keep discounting and combining the later cash flows until only one change of sign remains. Although this adjustment does correct for multiple IRRs, it appears, at least to us, to violate the “spirit” of the IRR approach. As stated earlier, the basic rationale behind the IRR method is that it provides a single number summarizing the merits of a project. That number does not depend on the discount rate. In fact, that is why it is called the internal rate of return: The number is internal, or intrinsic, to the project and does not depend on anything except the cash flows of the project. By contrast, MIRR is clearly a function of the discount rate. However, a firm using this adjustment will avoid the multiple IRR problem, just as a firm using the NPV rule will avoid it.
The Guarantee against Multiple IRRs If the first cash flow of a project is negative (be-cause it is the initial investment) and if all of the remaining flows are positive, there can be only a single, unique IRR, no matter how many periods the project lasts. This is easy to understand by using the concept of the time value of money. For example, it is simple to verify that project A in Table 6.3 has an IRR of 30 percent because using a 30-percent discount rate gives
NPV � �$100 � $130/(1.3)
� $0
ros05902_ch06.indd 174ros05902_ch06.indd 174 9/25/06 9:56:57 AM9/25/06 9:56:57 AM
Chapter 6 Net Present Value and Other Investment Rules 175
How do we know that this is the only IRR? Suppose we were to try a discount rate greater than 30 percent. In computing the NPV, changing the discount rate does not change the value of the initial cash flow of �$100 because that cash flow is not discounted. But raising the discount rate can only lower the present value of the future cash flows. In other words, because the NPV is zero at 30 percent, any increase in the rate will push the NPV into the negative range. Similarly, if we try a discount rate of less than 30 percent, the overall NPV of the project will be positive. Though this example has only one positive flow, the above reasoning still implies a single, unique IRR if there are many inflows (but no outflows) after the initial investment. If the initial cash flow is positive—and if all of the remaining flows are negative—there can only be a single, unique IRR. This result follows from similar reasoning. Both these cases have only one change of sign or flip-flop in the cash flows. Thus, we are safe from multiple IRRs whenever there is only one sign change in the cash flows.
General Rules The following chart summarizes our rules:
Number IRR NPV Flows of IRRs Criterion Criterion
First cash flow is negative 1 Accept if IRR � R. Accept if NPV � 0. and all remaining cash Reject if IRR � R. Reject if NPV � 0. flows are positive.First cash flow is positive 1 Accept if IRR � R. Accept if NPV � 0. and all remaining cash Reject if IRR � R. Reject if NPV � 0. flows are negative.Some cash flows after May be No valid IRR. Accept if NPV � 0. first are positive and more Reject if NPV � 0. some cash flows after than 1. first are negative.
Note that the NPV criterion is the same for each of the three cases. In other words, NPV analysis is always appropriate. Conversely, the IRR can be used only in certain cases. When it comes to NPV, the preacher’s words, “You just can’t lose with the stuff I use,” clearly apply.
Problems Specific to Mutually Exclusive ProjectsAs mentioned earlier, two or more projects are mutually exclusive if the firm can accept only one of them. We now present two problems dealing with the application of the IRR approach to mutually exclusive projects. These two problems are quite similar, though logi-cally distinct.
The Scale Problem A professor we know motivates class discussions of this topic with this statement: “Students, I am prepared to let one of you choose between two mutu-ally exclusive ‘business’ propositions. Opportunity 1—You give me $1 now and I’ll give you $1.50 back at the end of the class period. Opportunity 2—You give me $10 and I’ll give you $11 back at the end of the class period. You can choose only one of the two opportunities. And you cannot choose either opportunity more than once. I’ll pick the first volunteer.”
ros05902_ch06.indd 175ros05902_ch06.indd 175 9/25/06 9:56:58 AM9/25/06 9:56:58 AM
176 Part II Valuation and Capital Budgeting
Which would you choose? The correct answer is opportunity 2.6 To see this, look at the following chart:
Cash Flow at Cash Flow at End of Class Beginning of Class (90 Minutes Later) NPV7 IRR
As we have stressed earlier in the text, one should choose the opportunity with the highest NPV. This is opportunity 2 in the example. Or, as one of the professor’s students explained it, “I’m bigger than the professor, so I know I’ll get my money back. And I have $10 in my pocket right now so I can choose either opportunity. At the end of the class, I’ll be able to play two rounds of my favorite electronic game with opportunity 2 and still have my origi-nal investment, safe and sound.8 The profit on opportunity 1 buys only one round.” This business proposition illustrates a defect with the internal rate of return criterion. The basic IRR rule indicates the selection of opportunity 1 because the IRR is 50 percent. The IRR is only 10 percent for opportunity 2. Where does IRR go wrong? The problem with IRR is that it ignores issues of scale. Although opportunity 1 has a greater IRR, the investment is much smaller. In other words, the high percentage return on opportunity 1 is more than offset by the ability to earn at least a decent return9 on a much bigger investment under opportunity 2. Because IRR seems to be misguided here, can we adjust or correct it? We illustrate how in the next example.
NPV versus IRR Stanley Jaffe and Sherry Lansing have just purchased the rights to Corporate Finance: The Motion Picture. They will produce this major motion picture on either a small budget or a big budget. Here are the estimated cash flows:
EX
AM
PL
E 6
.3
6The professor uses real money here. Though many students have done poorly on the professor’s exams over the years, no student ever chose opportunity 1. The professor claims that his students are “money players.”7We assume a zero rate of interest because his class lasted only 90 minutes. It just seemed like a lot longer.8At press time for this text, electronic games cost $0.50 apiece.9A 10 percent return is more than decent over a 90-minute interval!
Because of high risk, a 25 percent discount rate is considered appropriate. Sherry wants to adopt the large budget because the NPV is higher. Stanley wants to adopt the small budget because the IRR is higher. Who is right?
Cash Flow at Cash Flow at NPV Date 0 Date 1 @25% IRR
Small budget �$10 million $40 million $22 million 300%Large budget � 25 million 65 million 27 million 160
(continued)
ros05902_ch06.indd 176ros05902_ch06.indd 176 9/25/06 9:56:59 AM9/25/06 9:56:59 AM
Chapter 6 Net Present Value and Other Investment Rules 177
In review, we can handle this example (or any mutually exclusive example) in one of three ways:
1. Compare the NPVs of the two choices. The NPV of the large-budget picture is greater than the NPV of the small-budget picture. That is, $27 million is greater than $22 million.
2. Calculate the incremental NPV from making the large-budget picture instead of the small-budget picture. Because the incremental NPV equals $5 million, we choose the large-budget picture.
3. Compare the incremental IRR to the discount rate. Because the incremental IRR is 66.67 percent and the discount rate is 25 percent, we take the large-budget picture.
For the reasons espoused in the classroom example, NPV is correct. Hence Sherry is right. How-ever, Stanley is very stubborn where IRR is concerned. How can Sherry justify the large budget to Stanley using the IRR approach? This is where incremental IRR comes in. Sherry calculates the incremental cash flows from choos-ing the large budget instead of the small budget as follows:
Cash Flow at Date 0 Cash Flow at Date 1 (in $ millions) (in $ millions)
Incremental cash flows from �$25 � (�10) � �$15 $65 � 40 � $25 choosing large budget instead of small budget
This chart shows that the incremental cash flows are �$15 million at date 0 and $25 million at date 1. Sherry calculates incremental IRR as follows:
Formula for Calculating the Incremental IRR:
0 15251
= − ++
$$
millionmillionIRR
IRR equals 66.67 percent in this equation, implying that the incremental IRR is 66.67 percent. Incremental IRR is the IRR on the incremental investment from choosing the large project instead of the small project. In addition, we can calculate the NPV of the incremental cash flows:
NPV of Incremental Cash Flows:
− + =$$
.$15
251 25
5millionmillion
million
We know the small-budget picture would be acceptable as an independent project because its NPV is positive. We want to know whether it is beneficial to invest an additional $15 million to make the large-budget picture instead of the small-budget picture. In other words, is it beneficial to invest an additional $15 million to receive an additional $25 million next year? First, our calculations show the NPV on the incremental investment to be positive. Second, the incremental IRR of 66.67 percent is higher than the discount rate of 25 percent. For both reasons, the incremental investment can be justified, so the large-budget movie should be made. The second reason is what Stanley needed to hear to be convinced.
Chapter 6 Net Present Value and Other Investment Rules 177
ros05902_ch06.indd 177ros05902_ch06.indd 177 9/25/06 9:57:00 AM9/25/06 9:57:00 AM
178 Part II Valuation and Capital Budgeting
All three approaches always give the same decision. However, we must not compare the IRRs of the two pictures. If we did, we would make the wrong choice. That is, we would accept the small-budget picture. Although students frequently think that problems of scale are relatively unimportant, the truth is just the opposite. A well-known chef on TV often says, “I don’t know about your flour, but the flour I buy don’t come seasoned.” The same thing applies to capital bud-geting. No real-world project comes in one clear-cut size. Rather, the firm has to determine the best size for the project. The movie budget of $25 million is not fixed in stone. Perhaps an extra $1 million to hire a bigger star or to film at a better location will increase the movie’s gross. Similarly, an industrial firm must decide whether it wants a warehouse of, say, 500,000 square feet or 600,000 square feet. And, earlier in the chapter, we imagined McDonald’s opening an outlet on a remote island. If it does this, it must decide how big the outlet should be. For almost any project, someone in the firm has to decide on its size, implying that problems of scale abound in the real world. One final note here. Students often ask which project should be subtracted from the other in calculating incremental flows. Notice that we are subtracting the smaller project’s cash flows from the bigger project’s cash flows. This leaves an outflow at date 0. We then use the basic IRR rule on the incremental flows.10
The Timing Problem Next we illustrate another, quite similar problem with the IRR approach to evaluating mutually exclusive projects.
10Alternatively, we could have subtracted the larger project’s cash flows from the smaller project’s cash flows. This would have left an inflow at date 0, making it necessary to use the IRR rule for financing situations. This would work, but we find it more confusing.
The patterns of cash flow for both projects appear in Figure 6.6. Project A has an NPV of $2,000 at a discount rate of zero. This is calculated by simply adding up the cash flows without discounting them. Project B has an NPV of $4,000 at the zero rate. However, the NPV of project B declines more rapidly as the discount rate increases than does the NPV
Mutually Exclusive Investments Suppose that the Kaufold Corporation has two alternative uses for a warehouse. It can store toxic waste containers (investment A) or electronic equipment (investment B). The cash flows are as follows:
EX
AM
PL
E 6
.4
We find that the NPV of investment B is higher with low discount rates, and the NPV of invest-ment A is higher with high discount rates. This is not surprising if you look closely at the cash flow patterns. The cash flows of A occur early, whereas the cash flows of B occur later. If we assume a high discount rate, we favor investment A because we are implicitly assuming that the early cash flow (for example, $10,000 in year 1) can be reinvested at that rate. Because most of investment B’s cash flows occur in year 3, B’s value is relatively high with low discount rates.
Cash Flow at Year NPV
Year: 0 1 2 3 @0% @10% @15% IRR
Investment A �$10,000 $10,000 $1,000 $ 1,000 $2,000 $669 $109 16.04%Investment B �10,000 1,000 1,000 12,000 4,000 751 �484 12.94
ros05902_ch06.indd 178ros05902_ch06.indd 178 9/25/06 9:57:01 AM9/25/06 9:57:01 AM
Chapter 6 Net Present Value and Other Investment Rules 179
of project A. As we mentioned, this occurs because the cash flows of B occur later. Both projects have the same NPV at a discount rate of 10.55 percent. The IRR for a project is the rate at which the NPV equals zero. Because the NPV of B declines more rapidly, B actually has a lower IRR. As with the movie example, we can select the better project with one of three different methods:
1. Compare NPVs of the two projects. Figure 6.6 aids our decision. If the discount rate is below 10.55 percent, we should choose project B because B has a higher NPV. If the rate is above 10.55 percent, we should choose project A because A has a higher NPV.
2. Compare incremental IRR to discount rate. Method 1 employed NPV. Another way of determining that B is a better project is to subtract the cash flows of A from the cash flows of B and then to calculate the IRR. This is the incremental IRR approach we spoke of earlier.
Here are the incremental cash flows:
$4,000
Discount rate (%)
2,000
0�484
Net
pre
sent
val
ue ($
)
NPVB � NPVA
NPVA � NPVB
10.55 12.94 16.04Project A
Project B
Figure 6.6Net Present Value and the Internal Rate of Return for Mutually Exclusive Projects
This chart shows that the incremental IRR is 10.55 percent. In other words, the NPV on the incremental investment is zero when the discount rate is 10.55 percent. Thus, if the relevant discount rate is below 10.55 percent, project B is preferred to project A. If the relevant discount rate is above 10.55 percent, project A is preferred to project B.11
11In this example, we fi rst showed that the NPVs of the two projects are equal when the discount rate is 10.55 percent. We next showed that the incremental IRR is also 10.55 percent. This is not a coincidence; this equality must always hold. The incremental IRR is the rate that causes the incremental cash fl ows to have zero NPV. The incremental cash fl ows have zero NPV when the two projects have the same NPV.
NPV of Incremental Cash Flows
Year: 0 1 2 3 Incremental IRR @0% @10% @15%
B � A 0 �$9,000 0 $11,000 10.55% $2,000 $83 �$593
ros05902_ch06.indd 179ros05902_ch06.indd 179 9/25/06 9:57:02 AM9/25/06 9:57:02 AM
180 Part II Valuation and Capital Budgeting
3. Calculate NPV on incremental cash fl ows. Finally, we could calculate the NPV on the incremental cash fl ows. The chart that appears with the previous method displays these NPVs. We fi nd that the incremental NPV is positive when the discount rate is either 0 percent or 10 percent. The incremental NPV is negative if the discount rate is 15 percent. If the NPV is positive on the incremental fl ows, we should choose B. If the NPV is negative, we should choose A.
In summary, the same decision is reached whether we (1) compare the NPVs of the two projects, (2) compare the incremental IRR to the relevant discount rate, or (3) examine the NPV of the incremental cash fl ows. However, as mentioned earlier, we should not compare the IRR of project A with the IRR of project B. We suggested earlier that we should subtract the cash flows of the smaller project from the cash flows of the bigger project. What do we do here when the two projects have the same initial investment? Our suggestion in this case is to perform the subtraction so that the first nonzero cash flow is negative. In the Kaufold Corp. example we achieved this by subtracting A from B. In this way, we can still use the basic IRR rule for evaluating cash flows. The preceding examples illustrate problems with the IRR approach in evaluating mutually exclusive projects. Both the professor–student example and the motion pic-ture example illustrate the problem that arises when mutually exclusive projects have different initial investments. The Kaufold Corp. example illustrates the problem that arises when mutually exclusive projects have different cash fl ow timing. When working with mutually exclusive projects, it is not necessary to determine whether it is the scale problem or the timing problem that exists. Very likely both occur in any real-world situ-ation. Instead, the practitioner should simply use either an incremental IRR or an NPV approach.
Redeeming Qualities of IRRIRR probably survives because it fi lls a need that NPV does not. People seem to want a rule that summarizes the information about a project in a single rate of return. This single rate gives people a simple way of discussing projects. For example, one manager in a fi rm might say to another, “Remodeling the north wing has a 20 percent IRR.” To their credit, however, companies that employ the IRR approach seem to understand its defi ciencies. For example, companies frequently restrict managerial projections of cash fl ows to be negative at the beginning and strictly positive later. Perhaps, then, the ability of the IRR approach to capture a complex investment project in a single number and the ease of communicating that number explain the survival of the IRR.
A TestTo test your knowledge, consider the following two statements:
1. You must know the discount rate to compute the NPV of a project, but you compute the IRR without referring to the discount rate.
2. Hence, the IRR rule is easier to apply than the NPV rule because you don’t use the discount rate when applying IRR.
The fi rst statement is true. The discount rate is needed to compute NPV. The IRR is com-puted by solving for the rate where the NPV is zero. No mention is made of the discount rate in the mere computation. However, the second statement is false. To apply IRR, you must compare the internal rate of return with the discount rate. Thus the discount rate is needed for making a decision under either the NPV or IRR approach.
ros05902_ch06.indd 180ros05902_ch06.indd 180 9/25/06 9:57:03 AM9/25/06 9:57:03 AM
Chapter 6 Net Present Value and Other Investment Rules 181
6.7 The Profi tability IndexAnother method used to evaluate projects is called the profi tability index. It is the ratio of the present value of the future expected cash fl ows after initial investment divided by the amount of the initial investment. The profi tability index can be represented like this:
Profi tability index (PI) � PV of cash fl ows subsequent to initial investment
Calculation of Profi tability IndexThe profi tability index is calculated for project 1 as follows. The present value of the cash fl ows after the initial investment is:
$ .$
.
$
( . )70 5
70
1 12
10
1 12 2= +
The profi tability index is obtained by dividing this result by the initial investment of $20. This yields:
3 5370 5
20.
$ .
$=
Application of the Profi tability Index How do we use the profi tability index? We consider three situations:
1. Independent projects: Assume that HFI’s two projects are independent. According to the NPV rule, both projects should be accepted because NPV is positive in each case. The profi tability index (PI) is greater than 1 whenever the NPV is positive. Thus, the PI decision rule is
• Accept an independent project if PI � 1.
• Reject it if PI � 1.
2. Mutually exclusive projects: Let us now assume that HFI can only accept one of its two projects. NPV analysis says accept project 1 because this project has the bigger NPV. Because project 2 has the higher PI, the profi tability index leads to the wrong selection.
Profi tability Index Hiram Finnegan Inc. (HFI) applies a 12 percent discount rate to two invest-ment opportunities.
EX
AM
PL
E 6
.5
Cash Flows PV @ 12% of Cash ($000,000) Flows Subsequent Profi t- to Initial Investment ability NPV @12% Project C0 C1 C2 ($000,000) Index ($000,000)
ros05902_ch06.indd 181ros05902_ch06.indd 181 9/25/06 9:57:03 AM9/25/06 9:57:03 AM
182 Part II Valuation and Capital Budgeting
The problem with the profi tability index for mutually exclusive projects is the same as the scale problem with the IRR that we mentioned earlier. Project 2 is smaller than project 1. Because the PI is a ratio, this index misses the fact that project 1 has a larger investment than project 2 has. Thus, like IRR, PI ignores differences of scale for mutually exclusive projects.
However, like IRR, the fl aw with the PI approach can be corrected using incre-mental analysis. We write the incremental cash fl ows after subtracting project 2 from project 1 as follows:
Because the profi tability index on the incremental cash fl ows is greater than 1.0, we should choose the bigger project—that is, project 1. This is the same decision we get with the NPV approach.
3. Capital rationing: The fi rst two cases implicitly assumed that HFI could always attract enough capital to make any profi table investments. Now consider the case when the fi rm does not have enough capital to fund all positive NPV projects. This is the case of capital rationing.
Imagine that the fi rm has a third project, as well as the fi rst two. Project 3 has the following cash fl ows:
Further, imagine that (1) the projects of Hiram Finnegan Inc. are independent, but(2) the fi rm has only $20 million to invest. Because project 1 has an initial investment of $20 million, the fi rm cannot select both this project and another one. Conversely, because projects 2 and 3 have initial investments of $10 million each, both these projects can be chosen. In other words, the cash constraint forces the fi rm to choose either project 1 or projects 2 and 3.
What should the fi rm do? Individually, projects 2 and 3 have lower NPVs than project 1 has. However, when the NPVs of projects 2 and 3 are added together, the sum is higher than the NPV of project 1. Thus, common sense dictates that projects 2 and 3 should be accepted.
Cash Flows PV @ 12% of Cash ($000,000) Flows Subsequent Profi t- to Initial Investment ability NPV @12% Project C0 C1 C2 ($000,000) Index ($000,000)
1–2 �$10 $55 �$30 $25.2 2.52 $15.2
Cash Flows PV @ 12% of Cash ($000,000) Flows Subsequent Profi t- to Initial Investment ability NPV @12% Project C0 C1 C2 ($000,000) Index ($000,000)
3 �$10 �$5 $60 $43.4 4.34 $33.4
ros05902_ch06.indd 182ros05902_ch06.indd 182 9/25/06 9:57:04 AM9/25/06 9:57:04 AM
Chapter 6 Net Present Value and Other Investment Rules 183
What does our conclusion have to say about the NPV rule or the PI rule? In the case of limited funds, we cannot rank projects according to their NPVs. Instead we should rank them according to the ratio of present value to initial investment. This is the PI rule. Both project 2 and project 3 have higher PI ratios than does project 1. Thus they should be ranked ahead of project 1 when capital is rationed. The usefulness of the profi tability index under capital rationing can be explained in military terms. The Pentagon speaks highly of a weapon with a lot of “bang for the buck.” In capital budgeting, the profi tability index measures the bang (the dollar return) for the buck invested. Hence it is useful for capital rationing. It should be noted that the profi tability index does not work if funds are also limited beyond the initial time period. For example, if heavy cash outfl ows elsewhere in the fi rm were to occur at date 1, project 3, which also has a cash outfl ow at date 1, might need to be rejected. In other words, the profi tability index cannot handle capital rationing over mul-tiple time periods. In addition, what economists term indivisibilities may reduce the effectiveness of the PI rule. Imagine that HFI has $30 million available for capital investment, not just $20 mil-lion. The fi rm now has enough cash for projects 1 and 2. Because the sum of the NPVs of these two projects is greater than the sum of the NPVs of projects 2 and 3, the fi rm would be better served by accepting projects 1 and 2. But because projects 2 and 3 still have the high-est profi tability indexes, the PI rule now leads to the wrong decision. Why does the PI rule lead us astray here? The key is that projects 1 and 2 use up all of the $30 million, whereas projects 2 and 3 have a combined initial investment of only $20 million (� $10 � 10). If projects 2 and 3 are accepted, the remaining $10 million must be left in the bank. This situation points out that care should be exercised when using the profi tability index in the real world. Nevertheless, while not perfect, the profi tability index goes a long way toward handling capital rationing.
6.8 The Practice of Capital BudgetingSo far this chapter has asked “Which capital budgeting methods should companies be using?” An equally important question is this: Which methods are companies using? Table 6.4 helps answer this question. As can be seen from the table, approximately three-quarters of U.S. and Canadian companies use the IRR and NPV methods. This is not surprising, given the theoretical advantages of these approaches. Over half of these companies use the pay-back method, a rather surprising result given the conceptual problems with this approach. And while discounted payback represents a theoretical improvement over regular payback,
% Always or Almost Always
Internal rate of return (IRR) 75.6% Net present value (NPV) 74.9 Payback method 56.7 Discounted payback 29.5 Accounting rate of return 30.3 Profi tability index 11.9
Table 6.4Percentage of CFOs Who Always or Almost Always Use a Given Technique
SOURCE: Figure 2 from John R. Graham and Campbell R. Harvey, “The Theory and Practice of Corporate Finance: Evidence from the Field,” Journal of Financial Economics 60 (2001). Based on a survey of 392 CFOs.
ros05902_ch06.indd 183ros05902_ch06.indd 183 9/25/06 9:57:05 AM9/25/06 9:57:05 AM
184 Part II Valuation and Capital Budgeting
the usage here is far less. Perhaps companies are attracted to the user-friendly nature of payback. In addition, the fl aws of this approach, as mentioned in the current chapter, may be relatively easy to correct. For example, while the payback method ignores all cash fl ows after the payback period, an alert manager can make ad hoc adjustments for a project with back-loaded cash fl ows. Capital expenditures by individual corporations can add up to enormous sums for the economy as a whole. For example, in late 2005, Royal Dutch Shell announced it expected to increase its capital spending in 2006 to $19 billion, an increase of 17 percent over the previous year. About the same time, competitor Chevron Corp. announced it would in-crease its capital budget for 2006 to $14.8 billion, up from $11 billion in 2005. Other com-panies with large capital spending budgets in 2006 were ConocoPhillips, which projected capital spending of $11.4 billion, and Canadian-based Suncor Energy, which projected capital spending of $3.5 billion. Capital spending is often an industrywide occurrence. For example, in 2006, capital spending by dynamic random access memory (DRAM) chip makers was expected to reach $16.84 billion. This amount represented only a 5 percent increase from 2005 and was a major slowdown for capital spending growth. From 2003 to 2004, the DRAM industry’s capital spending had grown by an astonishing 65 percent. According to information released by the Census Bureau in 2006, capital investment for the economy as a whole was actually $1.05 trillion in 2004, $975 billion in 2003, and $953 billion in 2002. The totals for the three years therefore were about $3 trillion! Given the sums at stake, it is not too surprising that careful analysis of capital expenditures is something at which successful corporations seek to become adept. One might expect the capital budgeting methods of large fi rms to be more sophisti-cated than the methods of small fi rms. After all, large fi rms have the fi nancial resources to hire more sophisticated employees. Table 6.5 provides some support for this idea. Here fi rms indicate frequency of use of the various capital budgeting methods on a scale of 0 (never) to 4 (always). Both the IRR and NPV methods are used more frequently, and pay-back less frequently, in large fi rms than in small fi rms. Conversely, large and small fi rms employ the last three approaches about equally.
In Their Own Words
KITCHEN CONFIDENTIAL: ADVENTURES IN THE CULINARY UNDERBELLY BY ANTHONY BOURDAIN (BLOOMSBURY PRESS, 2000)
To want to own a restaurant can be a strange and terrible affl iction. What causes such a destructive urge in so many otherwise sensible people? Why would anyone who has worked hard, saved money, and often been successful in other fi elds want to pump their hard-earned cash down a hole that statistically, at least, will almost surely prove dry? Why venture into an industry with enormous fi xed expenses (rent, electricity, gas, water, linen, maintenance,
insurance, license fees, trash removal, etc.), a notoriously transient and unstable workforce, and a highly perishable inventory of assets? The chances of ever seeing a return on your investment are about one in fi ve. What insidi-ous spongiform bacteria so riddles the brains of men and women that they stand there on the tracks, watching the lights of the oncoming locomotive, knowing full well it will eventually run them over? After all these years in the business, I still don’t know.
Anthony Bourdain is also the author of the novels Bone in the Throat, Gone Bamboo, and The Bobby Gold Stories. He is the executive chef at Brasserie Les Halles in New York.
184
ros05902_ch06.indd 184ros05902_ch06.indd 184 9/26/06 10:36:12 AM9/26/06 10:36:12 AM
Chapter 6 Net Present Value and Other Investment Rules 185
The use of quantitative techniques in capital budgeting varies with the industry. As one would imagine, fi rms that are better able to estimate cash fl ows are more likely to use NPV. For example, estimation of cash fl ow in certain aspects of the oil business is quite feasible. Because of this, energy-related fi rms were among the fi rst to use NPV analysis. Conversely, the cash fl ows in the motion picture business are very hard to project. The grosses of the great hits like Titanic, Harry Potter, and Star Wars were far, far greater than anyone imag-ined. The big failures like Alamo and Waterworld were unexpected as well. Because of this, NPV analysis is frowned upon in the movie business. How does Hollywood perform capital budgeting? The information that a studio uses to accept or reject a movie idea comes from the pitch. An independent movie producer schedules an extremely brief meeting with a studio to pitch his or her idea for a movie. Consider the following four paragraphs of quotes concerning the pitch from the thoroughly delightful book Reel Power: 12
“They [studio executives] don’t want to know too much,” says Ron Simpson. “They want to know concept. . . . They want to know what the three-liner is, because they want it to suggest the ad campaign. They want a title. . . . They don’t want to hear any esoterica. And if the meeting lasts more than fi ve minutes, they’re probably not going to do the project.” “A guy comes in and says this is my idea: ‘Jaws on a spaceship,’” says writer Clay Frohman (Under Fire). “And they say, ‘Brilliant, fantastic.’ Becomes Alien. That is Jaws on a spaceship, ultimately. . . . And that’s it. That’s all they want to hear. Their attitude is ‘Don’t confuse us with the details of the story.’” “. . . Some high-concept stories are more appealing to the studios than others. The ideas liked best are suffi ciently original that the audience will not feel it has already seen the movie, yet similar enough to past hits to reassure executives wary of anything too far-out. Thus, the frequently used shorthand: It’s Flashdance in the country (Footloose) or High Noon in outer space (Outland).” “. . . One gambit not to use during a pitch,” says executive Barbara Boyle, “is to talk about big box-offi ce grosses your story is sure to make. Executives know as well as anyone that it’s impossible to predict how much money a movie will make, and declarations to the contrary are considered pure malarkey.”
12Mark Litwak, Reel Power: The Struggle for Infl uence and Success in the New Hollywood (New York: William Morrow and Company, Inc., 1986), pp. 73, 74, and 77.
Large Firms Small Firms
Internal rate of return (IRR) 3.41 2.87 Net present value (NPV) 3.42 2.83 Payback method 2.25 2.72 Discounted payback 1.55 1.58 Accounting rate of return 1.25 1.41 Profi tability index 0.75 0.78
Table 6.5Frequency of Use of Various Capital Budgeting Methods
Firms indicate frequency of use on a scale from 0 (never) to 4 (always). Numbers in table are averages across respondents.
SOURCE: Table 2 from Graham and Harvey (2001), op. cit.
ros05902_ch06.indd 185ros05902_ch06.indd 185 9/25/06 9:57:07 AM9/25/06 9:57:07 AM
186 Part II Valuation and Capital Budgeting
1. In this chapter, we covered different investment decision rules. We evaluated the most popular alternatives to the NPV: the payback period, the discounted payback period, the accounting rate of return, the internal rate of return, and the profi tability index. In doing so we learned more about the NPV.
2. While we found that the alternatives have some redeeming qualities, when all is said and done, they are not the NPV rule; for those of us in fi nance, that makes them decidedly second-rate.
3. Of the competitors to NPV, IRR must be ranked above both payback and accounting rate of return. In fact, IRR always reaches the same decision as NPV in the normal case where the initial outfl ows of an independent investment project are followed only by a series of infl ows.
4. We classifi ed the fl aws of IRR into two types. First, we considered the general case applying to both independent and mutually exclusive projects. There appeared to be two problems here:
a. Some projects have cash infl ows followed by one or more outfl ows. The IRR rule is inverted here: One should accept when the IRR is below the discount rate.
b. Some projects have a number of changes of sign in their cash fl ows. Here, there are likely to be multiple internal rates of return. The practitioner must use either NPV or modifi ed internal rate of return here.
5. Next, we considered the specifi c problems with the NPV for mutually exclusive projects. We showed that, due to differences in either size or timing, the project with the highest IRR need not have the highest NPV. Hence, the IRR rule should not be applied. (Of course, NPV can still be applied.)
However, we then calculated incremental cash fl ows. For ease of calculation, we suggested subtracting the cash fl ows of the smaller project from the cash fl ows of the larger project. In that way the incremental initial cash fl ow is negative. One can always reach a correct decision by accepting the larger project if the incremental IRR is greater than the discount rate.
6. We described capital rationing as the case where funds are limited to a fi xed dollar amount. With capital rationing the profi tability index is a useful method of adjusting the NPV.
Summary and Conclusions
Concept Questions
1. Payback Period and Net Present Value If a project with conventional cash fl ows has a pay-back period less than the project’s life, can you defi nitively state the algebraic sign of the NPV? Why or why not? If you know that the discounted payback period is less than the project’s life, what can you say about the NPV? Explain.
2. Net Present Value Suppose a project has conventional cash fl ows and a positive NPV. What do you know about its payback? Its discounted payback? Its profi tability index? Its IRR? Explain.
3. Comparing Investment Criteria Defi ne each of the following investment rules and discuss any potential shortcomings of each. In your defi nition, state the criterion for accepting or re-jecting independent projects under each rule.
a. Payback period. b. Average accounting return. c. Internal rate of return. d. Profi tability index. e. Net present value.
4. Payback and Internal Rate of Return A project has perpetual cash fl ows of C per period, a cost of I, and a required return of R. What is the relationship between the project’s payback and its IRR? What implications does your answer have for long-lived projects with relatively constant cash fl ows?
ww
w.m
hhe.
com
/rw
j
ros05902_ch06.indd 186ros05902_ch06.indd 186 9/25/06 9:57:08 AM9/25/06 9:57:08 AM
Chapter 6 Net Present Value and Other Investment Rules 187
5. International Investment Projects In November 2004, automobile manufacturer Honda announced plans to build an automatic transmission plant in Georgia and expand its transmis-sion plant in Ohio. Honda apparently felt that it would be better able to compete and create value with U.S.-based facilities. Other companies such as Fuji Film and Swiss chemical com-pany Lonza have reached similar conclusions and taken similar actions. What are some of the reasons that foreign manufacturers of products as diverse as automobiles, fi lm, and chemicals might arrive at this same conclusion?
6. Capital Budgeting Problems What are some of the diffi culties that might come up in actual applications of the various criteria we discussed in this chapter? Which one would be the easi-est to implement in actual applications? The most diffi cult?
7. Capital Budgeting in Not-for-Profi t Entities Are the capital budgeting criteria we discussed applicable to not-for-profi t corporations? How should such entities make capital budgeting decisions? What about the U.S. government? Should it evaluate spending proposals using these techniques?
8. Net Present Value The investment in project A is $1 million, and the investment in project Bis $2 million. Both projects have a unique internal rate of return of 20 percent. Is the following statement true or false?
For any discount rate from 0 percent to 20 percent, project B has an NPV twice as great as that of project A.
Explain your answer.
9. Net Present Value versus Profi tability Index Consider the following two mutually exclu-sive projects available to Global Investments, Inc.:
The appropriate discount rate for the projects is 10 percent. Global Investments chose to under-take project A. At a luncheon for shareholders, the manager of a pension fund that owns a substantial amount of the fi rm’s stock asks you why the fi rm chose project A instead of project B when project B has a higher profi tability index.
How would you, the CFO, justify your fi rm’s action? Are there any circumstances under which Global Investments should choose project B?
10. Internal Rate of Return Projects A and B have the following cash fl ows:
a. If the cash fl ows from the projects are identical, which of the two projects would have a higher IRR? Why?
b. If C1B � 2C1A, C2B � 2C2A, and C3B � 2C3A, then is IRRA � IRRB?
11. Net Present Value You are evaluating project A and project B. Project A has a short period of future cash fl ows, while project B has relatively long future cash fl ows. Which project will be more sensitive to changes in the required return? Why?
ww
w.m
hhe.
com
/rw
j
ros05902_ch06.indd 187ros05902_ch06.indd 187 9/25/06 9:57:09 AM9/25/06 9:57:09 AM
12. Modifi ed Internal Rate of Return One of the less fl attering interpretations of the acronym MIRR is “meaningless internal rate of return.” Why do you think this term is applied to MIRR?
13. Net Present Value It is sometimes stated that “the net present value approach assumes reinvestment of the intermediate cash flows at the required return.” Is this claim correct? To answer, suppose you calculate the NPV of a project in the usual way. Next, suppose you do the following:
a. Calculate the future value (as of the end of the project) of all the cash fl ows other than the initial outlay assuming they are reinvested at the required return, producing a single future value fi gure for the project.
b. Calculate the NPV of the project using the single future value calculated in the previous step and the initial outlay. It is easy to verify that you will get the same NPV as in your original calculation only if you use the required return as the reinvestment rate in the previous step.
14. Internal Rate of Return It is sometimes stated that “the internal rate of return approach assumes reinvestment of the intermediate cash fl ows at the internal rate of return.” Is this claim correct? To answer, suppose you calculate the IRR of a project in the usual way. Next, suppose you do the following:
a. Calculate the future value (as of the end of the project) of all the cash fl ows other than the initial outlay assuming they are reinvested at the IRR, producing a single future value fi gure for the project.
b. Calculate the IRR of the project using the single future value calculated in the previous step and the initial outlay. It is easy to verify that you will get the same IRR as in your original calculation only if you use the IRR as the reinvestment rate in the previous step.
1. Calculating Payback Period and NPV Fuji Software, Inc., has the following mutually ex-clusive projects.
a. Suppose Fuji’s payback period cutoff is two years. Which of these two projects should be chosen?
b. Suppose Fuji uses the NPV rule to rank these two projects. Which project should be chosen if the appropriate discount rate is 15 percent?
2. Calculating Payback An investment project provides cash infl ows of $840 per year for eight years. What is the project payback period if the initial cost is $3,000? What if the initial cost is $5,000? What if it is $7,000?
3. Calculating Discounted Payback An investment project has annual cash infl ows of $7,000, $7,500, $8,000, and $8,500, and a discount rate of 14 percent. What is the discounted payback period for these cash fl ows if the initial cost is $8,000? What if the initial cost is $13,000? What if it is $18,000?
4. Calculating Discounted Payback An investment project costs $10,000 and has annual cash fl ows of $2,100 for six years. What is the discounted payback period if the discount rate is 0 percent? What if the discount rate is 5 percent? If it is 15 percent?
ww
w.m
hhe.
com
/rw
j
ros05902_ch06.indd 188ros05902_ch06.indd 188 9/25/06 9:57:10 AM9/25/06 9:57:10 AM
Chapter 6 Net Present Value and Other Investment Rules 189
5. Average Accounting Return Your fi rm is considering purchasing a machine with the fol-lowing annual, end-of-year, book investment accounts:
The machine generates, on average, $4,500 per year in additional net income.a. What is the average accounting return for this machine?b. What three fl aws are inherent in this decision rule?
6. Average Accounting Return The Bluerock Group has invested $8,000 in a high-tech project lasting three years. Depreciation is $4,000, $2,500, and $1,500 in years 1, 2, and 3, respec-tively. The project generates pretax income of $2,000 each year. The pretax income already includes the depreciation expense. If the tax rate is 25 percent, what is the project’s average accounting return (AAR)?
7. Calculating IRR Teddy Bear Planet, Inc., has a project with the following cash fl ows:
Year Cash Flows ($)
0 �$8,000 1 4,000 2 3,000 3 2,000
The company evaluates all projects by applying the IRR rule. If the appropriate interest rate is 8 percent, should the company accept the project?
8. Calculating IRR Compute the internal rate of return for the cash fl ows of the following two projects:
9. Calculating Profi tability Index Bill plans to open a self-serve grooming center in a store-front. The grooming equipment will cost $160,000, to be paid immediately. Bill expects after-tax cash infl ows of $40,000 annually for seven years, after which he plans to scrap the equip-ment and retire to the beaches of Nevis. The fi rst cash infl ow occurs at the end of the fi rst year. Assume the required return is 15 percent. What is the project’s PI? Should it be accepted?
10. Calculating Profi tability Index Suppose the following two independent investment oppor-tunities are available to Greenplain, Inc. The appropriate discount rate is 10 percent.
a. Compute the profi tability index for each of the two projects. b. Which project(s) should Greenplain accept based on the profi tability index rule?
11. Cash Flow Intuition A project has an initial cost of I, has a required return of R, and pays C annually for N years.
a. Find C in terms of I and N such that the project has a payback period just equal to its life. b. Find C in terms of I, N, and R such that this is a profi table project according to the NPV
decision rule. c. Find C in terms of I, N, and R such that the project has a benefi t–cost ratio of 2.
12. Problems with IRR Suppose you are offered $5,000 today but must make the following payments:
Year Project Alpha Project Beta
0 �$500 �$2,000 1 300 300 2 700 1,800 3 600 1,700
INTERMEDIATE(Questions 11–23)
Year Cash Flows ($)
0 $5,000 1 �2,500 2 �2,000 3 �1,000 4 �1,000
a. What is the IRR of this offer? b. If the appropriate discount rate is 10 percent, should you accept this offer? c. If the appropriate discount rate is 20 percent, should you accept this offer? d. What is the NPV of the offer if the appropriate discount rate is 10 percent? 20 percent? e. Are the decisions under the NPV rule in part (d) consistent with those of the IRR rule?
13. NPV versus IRR Consider the following cash fl ows on two mutually exclusive projects for the Bahamas Recreation Corporation (BRC). Both projects require an annual return of 15 percent.
As a fi nancial analyst for BRC, you are asked the following questions: a. If your decision rule is to accept the project with the greater IRR, which project should you
choose? b. Because you are fully aware of the IRR rule’s scale problem, you calculate the incremental
IRR for the cash fl ows. Based on your computation, which project should you choose? c. To be prudent, you compute the NPV for both projects. Which project should you choose?
Is it consistent with the incremental IRR rule?
ww
w.m
hhe.
com
/rw
j
ros05902_ch06.indd 190ros05902_ch06.indd 190 9/25/06 9:57:12 AM9/25/06 9:57:12 AM
a. If the company requires a 10 percent return on its investments, should it accept this project? Why?
b. Compute the IRR for this project. How many IRRs are there? If you apply the IRR decision rule, should you accept the project or not? What’s going on here?
16. Comparing Investment Criteria Mario Brothers, a game manufacturer, has a new idea for an adventure game. It can market the game either as a traditional board game or as an interac-tive CD-ROM, but not both. Consider the following cash fl ows of the two mutually exclusive projects for Mario Brothers. Assume the discount rate for Mario Brothers is 10 percent.
Year Cash Flow
0 �$28,000,000 1 53,000,000 2 �8,000,000
Year Board Game CD-ROM
0 �$300 �$1,500 1 400 1,100 2 100 800 3 100 400
a. Based on the payback period rule, which project should be chosen?b. Based on the NPV, which project should be chosen?c. Based on the IRR, which project should be chosen?d. Based on the incremental IRR, which project should be chosen?
17. Profi tability Index versus NPV Hanmi Group, a consumer electronics conglomerate, is reviewing its annual budget in wireless technology. It is considering investments in three dif-ferent technologies to develop wireless communication devices. Consider the following cash
ww
w.m
hhe.
com
/rw
j
ros05902_ch06.indd 191ros05902_ch06.indd 191 9/25/06 9:57:13 AM9/25/06 9:57:13 AM
fl ows of the three independent projects for Hanmi. Assume the discount rate for Hanmi is 10 percent. Further, Hanmi Group has only $30 million to invest in new projects this year.
a. Based on the profi tability index decision rule, rank these investments. b. Based on the NPV, rank these investments. c. Based on your fi ndings in (a) and (b), what would you recommend to the CEO of Hanmi
Group and why?
18. Comparing Investment Criteria Consider the following cash fl ows of two mutually exclu-sive projects for AZ-Motorcars. Assume the discount rate for AZ-Motorcars is 10 percent.
a. Based on the payback period, which project should be taken? b. Based on the NPV, which project should be taken? c. Based on the IRR, which project should be taken? d. Based on this analysis, is incremental IRR analysis necessary? If yes, please conduct the
analysis.
19. Comparing Investment Criteria The treasurer of Amaro Canned Fruits, Inc., has projected the cash fl ows of projects A, B, and C as follows.
Suppose the relevant discount rate is 12 percent a year. a. Compute the profi tability index for each of the three projects. b. Compute the NPV for each of the three projects. c. Suppose these three projects are independent. Which project(s) should Amaro accept based
on the profi tability index rule? d. Suppose these three projects are mutually exclusive. Which project(s) should Amaro accept
based on the profi tability index rule? e. Suppose Amaro’s budget for these projects is $300,000. The projects are not divisible.
Chapter 6 Net Present Value and Other Investment Rules 193
20. Comparing Investment Criteria Consider the following cash fl ows of two mutually exclu-sive projects for Tokyo Rubber Company. Assume the discount rate for Tokyo Rubber Com-pany is 10 percent.
a. Based on the payback period, which project should be taken?b. Based on the NPV, which project should be taken?c. Based on the IRR, which project should be taken?d. Based on this analysis, is incremental IRR analysis necessary? If yes, please conduct the
analysis.
21. Comparing Investment Criteria Consider two mutually exclusive new product launch proj-ects that Nagano Golf is considering. Assume the discount rate for Nagano Golf is 15 percent.
Project A: Nagano NP-30. Professional clubs that will take an initial investment of $100,000 at time 0. Next fi ve years (years 1–5) of sales will generate a consistent cash fl ow of $40,000
per year. Introduction of new product at year 6 will terminate further cash fl ows from this
project.
Project B: Nagano NX-20. High-end amateur clubs that will take an initial investment of $30,000 at time 0. Cash fl ow at year 1 is $20,000. In each subsequent year cash fl ow will grow at
15 percent per year. Introduction of new product at year 6 will terminate further cash fl ows from this
22. Comparing Investment Criteria Consider two mutually exclusive R&D projects that ADM is considering. Assume the discount rate for ADM is 15 percent.
Project A: Server CPU .13 micron processing project. By shrinking the die size to .13 micron, ADM will be able to offer server
CPU chips with lower power consumption and heat generation, meaning faster CPUs.
Project B: New telecom chip project. Entry into this industry will require introduction of a new chip for cellphones. The know-how will require a lot of upfront capital, but success of the project will
23. Comparing Investment Criteria You are a senior manager at Poeing Aircraft and have been authorized to spend up to $200,000 for projects. The three projects you are considering have the following characteristics:
Project A: Initial investment of $150,000. Cash fl ow of $50,000 at year 1 and $100,000 at year 2. This is a plant expansion project, where the required rate of return is
10 percent.
Project B: Initial investment of $200,000. Cash fl ow of $200,000 at year 1 and $111,000 at year 2. This is a new product development project, where the required rate of
return is 20 percent.
Project C: Initial investment of $100,000. Cash fl ow of $100,000 at year 1 and $100,000 at year 2. This is a market expansion project, where the required rate of return is
20 percent.
Assume the corporate discount rate is 10 percent. Please offer your recommendations, backed by your analysis:
A B C Implications
PaybackIRRIncremental IRRPINPV
ww
w.m
hhe.
com
/rw
j
ros05902_ch06.indd 194ros05902_ch06.indd 194 9/25/06 9:57:16 AM9/25/06 9:57:16 AM
Chapter 6 Net Present Value and Other Investment Rules 195
24. Payback and NPV An investment under consideration has a payback of seven years and a cost of $483,000. If the required return is 12 percent, what is the worst-case NPV? The best-case NPV? Explain. Assume the cash fl ows are conventional.
25. Multiple IRRs This problem is useful for testing the ability of fi nancial calculators and computer software. Consider the following cash fl ows. How many different IRRs are there? (Hint: Search between 20 percent and 70 percent.) When should we take this project?
CHALLENGE(Questions 24–30)
26. NPV Valuation The Yurdone Corporation wants to set up a private cemetery business. According to the CFO, Barry M. Deep, business is “looking up.” As a result, the cemetery project will provide a net cash infl ow of $50,000 for the fi rm during the fi rst year, and the cash fl ows are projected to grow at a rate of 6 percent per year forever. The project requires an initial investment of $780,000.a. If Yurdone requires a 13 percent return on such undertakings, should the cemetery business
be started?b. The company is somewhat unsure about the assumption of a 6 percent growth rate in its cash
fl ows. At what constant growth rate would the company just break even if it still required a 13 percent return on investment?
27. Calculating IRR The Utah Mining Corporation is set to open a gold mine near Provo, Utah. According to the treasurer, Monty Goldstein, “This is a golden opportunity.” The mine will cost $600,000 to open and will have an economic life of 11 years. It will generate a cash infl ow of $100,000 at the end of the fi rst year, and the cash infl ows are projected to grow at 8 percent per year for the next 10 years. After 11 years, the mine will be abandoned. Abandonment costs will be $50,000 at the end of year 11.a. What is the IRR for the gold mine?b. The Utah Mining Corporation requires a 10 percent return on such undertakings. Should
the mine be opened?
28. Calculating IRR Consider two streams of cash fl ows, A and B. Stream A’s fi rst cash fl ow is $5,000 and is received three years from today. Future cash fl ows in stream A grow by 4 percent in perpetuity. Stream B’s fi rst cash fl ow is �$6,000, is received two years from today, and will continue in perpetuity. Assume that the appropriate discount rate is 12 percent.
a. What is the present value of each stream? b. Suppose that the two streams are combined into one project, called C. What is the IRR of
project C? c. What is the correct IRR rule for project C?
29. Calculating Incremental Cash Flows Darin Clay, the CFO of MakeMoney.com, has to decide between the following two projects:
The expected rate of return for either of the two projects is 12 percent. What is the range of initial investment (Io) for which Project Billion is more financially attractive than Project Million?
30. Problems with IRR McKeekin Corp. has a project with the following cash fl ows:
Year Cash Flow
0 $20,000 1 �26,000 2 13,000
What is the IRR of the project? What is happening here?
196 Part II Valuation and Capital BudgetingM
ini C
ase Bullock Gold Mining
Seth Bullock, the owner of Bullock Gold Mining, is evaluating a new gold mine in South Dakota. Dan Dority, the company’s geologist, has just fi nished his analysis of the mine site. He has estimated that the mine would be productive for eight years, after which the gold would be completely mined. Dan has taken an estimate of the gold deposits to Alma Garrett, the compa-ny’s fi nancial offi cer. Alma has been asked by Seth to perform an analysis of the new mine and present her recommendation on whether the company should open the new mine. Alma has used the estimates provided by Dan to determine the revenues that could be expected from the mine. She has also projected the expense of opening the mine and the annual operating expenses. If the company opens the mine, it will cost $500 million today, and it will have a cash outfl ow of $80 million nine years from today in costs associated with closing the mine and reclaiming the area surrounding it. The expected cash fl ows each year from the mine are shown in the following table. Bullock Mining has a 12 percent required return on all of its gold mines.
1. Construct a spreadsheet to calculate the payback period, internal rate of return, modifi ed internal rate of return, and net present value of the proposed mine.
2. Based on your analysis, should the company open the mine?
3. Bonus question: Most spreadsheets do not have a built-in formula to calculate the pay-back period. Write a VBA script that calculates the payback period for a project.
ww
w.m
hhe.
com
/rw
j
ros05902_ch06.indd 196ros05902_ch06.indd 196 9/25/06 9:57:18 AM9/25/06 9:57:18 AM