147 CHAPTER – 6 RESULTS AND DISCUSSION Detailed experiments have been carried out as discussed in the chapter 4. This chapter presents the analysis of the experimental data obtained to characterize the fuel properties of cotton seed oil and cotton seed oil-diesel blends, Palm oil and Palm oil-diesel blends and Neem oil and Neem oil-diesel blends. The performance of the engine with these fuels is also analyzed. 6.1 Experimental Data Analysis The Viscosity of the diesel, cotton seed oil and cottonseed oil-diesel blends is measured using Redwood Viscometer No.1 as presented in Appendix Tables A-1 to A-3 which show the viscosity values of diesel, cottonseed oil and cotton seed oil-diesel blends. From the viscosity measurement experiments, it is found that viscosity of pure Palm oil is around 10 times more than that of pure diesel at room temperature. The viscosity of blends gradually decreases with increase in proportions of diesel. At 50-50 blend the viscosity is 5 times that of pure diesel at room temperature. 6.2 Flash and Fire point The flash and fire points of Diesel found by Abel’s Apparatus. The flash and fire points of Cottonseed oil, Palm oil and Neem oil are found by using Clevelands’s Apparatus. The Values are shown in Appendix Table A-4. From the flash and fire point experiments, it is observed that
Transcript
147
CHAPTER – 6
RESULTS AND DISCUSSION
Detailed experiments have been carried out as discussed in the
chapter 4. This chapter presents the analysis of the experimental data
obtained to characterize the fuel properties of cotton seed oil and
cotton seed oil-diesel blends, Palm oil and Palm oil-diesel blends and
Neem oil and Neem oil-diesel blends. The performance of the engine
with these fuels is also analyzed.
6.1 Experimental Data Analysis
The Viscosity of the diesel, cotton seed oil and cottonseed oil-diesel
blends is measured using Redwood Viscometer No.1 as presented in
Appendix Tables A-1 to A-3 which show the viscosity values of diesel,
cottonseed oil and cotton seed oil-diesel blends.
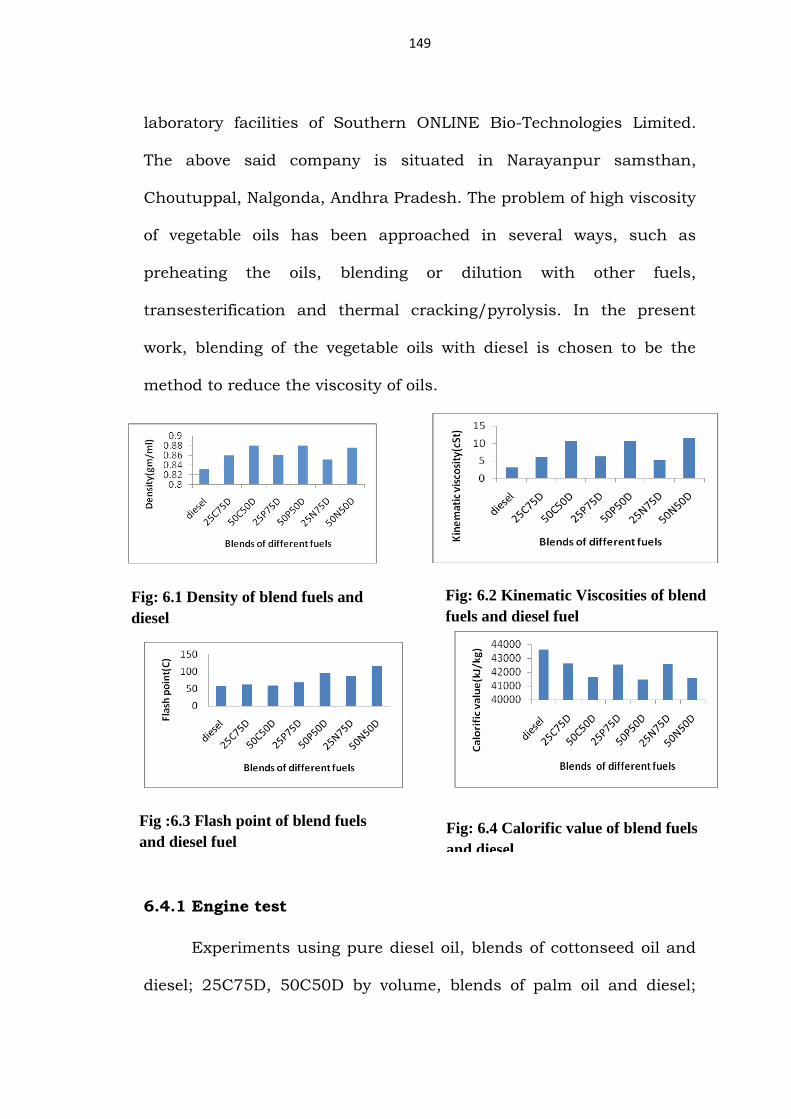
From the viscosity measurement experiments, it is found that
viscosity of pure Palm oil is around 10 times more than that of pure
diesel at room temperature. The viscosity of blends gradually
decreases with increase in proportions of diesel. At 50-50 blend the
viscosity is 5 times that of pure diesel at room temperature.
6.2 Flash and Fire point
The flash and fire points of Diesel found by Abel’s Apparatus.
The flash and fire points of Cottonseed oil, Palm oil and Neem oil are
found by using Clevelands’s Apparatus. The Values are shown in
Appendix Table A-4.
From the flash and fire point experiments, it is observed that
148
the flash and fire points of Cotton seed oil and Palm oil are much
higher than the corresponding values of diesel.
6.3 Calorific Values
The Calorific values of diesel, Cotton seed oil and Palm oil, Neem
oil are measured using Bomb calorimeter. From the calorific value
measurement experiment, it is found that the C.V. of Cotton seed oil
and Palm oil is 39.47MJ/kg and 37.20MJ/kg, and Neem Oil
39.50MJ/Kg which is slightly less than the C.V. of diesel, 45.52
MJ/kg. This suggests that Palm oil and Cotton seed oil can be used in
a diesel engine without much change.
From the performance test of 25% diesel & 75% Cotton seed oil
blend it is observed that the brake thermal efficiency is almost
identical with that of pure diesel operation throughout the entire
range of power output. The exhaust gas temperature and smoke level
are near to that of diesel engine operation. It is observed that 225
Kg/cm2 is the optimum injection pressure for better performance. The
value of S.F.C is also nearer to the diesel performance value.
It is observed that at lower power outputs 225 Kg/cm2 is the
optimum injection pressures but at higher outputs, there is no
improvement. This is because, preheating is not employed, and Spray
characteristics are improved by increasing the injection pressures.
6.4 Performance of the C.I. Engine
The properties of the fuel blends such as 25C75D, 50C50D,
25P75D, 50P50D, 25N75D, 50N50D are obtained from the standard
149
laboratory facilities of Southern ONLINE Bio-Technologies Limited.
The above said company is situated in Narayanpur samsthan,
Choutuppal, Nalgonda, Andhra Pradesh. The problem of high viscosity
of vegetable oils has been approached in several ways, such as
preheating the oils, blending or dilution with other fuels,
transesterification and thermal cracking/pyrolysis. In the present
work, blending of the vegetable oils with diesel is chosen to be the
method to reduce the viscosity of oils.
6.4.1 Engine test
Experiments using pure diesel oil, blends of cottonseed oil and
diesel; 25C75D, 50C50D by volume, blends of palm oil and diesel;
Fig: 6.2 Kinematic Viscosities of blend
fuels and diesel fuel
Fig :6.3 Flash point of blend fuels
and diesel fuel
Fig: 6.4 Calorific value of blend fuels
and diesel
Fig: 6.1 Density of blend fuels and
diesel
150
25P75P, 50P50D by volume, blends of Neem oil and diesel; 25N75D,
50N50D by volume at different injection pressures have been
conducted on constant speed Kirloskar engine whose specifications
are shown in Appendix-A-1. A hydraulic dynamometer is used for
loading the engine. The experimental set-up diagram is shown in
chapter -3
Fig: 6.5 Brake thermal efficiency of the engine using different blended
fuels under various operating conditions at injection pressure 200
kg/cm2
Fig: 6.6 Brake specific fuel consumption of the engine using
different blended fuels under various operating conditions at
injection pressure 200 kg/cm2
151
Fig: 6.7 Brake thermal efficiency of the engine using different blended fuels
under various operating conditions at injection pressure 225 kg/cm2
Fig: 6.8 Brake specific fuel consumption of the engine using different
blended fuels under various operating conditions at injection pressure 225
kg/cm2
Fig: 6.9 Brake thermal efficiency of the engine using different blended fuels
under various operating conditions at injection pressure 250kg/cm2
152
Fig: 6.10 Brake specific fuel consumption of the engine using different
blended fuels under various operating conditions at injection pressure 250
kg/cm2
6.4.2 Effect of brake power on brake thermal efficiency
The variation of brake thermal efficiency of the engine between 25N75D,
25C75D, 25P75D & 50N50D, 50C50D, 50P50D blends and diesel at various
injection pressures of 200, 225 and 250Kg/cm2 is shown in Fig. 6.5, 6.7 and 6.9.
From the test results it is observed that initially with increasing brake power, the
brake thermal efficiencies of various blends and diesel are increased and the
maximum thermal efficiencies are obtained at brake power of 3.0189 kW and
then tended to decrease with the further increase in brake power. The brake
thermal efficiencies of various blends are lower than that with the diesel fuel
throughout the entire range. The maximum values of brake thermal efficiencies
with 25N75D, 25C75D, 25P75D are observed as 24.175%, 22.41%, and 22.42%
respectively at injection pressure of 225 kg/cm2. Corresponding maximum brake
thermal efficiencies of 22.74%, 21.95%, and 23.28% are observed with 50N50D,
50C50D, 50P50D at injection pressure of 225 kg/cm2.
153
6.4.3 Effect of brake power on brake specific fuel consumption
The variation of brake specific fuel consumption of the engine
between 25N75D, 25C75D, 25P75D & 50N50D,50C50D,50P50D blends
and diesel at various injection pressures of 200, 225 and 250Kg/cm2 is
shown in Fig. 6.6,6.8 and 6.10. From the test results it is observed that
initially with increasing brake power, the brake specific fuel consumption
of various blends and diesel are decreased and the minimum brake
specific fuel consumption is obtained at brake power of 3.0189 kW and
then tended to increase with the further increase in brake power. The
brake specific fuel consumption of various blends is higher than that
with the diesel fuel throughout the entire range. This is mainly due to the
combined effects of the relative fuel density, viscosity and calorific value
of the blends. However, blends of 25N75D, 25C75D, 25P75D have brake
specific fuel consumption very close to that of diesel oil.
Figure 6.11 shows the comparison of B.S.F.C. at three different
injection pressures of 200 kg/cm2, 225 kg/cm2 and 250kg/cm2. From
Fig. 6.11 Comparison of Specific fuel consumption Vs Brake power for 25C75D
154
the figure, it is observed that the B.S.F.C. is minimum at 225 kg/cm2.
This is explained in a way that, with increase in the fuel injection
pressure, the droplet size, no doubt decreases, but the velocity is so high,
that it goes and hits the cylinder walls.
Figure 6.12 shows the comparison of the B.S.F.C for 50C50D
blend at 225 kg/cm2. This is attributed to the lower value of calorific
value of cottonseed oil compared to diesel. Since the viscosity of Cotton
seed oil is considerably greater than that of diesel, it is felt that injection
pressure which influences the performance. Accordingly, experiments are
conducted at different fuel injection pressures.
Fig. 6.12 Comparison of Specific fuel consumption Vs Brake power for 50C50D
Fig. 6.13 Comparison of Specific fuel
consumption Vs Brake power
Fig. 6.14 Comparison of Exhaust gas
temperature Vs Brake power
155
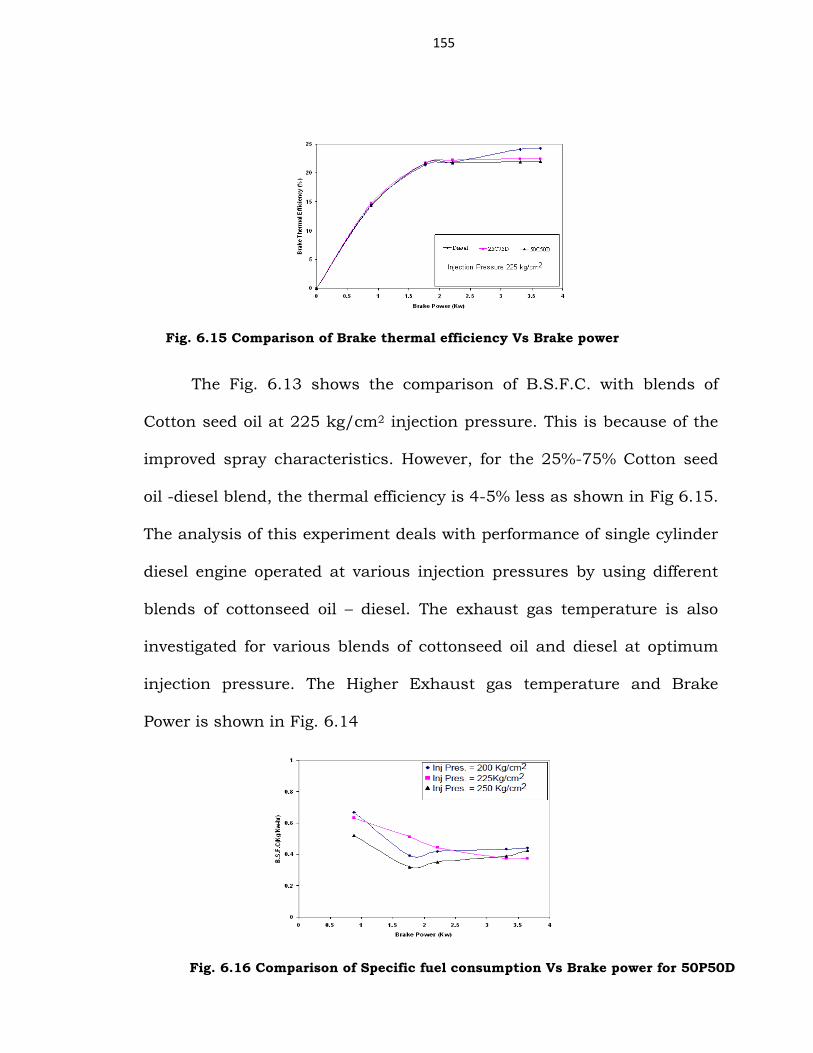
The Fig. 6.13 shows the comparison of B.S.F.C. with blends of
Cotton seed oil at 225 kg/cm2 injection pressure. This is because of the
improved spray characteristics. However, for the 25%-75% Cotton seed
oil -diesel blend, the thermal efficiency is 4-5% less as shown in Fig 6.15.
The analysis of this experiment deals with performance of single cylinder
diesel engine operated at various injection pressures by using different
blends of cottonseed oil – diesel. The exhaust gas temperature is also
investigated for various blends of cottonseed oil and diesel at optimum
injection pressure. The Higher Exhaust gas temperature and Brake
Power is shown in Fig. 6.14
Fig. 6.15 Comparison of Brake thermal efficiency Vs Brake power
Fig. 6.16 Comparison of Specific fuel consumption Vs Brake power for 50P50D
156
Figure 6.16 shows the comparison of the B.S.F.C for 50P50D at
225 kg/cm2.This is attributed to the lower value of calorific value of Palm
oil compared to diesel. Since the viscosity of Palm oil is considerably
greater than that of diesel.
Figure 6.17 shows the comparison of B.S.F.C. at three different
injection pressures of 200 kg/cm2, 225 kg/cm2 and 250kg/cm2. From
the figure, it is observed that the B.S.F.C. is minimum at 225 kg/cm2.
This is explained in a way that, with increase in the fuel injection
pressure, the droplet size, no doubt decreases, but the velocity is so high,
that it goes and hits the cylinder walls. This represents the layer of air
and fuel, unburnt due to wall quenching. The higher exhaust gas
temperature and Brake Power as shown in Figures 6.19.
Fig. 6.17 Comparison of Specific fuel consumption Vs Brake power for 25P75D
157
Since the viscosity of Palm oil is considerably higher compared to
diesel test is carried out. Fig. 6.18 shows the comparison of B.S.F.C. with
Palm oil and at 225 kg/cm2 injection pressure. It is observed from the
figure there is a 4-6% decrease in the B.S.F.C. The Fig 6.20 shows the
comparison of the performance of different blends of Palm oil and diesel.
It is observed that for 50%-50% palm oil –diesel blend, the brake thermal
efficiency is almost identical with that of pure diesel operating
throughout the range of power output. However, for the 75%-25% diesel-
palm blend, the thermal efficiency is 5-7% less.
Fig. 6.18 Comparison of Specific fuel
consumption Vs Brake power
Fig. 6.19 Comparison of Exhaust gas
temperature Vs Brake power
Fig. 6.20 Comparison of Brake thermal efficiency Vs Brake power
158
Figure 6.21 shows the comparison of B.S.F.C. at three different
injection pressures of 200 kg/cm2, 225 kg/cm2 and 250kg/cm2. From
the figure, it is observed that the B.S.F.C. is minimum at 225 kg/cm2.
This is explained in a way that, with increase in the fuel injection
pressure, the droplet size, no doubt decreases, but the velocity is so high,
that it goes and hits the cylinder walls.
Figure 6.22 shows the comparison of the B.S.F.C for 50N50D
blend at 225 kg/cm2. This is attributed to the lower value of calorific
value of cottonseed oil compared to diesel. Since the viscosity of Neem oil
Fig. 6.21 Comparison of Specific fuel consumption Vs Brake power for 25N75D
Fig. 6.22 Comparison of Specific fuel consumption Vs Brake power for 50N50D
159
is considerably greater than that of diesel, it is felt that injection pressure
is influence the performance. Accordingly, experiments are conducted at
different fuel injection pressures.
The Fig. 6.23 shows the comparison of B.S.F.C. with blends of
Neem oil at 225 kg/cm2 injection pressure. This is because of the
improved spray characteristics. However, for the 25%-75% Neem oil -
diesel blend, the thermal efficiency is 4-7% less as shown in Fig 6.25.
Fig. 6.23 Comparison of Specific fuel
consumption Vs Brake power
Fig. 6.24 Comparison of Exhaust gas
temperature Vs Brake power
Fig. 6.25 Comparison of Brake thermal efficiency Vs Brake power
160
The analysis of this experiment deals with performance of single cylinder
diesel engine operated at various injection pressures by using different
blends of Neem oil – diesel. The exhaust gas temperature is also
investigated for various blends of Neem oil and diesel at optimum
injection pressure. The Exhaust gas temperature and Brake Power is
shown in Fig. 6.24
6.5 Emission Characteristics of Different blends at Various
Injection Pressures
6.5.1 Cottonseed Oil Blends
Fig.6.26 shows the variation CO2 with brake power output for
Cottonseed oil and its blends with diesel in the test engine at an injection
pressure of 200kg/cm2. CO2 emission of 50% blends having higher
values compared with all other blends and diesel. The highest value of
CO2 at 25% blend of cottonseed oil is 7.54% in respect to the value of
7.7% for diesel.
Fig.6.27 shows the variation of CO emission with brake power
output for cottonseed oil and its blends with diesel in the test engine at
an injection pressure of 200kg/cm2. The CO of 50% blend of cottonseed
oil has higher values compared with all other blends and is well
comparable with diesel. The CO of all blends and diesel increases with
increase of brake power.
Fig.6.28 shows the variation of hydrocarbon emission with brake
power output for cottonseed oil and its blends with diesel in the test
161
engine at an injection pressure of 200kg/cm2. HC emission of 50% blend
of cottonseed oil has higher emission compared with all other blends.
While, HC of Diesel and 25% blend of Cottonseed oil are near to pure
diesel.
Fig.6.29 shows the variation of NOx emission with brake power
output for cottonseed oil and its blends with diesel in the test engine at
an injection pressure of 200kg/cm2. NOx of 25% blend of cottonseed oil is
less than the diesel. 50% blend has less NOx emission compared with all
other blends throughout all brake power loads.
Fig.6.30 shows the variation of smoke emission with brake power
output for cottonseed oil and its blends with diesel in the test engine at
an injection pressure of 200kg/cm2. Diesel has lower smoke emission
compared with all other blends of cottonseed oil.
Figure 6.26: Comparison of CO2 Emission Vs Brake Power
162
Fig.6.31 shows the variation CO2 with brake power output for
Cottonseed oil and its blends with diesel in the test engine at an injection
pressure of 225kg/cm2. CO2 emission of 50% blends having higher
values compared with all other blends and diesel.
Fig.6.32 shows the variation of CO emission with brake power
output for cottonseed oil and its blends with diesel in the test engine at
an injection pressure of 225kg/cm2. The CO of 50% blend of cottonseed
oil has higher values compared with all other blends and is well
Figure 6.27: Comparison of CO
Emission Vs Brake Power
Figure 6.28: Comparison of HC
Emission Vs Brake Power
Figure 6.29: Comparison of NOX
Emission Vs Brake Power
Figure 6.30: Comparison of Smoke Level Vs Brake Power
163
comparable with 25% blend. The CO emission of all blends and diesel
increases with increase in brake power load.
Fig.6.33 shows the variation of hydrocarbon emission with brake
power output for cottonseed oil and its blends with diesel in the test
engine at an injection pressure of 225kg/cm2. HC emission of 50% blend
of cottonseed oil has higher emission compared with all other blends.
While, HC of Diesel and 25% blend of Cottonseed oil have more emission
than pure diesel.
Fig.6.34 shows the variation of nitrogen oxide emission with brake
power output for cottonseed oil and its blends with diesel in the test
engine at an injection pressure of 225kg/cm2. NOx of 25% blend of
cottonseed oil is slightly less than that of diesel. 50% blend has less NOX
emission compared with all other blends throughout all brake power
loads.
Fig.6.35 shows the variation of smoke Emission with brake power
output for cottonseed oil and its blends with diesel in the test engine at
an injection pressure of 225kg/cm2. Diesel has lower smoke emission
compared with all other blends of cottonseed oil.
164
Figure 6.31: Comparison of CO2 Emission Vs Brake Power
Figure 6.32: Comparison of CO
Emission Vs Brake Power
Figure 6.33: Comparison of HC
Emission Vs Brake Power
Figure 6.34: Comparison of NOX
Emission Vs Brake Power
Figure 6.35: Comparison of Smoke Level Vs Brake Power
165
Fig.6.36 shows the variation CO2 emission with brake power
output for Cottonseed oil and its blends with diesel in the test engine at
an injection pressure of 250kg/cm2. CO2 emission of 50% blends having
higher values compared with all other blends and diesel. The highest
value of CO2 at 25% blend of cottonseed oil is 6.71% in respect to the
value of 6.34% for diesel.
Fig.6.37 shows the variation of CO emission with brake power
output for cottonseed oil and its blends with diesel in the test engine at
an injection pressure of 250kg/cm2. The CO of 50% blend of cottonseed
oil has higher values compared with all other blends and is well
comparable with diesel. The CO of all blends and diesel increases with
increase of brake power.
Fig.6.38 shows the variation of hydrocarbon emission with brake
power output for cottonseed oil and its blends with diesel in the test
engine at an injection pressure of 250kg/cm2. HC emission of 50% blend
of cottonseed oil has higher emission compared with all other blends.
Fig.6.39 shows the variation of nitrogen oxide emission with brake
power output for cottonseed oil and its blends with diesel in the test
engine at an injection pressure of 250kg/cm2. NOX of 25% blend of
cottonseed oil is less than that of diesel. 50% blend has less NOX
emission compared with all other blends throughout all brake power
loads.
166
Fig.6.40 shows the variation of smoke emission with brake power
output for cottonseed oil and its blends with diesel in the test engine at
an injection pressure of 250kg/cm2. Diesel has lower smoke emission
compared with all other blends of cottonseed oil.
Figure 6.36: Comparison of CO2 Emission Vs Brake Power
Figure 6.37: Comparison of CO
Emission Vs Brake Power
Figure 6.38: Comparison of HC
Emission Vs Brake Power
Figure 6.39: Comparison of NOX
Emission Vs Brake Power
Figure 6.40: Comparison of Smoke Level Vs Brake Power
167
6.5.2 Palm Oil Blends
Fig.6.41 shows the variation CO2 with brake power output for Palm
oil and its blends with diesel in the test engine at an injection pressure of
200kg/cm2. CO2 Emission of 50% blends having higher values compared
with all other blends and diesel. The highest value of CO2 at 25% blend
of palm oil is 8.1% in respect to the value of 7.72% for diesel.
Fig.6.42 shows the variation of CO emission with brake power
output for palm oil and its blends with diesel in the test engine at an
injection pressure of 200kg/cm2. The CO of 50% blend of palm oil has
higher values compared with all other blends. The CO of all blends and
diesel increases with increase of brake power.
Fig.6.43 shows the variation of hydrocarbon emission with brake
power output for palm oil and its blends with diesel in the test engine at
an injection pressure of 200kg/cm2. HC emission of 50% blend of palm
oil has higher emission compared with all other blends. While, HC of
Diesel and 25% blend of Palm oil are much less compared to 50% blend.
Fig.6.44 shows the variation of nitrogen oxide emission with brake
power output for palm oil and its blends with diesel in the test engine at
an injection pressure of 200kg/cm2. NOX of 25% blend of palm oil is less
than that of diesel. 50% blend has less NOX emission compared with all
other blends throughout all brake power loads.
Fig.6.45 shows the variation of smoke emission with brake power
output for palm oil and its blends with diesel in the test engine at an
168
injection pressure of 200kg/cm2. Diesel has lower smoke emission
compared with all other blends of palm oil. 25% blend of the palm oil
smoke level is well comparable with diesel.
Figure 6.41: Comparison of CO2 Emission Vs Brake Power
Figure 6.42: Comparison of CO
Emission Vs Brake Power
Figure 6.43: Comparison of HC
Emission Vs Brake Power
169
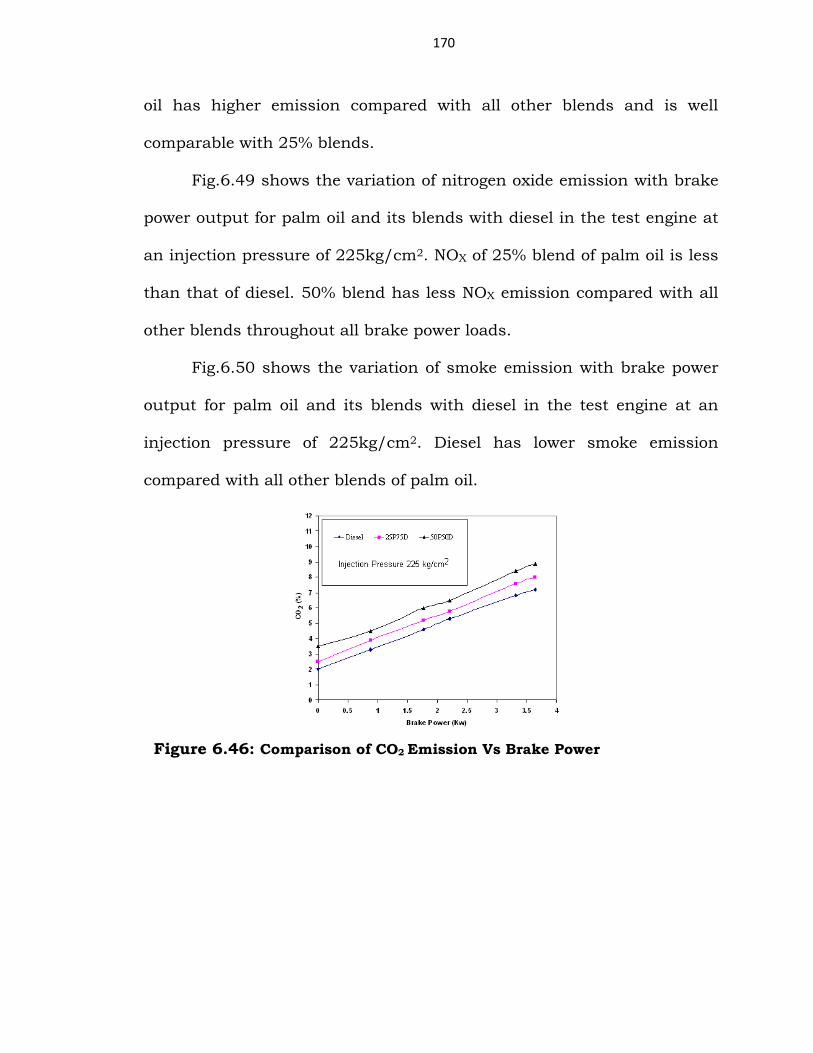
Fig.6.46 shows the variation CO2 with brake power output for Palm
oil and its blends with diesel in the test engine at an injection pressure of
225kg/cm2. CO2 emission of 50% blends having higher values compared
with all other blends and diesel.
Fig.6.47 shows the variation of CO emission with brake power
output for palm oil and its blends with diesel in the test engine at an
injection pressure of 225kg/cm2. The CO of 50% blend of palm oil has
higher values compared with all other blends. Diesel CO emission is has
comparable with 25% blend. The CO emission of all blends and diesel
increases with increase in brake power load.
Fig.6.48 shows the variation of hydrocarbon emission with brake
power output for palm oil and its blends with diesel in the test engine at
an injection pressure of 225kg/cm2. HC emission of 50% blend of palm
Figure 6.44: Comparison of NOX
Emission Vs Brake Power
Figure 6.45: Comparison of Smoke Level Vs Brake Power
170
oil has higher emission compared with all other blends and is well
comparable with 25% blends.
Fig.6.49 shows the variation of nitrogen oxide emission with brake
power output for palm oil and its blends with diesel in the test engine at
an injection pressure of 225kg/cm2. NOX of 25% blend of palm oil is less
than that of diesel. 50% blend has less NOX emission compared with all
other blends throughout all brake power loads.
Fig.6.50 shows the variation of smoke emission with brake power
output for palm oil and its blends with diesel in the test engine at an
injection pressure of 225kg/cm2. Diesel has lower smoke emission
compared with all other blends of palm oil.
Figure 6.46: Comparison of CO2 Emission Vs Brake Power
171
Fig.6.51 shows the variation CO2 with brake power output for Palm
oil and its blends with diesel in the test engine at an injection pressure of
250kg/cm2. CO2 emission of 50% blends having higher values compared
with all other blends and diesel. The highest value of CO2 at 25% blend
of palm oil is 6.54% in respect to the value of 6.34% for diesel.
Fig.6.52 shows the variation of CO emission with brake power
output for palm oil and its blends with diesel in the test engine at an
injection pressure of 250kg/cm2. The CO of 50% blend of palm oil has
Figure 6.47: Comparison of CO
Emission Vs Brake Power
Figure 6.48: Comparison of HC
Emission Vs Brake Power
Figure 6.49: Comparison of NOX
Emission Vs Brake Power
Figure 6.50: Comparison of Smoke Level Vs Brake Power
172
comparable values with all other blends and is well comparable with 25%
blend. The CO of all blends and diesel increases with increase of brake
power.
Fig.6.53 shows the variation of hydrocarbon emission with brake
power output for palm oil and its blends with diesel in the test engine at
an injection pressure of 200kg/cm2. HC emission of 50% blend of palm
oil has higher emission compared with all other blends.
Fig.6.54 shows the variation of nitrogen oxide emission with brake
power output for palm oil and its blends with diesel in the test engine at
an injection pressure of 250kg/cm2. NOX of 25% blend of palm oil is less
than that of diesel. 50% blend has less NOX emission compared with all
other blends throughout all brake power loads.
Fig.6.55 shows the variation of smoke emission with brake power
output for palm oil and its blends with diesel in the test engine at an
injection pressure of 250kg/cm2.
Figure 6.51: Comparison of CO2 Emission Vs Brake Power
173
6.5.3 Neem Oil Blends
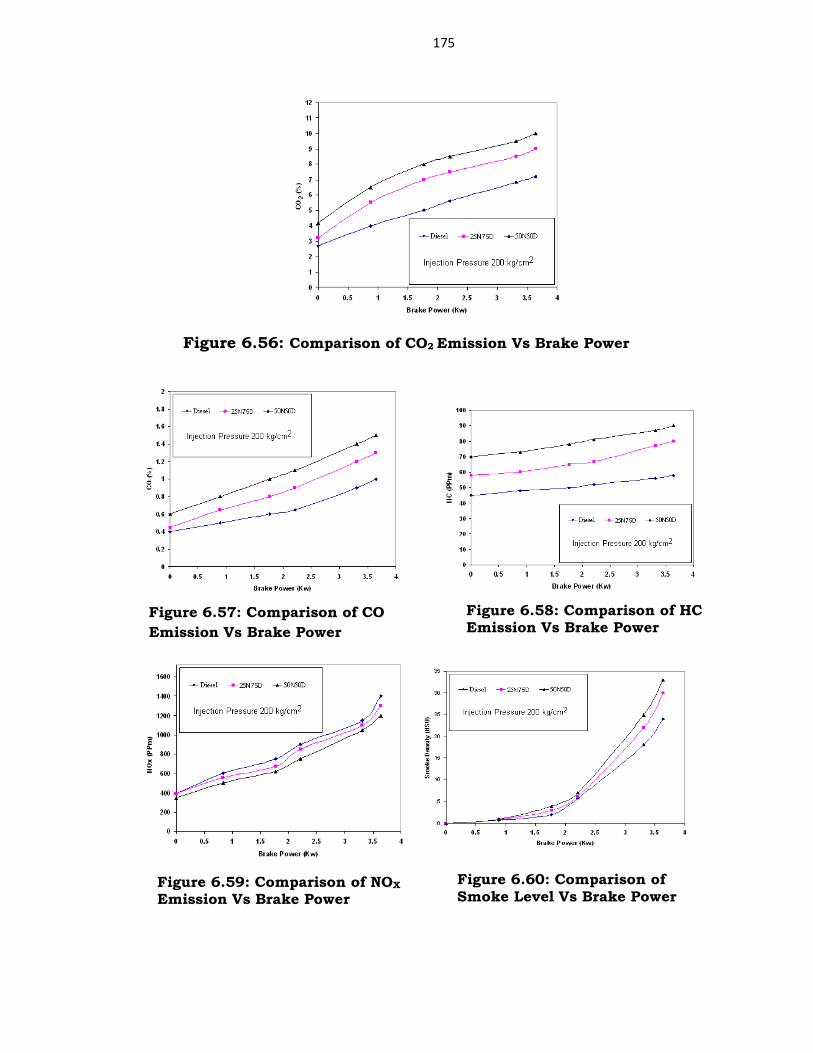
Fig.6.56 shows the variation CO2 with brake power output for
Neem oil and its blends with diesel in the test engine at an injection
pressure of 200kg/cm2. CO2 emission of 50% blends having higher
values compared with all other blends and diesel. The highest value of
CO2 at 25% blend of Neem oil is 9.22% in respect to the value of 7.2% for
diesel.
Figure 6.52: Comparison of CO
Emission Vs Brake Power
Figure 6.53: Comparison of HC
Emission Vs Brake Power
Figure 6.54: Comparison of NOX
Emission Vs Brake Power
Figure 6.55: Comparison of Smoke Level Vs Brake Power
174
Fig.6.57 shows the variation of CO emission with brake power
output for Neem oil and its blends with diesel in the test engine at an
injection pressure of 200kg/cm2. The CO of 50% blend of Neem oil has
higher values compared with all other blends. The CO of all blends and
diesel increases with increase of brake power.
Fig.6.58 shows the variation of hydrocarbon emission with brake
power output for Neem oil and its blends with diesel in the test engine at
an injection pressure of 200kg/cm2. HC emission of 50% blend of Neem
oil has higher emission compared with all other blends.
Fig.6.59 shows the variation of nitrogen oxide emission with brake
power output for Neem oil and its blends with diesel in the test engine at
an injection pressure of 200kg/cm2. NOX of 25% blend of Neem oil is less
than that of diesel. 50% blend has less NOX emission compared with all
other blends throughout all brake power loads.
Fig.6.60 shows the variation of smoke emission with brake power
output for Neem oil and its blends with diesel in the test engine at an
injection pressure of 200kg/cm2. Diesel has higher smoke emission
compared with all other blends of Neem oil.
175
Figure 6.56: Comparison of CO2 Emission Vs Brake Power
Figure 6.57: Comparison of CO
Emission Vs Brake Power
Figure 6.58: Comparison of HC
Emission Vs Brake Power
Figure 6.59: Comparison of NOX
Emission Vs Brake Power
Figure 6.60: Comparison of
Smoke Level Vs Brake Power
176
Fig.6.61 shows the variation CO2 with brake power output for
Neem oil and its blends with diesel in the test engine at an injection
pressure of 225kg/cm2. CO2 emission of 50% blends having higher
values compared with all other blends and diesel.
Fig.6.62 shows the variation of CO emission with brake power
output for Neem oil and its blends with diesel in the test engine at an
injection pressure of 225kg/cm2. The CO of 50% blend of Neem oil has
higher values compared with all other blends.
Fig.6.63 shows the variation of hydrocarbon emission with brake
power output for Neem oil and its blends with diesel in the test engine at
an injection pressure of 225kg/cm2. HC emission of 50% blend of Neem
oil has higher emission compared with all other blends and is well
comparable with 25% blends.
Fig.6.64 shows the variation of nitrogen oxide emission with brake
power output for Neem oil and its blends with diesel in the test engine at
an injection pressure of 225kg/cm2. NOX of 25% blend of Neem oil is
slightly higher than that of diesel. 50% blend has higher NOX emission
compared with all other blends throughout all brake power loads.
Fig.6.65 shows the variation of smoke emission with brake power
output for Neem oil and its blends with diesel in the test engine at an
injection pressure of 225kg/cm2. Diesel has lower smoke emission
compared with all other blends of Neem oil.
177
Figure 6.61: Comparison of CO2 Emission Vs Brake Power
Figure 6.62: Comparison of CO
Emission Vs Brake Power
Figure 6.63: Comparison of HC
Emission Vs Brake Power
Figure 6.64: Comparison of NOX
Emission Vs Brake Power
Figure 6.65: Comparison of Smoke Level Vs Brake Power
178
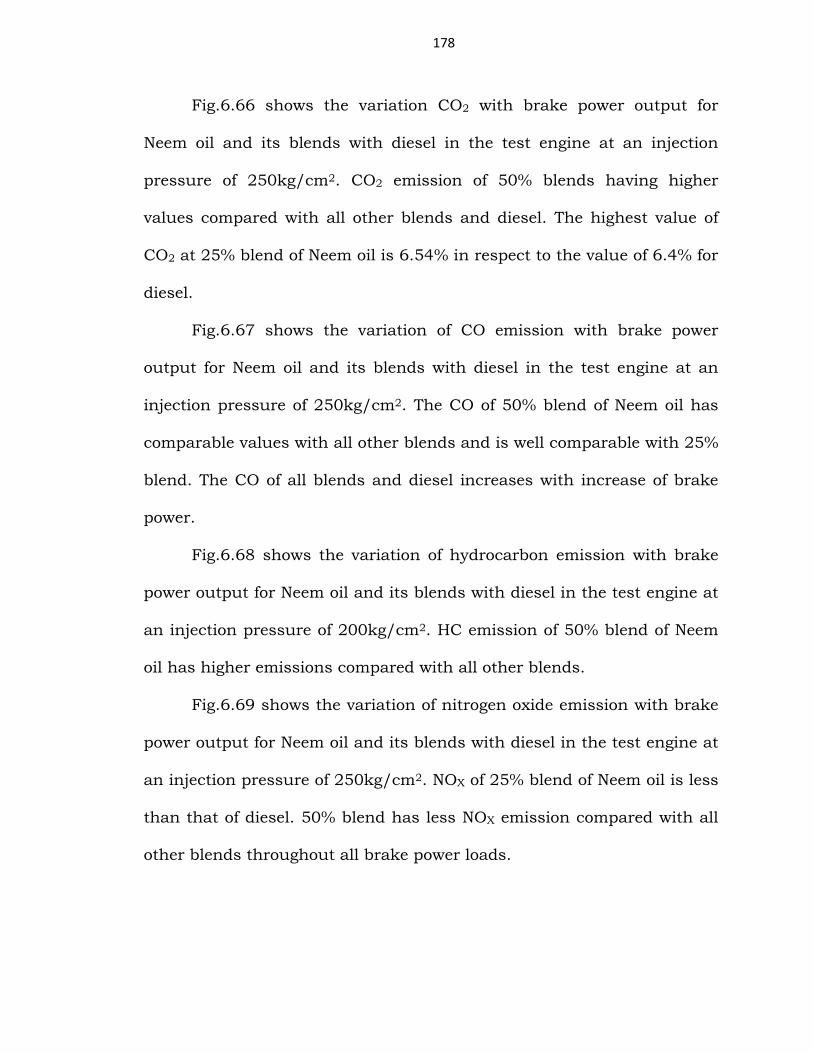
Fig.6.66 shows the variation CO2 with brake power output for
Neem oil and its blends with diesel in the test engine at an injection
pressure of 250kg/cm2. CO2 emission of 50% blends having higher
values compared with all other blends and diesel. The highest value of
CO2 at 25% blend of Neem oil is 6.54% in respect to the value of 6.4% for
diesel.
Fig.6.67 shows the variation of CO emission with brake power
output for Neem oil and its blends with diesel in the test engine at an
injection pressure of 250kg/cm2. The CO of 50% blend of Neem oil has
comparable values with all other blends and is well comparable with 25%
blend. The CO of all blends and diesel increases with increase of brake
power.
Fig.6.68 shows the variation of hydrocarbon emission with brake
power output for Neem oil and its blends with diesel in the test engine at
an injection pressure of 200kg/cm2. HC emission of 50% blend of Neem
oil has higher emissions compared with all other blends.
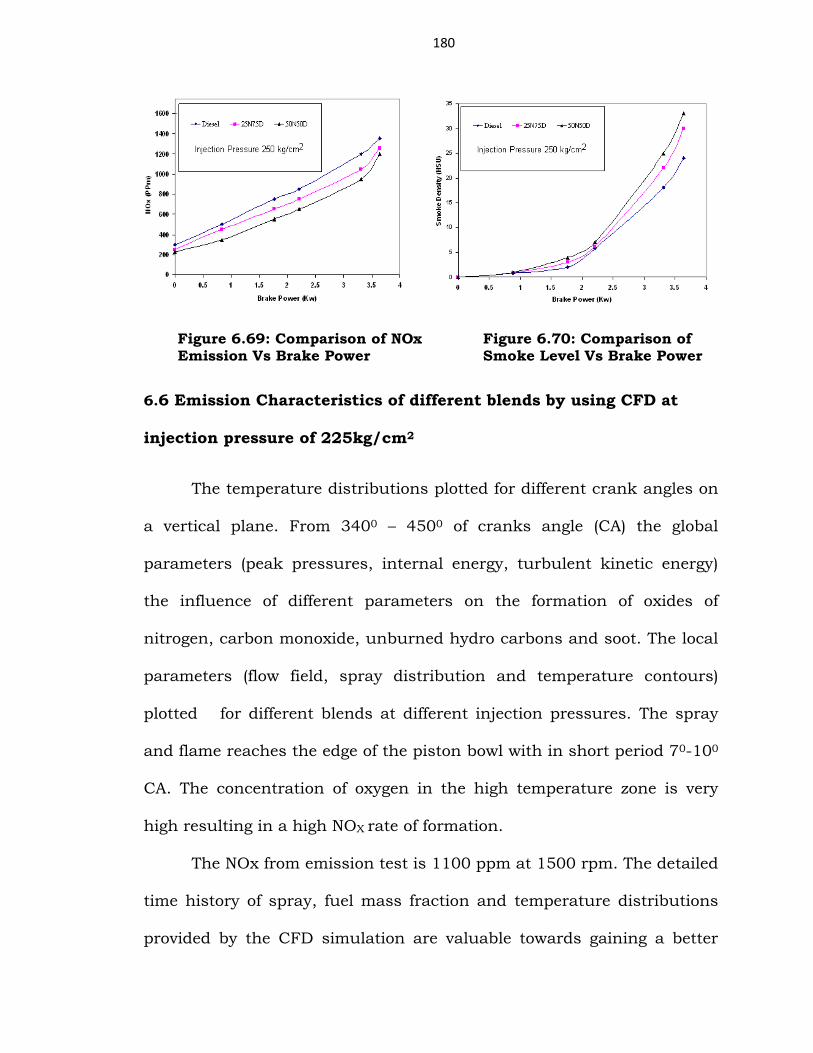
Fig.6.69 shows the variation of nitrogen oxide emission with brake
power output for Neem oil and its blends with diesel in the test engine at
an injection pressure of 250kg/cm2. NOX of 25% blend of Neem oil is less
than that of diesel. 50% blend has less NOX emission compared with all
other blends throughout all brake power loads.
179
Fig.6.70 shows the variation of smoke emission with brake power
output for Neem oil and its blends with diesel in the test engine at an
injection pressure of 250kg/cm2.
Figure 6.66: Comparison of CO2 Emission Vs Brake Power
Figure 6.67: Comparison of CO
Emission Vs Brake Power
Figure 6.68: Comparison of HC
Emission Vs Brake Power
180
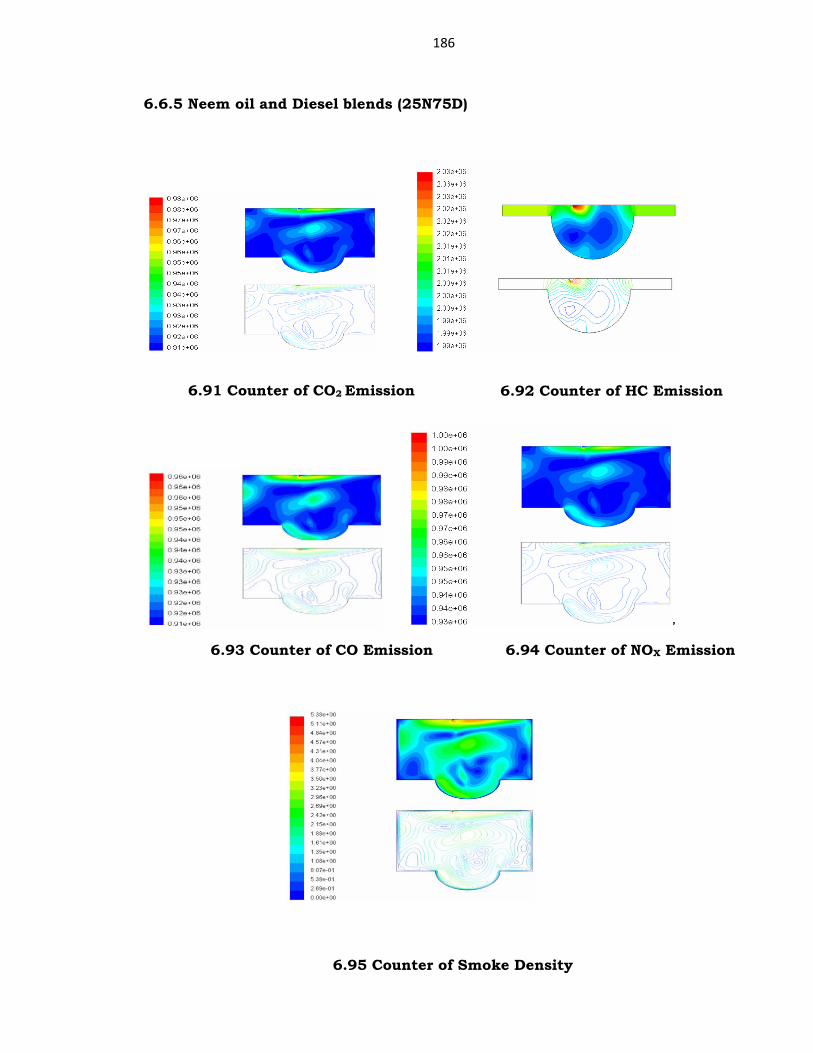
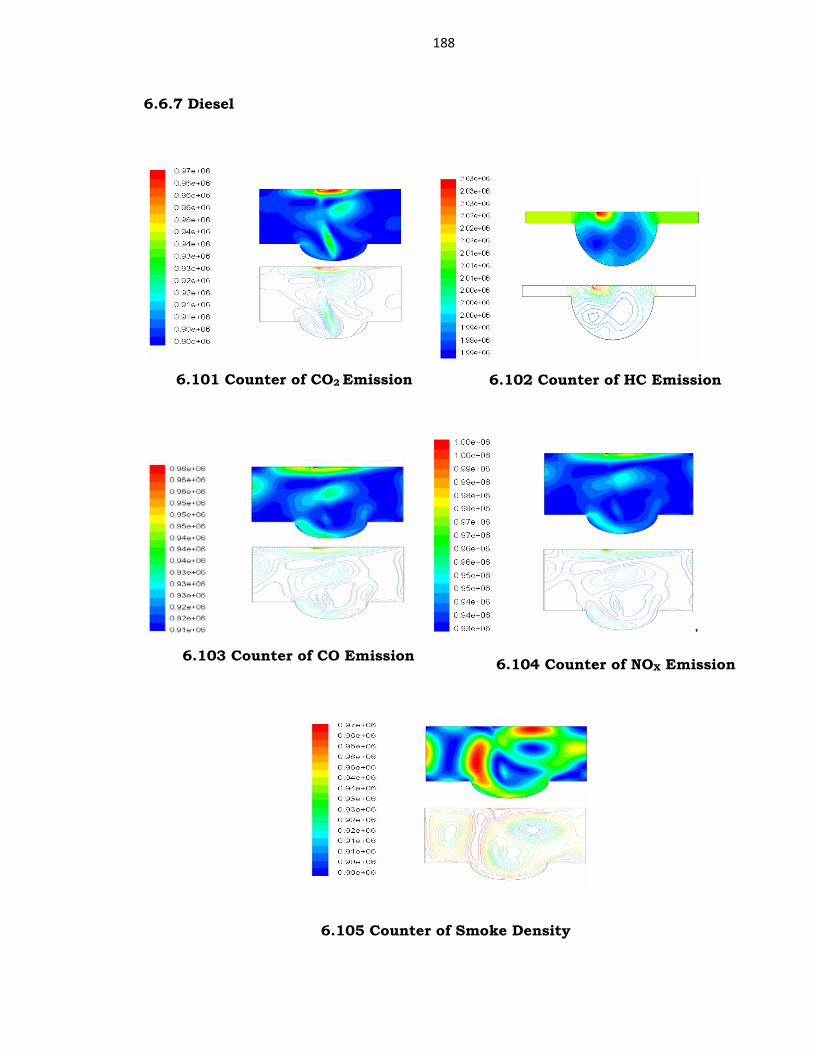
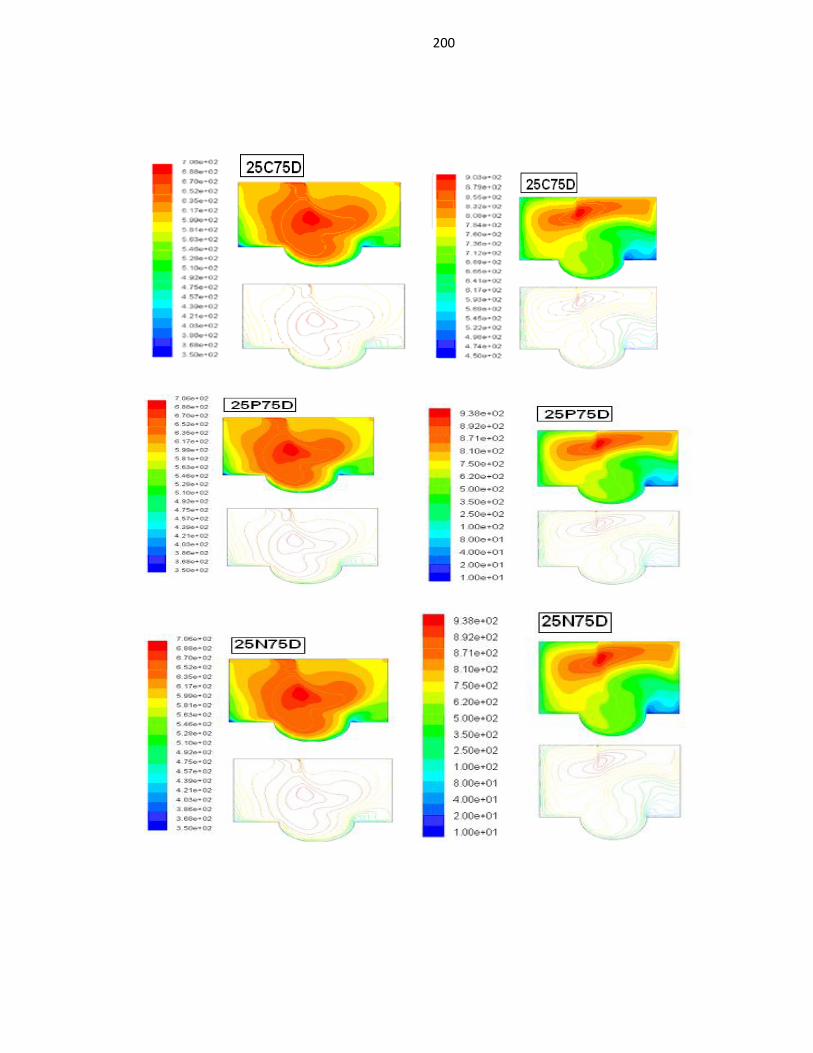
6.6 Emission Characteristics of different blends by using CFD at
injection pressure of 225kg/cm2
The temperature distributions plotted for different crank angles on
a vertical plane. From 3400 – 4500 of cranks angle (CA) the global