35
Chapter 7 Chapter 7 How to Measure How to Measure Uncertainty With Uncertainty With Probability Probability
| Date post: | 29-Mar-2015 |
| Category: |
Documents |
| Upload: | hayden-rome |
| View: | 246 times |
| Download: | 7 times |

Chapter 7Chapter 7
How to Measure Uncertainty How to Measure Uncertainty With ProbabilityWith Probability

Homework 12Homework 12
• Read pages pages 454 - 470.
• LDI: 7.20, 7.22 7.24
• Exercises: 7.47, 7.48, 7.50, 7.59

Random VariablesRandom Variables
• A random variable is an uncertain numerical quantity whose value depends on the outcome of a random experiment. We can think of a random variable as a rule that assigns one and only one numerical value to each point of the sample space for a random experiment.

ExampleExample
• If you play craps, the sum of the pips on the dice are the random variable. The random experiment is the rolling of the dice.

Random Process = tossing a fair coin three times.
There are eight possible individual outcomes in this sample space. Since the coin is assumed to be fair, the eight outcomes can be assumed to be equally likely (that is, the probability assigned to each individual outcome is 1/8).
H H H H H T H T H
T H H
T T H T H T
H T T
T T T
S =
T
First
HH
T
H
TH
T
H
T
H
TH
T
TossSecondToss
ThirdToss

7.4.2 Rules of Probabilities• To any event A, we assign a number P(A) called the
probability of the event A.• Assign a probability to each individual outcome, each
being a number between 0 and 1, such that the sum of these individual probabilities is equal to 1, and,
• The probability of any event is the sum of the probabilities of the outcomes that make up that event.
• If the outcomes in the sample space are equally likely to occur, the probability of an event A is simply the proportion of outcomes in the sample space that make up the event A.

Discrete Random VariableDiscrete Random Variable• A discrete random variable can
assume at most a finite or infinite but countable number of distinct values.
• Example: Number of eggs a chicken lays in a day.
• Example: Number of bombs dropped on a city.
• Example: Number of casualties in a battle.

Continuous Random VariableContinuous Random Variable
• A continuous random variable can assume any value in an interval or collection of intervals. It always has an infinite number of possible values.
• Example: Gallons of milk from a cow over its life• Example: Number of hours that CNN
broadcasted the Iraq war with out interruption.• Example: Number of hours a battery will run a
flashlight.

• Give the values the random variable can take on:
• X is the difference between the number of heads and number of tails obtained when a fair coin is tossed 3 times.
• Y is the product of the pips for the roll of 2 fair dice.
• R is the time in minutes that this class lasts.

• A discrete random variable can assume at most a finite or infinite but countable number of distinct values.
• A continuous random variable can assume any value in an interval or collection of intervals.


Probability Distribution of a Probability Distribution of a Discrete RVDiscrete RV
• The probability distribution of a discrete random variable X is a table or rule that assigns a probability to each of the possible values of the discrete random variable X.
€
0 ≤ pi x( ) ≤1
€
pi x( ) =1∑

Example 7.12Example 7.12• Let X represent the number of people in an apartment.
Assume the maximum in a single apartment is 7. • What must be the probability of 7 people in a household
for this to be a legitimate discrete distribution?
• Display this probability distribution graphically. • What is the probability that a randomly chosen household
contains more than 5 people? • What is the probability that a randomly chosen household
contains no more than 2 people? • The probability that a randomly selected household has
more than 2 but at most 4 people?

2 4 6 x = # people
.2
.3
.4p(x)
1 3 5 7
probability
2 4 6 x = # people
.2
.3
.4p(x)
1 3 5 7
probability histogram

• Let's Do It! 7.20 Sum of Pips• Craps game = rolling 2 fair dice. Let X be the sum of the values
on the two dice. What are the 36 possible pairs of faces of the 2 dice?
• Give the probability distribution function of X, then present the probability distribution function graphically.
X 2 3 4 5 6 7 8 9 10 11 12
P(x)

• Let's Do It! 7.20 Sum of Pips (continued)• Find the P( X > 7 ).
• What is the probability of rolling a seven or an eleven on the next roll of the two dice?
• What is the probability of rolling at least a three on the next roll of the two dice? (Use the complement rule.)
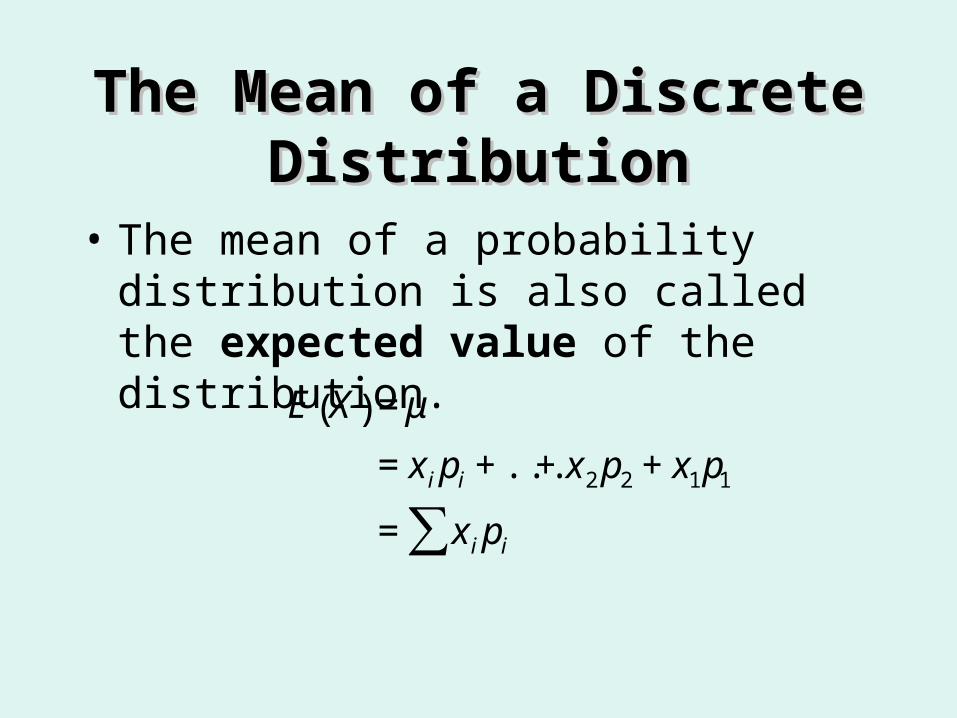
The Mean of a Discrete The Mean of a Discrete DistributionDistribution
• The mean of a probability distribution is also called the expected value of the distribution.
€
E X( ) = μ
= x i pi + ...+ x2 p2 + x1p1
= x i pi∑

The Variance and Standard Deviation The Variance and Standard Deviation of a Discrete Distributionof a Discrete Distribution
• The variance of a discrete probability distribution is
• The standard deviation is given by:
€
Var X( ) = σ 2
= x i − μ( )2pi∑
€
SD X( ) = Var X( )
= σ 2
= σ

Good News!Good News!
• The TI-83 knows how to do these calculations. You simply enter the values of the random variable in L1 and the probabilities in L2 and do the following command:
• 1-Var Stats L1,L2

Apartments RevisitedApartments Revisited
• What is the expected value, the variance, and the standard deviation of the number of people per apartment?

• Let’s Do It 7.22 Sum of Pips Revisited• Consider the game called craps in which two fair dice are
rolled. Let X be the random variable corresponding to the sum of the two dice. Its probability distribution is given below:
• Calculate the mean of X, the expected sum of the values on the two dice. Also calculate the standard deviation.
• You provided a graph of this distribution in Let’s Do It! 7.20. Is your expected value consistent with the idea of being the balancing point of the probability stick graph or histogram?
Value of X
Probability
X = x
P[X = x]
2 3 114 5 6 7 8 9 10 12
136
136
236
336
236
336
436
436
536
536
636

Suppose you have a set that contains four distinguishable values, { }S=1234 ,,, . The table below partiall y summarizes th ecounting questio .ns
How many subsets of {}S=1234 ,,, are there which contain ...
Answer: The subsets are: Combinatio :n
... exactly 0 values (n ovalu )es? 1
... exactly 1 value? {}1 , {}2 , {}3, {}4
... exactly 2 values?
... exactly 3 values? 4
... exactly 4 values? {}1234 ,,,
( )a Complete the table by fillin gin the missing .entries (b) The set { }S=1234 ,,, 4 has val ,ues
so thet otal number of possible subsets is 24 = _________. Confirm that this does thisequal the total of the “answe ” rcolumn.
Let's Do It! 7.24 Combinations of n 4

Homework 13Homework 13
• Read: pages 478-481
• LDI: 7.26, 7.27, 7.31
• Exercises: 7.60, 7.61, 7.62, 7.65, 7.102, 7.103, 7.104
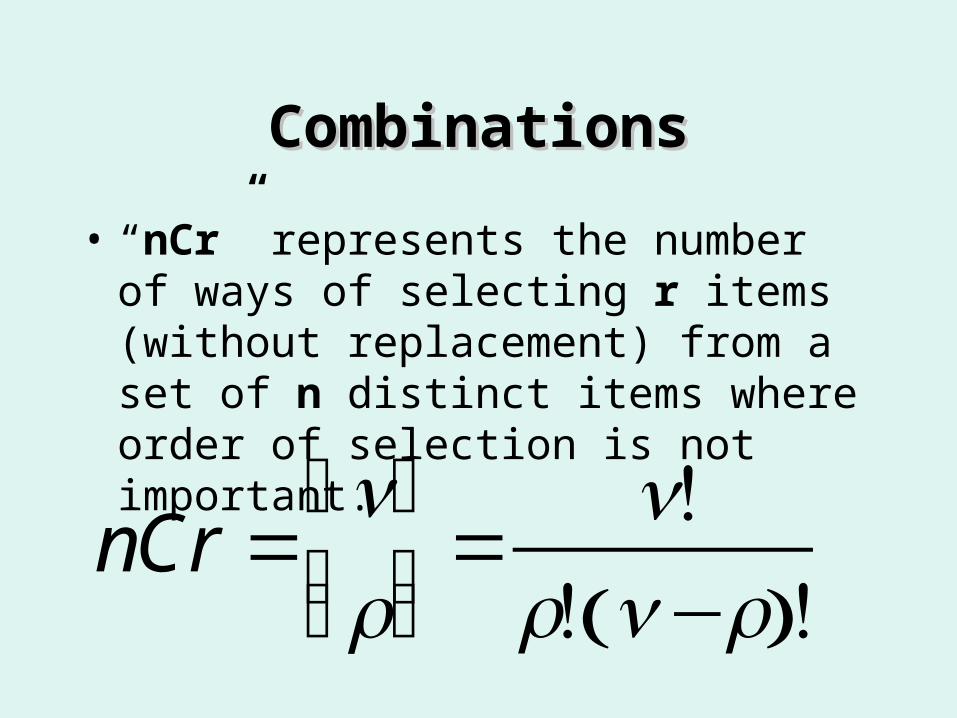
CombinationsCombinations
• “nCr” represents the number of ways of selecting r items (without replacement) from a set of n distinct items where order of selection is not important.

Bernoulli VariableBernoulli Variable
• If a random variable has exactly two possible outcome, success and failure and the probability of success remains fixed if the experiment is repeated under identical conditions, then the RV is dichotomous or Bernoulli.

• Let's Do It! 7.26 Probability of a Success• At a local community college there are 500 freshmen enrolled, 274
sophomores enrolled, 191 juniors enrolled, and 154 seniors enrolled. An enrolled student is to be selected at random. If a success is defined to be “senior”, what is the probability of a success?p = ________________________
• A standard deck of cards contain 52 cards, 13 cards of each of 4 suits. The four suits are spades, hearts, diamonds, and clubs. Each suit consists of 4 face cards (jack, queen, king, ace) and 9 numbered cards (2 through 10). A card is drawn from a well-shuffled standard deck of cards. If success is defined to be getting a “face card”, what is the probability of a success? p = ________________________
• A game consists of rolling two fair die. If success is defined to be getting “doubles”, what is the probability of a success? p = ________________________

Binomial DistributionBinomial Distribution
• A binomial random variable X is the total number of successes in n independent Bernoulli trials, on which each trial, the probability of success is p. We say X is B(n,p).
• Page 469

The Binomial Probability DistributionThe Binomial Probability Distribution
€
P X = x( ) =n
x
⎛
⎝ ⎜
⎞
⎠ ⎟pxqn−x
Where p = the probability of success in a single trialq = 1 – p (probability of failure)n = number of independent trialsx = number of successes in the n trials

• Let's Do It! 7.27 Jury Decision• In a jury trial there are 12 jurors. In order for a defendant to be
convicted, at least 8 of the 12 jurors must vote guilty. Assume that the 12 jurors act independently (how one juror votes will not influence how any other juror votes). Also assume that for each juror the probability that they vote correctly is 0.85.
• If the defendant is actually guilty, what is the probability that the jury will render a correct decision?
• Identify the following:A trial = __________________________n = number of independent trials = _______p = probability of a success on each single trial = ________x = number of successes in the n trials
P correct decision by jury( ) =P X( ) =

Mean and Standard Mean and Standard Deviation of a Binomial RVDeviation of a Binomial RV
μB =np
σB = npq
ExampleExample
• A wart remover states it works on 95% of warts. If a total of 10 subjects are selected, what is the probability that 9 of the subjects will have their warts removed?

Continuous Random Continuous Random VariablesVariables
• The probability distribution of a continuous variable X is a curve such that the area under the curve over an interval is equal to the probability that the random variable X is in the interval. The values of a continuous probability distribution must be at least 0 and the total area under the curve must be 1. The uniform and normal distributions we studied in chapter 6 were continuous.

Approximating a Discrete Approximating a Discrete RV with a Continuous OneRV with a Continuous One
• We can use the normal distribution to approximate the binomial when np ≥ 5 and np ≥ 5.
• If X is B(n, p) and np ≥ 5 and nq ≥ 5 then X can be approximated by
€
N np, npq( )

ExampleExample
• A wart remover states it works on 95% of warts. If a total of 1000 subjects are selected, what is the probability that 900 of the subjects will have their warts removed?

• Let's Do It! 7.31 Applying for a Loan• Suppose the time to process a loan application follows a
uniform distribution over the range of 10 to 20 days. • Sketch the probability distribution for X = time to process a loan
application where X is U(10,20).
• What is the mean or expected processing time?
• Based on the distribution, what is the probability that a randomly selected loan application takes longer than two weeks to process?
• Given that the processing time for a randomly selected loan
application is at least 12 days, what is the probability that it will actually take longer than two weeks to process?


