Page 1
160
Chapter-7
7.1. Introduction
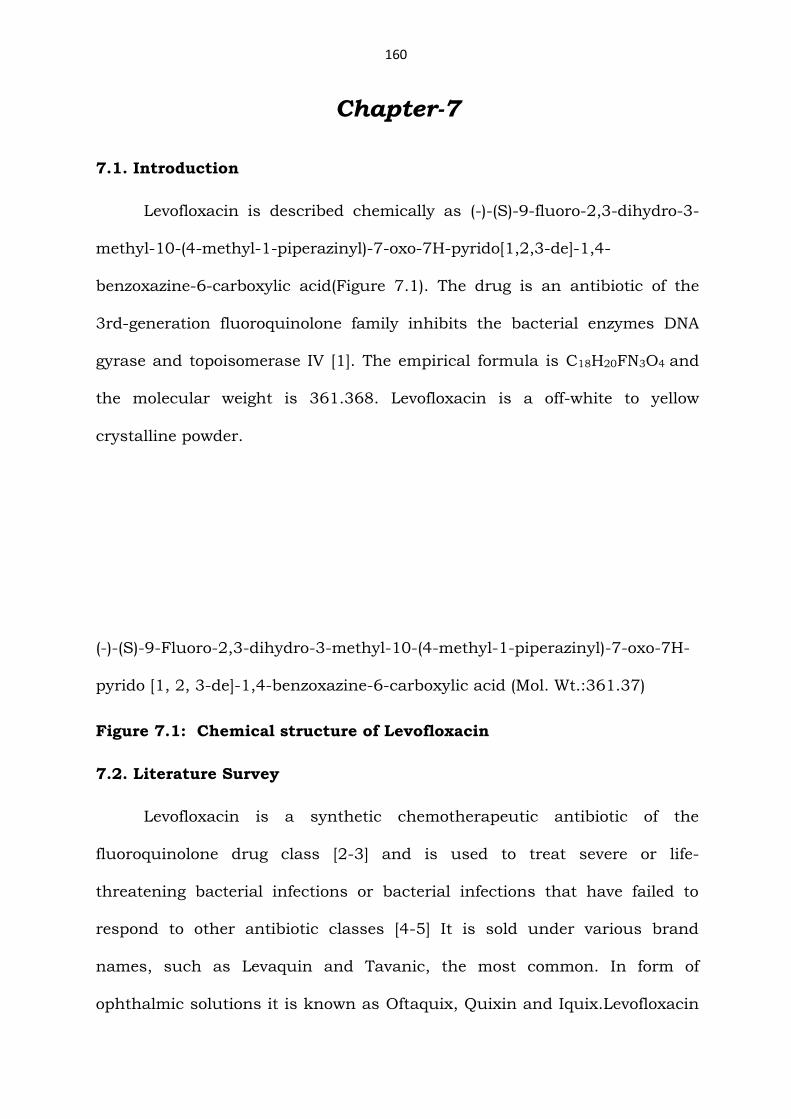
Levofloxacin is described chemically as (-)-(S)-9-fluoro-2,3-dihydro-3-
methyl-10-(4-methyl-1-piperazinyl)-7-oxo-7H-pyrido[1,2,3-de]-1,4-
benzoxazine-6-carboxylic acid(Figure 7.1). The drug is an antibiotic of the
3rd-generation fluoroquinolone family inhibits the bacterial enzymes DNA
gyrase and topoisomerase IV [1]. The empirical formula is C18H20FN3O4 and
the molecular weight is 361.368. Levofloxacin is a off-white to yellow
crystalline powder.
(-)-(S)-9-Fluoro-2,3-dihydro-3-methyl-10-(4-methyl-1-piperazinyl)-7-oxo-7H-
pyrido [1, 2, 3-de]-1,4-benzoxazine-6-carboxylic acid (Mol. Wt.:361.37)
Figure 7.1: Chemical structure of Levofloxacin
7.2. Literature Survey
Levofloxacin is a synthetic chemotherapeutic antibiotic of the
fluoroquinolone drug class [2-3] and is used to treat severe or life-
threatening bacterial infections or bacterial infections that have failed to
respond to other antibiotic classes [4-5] It is sold under various brand
names, such as Levaquin and Tavanic, the most common. In form of
ophthalmic solutions it is known as Oftaquix, Quixin and Iquix.Levofloxacin
Page 2
161
is a chiral fluorinated carboxyquinolone. Investigation of ofloxacin, an older
drug that is the racemic mixture, found that the l form [the (–)-(S)
enantiomer] is more active. This specific component is levofloxacin[6-7].
Stress testing is a part of developmental strategy under the ICH
requirements and is carried out under more severe conditions than
accelerated conditions. These studies serve to give information on drug’s
inherent stability and help in the validation of analytical methods to be used
in stability studies.
Validation of a Levofloxacin HPLC assay in plasma and dialysate for
pharmacokinetic studies was published using fluorescence detection [8]. In
one publication an hplc assay and a microbiological assay to determine
levofloxacin in soft tissue, bone, bile and serum was described [9]. Analysis of
Levofloxacin in pharmaceutical preparations by high performance thin layer
chromatography was also described [10]. The high performance liquid
chromatography tandem mass spectrometry method (HPLC/MS/MS) has
been used to determine Levofloxacin in human plasma [11]. So far several
articles were published for determination of Levofloxacin in metabolites and
in biological fluids [12, 13].
As on date, no validated stability-indicating HPLC method for quality
control testing of Levofloxacin in bulk drugs or drug products was published
in any of the journals neither by the innovator nor by any other
manufacturer. Attempts were made to develop a stability-indicating HPLC
method for the related substance determination and quantitative estimation
of Levofloxacin. This chapter mainly deals with the forced degradation of
Page 3
162
Levofloxacin under stress conditions like water hydrolysis, acid hydrolysis,
base hydrolysis, oxidation, heat and light. This chapter also deals with the
validation of the developed method for the accurate quantification of
impurities and assay of Levofloxacin in bulk samples.
7.3. Development and optimization of HPLC method
7.3.1. Samples, Chemicals and Reagents
Samples of Levofloxacin and its three process impurities (Figure 7.1 to
Figure 7.4) were received from Bulk Actives, Unit-II of Dr. Reddy’s
Laboratories, Hyderabad, India. HPLC grade Methanol and Acetonitrile was
purchased from Rankem, Mumbai, India. Ortho-phosphoric acid was
purchased from Qualigens Fine Chemicals, Mumbai, India. Sodium
dihydrogen ortho phosphate dihydrate was purchased from Qualigens Fine
Chemicals, Mumbai, India. Triethylamine was purchased from Loba Chemie
Mumbai, India. High pure water was prepared by using Millipore Milli Q plus
purification system.
7.3.2. Equipment
The LC method development, validation and forced degradation studies
were done using Agilent 1200 series HPLC system with diode array detector.
The data were collected and the peak purity of the Levofloxacin peak was
checked using chemistation software. The photolytic degradation was carried
out using Binder KBS240 photolytic chamber.
Page 4
163
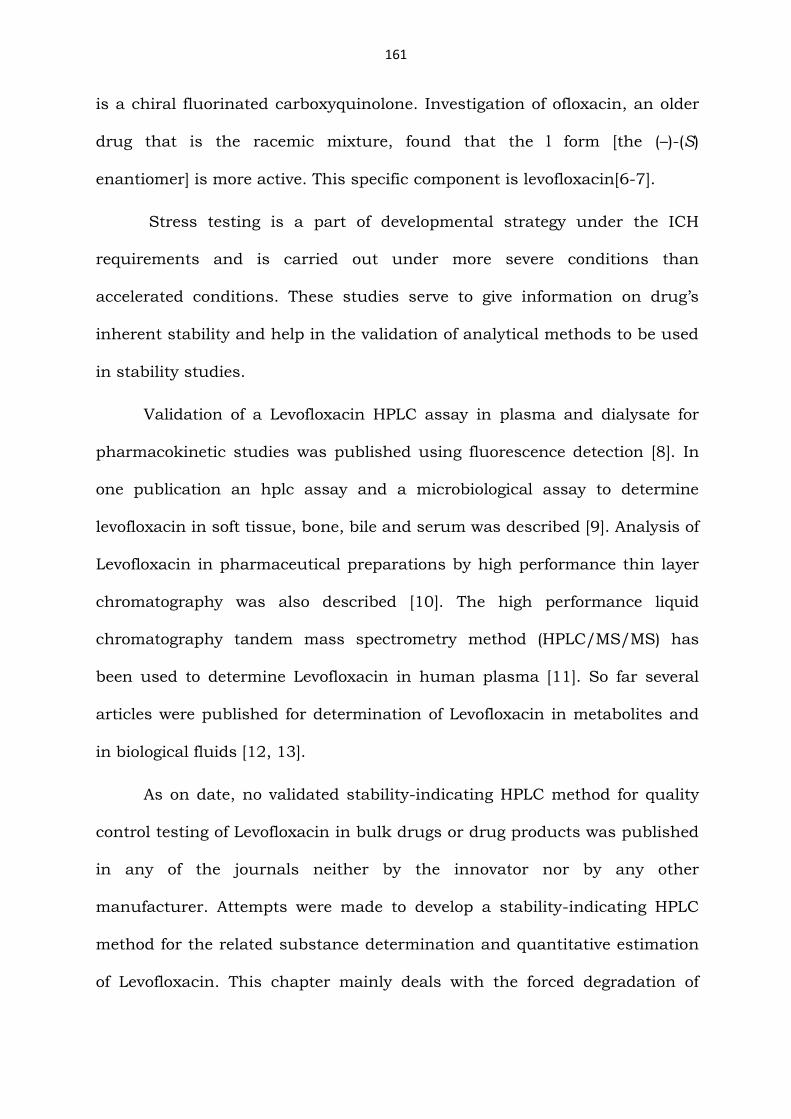
(-)-(S)-9-Fluoro-2,3-dihydro-3-methyl-10-piperazinyl-7-oxo-7H-pyrido[1,2,3-
de]-1,4-benzoxazine-6-carboxylic acid (Mol. Wt.: 347.34)
Figure 7.2: Chemical structure of impurity-1
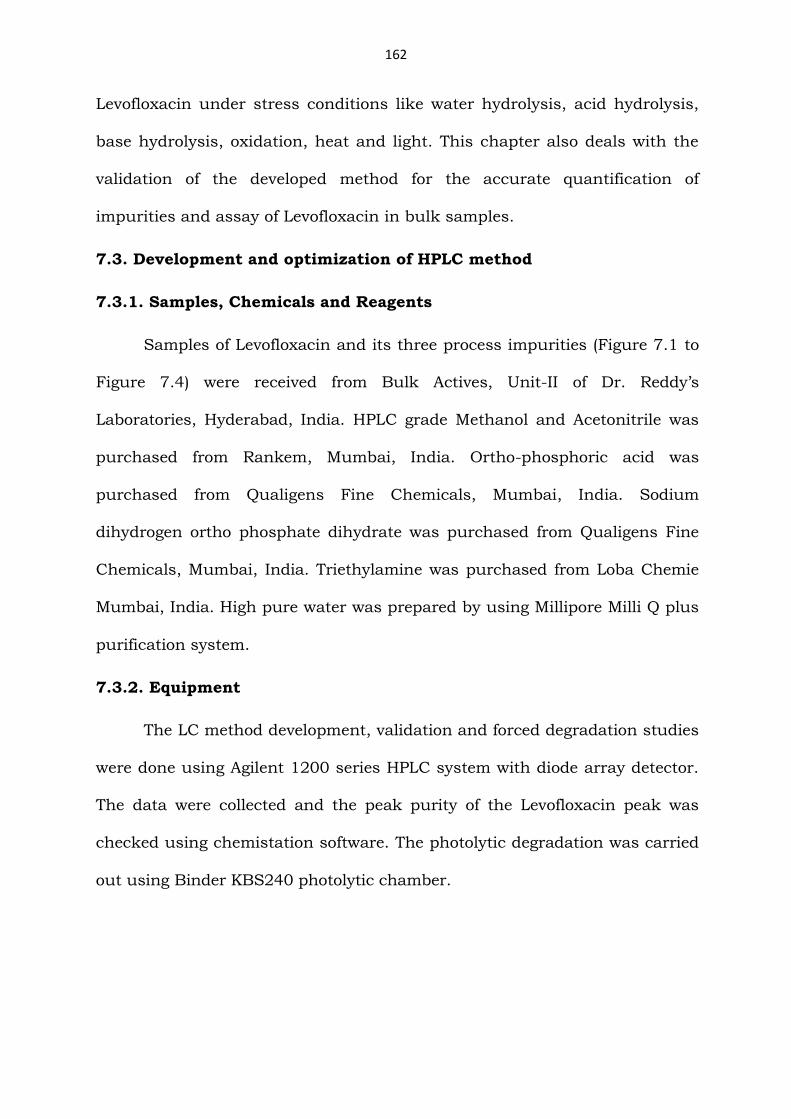
Ethyl(-)-(S)-9-Fluoro-2,3-dihydro-3-methyl-10-(4-methyl-1-piperazinyl)-7-
oxo-7H-pyrido[1,2,3-de]-1,4-benzoxazine-6-carboxylate(Mol. Wt.: 389.42)
Figure 7.3: Chemical structure of impurity-2
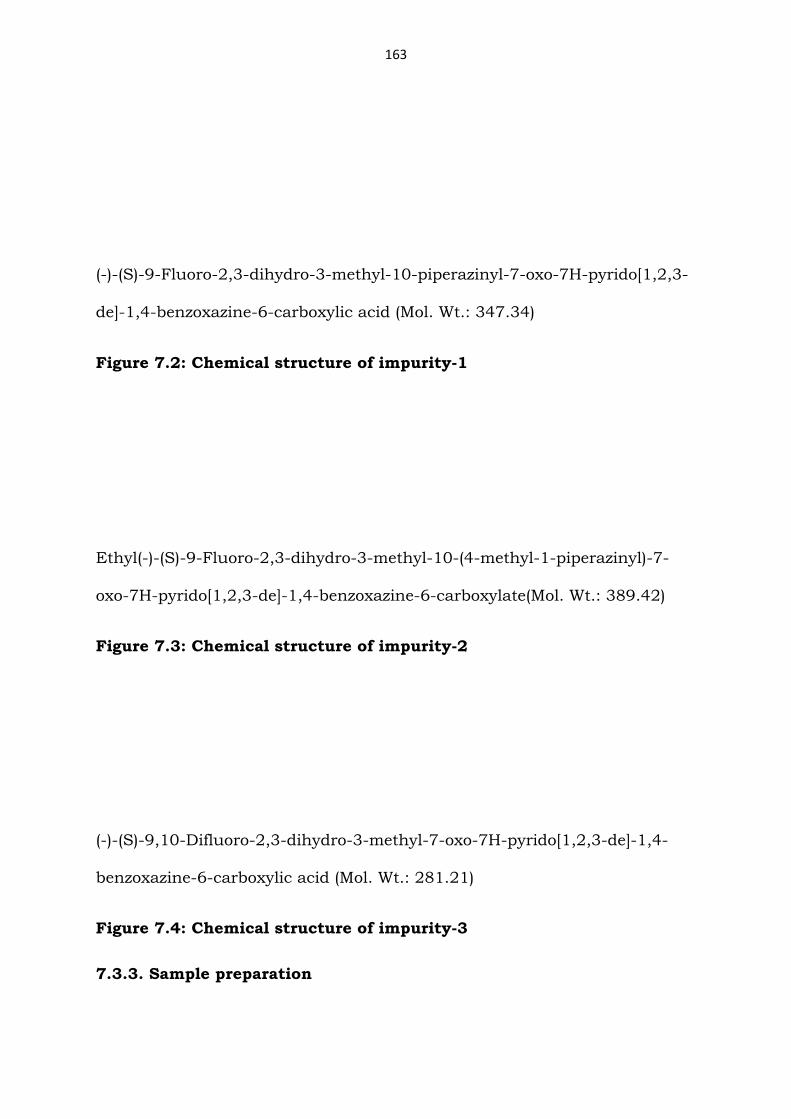
(-)-(S)-9,10-Difluoro-2,3-dihydro-3-methyl-7-oxo-7H-pyrido[1,2,3-de]-1,4-
benzoxazine-6-carboxylic acid (Mol. Wt.: 281.21)
Figure 7.4: Chemical structure of impurity-3
7.3.3. Sample preparation
Page 5
164
A working solution of 300 µg mL-1 of Levofloxacin was prepared for the
determination of assay and related substances analysis. Separate stock
solutions of impurities (impurity-1, impurity-2 and impurity-3) at 300 µg mL-
1 were also prepared in diluent.
7.3.4. Specificity of the test method and generation of stress samples
Specificity is the ability of the method to assess unequivocally the
analyte in presence of components, which may be expected to present.
Typically, these might include impurities, degradants, matrix, etc. [14]. The
specificity of the developed LC method for Levofloxacin was carried out in the
presence of its impurities.
One lot of Levofloxacin drug substance was chosen for stress study
experiment. From the ICH Stability guideline: “stress testing is likely to be
carried out on a single batch of material [15]. Various kinds of stress
conditions (i.e., heat, humidity, acid, and base, water, oxidative and light)
were employed on one lot of Levofloxacin drug substance based on the
guidance available from ICH stability guideline (Q1AR2). The details of the
stress conditions applied are as follows:
a) Acid hydrolysis: drug substance in 0.5 N HCl solution was exposed at 70
°C
for 7 days.
b) Base hydrolysis: drug substance in 0.5 N NaOH solution was exposed at
70 °C for 7 days.
c) Oxidative stress: drug substance in 0.01% v/v H2O2 solution was
exposed at room temperature for 12 hours.
Page 6
165
d) Water hydrolysis: drug solution in water at 70 °C for 7 days.
e) Thermal stress: bulk drug was subjected to dry heat at 100 °C for 5
days.
f) Photolytic degradation: bulk drug was subjected to ICH Q1B conditions.
Stress testing of the drug substance can help to identify the likely
degradation products, which can in turn help to establish the degradation
pathways and the intrinsic stability of the molecule.
Specificity is the ability of the method to measure the analyte response
in the presence of its potential impurities. All stress degradation studies were
performed at an initial drug concentration of 300 µg mL-1. Acid hydrolysis
was performed in 0.5 N HCl at 70°C for 7 days. The study in basic solution
was carried out in 0.5 N NaOH at 70°C for 7 days .For study in neutral
solution, the drug dissolved in water and was kept at 70°C for 7 days.
Oxidation studies were carried out at ambient temperature in 0.01%
hydrogen peroxide for 12 hours. Photo degradation studies were carried out
according to Option 2 of Q1B in ICH guidelines [16].The drug sample was
exposed to light for a overall illumination of 1.2 million lux hours and an
integrated near ultraviolet energy of 200 W h m2 . The drug sample was
exposed to dry heat at 100 °C for 5 days. Samples were withdrawn at
appropriate times and subjected to LC analysis after suitable dilution (300 µg
mL-1) to evaluate the ability of the proposed method to separate Levofloxacin
from its degradation products.
Photodiode array detector was employed to check and to ensure the
Page 7
166
homogeneity and purity of Levofloxacin peak in all the stressed sample
solutions. Assessment of mass balance in the degraded samples was carried
out to confirm the amount of impurities detected in stressed samples
matches with the amount present before the stress was applied. Quantitative
determination of Levofloxacin was carried out in all the stressed samples
against qualified working standard and the mass balance (% assay + % sum
of all impurities + % sum of all degradation products) was tabulated in table
7.14.
7.3.5. Method development
The main target of the chromatographic method is to get the separation
of impurity-1, impurity-2, impurity-3 and the degradation products generated
during stress studies from the analyte peak. Impurities were co-eluted by
using different stationary phases like C8, Cyno, XTerra and Phenyl and
different mobile phases containing buffers like phosphate, sulphate and
acetate with different pH (4- 10) and using organic modifiers like acetonitrile,
methanol and ethanol in the mobile phase. Apart from the co-elution of
impurities, poor peak shapes for some impurities and degradation products
were also noticed.
Sodium dihydrogen orthophosphate buffer with pH 6.0 and methanol
at 1.0 mL min-1 flow was chosen for initial trail with a 250 mm length X 4.6
mm ID column and 5 µm particle size C18 stationary phase. When impurity
spiked sample was injected the resolution between impurities and analyte
was poor.
Page 8
167
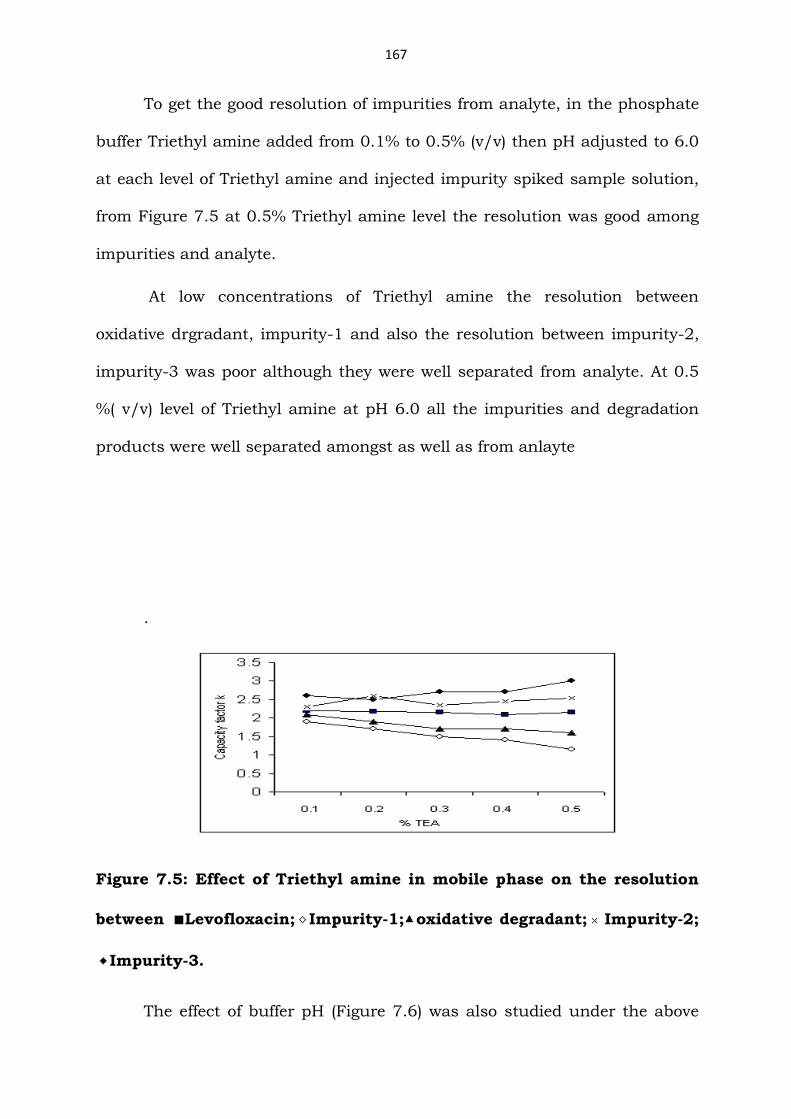
To get the good resolution of impurities from analyte, in the phosphate
buffer Triethyl amine added from 0.1% to 0.5% (v/v) then pH adjusted to 6.0
at each level of Triethyl amine and injected impurity spiked sample solution,
from Figure 7.5 at 0.5% Triethyl amine level the resolution was good among
impurities and analyte.
At low concentrations of Triethyl amine the resolution between
oxidative drgradant, impurity-1 and also the resolution between impurity-2,
impurity-3 was poor although they were well separated from analyte. At 0.5
%( v/v) level of Triethyl amine at pH 6.0 all the impurities and degradation
products were well separated amongst as well as from anlayte
.
Figure 7.5: Effect of Triethyl amine in mobile phase on the resolution
between ■Levofloxacin; Impurity-1; oxidative degradant; Impurity-2;
Impurity-3.
The effect of buffer pH (Figure 7.6) was also studied under the above
Page 9
168
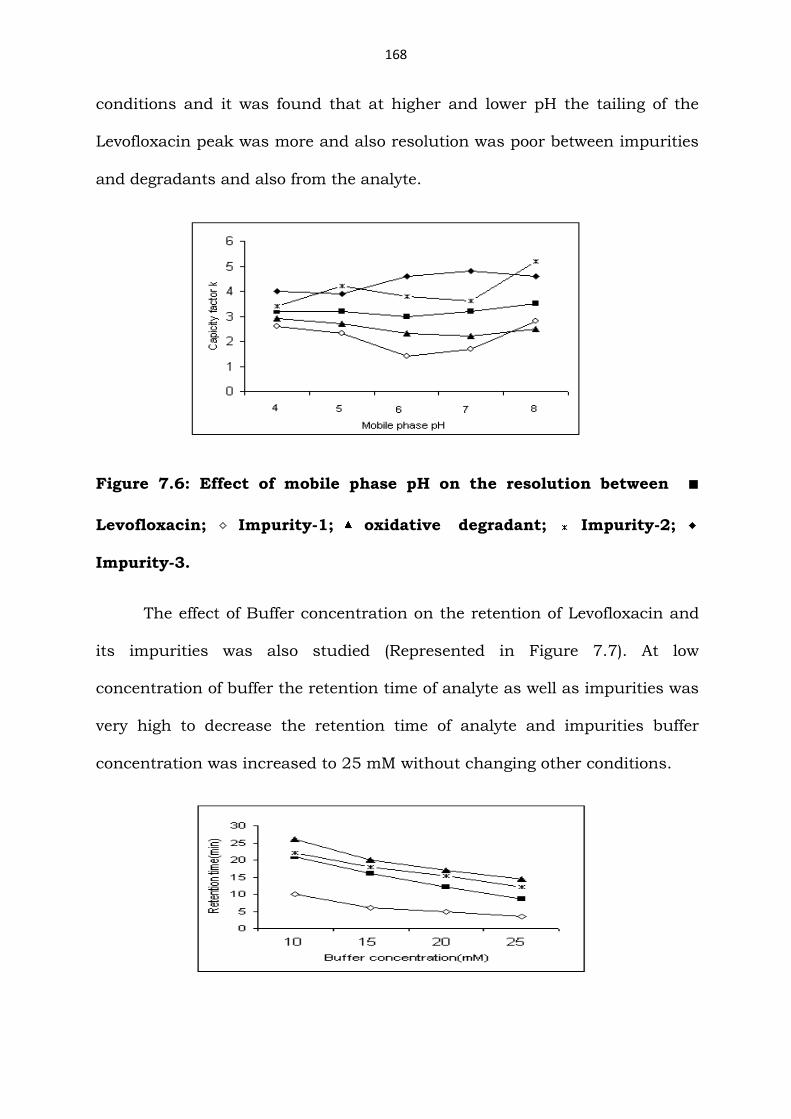
conditions and it was found that at higher and lower pH the tailing of the
Levofloxacin peak was more and also resolution was poor between impurities
and degradants and also from the analyte.
Figure 7.6: Effect of mobile phase pH on the resolution between ■
Levofloxacin; Impurity-1; oxidative degradant; Impurity-2;
Impurity-3.
The effect of Buffer concentration on the retention of Levofloxacin and
its impurities was also studied (Represented in Figure 7.7). At low
concentration of buffer the retention time of analyte as well as impurities was
very high to decrease the retention time of analyte and impurities buffer
concentration was increased to 25 mM without changing other conditions.
Page 10
169
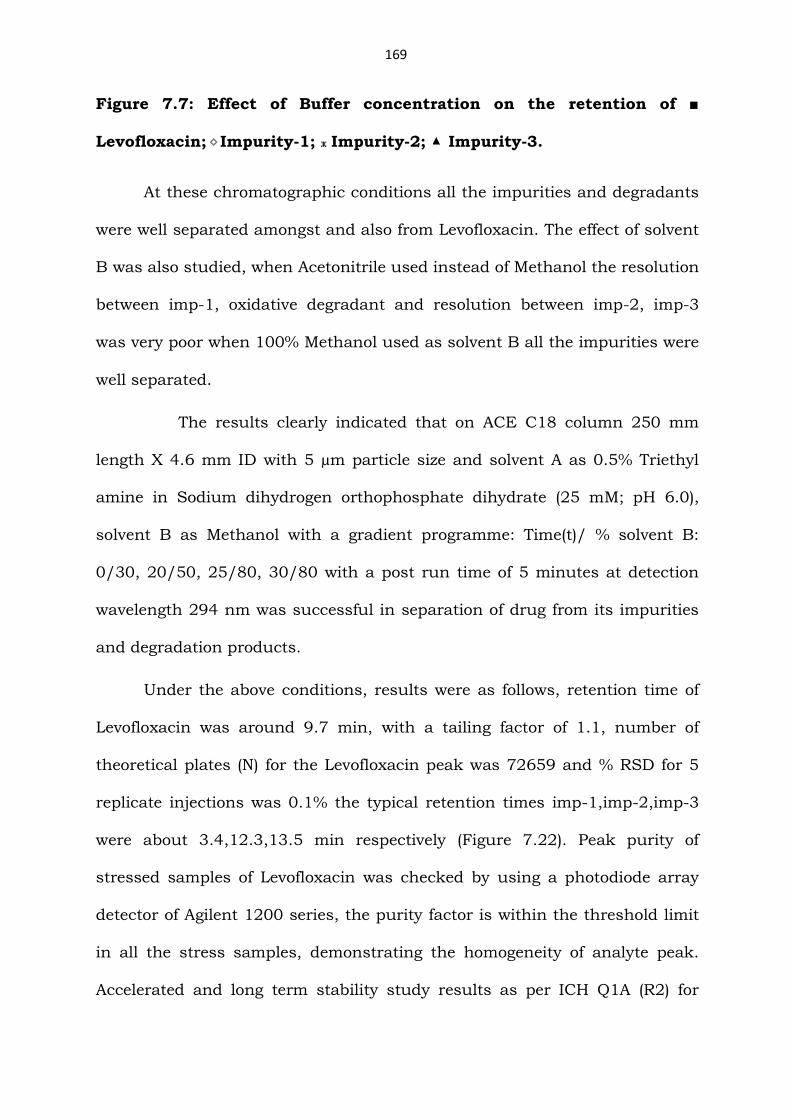
Figure 7.7: Effect of Buffer concentration on the retention of ■
Levofloxacin; Impurity-1; Impurity-2; Impurity-3.
At these chromatographic conditions all the impurities and degradants
were well separated amongst and also from Levofloxacin. The effect of solvent
B was also studied, when Acetonitrile used instead of Methanol the resolution
between imp-1, oxidative degradant and resolution between imp-2, imp-3
was very poor when 100% Methanol used as solvent B all the impurities were
well separated.
The results clearly indicated that on ACE C18 column 250 mm
length X 4.6 mm ID with 5 µm particle size and solvent A as 0.5% Triethyl
amine in Sodium dihydrogen orthophosphate dihydrate (25 mM; pH 6.0),
solvent B as Methanol with a gradient programme: Time(t)/ % solvent B:
0/30, 20/50, 25/80, 30/80 with a post run time of 5 minutes at detection
wavelength 294 nm was successful in separation of drug from its impurities
and degradation products.
Under the above conditions, results were as follows, retention time of
Levofloxacin was around 9.7 min, with a tailing factor of 1.1, number of
theoretical plates (N) for the Levofloxacin peak was 72659 and % RSD for 5
replicate injections was 0.1% the typical retention times imp-1,imp-2,imp-3
were about 3.4,12.3,13.5 min respectively (Figure 7.22). Peak purity of
stressed samples of Levofloxacin was checked by using a photodiode array
detector of Agilent 1200 series, the purity factor is within the threshold limit
in all the stress samples, demonstrating the homogeneity of analyte peak.
Accelerated and long term stability study results as per ICH Q1A (R2) for
Page 11
170
Levofloxacin were generated for 12 months by using the developed LC method
and the results were well within the limits, this further confirms the stability
indicating of the developed LC method.
Optimized chromatographic conditions
Column : ACE C18, 250mm x 4.6mm, 5m particle size
Mobile phase A : pH6.0 Buffer*
Mobile phase B : Methanol
HPLC program : Gradient
Gradient Programme : T/%B: 0/30, 20/50, 25/80, 30/80
Post run time : 5 minutes
Flow rate : 1.0 mL/min
Column temperature : 40 ± 2 °C
Wavelength of detection : 294 nm
Injection volume : 20L for related substances
10L for assay determination
Diluent : Water :Acetonitrile (60 :40)
Run time : 35 min
Retention time : Levofloxacin about 9.7 min.
Relative Retention Time : Impurity-1 about 0.35
Impurity-2 about 1.27
Impurity-3 about 1.39
Page 12
171
pH6.0 Buffer*: 0.5% Triethyl amine in Sodium dihydrogen orthophosphate
dihydrate (25 mM; pH 6.0)
Figure 7.8 to Figure 7.19 is the typical HPLC chromatograms showing
the degradation of Levofloxacin in various stress conditions and also the
corresponding peak purity plots.
X-axis: Retention time in min and Y-axis: Peak response in mAU
Figure 7.8: Typical HPLC chromatograms of acid hydrolysis
Figure 7.9: Peak purity plot of acid hydrolysis
Page 13
172
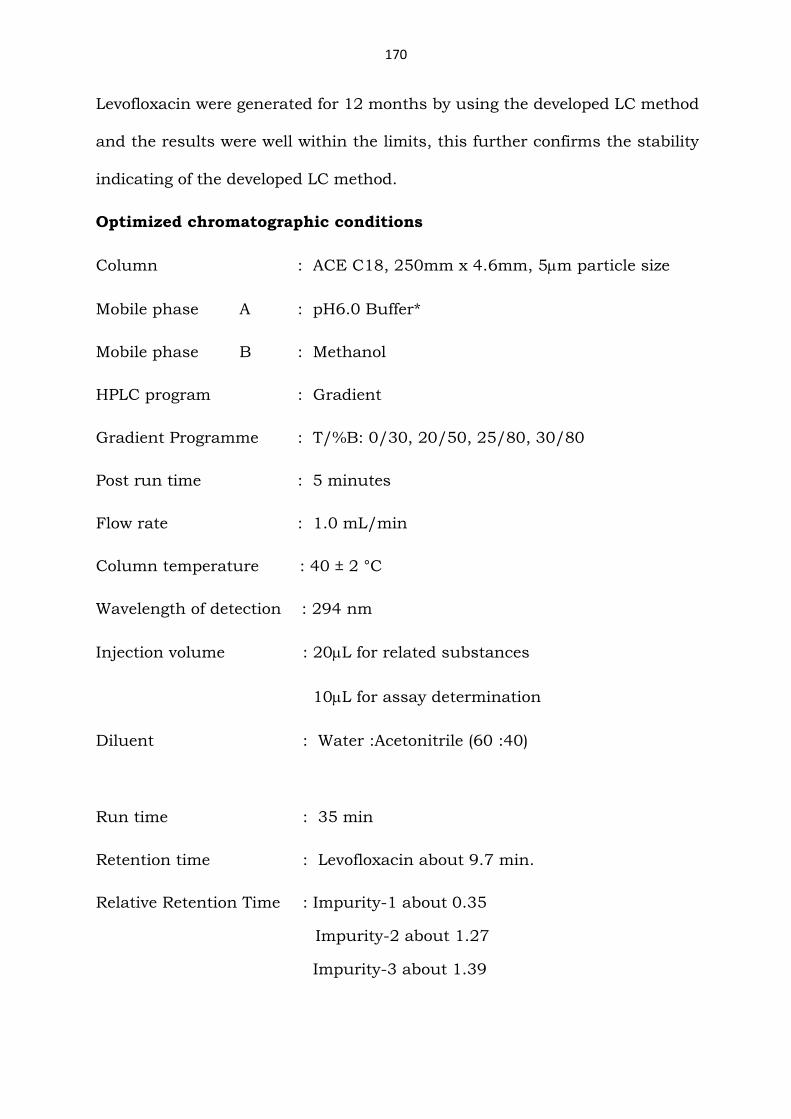
X-axis: Retention time in min and Y-axis: Peak response in mAU
Figure 7.10: Typical HPLC chromatograms of alkali hydrolysis
Figure 7.11: Peak purity plot of alkali hydrolysis
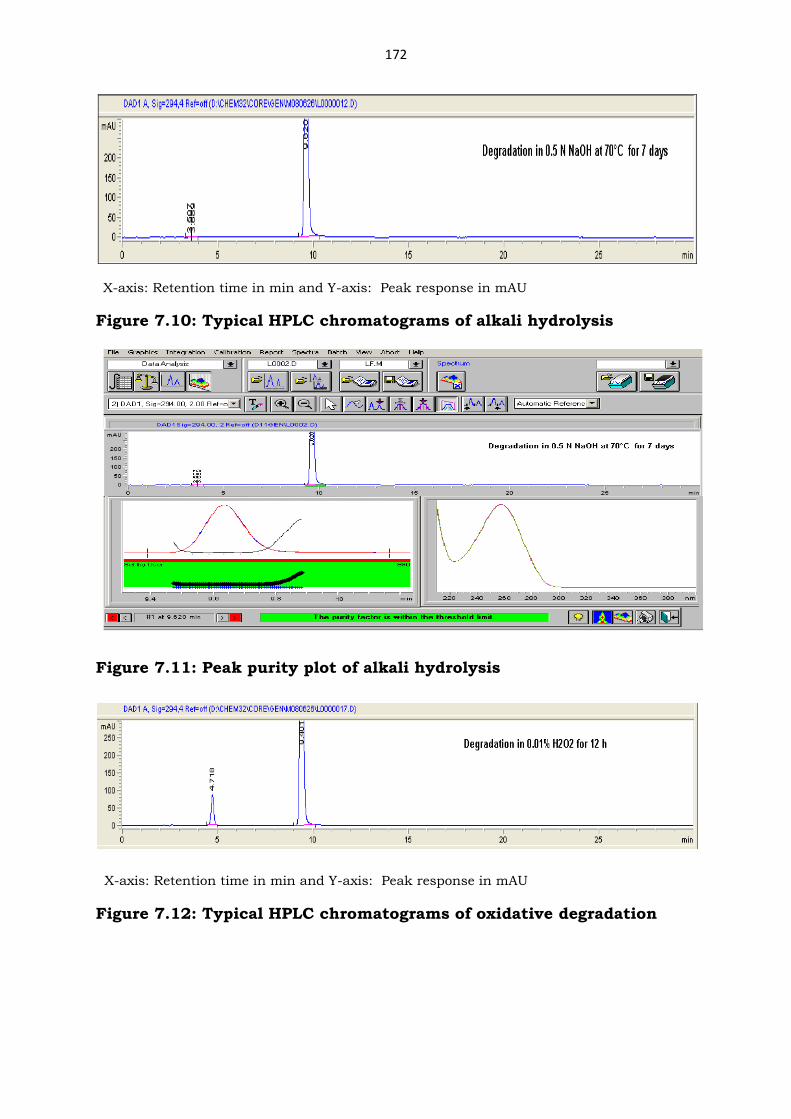
X-axis: Retention time in min and Y-axis: Peak response in mAU
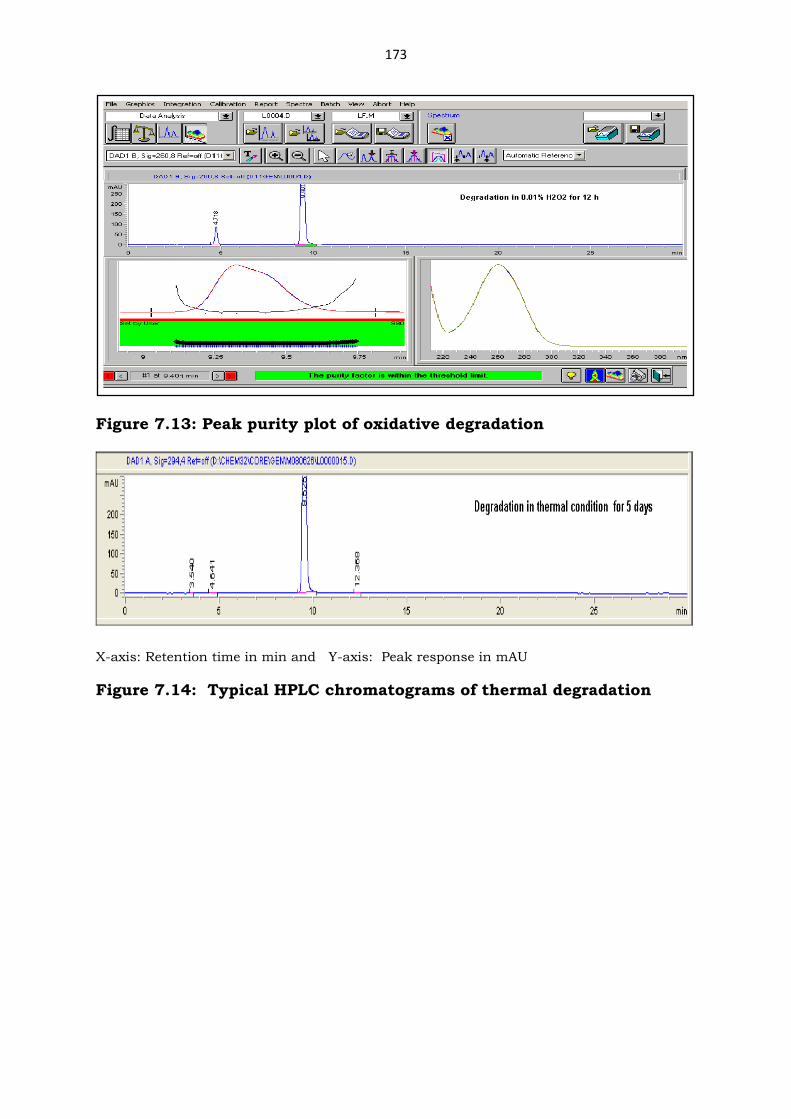
Figure 7.12: Typical HPLC chromatograms of oxidative degradation
Page 14
173
Figure 7.13: Peak purity plot of oxidative degradation
X-axis: Retention time in min and Y-axis: Peak response in mAU
Figure 7.14: Typical HPLC chromatograms of thermal degradation
Page 15
174
Figure 7.15: Peak purity plot of thermal degradation
X-axis: Retention time in min and Y-axis: Peak response in mAU
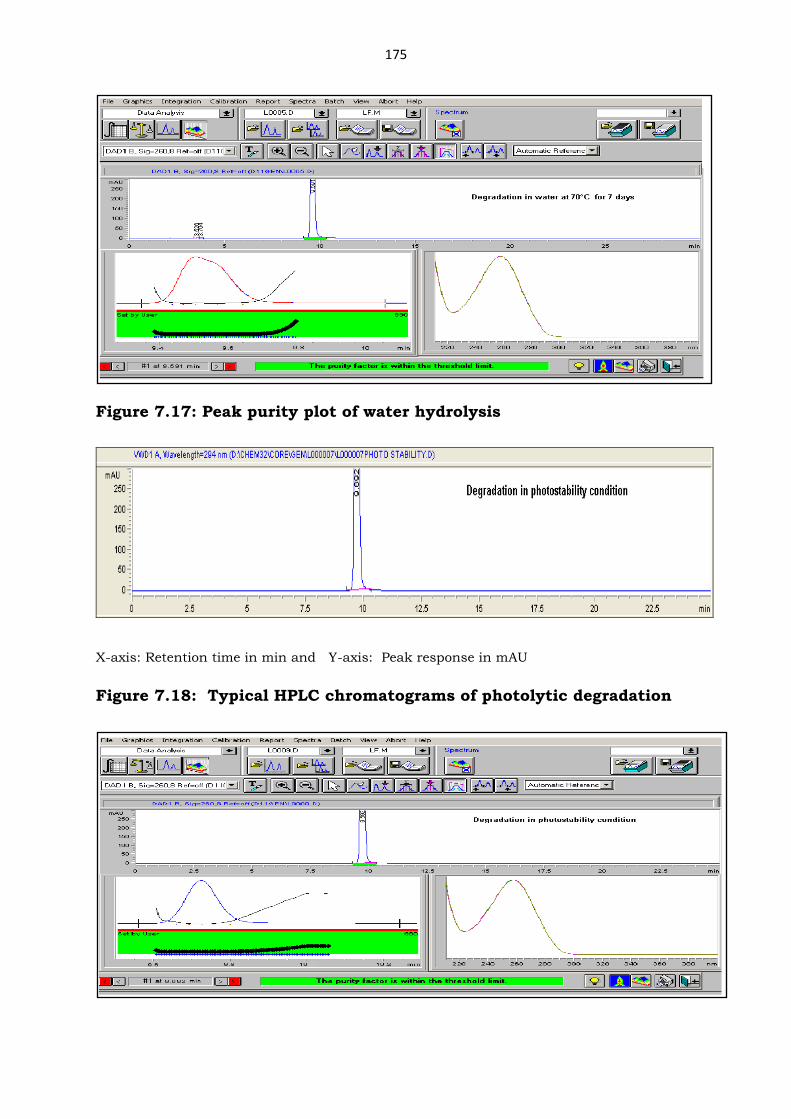
Figure 7.16: Typical HPLC chromatograms of water hydrolysis
Page 16
175
Figure 7.17: Peak purity plot of water hydrolysis
X-axis: Retention time in min and Y-axis: Peak response in mAU
Figure 7.18: Typical HPLC chromatograms of photolytic degradation
Page 17
176
Figure 7.19: Peak purity plot of photolytic degradation
7.4. Comments on the stress degradation of Levofloxacin
No considerable degradation observed when the Levofloxacin sample
was subjected to acid, base, water, thermal and photolytic stress.
Considerable degradation was observed during oxidative degradation (Figure
7.12) at 0.50 RRT which was identified by LCMS/MS. However, the
developed method is able to well resolve all the degradants from the analyte
peak (i.e. Levofloxacin) generated from oxidative degradation and the
Levofloxacin peak was observed to be pure and homogeneous when checked
under DAD and also assay of levofloxacin was unaffected by impurities and
degradation products, thus establishes the stability-indicating power of the
developed method.
7.4.1. Identification of major degradation product (at 0.50 RRT) formed
in oxidative stress condition
LCMS/MS analysis was carried out for the oxidative stress sample of
Levofloxacin using Agilent 6410 QQQ mass spectrometer with suitable
volatile buffer ammonium acetate(10 mM, pH=6.0) as mobile phase. The
degradation product formed at 0.50 RRT shows the mass of 377 which is 16
higher mass than Levofloxacin mass 361.The fragmentation for the degradant
was also carried out for degradation product and Levofloxacin using product
ion scan by LCMS/MS with optimum collision energy of 25.
The fragmentation pattern (Figure 7.20) clearly indicates that formed
degradant was N-Oxide of Levofloxacin which was supported by chemical
properties of Levofloxacin. The fragment 361.20 formed from the cleavage of
Page 18
177
CO-OH bond in acid group and the fragment 317.2 results from the cleavage of
N-Oxide ( mass of 16) followed by loss of carbonyl group( mass of 28).Due to
steric hindrances and localization of lone pair on nitrogen the N-Oxide will
form in piperazine ring at N-Methyl position. So the probable structure as
shown in Figure 7.21. The N-Oxide was formed due to oxidation so this
impurity was reduced by adding antioxidant during purification of
Levofloxacin.
Figure 7.20 Fragmentation mass spectrum of 0.50 RRT degradation
product formed in oxidative degradation of Levofloxacin.
Page 19
178
Figure 7.21 Structure of 0.50 RRT degradation product (M.Wt:377.37)
formed in oxidative degradation of Levofloxacin
7.5. Validation of Analytical method and its results
The developed and optimized HPLC method was taken up for
validation. The analytical method validation was carried out in accordance
with ICH guidelines [17].
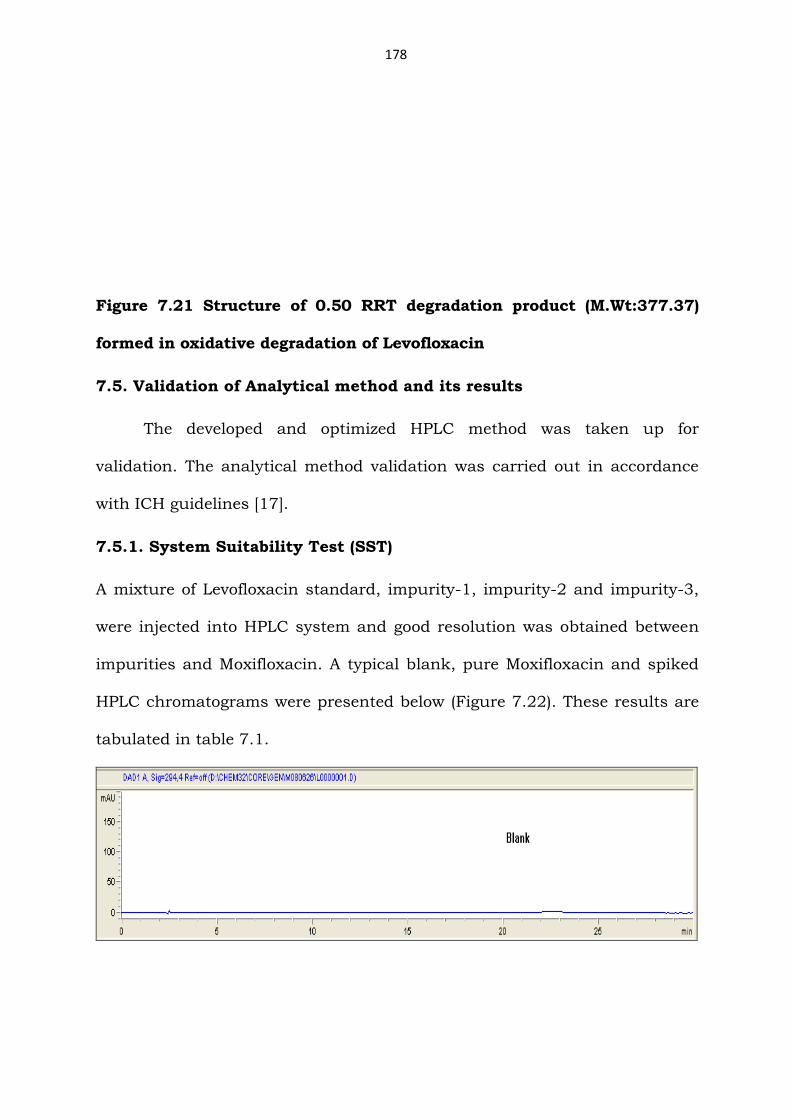
7.5.1. System Suitability Test (SST)
A mixture of Levofloxacin standard, impurity-1, impurity-2 and impurity-3,
were injected into HPLC system and good resolution was obtained between
impurities and Moxifloxacin. A typical blank, pure Moxifloxacin and spiked
HPLC chromatograms were presented below (Figure 7.22). These results are
tabulated in table 7.1.
Page 20
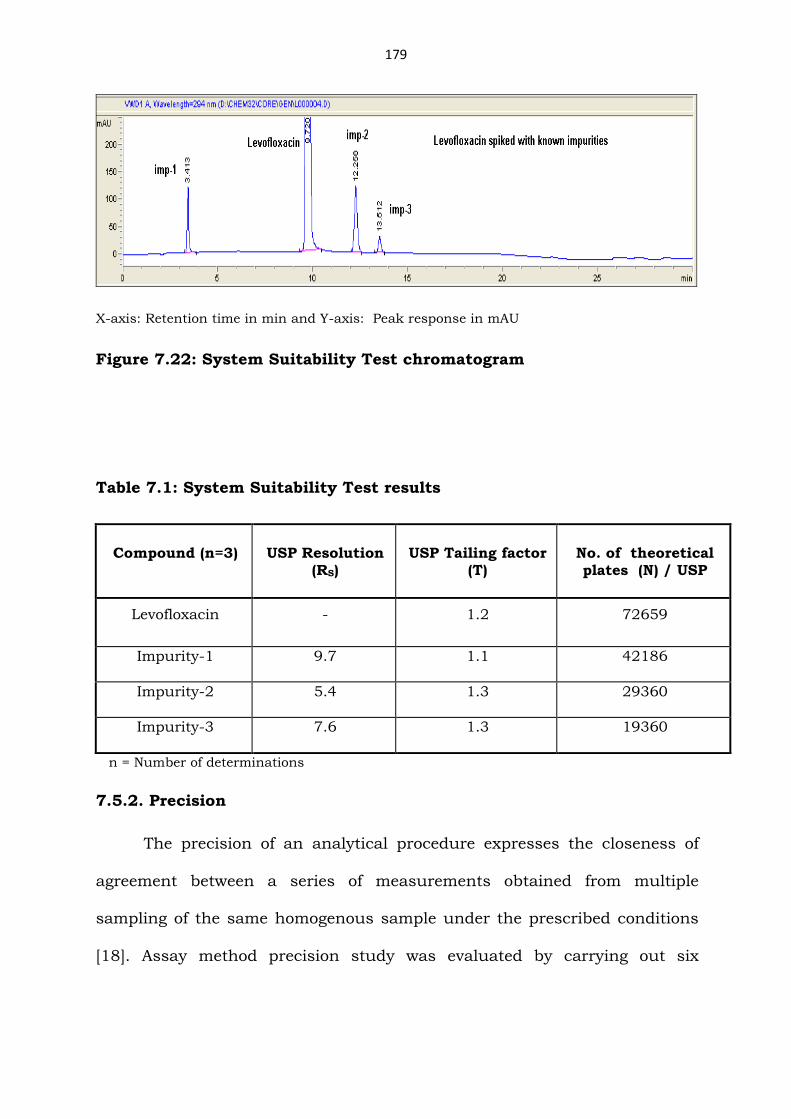
179
X-axis: Retention time in min and Y-axis: Peak response in mAU
Figure 7.22: System Suitability Test chromatogram
Table 7.1: System Suitability Test results
Compound (n=3) USP Resolution (RS)
USP Tailing factor (T)
No. of theoretical plates (N) / USP
Levofloxacin - 1.2 72659
Impurity-1 9.7 1.1 42186
Impurity-2 5.4 1.3 29360
Impurity-3 7.6 1.3 19360
n = Number of determinations
7.5.2. Precision
The precision of an analytical procedure expresses the closeness of
agreement between a series of measurements obtained from multiple
sampling of the same homogenous sample under the prescribed conditions
[18]. Assay method precision study was evaluated by carrying out six
Page 21
180
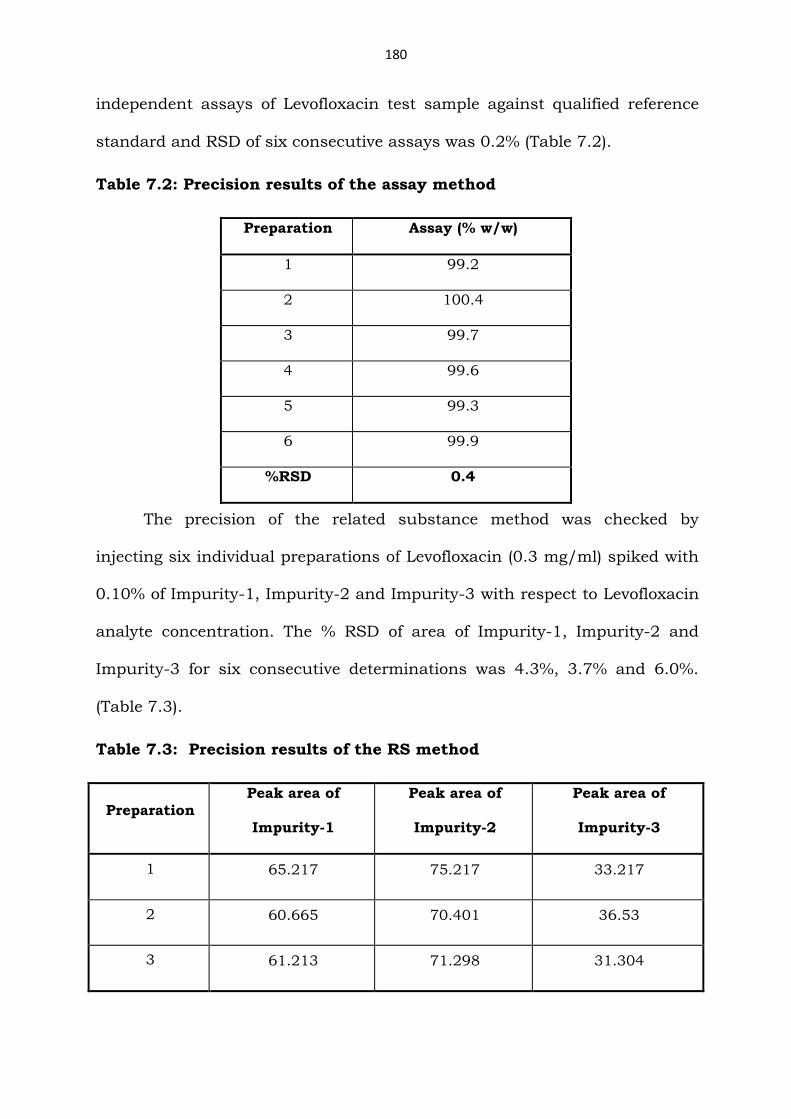
independent assays of Levofloxacin test sample against qualified reference
standard and RSD of six consecutive assays was 0.2% (Table 7.2).
Table 7.2: Precision results of the assay method
Preparation Assay (% w/w)
1 99.2
2 100.4
3 99.7
4 99.6
5 99.3
6 99.9
%RSD 0.4
The precision of the related substance method was checked by
injecting six individual preparations of Levofloxacin (0.3 mg/ml) spiked with
0.10% of Impurity-1, Impurity-2 and Impurity-3 with respect to Levofloxacin
analyte concentration. The % RSD of area of Impurity-1, Impurity-2 and
Impurity-3 for six consecutive determinations was 4.3%, 3.7% and 6.0%.
(Table 7.3).
Table 7.3: Precision results of the RS method
Preparation Peak area of
Impurity-1
Peak area of
Impurity-2
Peak area of
Impurity-3
1 65.217 75.217 33.217
2 60.665 70.401 36.53
3 61.213 71.298 31.304
Page 22
181
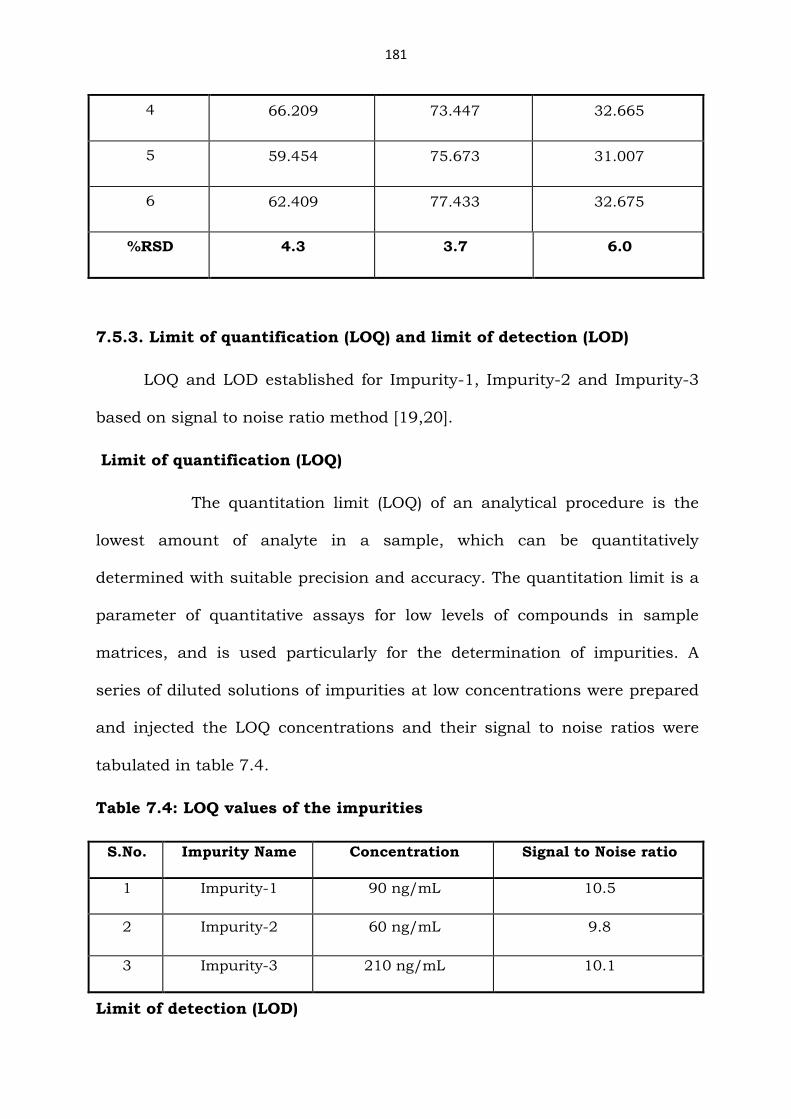
4 66.209 73.447 32.665
5 59.454 75.673 31.007
6 62.409 77.433 32.675
%RSD 4.3 3.7 6.0
7.5.3. Limit of quantification (LOQ) and limit of detection (LOD)
LOQ and LOD established for Impurity-1, Impurity-2 and Impurity-3
based on signal to noise ratio method [19,20].
Limit of quantification (LOQ)
The quantitation limit (LOQ) of an analytical procedure is the
lowest amount of analyte in a sample, which can be quantitatively
determined with suitable precision and accuracy. The quantitation limit is a
parameter of quantitative assays for low levels of compounds in sample
matrices, and is used particularly for the determination of impurities. A
series of diluted solutions of impurities at low concentrations were prepared
and injected the LOQ concentrations and their signal to noise ratios were
tabulated in table 7.4.
Table 7.4: LOQ values of the impurities
S.No. Impurity Name Concentration Signal to Noise ratio
1 Impurity-1 90 ng/mL 10.5
2 Impurity-2 60 ng/mL 9.8
3 Impurity-3 210 ng/mL 10.1
Limit of detection (LOD)
Page 23
182
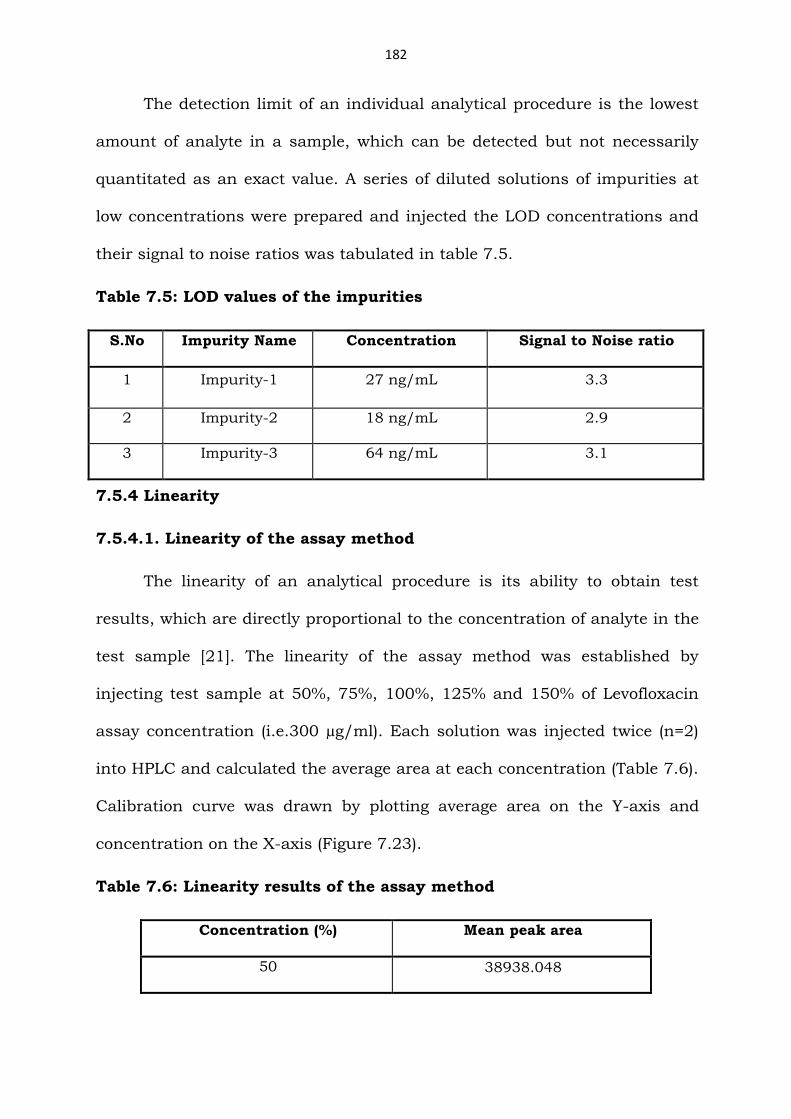
The detection limit of an individual analytical procedure is the lowest
amount of analyte in a sample, which can be detected but not necessarily
quantitated as an exact value. A series of diluted solutions of impurities at
low concentrations were prepared and injected the LOD concentrations and
their signal to noise ratios was tabulated in table 7.5.
Table 7.5: LOD values of the impurities
S.No Impurity Name Concentration Signal to Noise ratio
1 Impurity-1 27 ng/mL 3.3
2 Impurity-2 18 ng/mL 2.9
3 Impurity-3 64 ng/mL 3.1
7.5.4 Linearity
7.5.4.1. Linearity of the assay method
The linearity of an analytical procedure is its ability to obtain test
results, which are directly proportional to the concentration of analyte in the
test sample [21]. The linearity of the assay method was established by
injecting test sample at 50%, 75%, 100%, 125% and 150% of Levofloxacin
assay concentration (i.e.300 µg/ml). Each solution was injected twice (n=2)
into HPLC and calculated the average area at each concentration (Table 7.6).
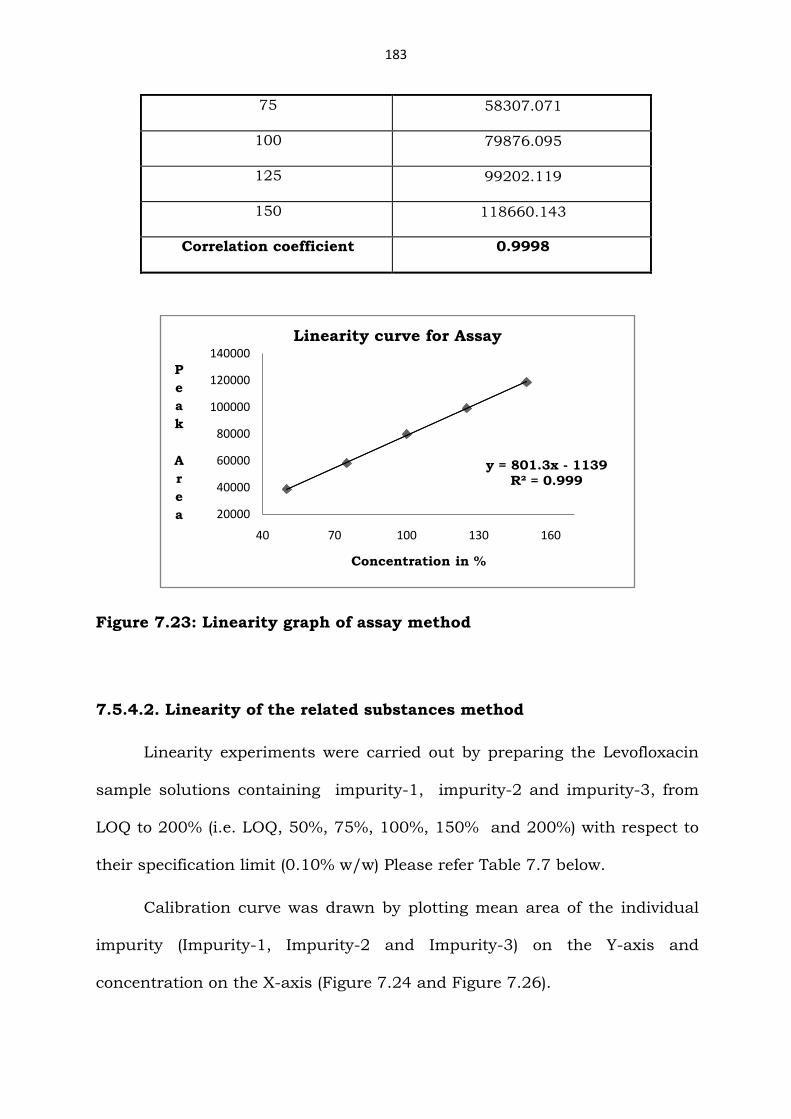
Calibration curve was drawn by plotting average area on the Y-axis and
concentration on the X-axis (Figure 7.23).
Table 7.6: Linearity results of the assay method
Concentration (%) Mean peak area
50 38938.048
Page 24
183
75 58307.071
100 79876.095
125 99202.119
150 118660.143
Correlation coefficient 0.9998
Figure 7.23: Linearity graph of assay method
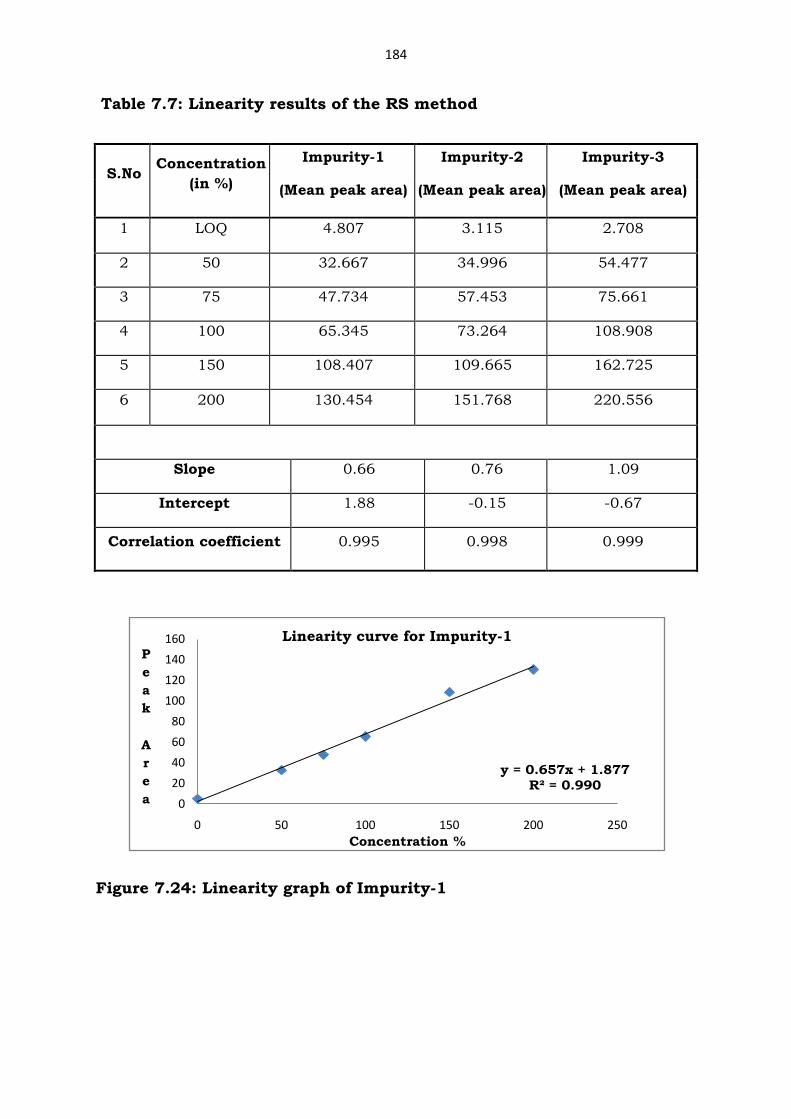
7.5.4.2. Linearity of the related substances method
Linearity experiments were carried out by preparing the Levofloxacin
sample solutions containing impurity-1, impurity-2 and impurity-3, from
LOQ to 200% (i.e. LOQ, 50%, 75%, 100%, 150% and 200%) with respect to
their specification limit (0.10% w/w) Please refer Table 7.7 below.
Calibration curve was drawn by plotting mean area of the individual
impurity (Impurity-1, Impurity-2 and Impurity-3) on the Y-axis and
concentration on the X-axis (Figure 7.24 and Figure 7.26).
y = 801.3x - 1139R² = 0.999
20000
40000
60000
80000
100000
120000
140000
40 70 100 130 160
P
e
a
k
A
r
e
a
Concentration in %
Linearity curve for Assay
Page 25
184
Table 7.7: Linearity results of the RS method
Figure 7.24: Linearity graph of Impurity-1
y = 0.657x + 1.877R² = 0.990
0
20
40
60
80
100
120
140
160
0 50 100 150 200 250
P
e
a
k
A
r
e
a
Concentration %
Linearity curve for Impurity-1
S.No Concentration
(in %)
Impurity-1
(Mean peak area)
Impurity-2
(Mean peak area)
Impurity-3
(Mean peak area)
1 LOQ 4.807 3.115 2.708
2 50 32.667 34.996 54.477
3 75 47.734 57.453 75.661
4 100 65.345 73.264 108.908
5 150 108.407 109.665 162.725
6 200 130.454 151.768 220.556
Slope 0.66 0.76 1.09
Intercept 1.88 -0.15 -0.67
Correlation coefficient 0.995 0.998 0.999
Page 26
185
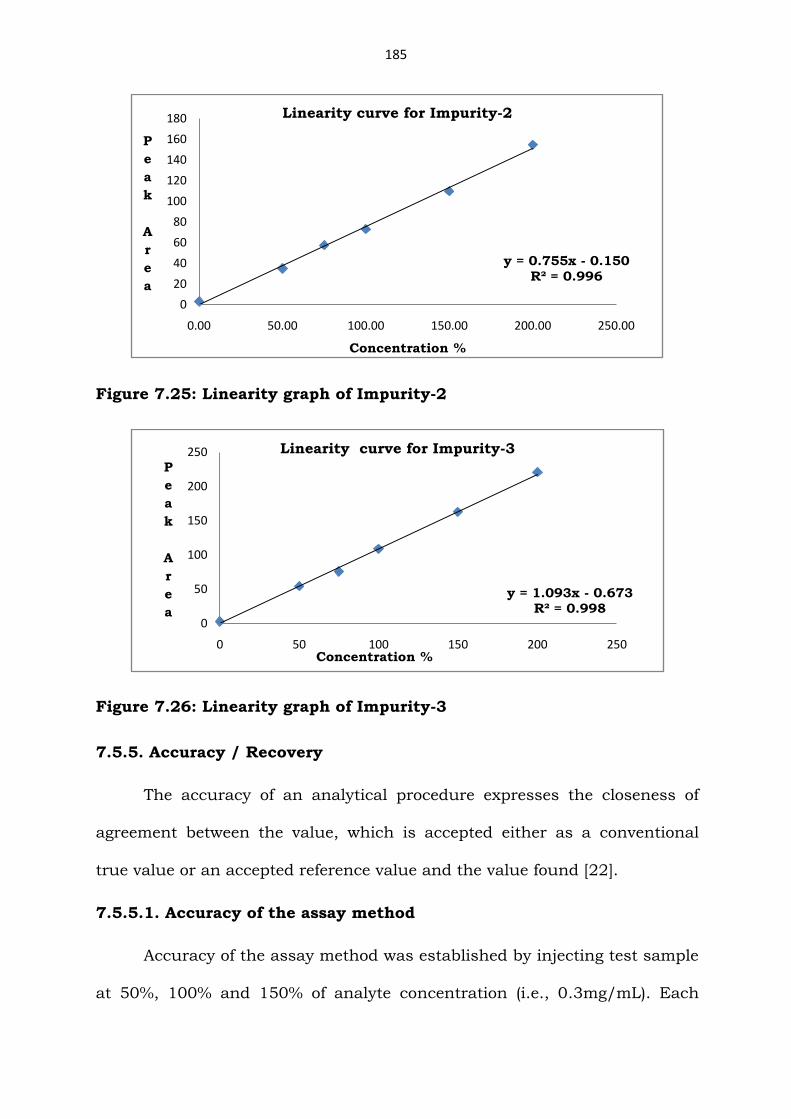
Figure 7.25: Linearity graph of Impurity-2
Figure 7.26: Linearity graph of Impurity-3
7.5.5. Accuracy / Recovery
The accuracy of an analytical procedure expresses the closeness of
agreement between the value, which is accepted either as a conventional
true value or an accepted reference value and the value found [22].
7.5.5.1. Accuracy of the assay method
Accuracy of the assay method was established by injecting test sample
at 50%, 100% and 150% of analyte concentration (i.e., 0.3mg/mL). Each
y = 0.755x - 0.150R² = 0.996
0
20
40
60
80
100
120
140
160
180
0.00 50.00 100.00 150.00 200.00 250.00
P
e
a
k
A
r
e
a
Concentration %
Linearity curve for Impurity-2
y = 1.093x - 0.673R² = 0.998
0
50
100
150
200
250
0 50 100 150 200 250
P
e
a
k
A
r
e
a
Concentration %
Linearity curve for Impurity-3
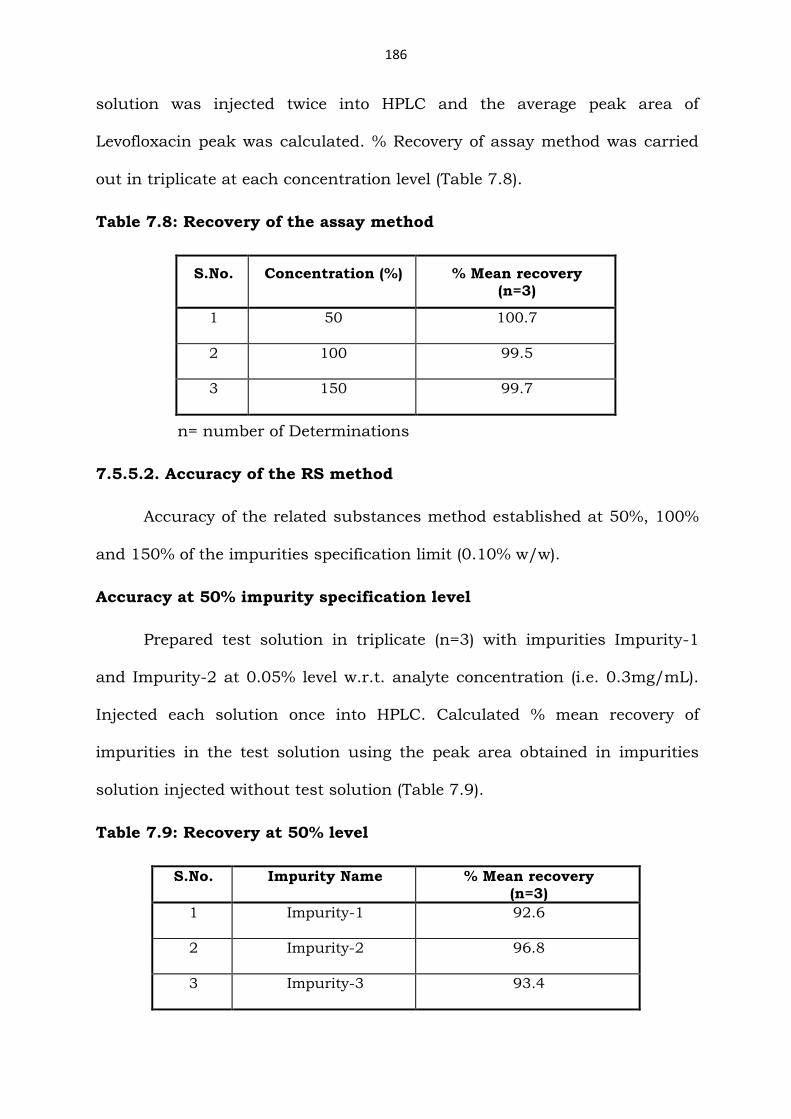
Page 27
186
solution was injected twice into HPLC and the average peak area of
Levofloxacin peak was calculated. % Recovery of assay method was carried
out in triplicate at each concentration level (Table 7.8).
Table 7.8: Recovery of the assay method
S.No. Concentration (%) % Mean recovery (n=3)
1 50 100.7
2 100 99.5
3 150 99.7
n= number of Determinations
7.5.5.2. Accuracy of the RS method
Accuracy of the related substances method established at 50%, 100%
and 150% of the impurities specification limit (0.10% w/w).
Accuracy at 50% impurity specification level
Prepared test solution in triplicate (n=3) with impurities Impurity-1
and Impurity-2 at 0.05% level w.r.t. analyte concentration (i.e. 0.3mg/mL).
Injected each solution once into HPLC. Calculated % mean recovery of
impurities in the test solution using the peak area obtained in impurities
solution injected without test solution (Table 7.9).
Table 7.9: Recovery at 50% level
S.No. Impurity Name % Mean recovery (n=3)
1 Impurity-1 92.6
2 Impurity-2 96.8
3 Impurity-3 93.4
Page 28
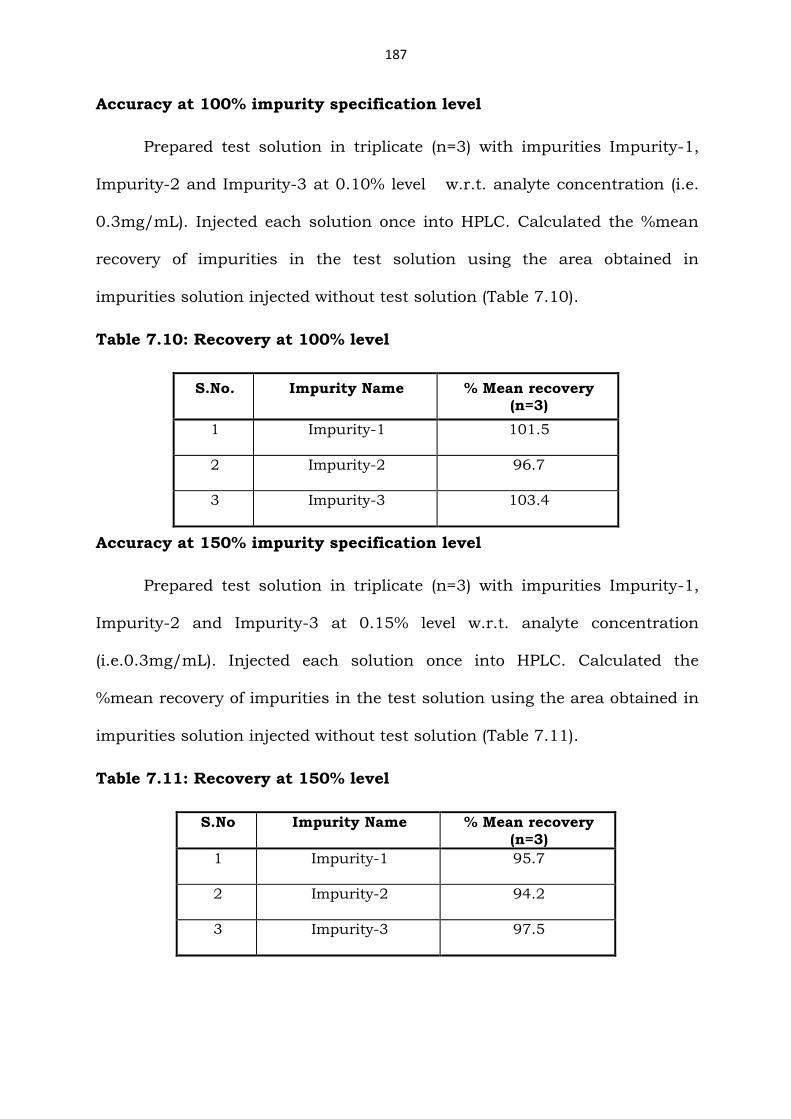
187
Accuracy at 100% impurity specification level
Prepared test solution in triplicate (n=3) with impurities Impurity-1,
Impurity-2 and Impurity-3 at 0.10% level w.r.t. analyte concentration (i.e.
0.3mg/mL). Injected each solution once into HPLC. Calculated the %mean
recovery of impurities in the test solution using the area obtained in
impurities solution injected without test solution (Table 7.10).
Table 7.10: Recovery at 100% level
S.No. Impurity Name % Mean recovery (n=3)
1 Impurity-1 101.5
2 Impurity-2 96.7
3 Impurity-3 103.4
Accuracy at 150% impurity specification level
Prepared test solution in triplicate (n=3) with impurities Impurity-1,
Impurity-2 and Impurity-3 at 0.15% level w.r.t. analyte concentration
(i.e.0.3mg/mL). Injected each solution once into HPLC. Calculated the
%mean recovery of impurities in the test solution using the area obtained in
impurities solution injected without test solution (Table 7.11).
Table 7.11: Recovery at 150% level
S.No Impurity Name % Mean recovery (n=3)
1 Impurity-1 95.7
2 Impurity-2 94.2
3 Impurity-3 97.5
Page 29
188
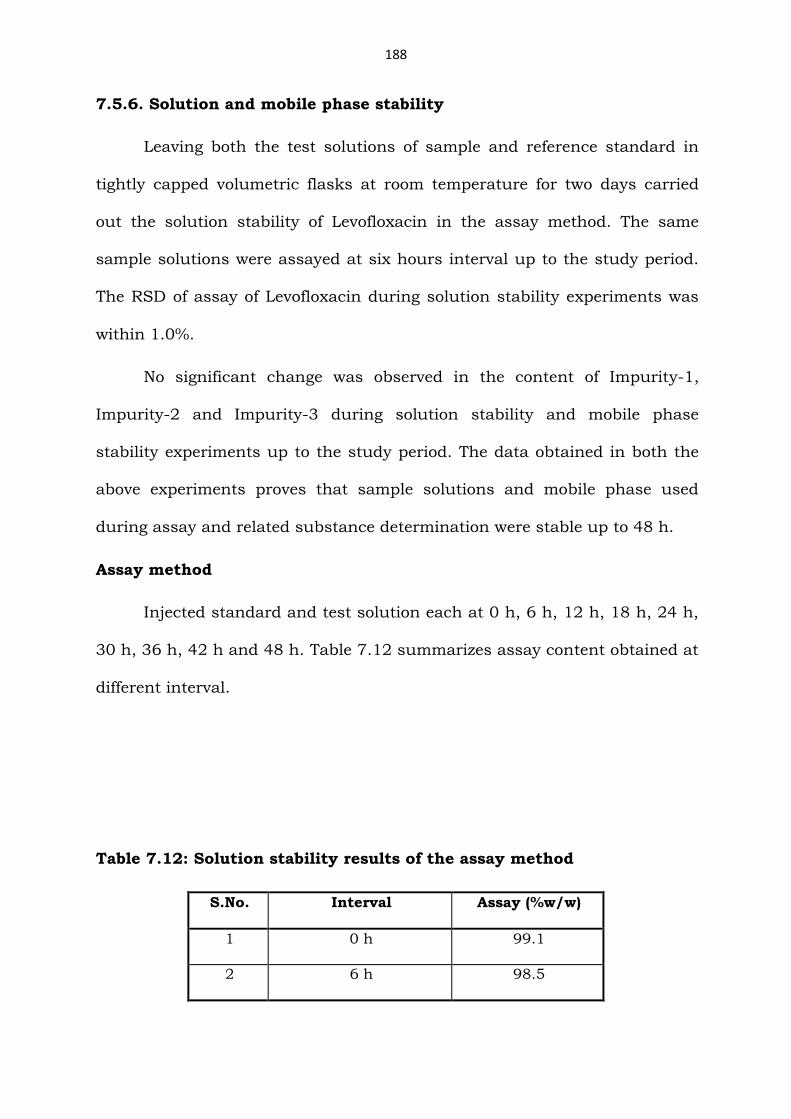
7.5.6. Solution and mobile phase stability
Leaving both the test solutions of sample and reference standard in
tightly capped volumetric flasks at room temperature for two days carried
out the solution stability of Levofloxacin in the assay method. The same
sample solutions were assayed at six hours interval up to the study period.
The RSD of assay of Levofloxacin during solution stability experiments was
within 1.0%.
No significant change was observed in the content of Impurity-1,
Impurity-2 and Impurity-3 during solution stability and mobile phase
stability experiments up to the study period. The data obtained in both the
above experiments proves that sample solutions and mobile phase used
during assay and related substance determination were stable up to 48 h.
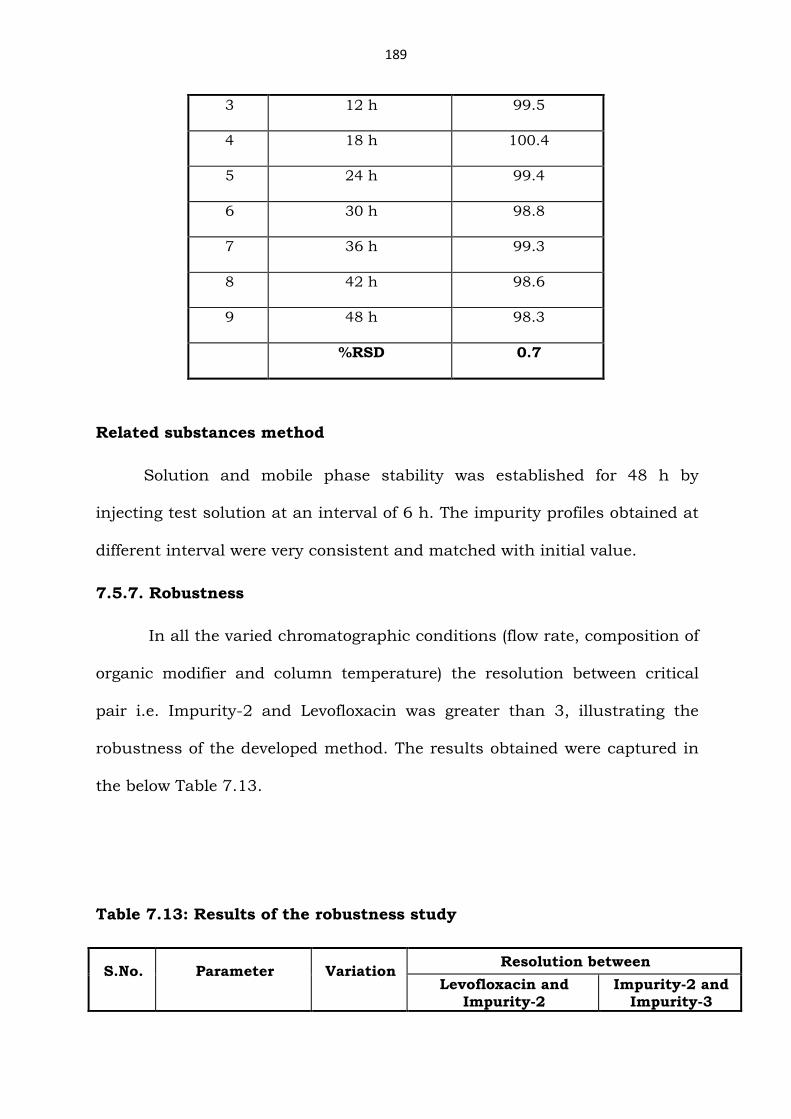
Assay method
Injected standard and test solution each at 0 h, 6 h, 12 h, 18 h, 24 h,
30 h, 36 h, 42 h and 48 h. Table 7.12 summarizes assay content obtained at
different interval.
Table 7.12: Solution stability results of the assay method
S.No. Interval Assay (%w/w)
1 0 h 99.1
2 6 h 98.5
Page 30
189
3 12 h 99.5
4 18 h 100.4
5 24 h 99.4
6 30 h 98.8
7 36 h 99.3
8 42 h 98.6
9 48 h 98.3
%RSD 0.7
Related substances method
Solution and mobile phase stability was established for 48 h by
injecting test solution at an interval of 6 h. The impurity profiles obtained at
different interval were very consistent and matched with initial value.
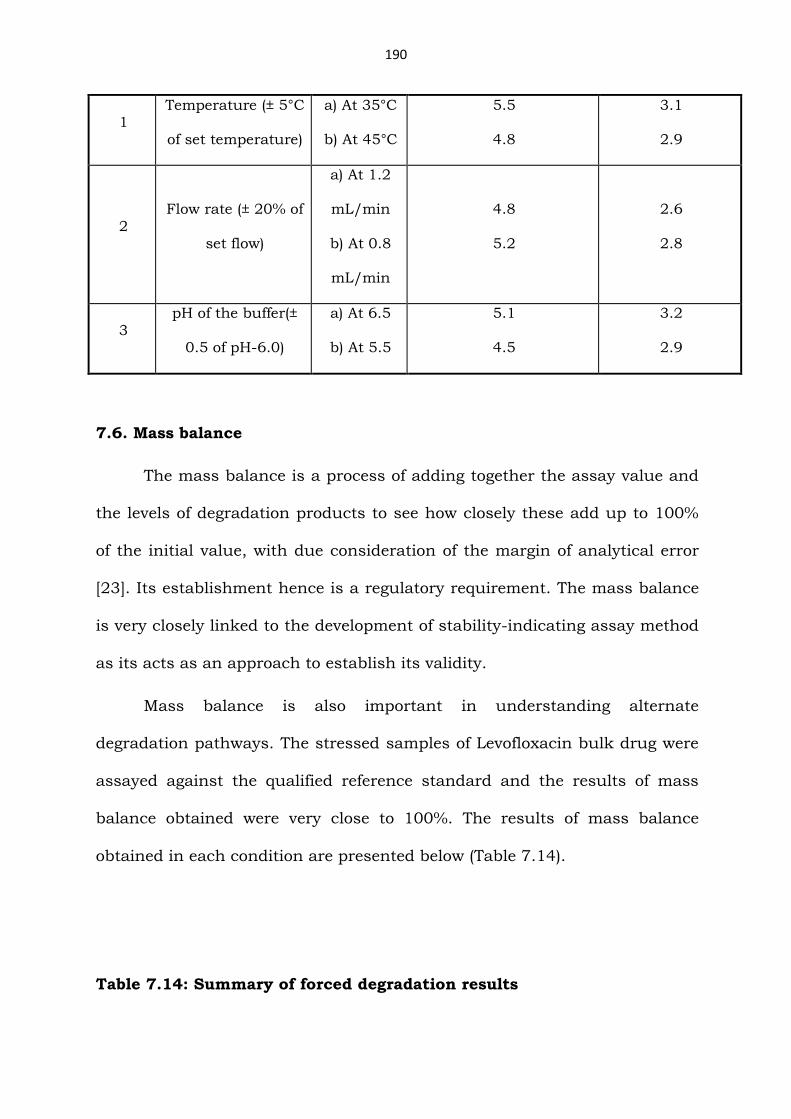
7.5.7. Robustness
In all the varied chromatographic conditions (flow rate, composition of
organic modifier and column temperature) the resolution between critical
pair i.e. Impurity-2 and Levofloxacin was greater than 3, illustrating the
robustness of the developed method. The results obtained were captured in
the below Table 7.13.
Table 7.13: Results of the robustness study
S.No. Parameter Variation Resolution between
Levofloxacin and
Impurity-2
Impurity-2 and
Impurity-3
Page 31
190
1 Temperature (± 5°C
of set temperature)
a) At 35°C
b) At 45°C
5.5
4.8
3.1
2.9
2 Flow rate (± 20% of
set flow)
a) At 1.2
mL/min
b) At 0.8
mL/min
4.8
5.2
2.6
2.8
3
pH of the buffer(±
0.5 of pH-6.0)
a) At 6.5
b) At 5.5
5.1
4.5
3.2
2.9
7.6. Mass balance
The mass balance is a process of adding together the assay value and
the levels of degradation products to see how closely these add up to 100%
of the initial value, with due consideration of the margin of analytical error
[23]. Its establishment hence is a regulatory requirement. The mass balance
is very closely linked to the development of stability-indicating assay method
as its acts as an approach to establish its validity.
Mass balance is also important in understanding alternate
degradation pathways. The stressed samples of Levofloxacin bulk drug were
assayed against the qualified reference standard and the results of mass
balance obtained were very close to 100%. The results of mass balance
obtained in each condition are presented below (Table 7.14).
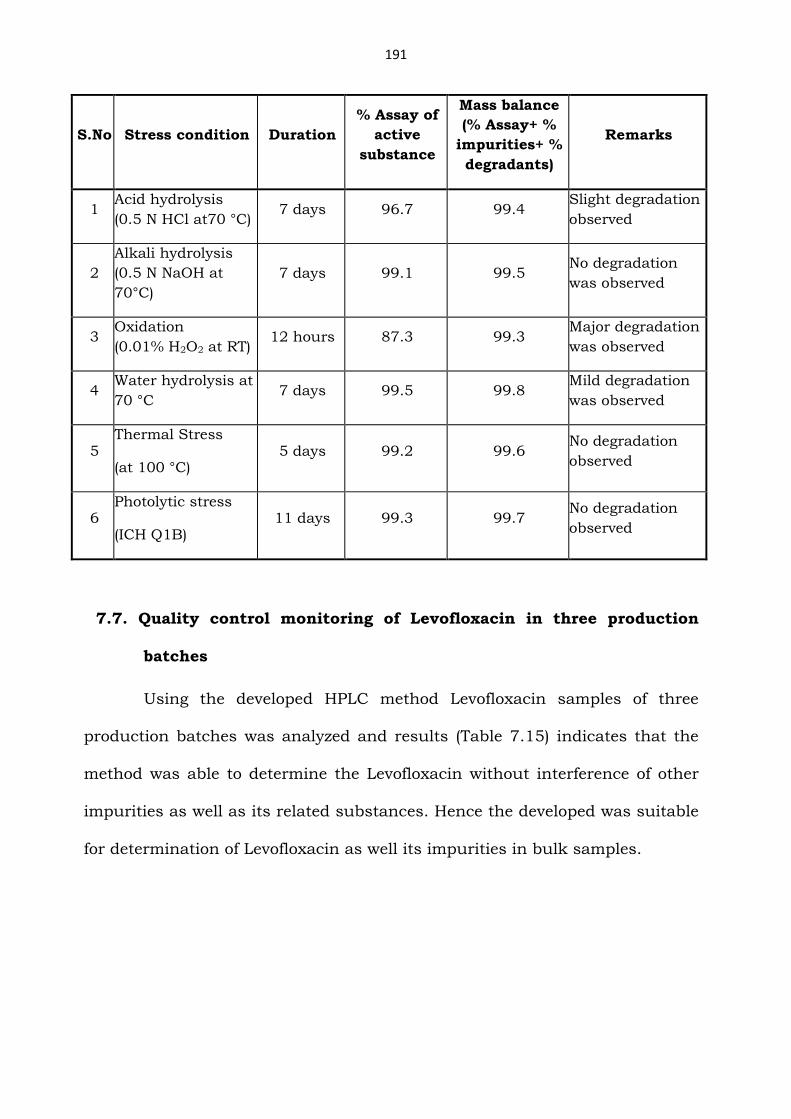
Table 7.14: Summary of forced degradation results
Page 32
191
S.No Stress condition Duration
% Assay of
active
substance
Mass balance
(% Assay+ %
impurities+ %
degradants)
Remarks
1 Acid hydrolysis
(0.5 N HCl at70 °C) 7 days 96.7 99.4
Slight degradation
observed
2
Alkali hydrolysis
(0.5 N NaOH at
70°C)
7 days 99.1 99.5 No degradation
was observed
3 Oxidation
(0.01% H2O2 at RT) 12 hours 87.3 99.3
Major degradation
was observed
4 Water hydrolysis at
70 °C 7 days 99.5 99.8
Mild degradation
was observed
5 Thermal Stress
(at 100 °C) 5 days 99.2 99.6
No degradation
observed
6 Photolytic stress
(ICH Q1B) 11 days 99.3 99.7
No degradation
observed
7.7. Quality control monitoring of Levofloxacin in three production
batches
Using the developed HPLC method Levofloxacin samples of three
production batches was analyzed and results (Table 7.15) indicates that the
method was able to determine the Levofloxacin without interference of other
impurities as well as its related substances. Hence the developed was suitable
for determination of Levofloxacin as well its impurities in bulk samples.
Page 33
192
Table 7.15: Results of quality monitoring of Levofloxacin in three production batches
Batch No: Description
Water
Content by KF
Specific optical rotation
(°)
Related substances by HPLC Any
Unknown
impurity
Total impurit
ies
Assay on
Anhydrous
basis Imp-1 Imp-2
Imp-3
LP001E08
Yellowish white
crystalline powder
2.5 -79 ND ND 0.03 0.01 0.05 99.7
LP001G09
Yellowish white
crystalline
powder
2.2 -78 ND ND 0.04 0.01 0.06 100.3
LP001H08
Yellowish white
crystalline powder
2.6 -78 ND ND 0.03 0.02 0.05 99.8
ND-Not detected
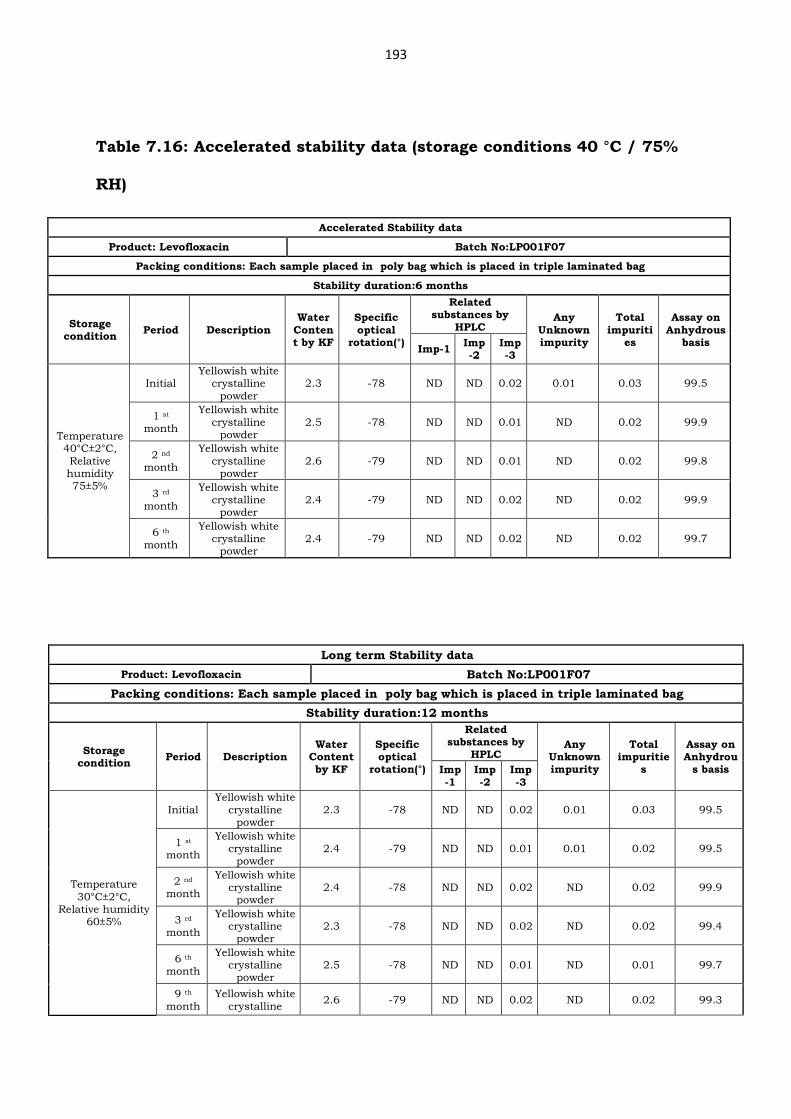
7.8. Analysis of Levofloxacin stability samples
USP states that stability testing for both drug substance and drug
product should be performed by validated stability-indicating test method
[24]. One manufacturing lot of Levofloxacin monohydrate was placed for
stability study in chambers maintained at ICH set conditions. The analysis
of stability samples was carried up to 12 months period using the above
stability-indicating method. The stability data results obtained are presented
in Table 7.16 and 7.17. The developed HPLC method performed satisfactorily
for the quantitative evaluation of stability samples.
Page 34
193
Table 7.16: Accelerated stability data (storage conditions 40 °C / 75%
RH)
Accelerated Stability data
Product: Levofloxacin Batch No:LP001F07
Packing conditions: Each sample placed in poly bag which is placed in triple laminated bag
Stability duration:6 months
Storage condition
Period Description
Water
Content by KF
Specific
optical rotation(°)
Related substances by
HPLC Any
Unknown impurity
Total
impurities
Assay on
Anhydrous basis
Imp-1 Imp-2
Imp-3
Temperature 40°C±2°C,
Relative humidity 75±5%
Initial Yellowish white
crystalline
powder
2.3 -78 ND ND 0.02 0.01 0.03 99.5
1 st
month
Yellowish white
crystalline powder
2.5 -78 ND ND 0.01 ND 0.02 99.9
2 nd
month
Yellowish white
crystalline powder
2.6 -79 ND ND 0.01 ND 0.02 99.8
3 rd
month
Yellowish white crystalline
powder 2.4 -79 ND ND 0.02 ND 0.02 99.9
6 th
month
Yellowish white crystalline
powder 2.4 -79 ND ND 0.02 ND 0.02 99.7
Long term Stability data
Product: Levofloxacin Batch No:LP001F07
Packing conditions: Each sample placed in poly bag which is placed in triple laminated bag
Stability duration:12 months
Storage condition
Period Description Water
Content by KF
Specific optical
rotation(°)
Related substances by
HPLC Any
Unknown impurity
Total impuritie
s
Assay on Anhydrou
s basis Imp
-1
Imp
-2
Imp
-3
Temperature
30°C±2°C, Relative humidity
60±5%
Initial
Yellowish white
crystalline powder
2.3 -78 ND ND 0.02 0.01 0.03 99.5
1 st
month
Yellowish white
crystalline powder
2.4 -79 ND ND 0.01 0.01 0.02 99.5
2 nd month
Yellowish white crystalline
powder 2.4 -78 ND ND 0.02 ND 0.02 99.9
3 rd month
Yellowish white crystalline
powder 2.3 -78 ND ND 0.02 ND 0.02 99.4
6 th
month
Yellowish white crystalline
powder 2.5 -78 ND ND 0.01 ND 0.01 99.7
9 th
month
Yellowish white
crystalline 2.6 -79 ND ND 0.02 ND 0.02 99.3
Page 35
194
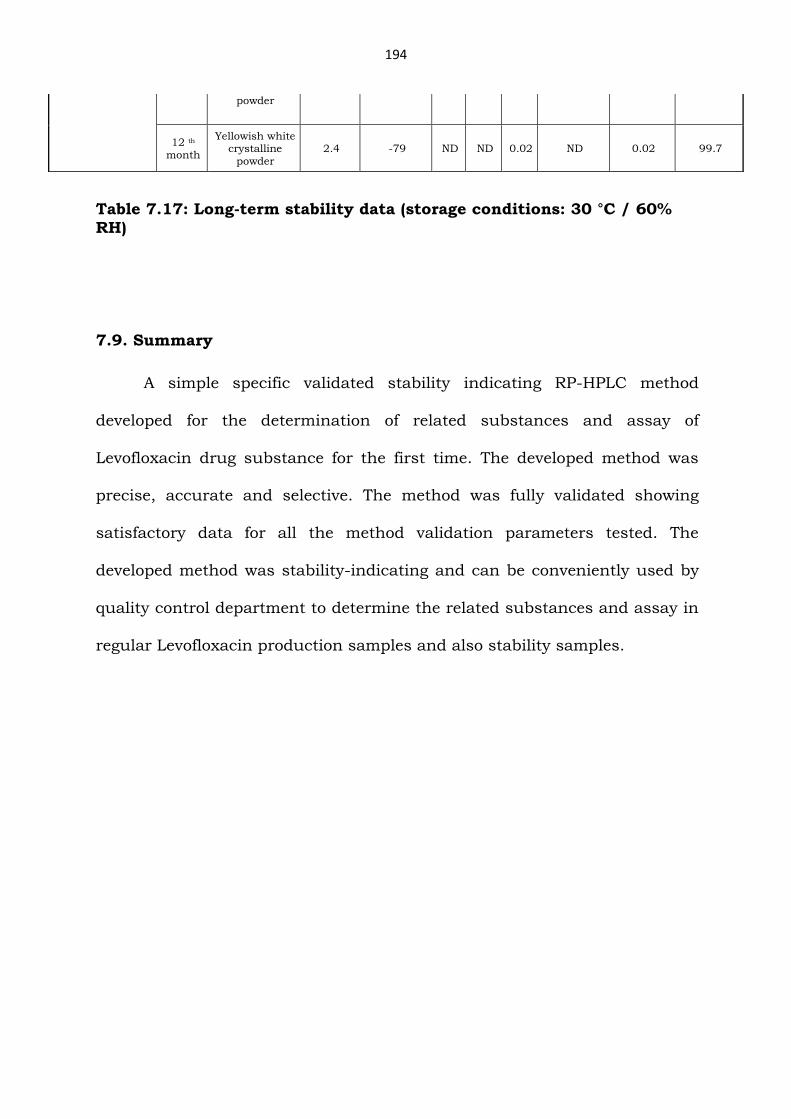
Table 7.17: Long-term stability data (storage conditions: 30 °C / 60% RH)
7.9. Summary
A simple specific validated stability indicating RP-HPLC method
developed for the determination of related substances and assay of
Levofloxacin drug substance for the first time. The developed method was
precise, accurate and selective. The method was fully validated showing
satisfactory data for all the method validation parameters tested. The
developed method was stability-indicating and can be conveniently used by
quality control department to determine the related substances and assay in
regular Levofloxacin production samples and also stability samples.
powder
12 th
month
Yellowish white crystalline
powder
2.4 -79 ND ND 0.02 ND 0.02 99.7