822 Operating Cost Inputs 8-11 8221 Annual Energy and Water Consumption 8-13 8222 Energy and Water Prices 8-15 8223 Energy and Water Price Trends 8-22 8224 Repair and Maintenance Costs 8-24
823 Product Lifetime 8-26 824 Discount Rates 8-27 825 Effective Date of Standard 8-30 826 Equipment Assignment for the Base Case 8-30 83 PAYBACK PERIOD INPUTS 8-32 84 LIFE-CYCLE COST AND PAYBACK PERIOD RESULTS 8-33 841 Base Case LCC Distributions 8-34 842 Standard-Level Distributions of LCC Impacts 8-36 843 Standard-Level PBP Distributions 8-37 844 LCC and PBP Results 8-38 85 REBUTTABLE PAYBACK PERIOD 8-45 851 Metric 8-45 852 Inputs 8-45 853 Results 8-46
Installation Costs and Total Installed Costs 8-10 Table 828 Front-Loading Commercial Clothes Washers Consumer Equipment
Prices Installation Costs and Total Installed Costs 8-11 Table 829 Inputs for Operating Cost 8-11 Table 8210 Top-Loading Commercial Clothes Washers Multi-Family Application
Annual Energy and Water Use by Efficiency Level 8-14 Table 8211 Top-Loading Commercial Clothes Washers Laundromat Application
Annual Energy and Water Use by Efficiency Level 8-14 Table 8212 Front-Loading Commercial Clothes Washers Multi-Family Application
Annual Energy and Water Use by Efficiency Level 8-15 Table 8213 Front-Loading Commercial Clothes Washers Laundromat Application
Annual Energy and Water Use by Efficiency Level 8-15 Table 8214 Average Commercial Electricity Prices in 2007 8-17 Table 8215 Average Commercial Electricity Prices for Commercial Clothes Washers
in 2008 8-18 Table 8216 Average Commercial Natural Gas Prices in 2007 8-19 Table 8217 Average Commercial Natural Gas Prices for Commercial Clothes Washers
in 2008 8-20 Table 8218 Average Per-Unit-Volume Water Prices in 2006 8-21 Table 8219 Average Per-Unit-Volume Water Prices for Commercial Clothes Washers
in 2008 8-22 Table 8220 Top-Loading Commercial Clothes Washer Annualized Repair Costs 8-25 Table 8221 Front-Loading Commercial Clothes Washer Annualized Repair Costs 8-25 Table 8222 Commercial Clothes Washers Product Lifetime Estimates and Sources 8-26 Table 8223 Commercial Clothes Washers Average Minimum and Maximum
Product Lifetimes 8-26 Table 8224 Data for the Calculation of Weighted-Average Cost of Capital for Sectors
that Purchase Commercial Clothes Washers 8-28 Table 8225 Weighted Average Cost of Capital for Sectors that Purchase Commercial
Clothes Washers 8-29 Table 8226 Discount Rates for Commercial Clothes Washers 8-30 Table 8227 Top-Loading Commercial Clothes Washers Base Case Market Shares 8-32 Table 8228 Front-Loading Commercial Clothes Washers Base Case Market Shares 8-32 Table 841 Top-Loading Commercial Clothes Washers Multi-Family Application
Figure 811 Flow Diagram of Inputs for the Determination of LCC and PBP 8-4 Figure 821 Electricity Price Trends 8-23 Figure 822 Natural Gas Price Trends 8-23 Figure 823 Water Price Trend 8-24 Figure 841 Top-Loading Commercial Clothes Washers Multi-Family Application
Base Case LCC Distribution 8-34 Figure 842 Top-Loading Commercial Clothes Washers Laundromat Application
Base Case LCC Distribution 8-35 Figure 843 Front-Loading Commercial Clothes Washers Multi-Family Application
Base Case LCC Distribution 8-35 Figure 844 Front-Loading Commercial Clothes Washers Laundromat Application
Base Case LCC Distribution 8-36 Figure 845 Top-Loading Commercial Clothes Washers Multi-Family Application
Distribution of LCC Impacts for CSL 2 8-37 Figure 846 Commercial Clothes Washers Multi-Family Application Distribution of
PBPs for CSL 3 8-38 Figure 847 Range of LCC Savings for Top-Loading Commercial Clothes Washers
Multi-Family 8-41 Figure 848 Range of LCC Savings for Top-Loading Commercial Clothes Washers
Laundromat 8-41 Figure 849 Range of LCC Savings for Front-Loading Commercial Clothes Washers
Multi-Family 8-42 Figure 8410 Range of LCC Savings for Front-Loading Commercial Clothes Washers
Laundromat 8-42 Figure 8411 Range of Payback Periods for Top-Loading Commercial Clothes Washers
Multi-Family 8-43 Figure 8412 Range of Payback Periods for Top-Loading Commercial Clothes Washers
Laundromat 8-43 Figure 8413 Range of Payback Periods for Front-Loading Commercial Clothes
Washers Multi-Family 8-44 Figure 8414 Range of Payback Periods for Front-Loading Commercial Clothes
Washers Laundromat 8-44
8-iii
EERE-2006-STD-0127 COMMENT 691
CHAPTER 8 LIFE-CYCLE COST AND PAYBACK PERIOD ANALYSIS
81 INTRODUCTION
This chapter describes the Department of Energy (DOE)rsquos methodology for analyzing the economic impacts of possible energy efficiency standards on individual consumers The effect of standards on individual consumers includes a change in operating expense (usually decreased) and a change in purchase price (usually increased) This chapter describes three metrics DOE used in the consumer analysis to determine the effect of standards on individual consumers
bull Life-cycle cost (LCC) is the total consumer expense over the life of an appliance including purchase expense and operating costs (including energy expenditures) DOE discounts future operating costs to the time of purchase and sums them over the lifetime of the equipment
bull Payback period (PBP) measures the amount of time it takes customers to recover the assumed higher purchase price of more energy-efficient equipment through lower operating costs
bull Rebuttable payback period is a special case of the PBP Where LCC and PBP are estimated over a range of inputs reflecting actual conditions rebuttable payback period is based on laboratory conditions specifically DOE test procedure inputs
Inputs to the LCC and PBP are discussed in sections 82 and 83 respectively of this chapter Results for the LCC and PBP are presented in section 84 The rebuttable PBP is discussed in section 85 Key variables and calculations are presented for each metric DOE performed the calculations discussed here using a series of Microsoft Excelreg spreadsheets which are accessible on the Internet (httpwwweereenergygovbuildingsappliance_standards) Details and instructions for using the spreadsheets are discussed in Appendix 8A
This chapter presents information and results pertaining solely to CCWs As described in section 13 of chapter 1 of this technical support document (TSD) DOE is continuing the rulemaking for energy conservation standards for microwave oven standby power and analyses related to these products will be published in a separate TSD In addition DOE issued a final rule1 adopting energy conservation standards for conventional cooking products (ie cooktops and ovens) and microwave oven energy factor (EF) and details of the analyses for these products are contained in the corresponding final rule TSD2
811 General Approach for LCC and PBP Analysis
Recognizing that several inputs to the determination of consumer LCC and PBP are either variable or uncertain DOE conducted the LCC and PBP analysis by modeling both the uncertainty and variability in the inputs using Monte Carlo simulation and probability
8-1
EERE-2006-STD-0127 COMMENT 691
distributions A detailed explanation of Monte Carlo simulation and the use of probability distributions is contained in Appendix 8B DOE developed LCC and PBP spreadsheet models incorporating both Monte Carlo simulation and probability distributions by using Microsoft Excelreg spreadsheets combined with Crystal Ballreg (a commercially available add-in program)
As described in Chapter 6 DOE established the variability and uncertainty in energy and water use by defining the uncertainty and variability in the usage (in cycles per day) of the equipment As will be described later in this chapter the variability and uncertainty in energy and water pricing are characterized by regional differences in energy and water prices
DOE displays the LCC and PBP results as distributions of impacts compared to the baseline conditions Results are presented at the end of this chapter and are based on 10000 samples per Monte Carlo simulation run To illustrate the implications of the analysis DOE generated a frequency chart depicting the variation in LCC and PBP for each standard level considered
812 Overview of LCC and PBP Inputs
The LCC is the total consumer expense over the life of the equipment including purchase expense and operating expense (including energy expenditures) DOE discounts future operating expenses to the time of purchase and sums them over the lifetime of the equipment The PBP is the change in purchase expense due to an increased efficiency standard divided by the change in annual operating expense that results from the standard It represents the number of years it will take the customer to recover the increased purchase expense through decreased operating expenses
DOE categorizes inputs to the LCC and PBP analysis as follows (1) inputs for establishing the purchase expense otherwise known as the total installed cost and (2) inputs for calculating the operating cost
The primary inputs for establishing the total installed cost are
bull Baseline manufacturer cost The costs incurred by the manufacturer to produce equipment meeting existing minimum efficiency standards
bull Standard-level manufacturer cost increases The change in manufacturer cost associated with producing equipment to meet a particular standard level
bull Markups and sales tax The markups and sales tax associated with converting the manufacturer cost to a consumer equipment price The markups and sale tax are described in detail in Chapter 7 Markups for Equipment Price Determination
bull Installation cost The cost to the consumer of installing the equipment The installation cost represents all costs required to install the equipment other than the marked-up consumer equipment price The installation cost includes labor overhead and any
8-2
EERE-2006-STD-0127 COMMENT 691
miscellaneous materials and parts Thus the total installed cost equals the consumer equipment price plus the installation cost
The primary inputs for calculating the operating cost are
bull Equipment energy and water consumption The equipment energy consumption is the site energy use associated with operating the equipment The water consumption is the site water use associated with operating the equipment Chapter 6 Energy and Water Use Determination details how DOE determined the equipment energy and water consumption based on various data sources
bull Equipment efficiency The equipment efficiency dictates the equipment energy and water consumption associated with standard-level equipment (ie equipment with efficiencies greater than baseline equipment) Chapter 6 Energy and Water Use Determination details how energy and water consumption change with increasing equipment efficiency
bull Energy and water prices Energy and water prices are the prices paid by consumers for energy (ie electricity gas or oil) and water DOE determined current energy prices based on data from the DOE- EIA DOE determined water prices based on data from the American Water Works Association (AWWA)
bull Energy and water price trends DOE used the EIA Annual Energy Outlook 2009 (AEO2009) to forecast energy prices into the future For the results presented in this chapter DOE used the AEO2009 reference case to forecast future energy prices DOE used consumer price index data specific to water and sewerage maintenance from the Bureau of Labor Statistics as the basis for its water price trend
bull Repair and maintenance costs Repair costs are associated with repairing or replacing components that have failed Maintenance costs are associated with maintaining the operation of the equipment
bull Lifetime The age at which the equipment is retired from service
bull Discount rate The rate at which DOE discounted future expenditures to establish their present value
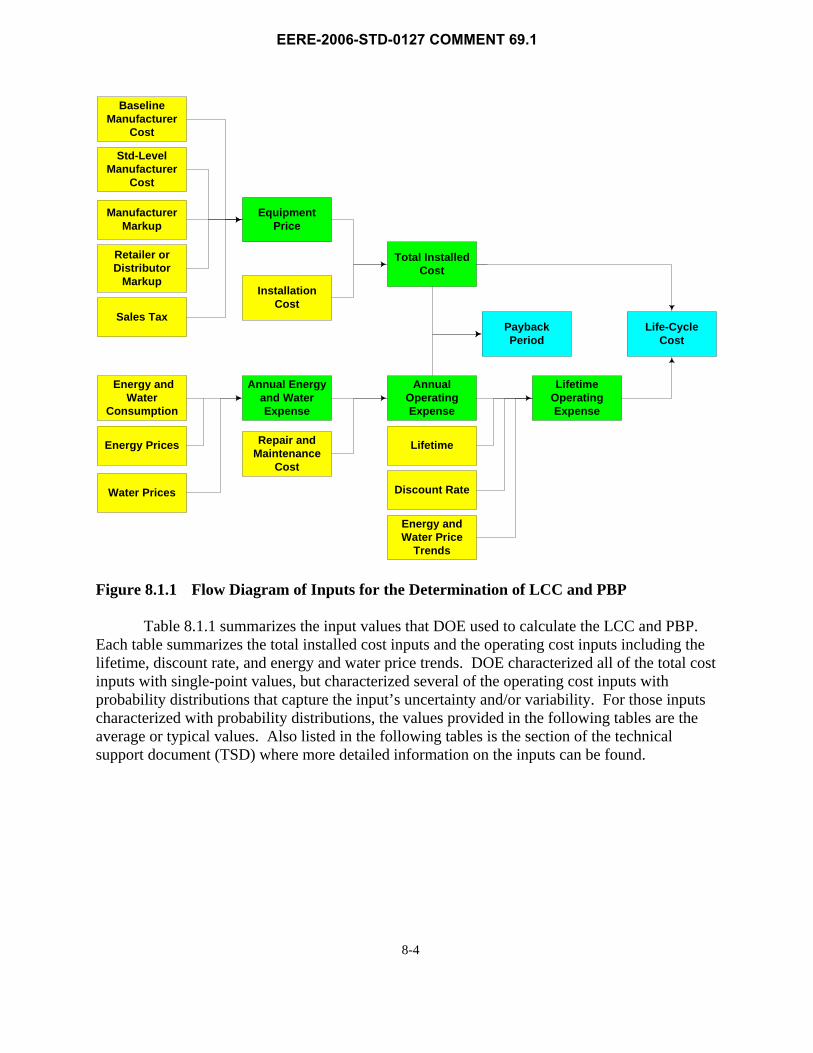
Figure 811 graphically depicts the relationships between the installed cost and operating cost inputs for the calculation of the LCC and PBP In the figure below the yellow boxes indicate the inputs the green boxes indicate intermediate outputs and the blue boxes indicate the final outputs (the LCC and PBP)
8-3
EERE-2006-STD-0127 COMMENT 691
Baseline Manufacturer
Cost
Std-Level Manufacturer
Cost
Manufacturer Markup
Retailer or Distributor
Markup
Sales Tax
Installation Cost
Total Installed Cost
Water Prices
Energy and Water
Consumption
Equipment Price
Lifetime Operating Expense
Annual Energy and Water Expense
Lifetime Repair and Maintenance
Cost
Discount Rate
Energy and Water Price
Trends
Annual Operating Expense
Payback Period
Life-Cycle Cost
Energy Prices
Figure 811 Flow Diagram of Inputs for the Determination of LCC and PBP
Table 811 summarizes the input values that DOE used to calculate the LCC and PBP Each table summarizes the total installed cost inputs and the operating cost inputs including the lifetime discount rate and energy and water price trends DOE characterized all of the total cost inputs with single-point values but characterized several of the operating cost inputs with probability distributions that capture the inputrsquos uncertainty andor variability For those inputs characterized with probability distributions the values provided in the following tables are the average or typical values Also listed in the following tables is the section of the technical support document (TSD) where more detailed information on the inputs can be found
8-4
EERE-2006-STD-0127 COMMENT 691
Table 811 LCC and PBP Input Summary
Input Product Class Average or Typical Value Characterization
TSD Section Reference
Total Installed Cost Inputs
Baseline Manufacturer Cost
Top-Loading 126 MEF950 WF = $29630 Single-Point Value
8212 Front-Loading 172 MEF800 WF = $61102 Single-Point Value
Energy Prices Both Elec = 108 centkWh Gas = 1189 $MMBtu Single-Point Value 8222
Water and Wastewater Prices Both Water = 229 $103 gallon
Wastewater = 297 $103 gallon Singe-Point Value 8222
Repair and Maintenance Costs Both Annualized repair cost =
frac12 Equipment price Lifetime Single-Point Value 8224
Lifetime Both Multi-Family = 1125 years Laundromat = 7125 years Weibull distribution 823
Discount Rate Both 57 Custom distribution 824
Energy Price Trend Both AEO 2009 Reference Case Two sensitivities High amp Low Growth Cases 8223
Water and Wastewater Price Trend Both Bureau of Labor Statistics
Water and sewerage CPI Single forecast 8223
Annual use based on electric water heating and electric clothes drying Annual use provided for baseline product only Annual use decreases with increased product efficiency
8-5
EERE-2006-STD-0127 COMMENT 691
82 LIFE-CYCLE COST INPUTS
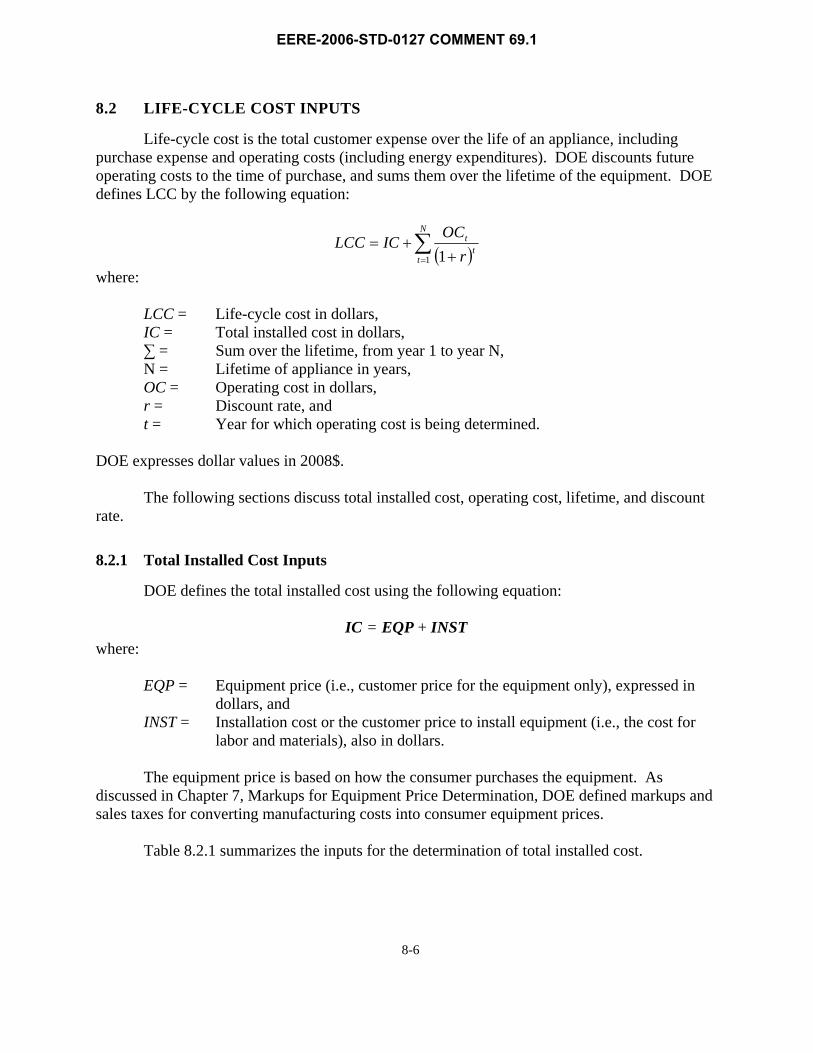
Life-cycle cost is the total customer expense over the life of an appliance including purchase expense and operating costs (including energy expenditures) DOE discounts future operating costs to the time of purchase and sums them over the lifetime of the equipment DOE defines LCC by the following equation
N OCtLCC = IC +sum t(1+ r) where
t=1
LCC = Life-cycle cost in dollars IC = Total installed cost in dollars sum = Sum over the lifetime from year 1 to year N N = Lifetime of appliance in years OC = Operating cost in dollars r = Discount rate and t = Year for which operating cost is being determined
DOE expresses dollar values in 2008$
The following sections discuss total installed cost operating cost lifetime and discount rate
821 Total Installed Cost Inputs
DOE defines the total installed cost using the following equation
IC = EQP + INST where
EQP = Equipment price (ie customer price for the equipment only) expressed in dollars and
INST = Installation cost or the customer price to install equipment (ie the cost for labor and materials) also in dollars
The equipment price is based on how the consumer purchases the equipment As discussed in Chapter 7 Markups for Equipment Price Determination DOE defined markups and sales taxes for converting manufacturing costs into consumer equipment prices
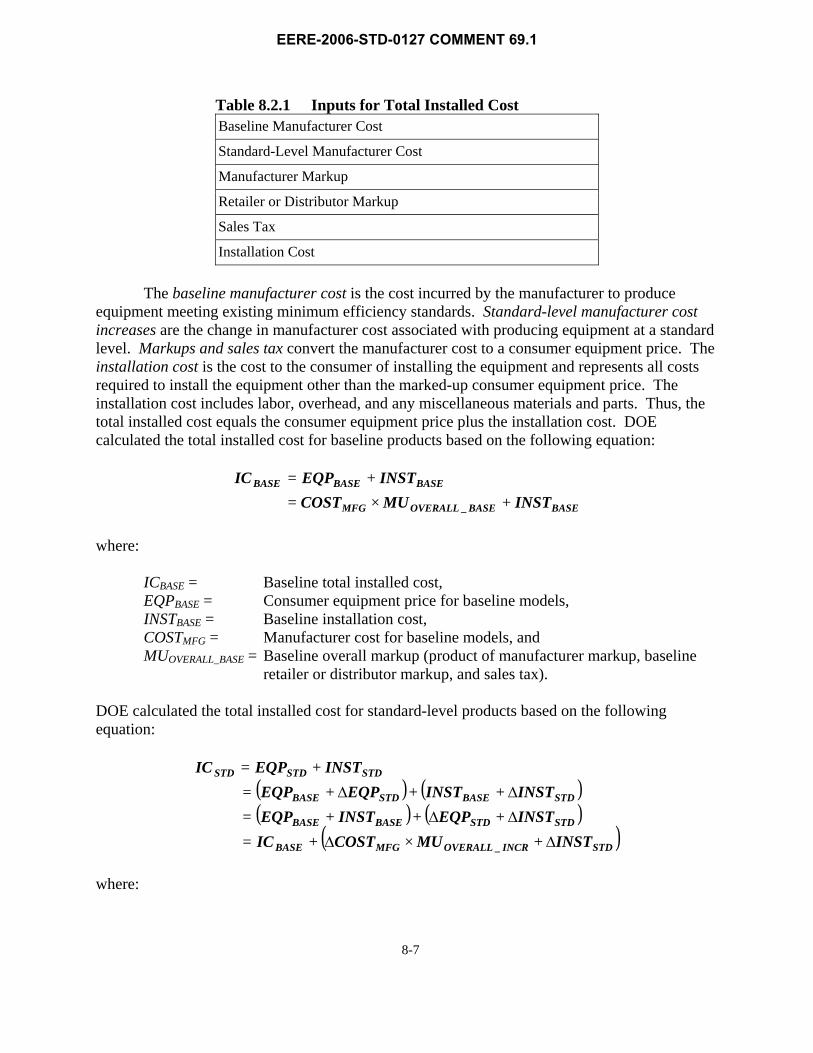
Table 821 summarizes the inputs for the determination of total installed cost
8-6
EERE-2006-STD-0127 COMMENT 691
Table 821 Inputs for Total Installed Cost Baseline Manufacturer Cost
Standard-Level Manufacturer Cost
Manufacturer Markup
Retailer or Distributor Markup
Sales Tax
Installation Cost
The baseline manufacturer cost is the cost incurred by the manufacturer to produce equipment meeting existing minimum efficiency standards Standard-level manufacturer cost increases are the change in manufacturer cost associated with producing equipment at a standard level Markups and sales tax convert the manufacturer cost to a consumer equipment price The installation cost is the cost to the consumer of installing the equipment and represents all costs required to install the equipment other than the marked-up consumer equipment price The installation cost includes labor overhead and any miscellaneous materials and parts Thus the total installed cost equals the consumer equipment price plus the installation cost DOE calculated the total installed cost for baseline products based on the following equation
IC BASE = EQPBASE + INSTBASE
= COSTMFG times MUOVERALL _ BASE + INSTBASE
where
ICBASE = Baseline total installed cost EQPBASE = Consumer equipment price for baseline models INSTBASE = Baseline installation cost COSTMFG = Manufacturer cost for baseline models and MUOVERALL_BASE = Baseline overall markup (product of manufacturer markup baseline
retailer or distributor markup and sales tax)
DOE calculated the total installed cost for standard-level products based on the following equation
= IC BASE + (ΔCOSTMFG times MUOVERALL _ INCR + ΔINSTSTD ) where
8-7
EERE-2006-STD-0127 COMMENT 691
ICSTD = Standard-level total installed cost EQPSTD = Consumer equipment price for standard-level models INSTSTD = Standard-level installation cost EQPBASE = Consumer equipment price for baseline models ΔEQPSTD = Change in equipment price for standard-level models INSTBASE = Baseline installation cost ΔINSTSTD = Change in installation cost for standard-level models ICBASE = Baseline total installed cost ΔCOSTMFG = Change in manufacturer cost for standard-level models and MUOVERALL_INCR = Incremental overall markup (product of manufacturer markup
incremental retailer or distributor markup and sales tax)
The remainder of this section provides information about each of the above input variables that DOE used to calculate the total installed cost for cooking products dishwashers dehumidifiers and commercial clothes washers
8212 Baseline Manufacturer Cost
DOE used residential clothes washer data from AHAMrsquos 2005 Fact Book to develop the baseline manufacturer costs for top-loading commercial clothes washers3 According to the AHAM 2005 Fact Book in the year 2005 total clothes washer sales equaled $3373042 million while total industry shipments equaled 9394 million DOE divided total sales by total shipments to arrive at an average manufacturer price of $35906 Based on a manufacturer markup of 126 as determined in section 72 of Chapter 7 Markups for Equipment Price Determination DOE arrived at a baseline manufacturer cost of $28497 in 2006$ As detailed in Chapter 5 Engineering Analysis DOE estimated the cost difference between top-loading and front-loading washers to arrive at the baseline manufacturer cost for front-loading washers Table 822 presents the baseline manufacturer cost as well as the associated baseline modified energy factor and water factor
DOE used a combination of cost data submitted by AHAM and a reverse engineering analysis to develop commercial clothes washer manufacturer cost increases associated with increases in product standard levels Refer to Chapter 5 Engineering Analysis for details Tables 823 and 824 present the standard-level manufacturer cost increases as well as the
8-8
EERE-2006-STD-0127 COMMENT 691
associated modified energy factors and water factors for top-loading and front-loading washers respectively
The overall markup is the value determined by multiplying the manufacturer and retailer markups and the sales tax together to arrive at a single markup value Table 825 shows the overall baseline and incremental markups for commercial clothes washers Refer to Chapter 7 Markups for Equipment Price Determination for details
DOE derived baseline installation costs for commercial clothes washers from data in the RS Means Mechanical Cost Data 20084 This book provides estimates on the labor required to install commercial clothes washers Table 826 summarizes the nationally representative
8-9
EERE-2006-STD-0127 COMMENT 691
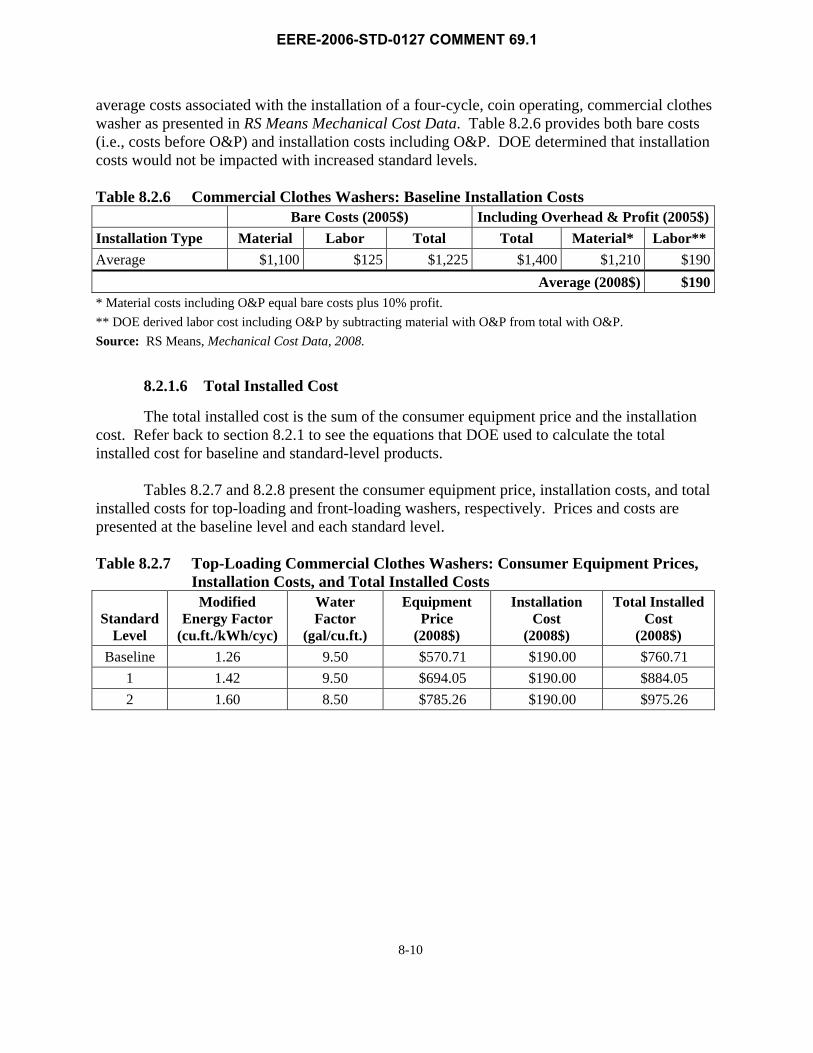
average costs associated with the installation of a four-cycle coin operating commercial clothes washer as presented in RS Means Mechanical Cost Data Table 826 provides both bare costs (ie costs before OampP) and installation costs including OampP DOE determined that installation costs would not be impacted with increased standard levels
Table 826 Commercial Clothes Washers Baseline Installation Costs Bare Costs (2005$) Including Overhead amp Profit (2005$)
Installation Type Material Labor Total Total Material Labor Average $1100 $125 $1225 $1400 $1210 $190
Average (2008$) $190 Material costs including OampP equal bare costs plus 10 profit DOE derived labor cost including OampP by subtracting material with OampP from total with OampP Source RS Means Mechanical Cost Data 2008
8216 Total Installed Cost
The total installed cost is the sum of the consumer equipment price and the installation cost Refer back to section 821 to see the equations that DOE used to calculate the total installed cost for baseline and standard-level products
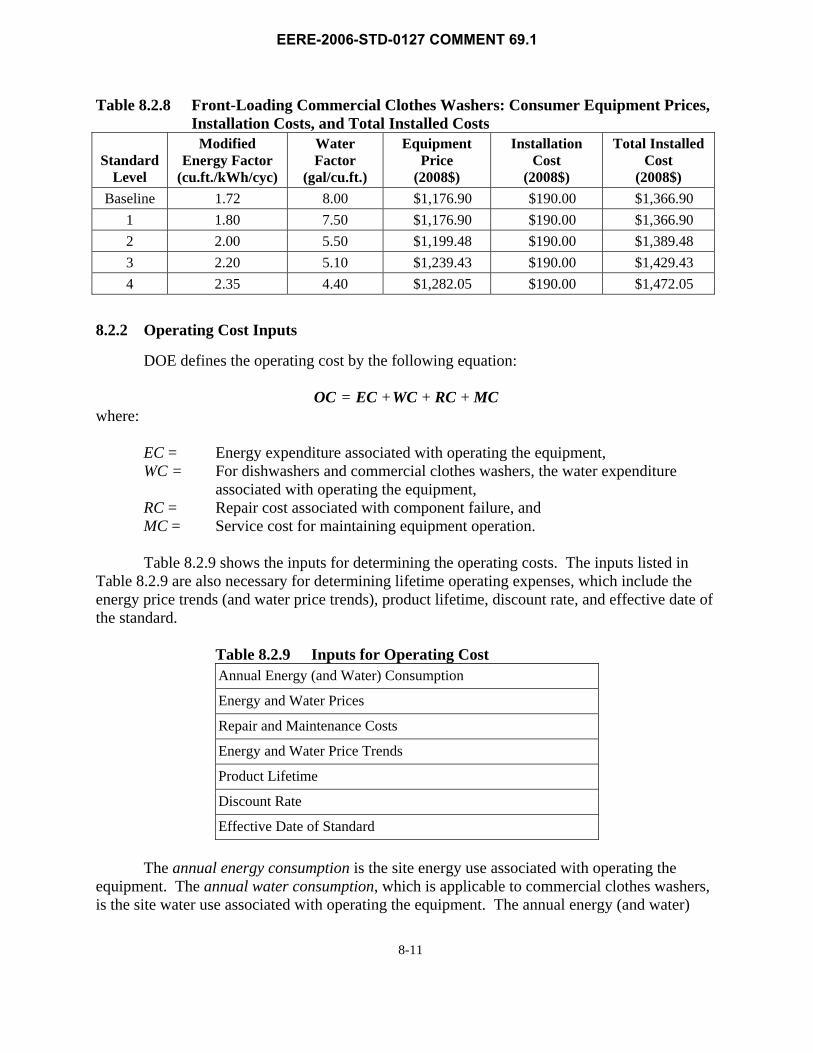
Tables 827 and 828 present the consumer equipment price installation costs and total installed costs for top-loading and front-loading washers respectively Prices and costs are presented at the baseline level and each standard level
Table 827 Top-Loading Commercial Clothes Washers Consumer Equipment Prices Installation Costs and Total Installed Costs
DOE defines the operating cost by the following equation
OC = EC +WC + RC + MC where
EC = Energy expenditure associated with operating the equipment WC = For dishwashers and commercial clothes washers the water expenditure
associated with operating the equipment RC = Repair cost associated with component failure and MC = Service cost for maintaining equipment operation
Table 829 shows the inputs for determining the operating costs The inputs listed in Table 829 are also necessary for determining lifetime operating expenses which include the energy price trends (and water price trends) product lifetime discount rate and effective date of the standard
Table 829 Inputs for Operating Cost Annual Energy (and Water) Consumption
Energy and Water Prices
Repair and Maintenance Costs
Energy and Water Price Trends
Product Lifetime
Discount Rate
Effective Date of Standard
The annual energy consumption is the site energy use associated with operating the equipment The annual water consumption which is applicable to commercial clothes washers is the site water use associated with operating the equipment The annual energy (and water)
8-11
EERE-2006-STD-0127 COMMENT 691
__ __
consumption vary with the product efficiency That is the energy and water consumption associated with standard-level equipment (ie equipment with efficiencies greater than baseline equipment) are less than the consumptions associated with baseline equipment Energy and water prices are the prices paid by consumers for energy (ie electricity gas or oil) and water Multiplying the annual energy and water consumption by the energy and water prices yields the annual energy cost and water cost respectively Repair costs are associated with repairing or replacing components that have failed Maintenance costs are associated with maintaining the operation of the equipment DOE used energy and water price trends to forecast energy and water prices into the future and along with the product lifetime and discount rate to establish the lifetime energy and water costs The product lifetime is the age at which the equipment is retired from service The discount rate is the rate at which DOE discounted future expenditures to establish their present value DOE calculated the operating cost for baseline products based on the following equation
OC = EC +WC + RC + MCBASE BASE BASE BASE BASE
= AEC times PRICE + AWC times PRICE + RC + MCBASE ENERGY BASE WATER BASE BASE
where
OCBASE = Baseline operating cost ECBASE = Energy expenditure associated with operating the baseline equipment WCBASE = For commercial clothes washers the water expenditure associated with
operating the baseline equipment RCBASE = Repair cost associated with component failure for the baseline
equipment MCBASE = Service cost for maintaining baseline equipment operation AECBASE = Annual energy consumption for baseline equipment PRICEENERGY = Energy price AWCBASE = Annual water consumption for baseline equipment and PRICEWATER = Water price
DOE calculated the operating cost for standard-level products based on the following equation
OC = EC +WC + RC + MCSTD STD STD STD STD
= AEC times PRICE + AWC times PRICE + RC + MCSTD ENERGY STD WATER STD STD
= (AEC BASE ΔAEC STD )times PRICE ENERGY + (AWC BASE ΔAWC STD )times PRICEWATER
( + RC ) ( + ΔMC+ RC BASE Δ STD + MC BASE STD )
where
OCSTD = Standard-level operating cost ECSTD = Energy expenditure associated with operating standard-level equipment
8-12
EERE-2006-STD-0127 COMMENT 691
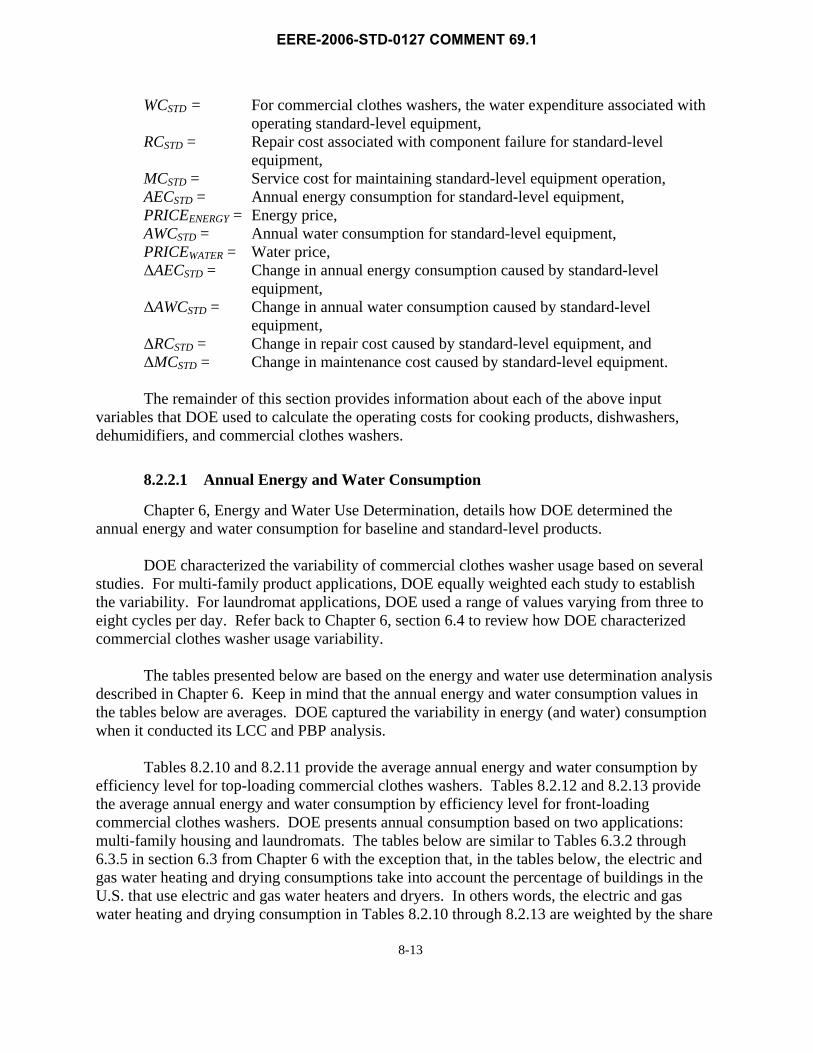
WCSTD = For commercial clothes washers the water expenditure associated with operating standard-level equipment
RCSTD = Repair cost associated with component failure for standard-level equipment
MCSTD = Service cost for maintaining standard-level equipment operation AECSTD = Annual energy consumption for standard-level equipment PRICEENERGY = Energy price AWCSTD = Annual water consumption for standard-level equipment PRICEWATER = Water price ΔAECSTD = Change in annual energy consumption caused by standard-level
equipment ΔAWCSTD = Change in annual water consumption caused by standard-level
equipment ΔRCSTD = Change in repair cost caused by standard-level equipment and ΔMCSTD = Change in maintenance cost caused by standard-level equipment
The remainder of this section provides information about each of the above input variables that DOE used to calculate the operating costs for cooking products dishwashers dehumidifiers and commercial clothes washers
8221 Annual Energy and Water Consumption
Chapter 6 Energy and Water Use Determination details how DOE determined the annual energy and water consumption for baseline and standard-level products
DOE characterized the variability of commercial clothes washer usage based on several studies For multi-family product applications DOE equally weighted each study to establish the variability For laundromat applications DOE used a range of values varying from three to eight cycles per day Refer back to Chapter 6 section 64 to review how DOE characterized commercial clothes washer usage variability
The tables presented below are based on the energy and water use determination analysis described in Chapter 6 Keep in mind that the annual energy and water consumption values in the tables below are averages DOE captured the variability in energy (and water) consumption when it conducted its LCC and PBP analysis
Tables 8210 and 8211 provide the average annual energy and water consumption by efficiency level for top-loading commercial clothes washers Tables 8212 and 8213 provide the average annual energy and water consumption by efficiency level for front-loading commercial clothes washers DOE presents annual consumption based on two applications multi-family housing and laundromats The tables below are similar to Tables 632 through 635 in section 63 from Chapter 6 with the exception that in the tables below the electric and gas water heating and drying consumptions take into account the percentage of buildings in the US that use electric and gas water heaters and dryers In others words the electric and gas water heating and drying consumption in Tables 8210 through 8213 are weighted by the share
8-13
EERE-2006-STD-0127 COMMENT 691
of buildings that use electric and gas water heaters and dryers Based on data from the Consortium for Energy Efficiency (CEE) 5 the shares of electric and gas water heating and drying in multi-family applications are 20 percent and 80 percent electric and gas water heating respectively and 40 percent and 60 percent electric and gas drying respectively Also based on CEE data 100 percent of laundromats use gas water heating and drying
Table 8210 Top-Loading Commercial Clothes Washers Multi-Family Application Annual Energy and Water Use by Efficiency Level
Standard Level
MEF WF
Annual Energy Use Annual
Water Use Water Heating Drying
MachineElectric Gas Electric Gas cuftkWhcyc galcuft kWhyr MMBtuyr kWhyr MMBtuyr kWhyr 1000 galyear
Annual usage based on 34 cycles per day (1241 cycles per year) Electric and gas water heating based on water heater efficiencies of 100 for electric and 75 for gas Water
heater consumption is weighted by the share of buildings with electric (20) and gas (80) water heaters Dryer consumption is weighted by the share of buildings with electric (40) and gas (60) dryers
Table 8211 Top-Loading Commercial Clothes Washers Laundromat Application Annual Energy and Water Use by Efficiency Level
Standard Level
MEF WF
Annual Energy Use Annual
Water Use Water Heating Drying
MachineElectric Gas Electric Gas cuftkWhcyc galcuft kWhyr MMBtuyr kWhyr MMBtuyr kWhyr 1000 galyear
Annual usage based on 6 cycles per day (2190 cycles per year) Electric and gas water heating based on water heater efficiencies of 100 for electric and 75 for gas Water
heater consumption is weighted by the share of buildings with electric (0) and gas (100) water heaters Dryer consumption is weighted by the share of buildings with electric (0) and gas (100) dryers
8-14
EERE-2006-STD-0127 COMMENT 691
Table 8212 Front-Loading Commercial Clothes Washers Multi-Family Application Annual Energy and Water Use by Efficiency Level
Standard Level
MEF WF
Annual Energy Use Annual
Water Use Water Heating Drying
MachineElectric Gas Electric Gas cuftkWhcyc galcuft kWhyr MMBtuyr kWhyr MMBtuyr kWhyr 1000 galyear
Annual usage based on 34 cycles per day (1241 cycles per year) Electric and gas water heating based on water heater efficiencies of 100 for electric and 75 for gas Water
heater consumption is weighted by the share of buildings with electric (20) and gas (80) water heaters Dryer consumption is weighted by the share of buildings with electric (40) and gas (60) dryers
Table 8213 Front-Loading Commercial Clothes Washers Laundromat Application Annual Energy and Water Use by Efficiency Level
Standard Level
MEF WF
Annual Energy Use Annual
Water Use Water Heating Drying
MachineElectric Gas Electric Gas cuftkWhcyc galcuft kWhyr MMBtuyr kWhyr MMBtuyr kWhyr 1000 galyear
Annual usage based on 6 cycles per day (2190 cycles per year) Electric and gas water heating based on water heater efficiencies of 100 for electric and 75 for gas Water
heater consumption is weighted by the share of buildings with electric (0) and gas (100) water heaters Dryer consumption is weighted by the share of buildings with electric (0) and gas (100) dryers
8222 Energy and Water Prices
DOE derived energy prices for 13 geographic areas in the US and derived water prices for the four Census regions Using these data DOE analyzed the variability of energy and water prices at the regional level for cooking products and commercial clothes washers
DOE characterized energy and water price regional variability with probability distributions It based the probability associated with each regional energy and water price on the population weight of each region
8-15
EERE-2006-STD-0127 COMMENT 691
The methodology that DOE used for deriving the energy and water prices is presented below Included are tables that summarize the regional energy and water prices for each product
Energy Prices DOE derived average energy prices from data from EIA DOE calculated prices for each
of 13 geographic areas the nine US Census divisions with four large States (New York Florida Texas and California) treated separately For Census divisions containing one of these large States DOE calculated the regional average values leaving out data for the large Statemdashfor example the Pacific region average does not include California and the West South Central does not include Texas
Commercial Electricity Prices DOE estimated electricity prices for commercial consumers in each of the above
geographic areas using EIA Form 861 data6 These data are published annually and include annual electricity sales in kilowatt hours (kWh) revenues from electricity sales and number of consumers for the residential commercial and industrial sectors for every utility serving final consumers The calculation of an average residential electricity price proceeds in two steps
1 For each utility estimate an average residential price by dividing the residential revenues by residential sales
2 Calculate a regional average price weighting each utility with customers in a region by the number of residential consumers served in that region
Table 8214 shows the results for each geographic region
8-16
EERE-2006-STD-0127 COMMENT 691
Table 8214 Average Commercial Electricity Prices in 2007 Geographic Area Average Price (2007$kWh) New England $0148 Middle Atlantic (excludes NY) $0107 East North Central $0088 West North Central $0072 South Atlantic (excludes FL) $0082 East South Central $0083 West South Central (excludes TX) $0082 Mountain $0081 Pacific (excludes CA) $0091 New York $0163 Florida $0131 Texas $0115 California $0098 Source EIA Form 861
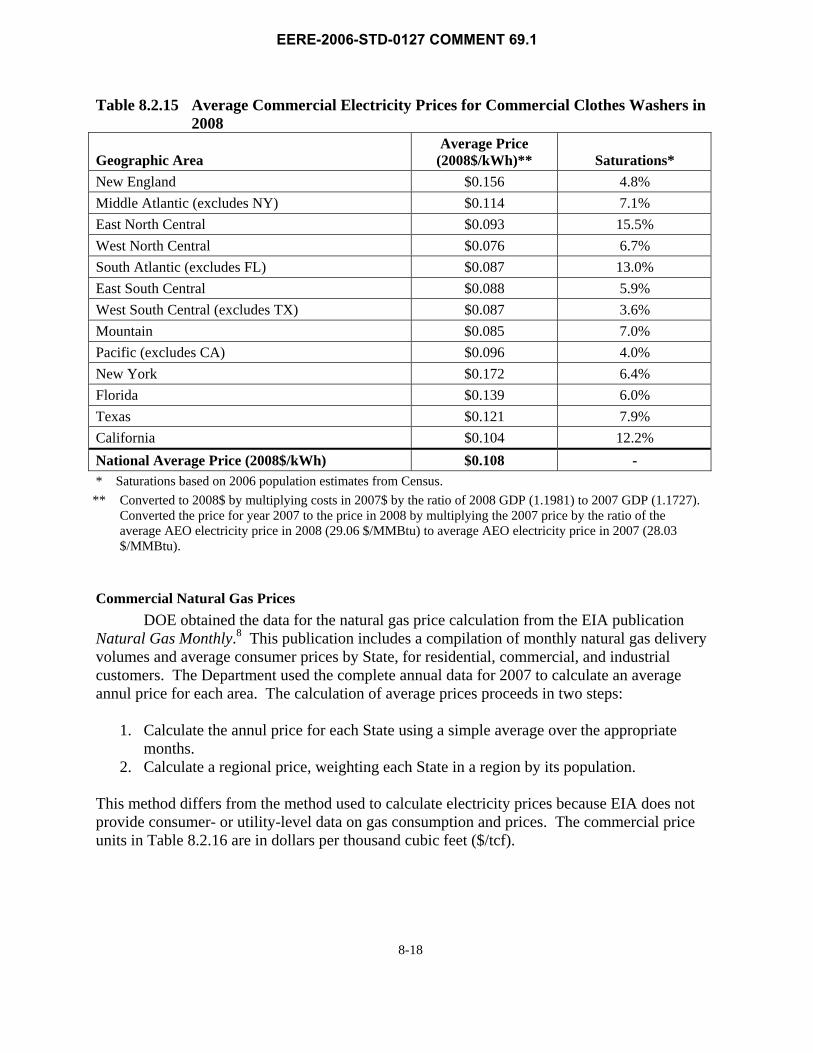
Table 8215 shows the national average commercial electricity prices for commercial clothes washers based on the relative residential consumer weight of each geographic area DOE used 2006 population estimates from the US Census as a proxy to estimate how the national saturation of commercial clothes washers was distributed over the 13 geographic areas7
Because DOE conducted the LCC and PBP analysis in 2008$ all electricity prices are in 2008$ To perform the necessary monetary conversion DOE used the GDP to convert the electricity prices from 2007$ to 2008$
8-17
EERE-2006-STD-0127 COMMENT 691
Table 8215 Average Commercial Electricity Prices for Commercial Clothes Washers in 2008
Geographic Area Average Price
(2008$kWh) Saturations New England $0156 48 Middle Atlantic (excludes NY) $0114 71 East North Central $0093 155 West North Central $0076 67 South Atlantic (excludes FL) $0087 130 East South Central $0088 59 West South Central (excludes TX) $0087 36 Mountain $0085 70 Pacific (excludes CA) $0096 40 New York $0172 64 Florida $0139 60 Texas $0121 79 California $0104 122 National Average Price (2008$kWh) $0108 - Saturations based on 2006 population estimates from Census
Converted to 2008$ by multiplying costs in 2007$ by the ratio of 2008 GDP (11981) to 2007 GDP (11727) Converted the price for year 2007 to the price in 2008 by multiplying the 2007 price by the ratio of the average AEO electricity price in 2008 (2906 $MMBtu) to average AEO electricity price in 2007 (2803 $MMBtu)
Commercial Natural Gas Prices DOE obtained the data for the natural gas price calculation from the EIA publication
Natural Gas Monthly8 This publication includes a compilation of monthly natural gas delivery volumes and average consumer prices by State for residential commercial and industrial customers The Department used the complete annual data for 2007 to calculate an average annul price for each area The calculation of average prices proceeds in two steps
1 Calculate the annul price for each State using a simple average over the appropriate months
2 Calculate a regional price weighting each State in a region by its population
This method differs from the method used to calculate electricity prices because EIA does not provide consumer- or utility-level data on gas consumption and prices The commercial price units in Table 8216 are in dollars per thousand cubic feet ($tcf)
8-18
EERE-2006-STD-0127 COMMENT 691
Table 8216 Average Commercial Natural Gas Prices in 2007 Geographic Area Average Price (2007$tcf) New England $1412 Middle Atlantic (excludes NY) $1249 East North Central $1086 West North Central $1089 South Atlantic (excludes FL) $1294 East South Central $1264 West South Central (excludes TX) $1121 Mountain $1047 Pacific (excludes CA) $1391 New York $1139 Florida $1017 Texas $999 California $1304 Source EIA Natural Gas Monthly
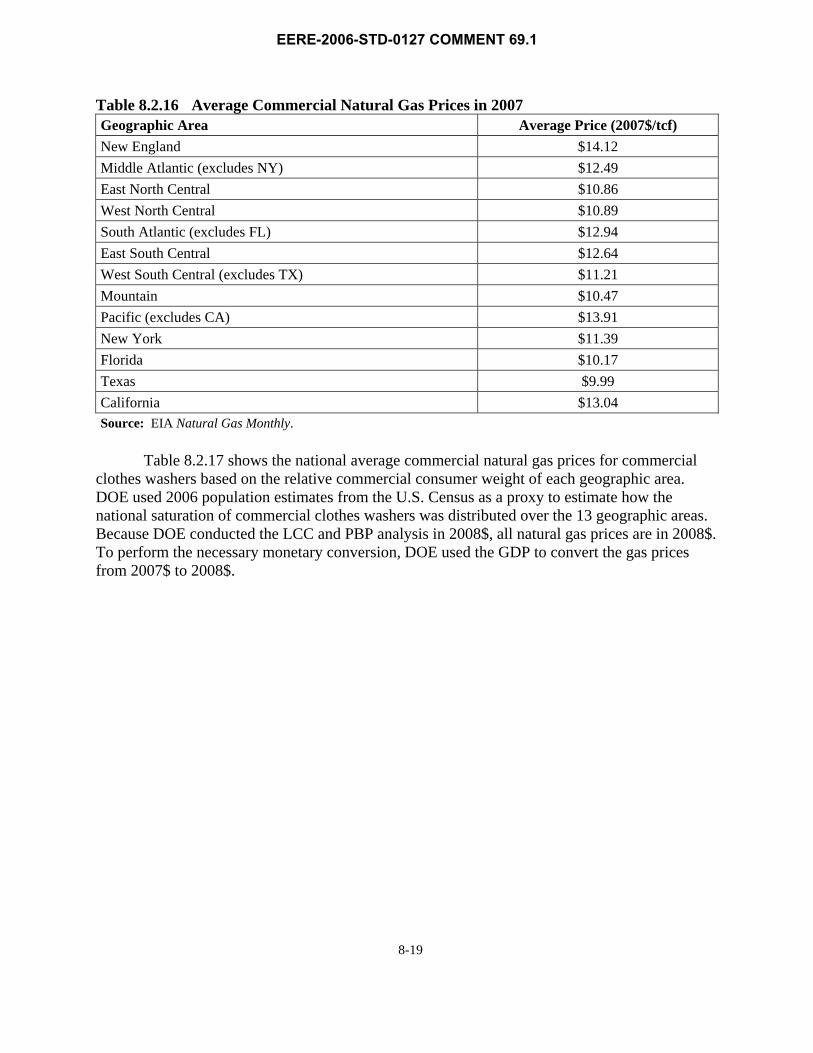
Table 8217 shows the national average commercial natural gas prices for commercial clothes washers based on the relative commercial consumer weight of each geographic area DOE used 2006 population estimates from the US Census as a proxy to estimate how the national saturation of commercial clothes washers was distributed over the 13 geographic areas Because DOE conducted the LCC and PBP analysis in 2008$ all natural gas prices are in 2008$ To perform the necessary monetary conversion DOE used the GDP to convert the gas prices from 2007$ to 2008$
8-19
EERE-2006-STD-0127 COMMENT 691
Table 8217 Average Commercial Natural Gas Prices for Commercial Clothes Washers in 2008
Geographic Area Average Price
(2008$MMBtu) Saturations New England $1443 48 Middle Atlantic (excludes NY) $1277 71 East North Central $1110 155 West North Central $1114 67 South Atlantic (excludes FL) $1323 130 East South Central $1292 59 West South Central (excludes TX) $1146 36 Mountain $1070 70 Pacific (excludes CA) $1422 40 New York $1164 64 Florida $1039 60 Texas $1021 79 California $1333 122 National Average Price (2008$MMBtu) $1189 -
Saturations based on 2005 population estimates from US Census 1 tcf gas = 103 MMBtu Converted to 2008$ by multiplying costs in 2007$ by the ratio of 2008 GDP (11981)
to 2007 GDP (11727) Converted the price for year 2007 to the price in 2008 by multiplying the 2007 price by the ratio of the average AEO gas price in 2008 (1134 $MMBtu) to average AEO gas price in 2007 (1099 $MMBtu)
Water Prices DOE obtained water price data from the year 2006 from the Water and Wastewater Rate
Survey conducted by Raftelis Financial Consultants and the American Water Works Association9 The survey covers approximately 216 water utilities and 153 wastewater utilities with each industry analyzed separately The water survey includes for each utility the cost to consumers of purchasing a given volume of water In this case the data include a division of the total consumer cost into fixed and volumetric charges The calculations use only the volumetric charge to calculate water prices since only this charge would be affected by a change in water consumption Including the fixed charge in the average would lead to a slightly higher water price
The Water and Wastewater Rate Survey provides prices separately for residential and non-residential customers For wastewater utilities the format is similar but the cost refers to the cost of treating a given volume of wastewater In both surveys the non-residential sector is divided into four sub-sectors based on the average monthly volume of water delivered or equivalently the size of the delivery pipe The sub-sectors are named non-manufacturing commercial industrial 1 and industrial 2 DOErsquos analysis uses the commercial category to estimate prices for commercial consumers
8-20
EERE-2006-STD-0127 COMMENT 691
A sample of 216 utilities is not large enough to calculate regional prices for all US Census divisions and large States (for comparison the EIA Form 861 data include more than 3000 utilities) For this reason DOE calculated regional values at the Census region level (Northeast South Midwest and West) The calculation of average per-unit-volume prices proceeds in three steps
1 For each utility calculate the per-unit-volume price by dividing the total volumetric cost by the volume delivered
2 Calculate a State-level average price by weighting each utility in a given State by the number of consumers it serves (either residential or commercial)
3 Calculate a regional average by combining the State-level averages weighting each by the population of that State This third step helps reduce any bias in the sample that may occur due to relative under-sampling of large States
The results of the calculation for the commercial sector are presented in Table 8218 The price units in the table are dollars per thousand gallons ($tg)
Table 8218 Average Per-Unit-Volume Water Prices in 2006 Commercial Region 2005$tg Water 2005$tg Wastewater Northeast $203 $306 Midwest $162 $230 South $200 $227 West $200 $254
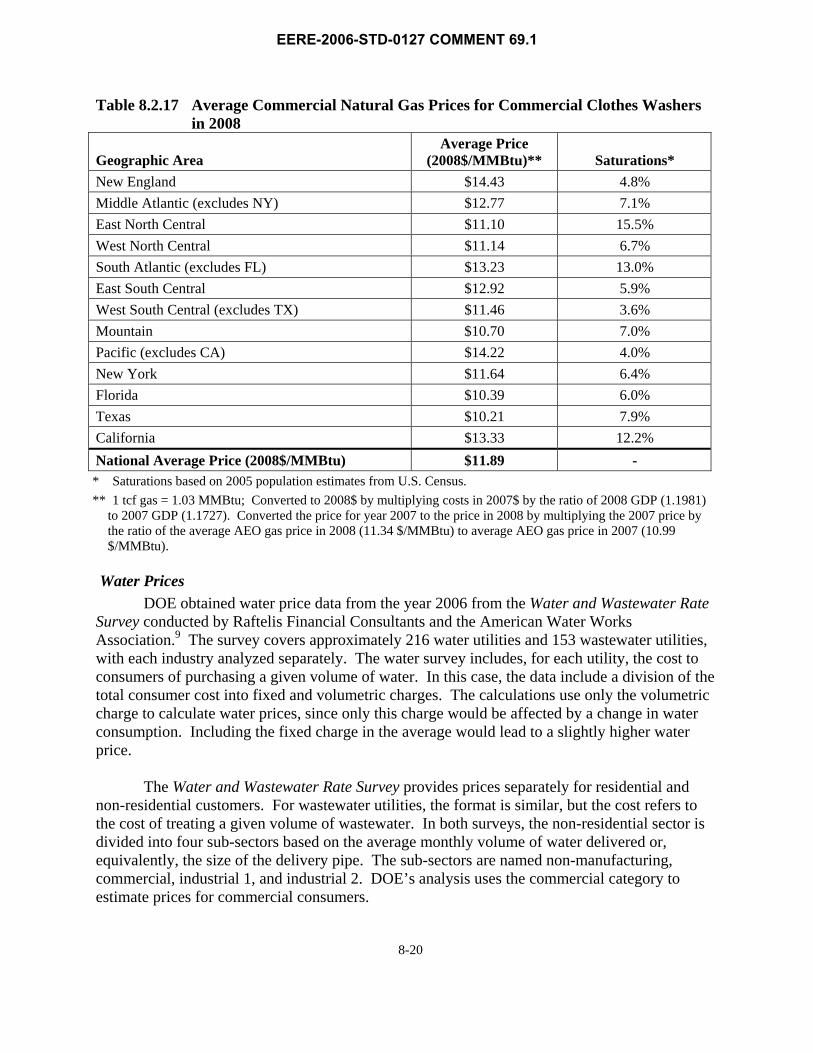
Table 8219 shows the national average commercial water and wastewater prices for commercial clothes washers based on the relative commercial consumer weight of each region DOE used 2006 population estimates from the US Census as a proxy to estimate how the national saturation of commercial clothes washers was distributed over the four regions Because DOE conducted the LCC and PBP analysis in 2008$ it needed to convert all water prices into 2008$ To perform the necessary monetary conversion DOE used the GDP to convert the water and wastewater prices from 2005$ to 2008$
8-21
EERE-2006-STD-0127 COMMENT 691
Table 8219 Average Per-Unit-Volume Water Prices for Commercial Clothes Washers in 2008
Region 2008$tg Water 2008$tg Wastewater Saturations Northeast $242 $365 183 Midwest $193 $275 221 South $239 $271 364 West $239 $303 232 National $229 $297 - Saturations based on 2006 population estimates from Census Converted to 2008$ by multiplying costs in 2005$ by the ratio of 2008 GDP (11981) to 2004 GDP (11193)
Converted the price for year 2006 to the price in 2008 by multiplying the 2006 price by the ratio of the average water CPI in 2008 (33133) to average water CPI in 2006 (29720)
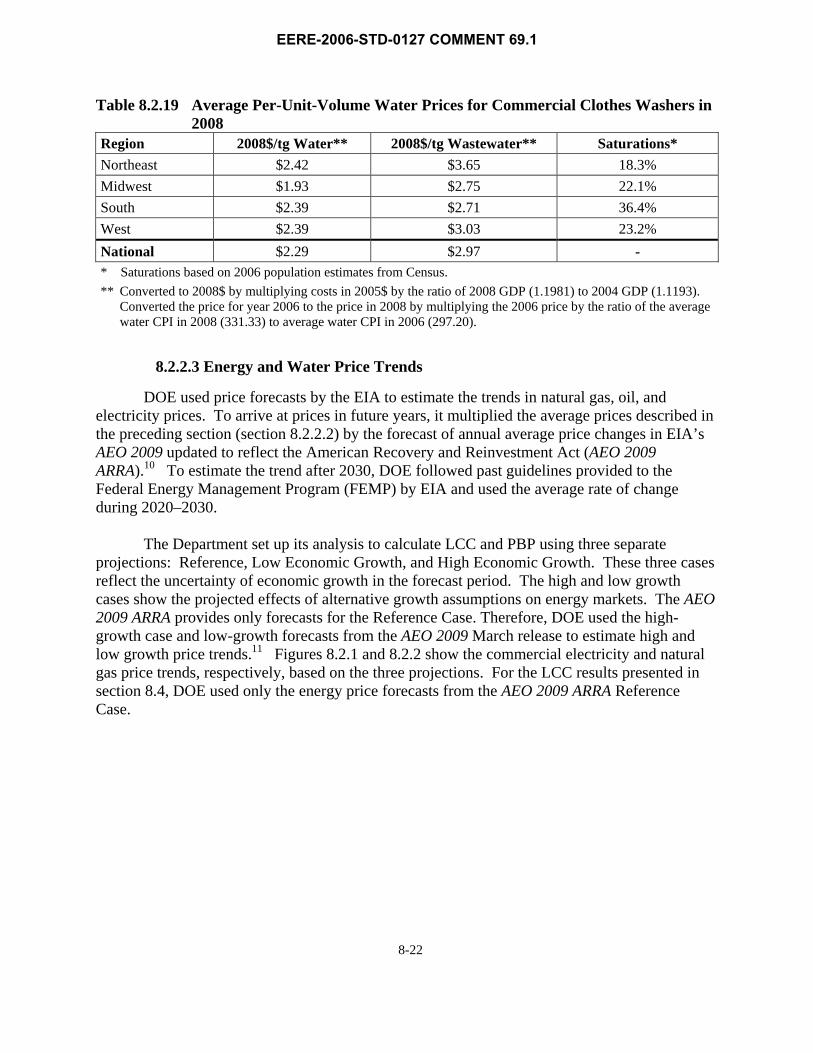
8223 Energy and Water Price Trends
DOE used price forecasts by the EIA to estimate the trends in natural gas oil and electricity prices To arrive at prices in future years it multiplied the average prices described in the preceding section (section 8222) by the forecast of annual average price changes in EIArsquos AEO 2009 updated to reflect the American Recovery and Reinvestment Act (AEO 2009 ARRA)10 To estimate the trend after 2030 DOE followed past guidelines provided to the Federal Energy Management Program (FEMP) by EIA and used the average rate of change during 2020ndash2030
The Department set up its analysis to calculate LCC and PBP using three separate projections Reference Low Economic Growth and High Economic Growth These three cases reflect the uncertainty of economic growth in the forecast period The high and low growth cases show the projected effects of alternative growth assumptions on energy markets The AEO 2009 ARRA provides only forecasts for the Reference Case Therefore DOE used the high-growth case and low-growth forecasts from the AEO 2009 March release to estimate high and low growth price trends11 Figures 821 and 822 show the commercial electricity and natural gas price trends respectively based on the three projections For the LCC results presented in section 84 DOE used only the energy price forecasts from the AEO 2009 ARRA Reference Case
8-22
EERE-2006-STD-0127 COMMENT 691
080
085
090
095
100
105
110
115
120
125
2005 2010 2015 2020 2025 2030 2035 2040 2045
Year
Pric
e Tr
end
(200
8 =
1)
High Grow th Case
Reference Case
Low Grow th Case
Figure 821 Electricity Price Trends
070
080
090
100
110
120
130
140
150
2005 2010 2015 2020 2025 2030 2035 2040 2045
Year
Pric
e Tr
end
(200
8 =
1)
High Grow th Case
Reference Case
Low Grow th Case
Figure 822 Natural Gas Price Trends
8-23
EERE-2006-STD-0127 COMMENT 691
To estimate the future trend for water and wastewater prices DOE used data on the historic trend in the national water price index (US city average) from 1970 through 200812
DOE extrapolated the future trend based on the linear growth from 1970 to 2008 But rather than use the extrapolated trend to forecast the prices for the four years after 2008 DOE pinned the annual price to the value in 2008 Otherwise forecasted prices for this four-year time period would have been up to eight percent lower than the price in 2008 Beyond the four-year time period DOE used the extrapolated trend to forecast prices out to the year 2043 Figure 823 shows the historical and projected water price trend data DOE used the forecasted data to estimate water and wastewater prices for commercial clothes washers
0
100
200
300
400
500
600
1970 1980 1990 2000 2010 2020 2030 2040
Year
Wat
er C
PI
Water Price CPI
Linear Extrapolation
Figure 823 Water Price Trend
8224 Repair and Maintenance Costs
Typically small incremental changes in product efficiency incur no or only very small changes in repair and maintenance costs over baseline products However equipment with efficiencies that are significantly higher than the baseline are more likely to incur higher repair and maintenance costs because its higher complexity and higher part count typically increases the cumulative probability of failure
The Whirlpool Corporation estimates that the unit shipments of horizontal-axis commercial clothes washers are less than half that of vertical-axis machines while their in-warranty repair costs are double that of vertical-axis machines13 This suggests that the repair of
8-24
EERE-2006-STD-0127 COMMENT 691
horizontal-axis machines is four times as costly as that of vertical-axis machines Because in-warranty repair costs based on Whirlpoolrsquos experience are greater for horizontal-axis machines that vertical-axis machines DOE estimated that commercial clothes washer repair costs would increase as a function of equipment efficiency DOE utilized an algorithm developed for central air conditioners and heat pumps to estimate repair cost increases14 This algorithm calculates annualized repair costs by dividing the half the equipment retail price by the equipment lifetime as show in the expression below
05 times EQP=RC ANNUAL LIFE
where
RCANNUAL = Annualized repair cost associated with equipment EQP = Consumer equipment price and LIFE = Product lifetime
Tables 8220 and 8221 show for each product class and each product application (multi-family buildings and laundromats) the annualized repair costs for the commercial clothes washer baseline and efficiency levels Annualized repair costs for each product application differ because commercial clothes washer lifetime is different for each application (Product lifetimes are presented below is section 823) The tables also present the consumer equipment prices for the baseline level and each efficiency level
Average product lifetime Multi-family = 113 years Laundromat = 71 years
8-25
EERE-2006-STD-0127 COMMENT 691
823 Product Lifetime
DOE used only primary sources of data to estimate product lifetimes DOE considered the sources listed in Table 8222 to estimate product lifetime
Table 8222 Commercial Clothes Washers Product Lifetime Estimates and Sources Lifetime (years) Source 7 to 10 CEE (1998) 5
Top-Loading (12 to 14 lbs) 5 to 8 Front-Loading (18 to 50 lbs) 10 to 15 CLA 15
8 to 9 ACEEE (2001) 16
5 (high-use) to 13 (low-use) Southern California Edison (2000) 17
15 dagger CALMAC (2000) 18
Used to establish laundromat lifetime only Used to establish multi-family lifetime only Depending on the usage rate the life can be shorter dagger Based on engineering judgment
Because DOE conducted the LCC analysis based on analyzing two product applicationsmdashmulti-family and laundromatsmdashit established separate lifetimes for each product application Because clothes washers in multi-family applications are used less frequently than in laundromats DOE decided to use only those sources that indicated lifetimes of seven years or greater for multi-family applications For laundromats applications where clothes washers receive heavier use DOE decided to use only those sources that indicated lifetimes of 10 years or less DOE then took an average of the lifetime estimates that met the above criteria For multi-family applications the average lifetime turned out to be 113 years while the average lifetime for laundromats was 71 years DOE used the low estimate for the above applicable sources to establish the minimum product lifetime for each product application For multi-family applications the minimum estimate is 7 years and for laundromats it is 5 years To establish the maximum product lifetime DOE took the difference between the minimum and average values (43 years for multi-family and 21 years for laundromats) and added it to the average product lifetime The minimum average and maximum lifetime estimates for each product application are shown in Table 8223
Table 8223 Commercial Clothes Washers Average Minimum and Maximum Product Lifetimes
Product Minimum
years Average
years Maximum
years Multi-Family Laundromats
70 50
113 71
155 93
8-26
EERE-2006-STD-0127 COMMENT 691
DOE characterized the clothes washer product lifetimes for each product application with Weibull distributions Appendix 8C presents the Weibull distributions for commercial clothes washers that DOE used in the LCC and PBP analysis
824 Discount Rates
DOE derived the discount rates for the LCC and PBP analysis from estimates of the finance cost of purchasing the considered products Following financial theory the finance cost of raising funds to purchase appliances can be interpreted as (1) the financial cost of any debt incurred to purchase equipment or (2) the opportunity cost of any equity used to purchase equipment For the residential products the purchase of equipment for new homes entails different finance costs for consumers than the purchase of replacement equipment Thus DOE used different discount rates for new construction and replacement installations
For commercial clothes washers DOE derived the discount rate from the cost of capital of publicly traded firms in the sectors that purchase commercial clothes washers19 These companies typically finance equipment purchases through debt and equity capital DOE estimated the cost of capital of these firms as the weighted average of the cost of equity financing and the cost of debt financing
The costs of debt and equity financing are usually obtainable from publicly available data about the following types of companies in the sectors that purchase commercial clothes washers
bull personal services (including laundromats) bull educational services (which buy washers for dormitories) bull hotels and bull real estate investment trusts (REITs) (ie building owners including owners of
apartment complexes)
Damodaran Online is a widely used source of information about company debt and equity financing for most types of firms and was the source of data for this analysis on educational services hotels and REITs20 Since Damodaran Online does not include data for firms in the personal services sector (SIC 7200) DOE used data from Ibbotsonrsquos Associates for this sector21 Ibbotson Associates is a leading authority on asset allocation with expertise in capital market expectations and portfolio implementation
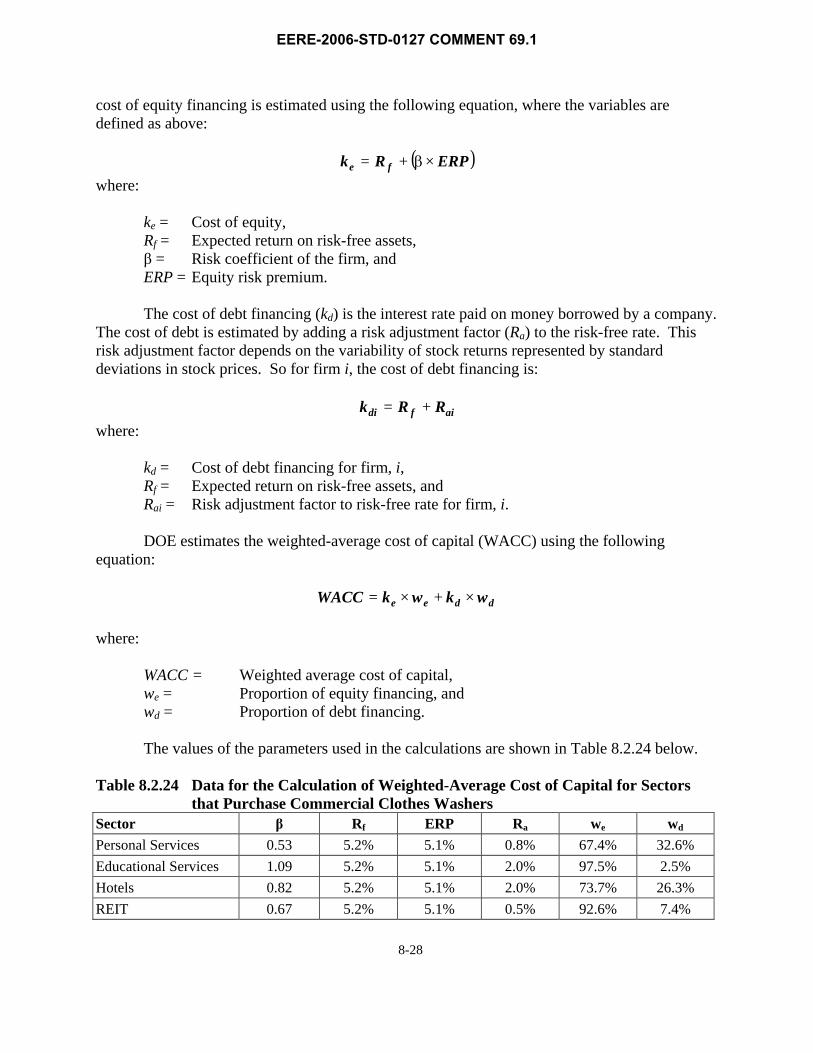
DOE estimated the cost of equity using the capital asset pricing model (CAPM)22 The CAPM assumes that the cost of equity (ke) for a particular company is proportional to the systematic risk faced by that company where high risk is associated with a high cost of equity and low risk is associated with a low cost of equity The systematic risk facing a firm is determined by several variables the risk coefficient of the firm (β) the expected return on risk-free assets (Rf) and the equity risk premium (ERP) The risk coefficient of the firm indicates the risk associated with that firm relative to the price variability in the stock market The expected return on risk-free assets is defined by the yield on long-term government bonds The ERP represents the difference between the expected stock market return and the risk-free rate The
8-27
EERE-2006-STD-0127 COMMENT 691
cost of equity financing is estimated using the following equation where the variables are defined as above
ke = R f + (βtimes ERP) where
ke = Cost of equity Rf = Expected return on risk-free assets β = Risk coefficient of the firm and ERP = Equity risk premium
The cost of debt financing (kd) is the interest rate paid on money borrowed by a company The cost of debt is estimated by adding a risk adjustment factor (Ra) to the risk-free rate This risk adjustment factor depends on the variability of stock returns represented by standard deviations in stock prices So for firm i the cost of debt financing is
k = R + Rdi f ai
where
kd = Cost of debt financing for firm i Rf = Expected return on risk-free assets and Rai = Risk adjustment factor to risk-free rate for firm i
DOE estimates the weighted-average cost of capital (WACC) using the following equation
WACC = k times w + k times we e d d
where
WACC = Weighted average cost of capital we = Proportion of equity financing and wd = Proportion of debt financing
The values of the parameters used in the calculations are shown in Table 8224 below
Table 8224 Data for the Calculation of Weighted-Average Cost of Capital for Sectors that Purchase Commercial Clothes Washers
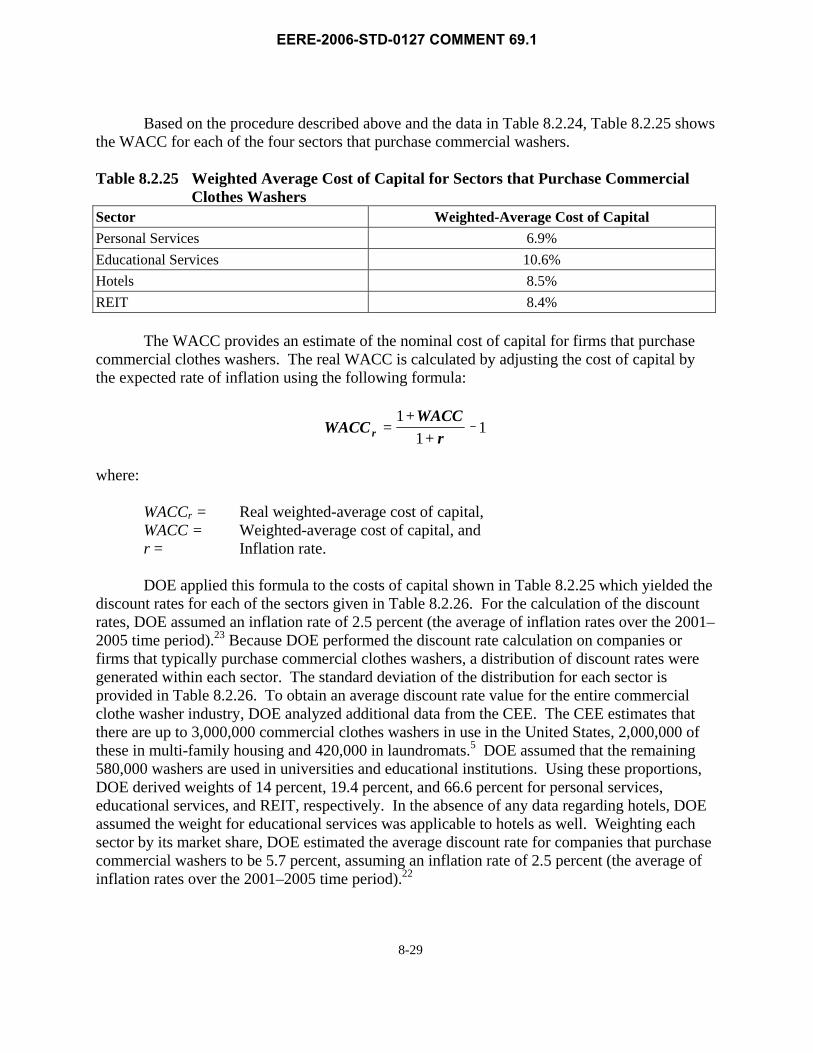
Based on the procedure described above and the data in Table 8224 Table 8225 shows the WACC for each of the four sectors that purchase commercial washers
Table 8225 Weighted Average Cost of Capital for Sectors that Purchase Commercial Clothes Washers
Sector Weighted-Average Cost of Capital Personal Services 69 Educational Services 106 Hotels 85 REIT 84
The WACC provides an estimate of the nominal cost of capital for firms that purchase commercial clothes washers The real WACC is calculated by adjusting the cost of capital by the expected rate of inflation using the following formula
1+WACCWACCr = 1
1+ r_
where
WACCr = Real weighted-average cost of capital WACC = Weighted-average cost of capital and r = Inflation rate
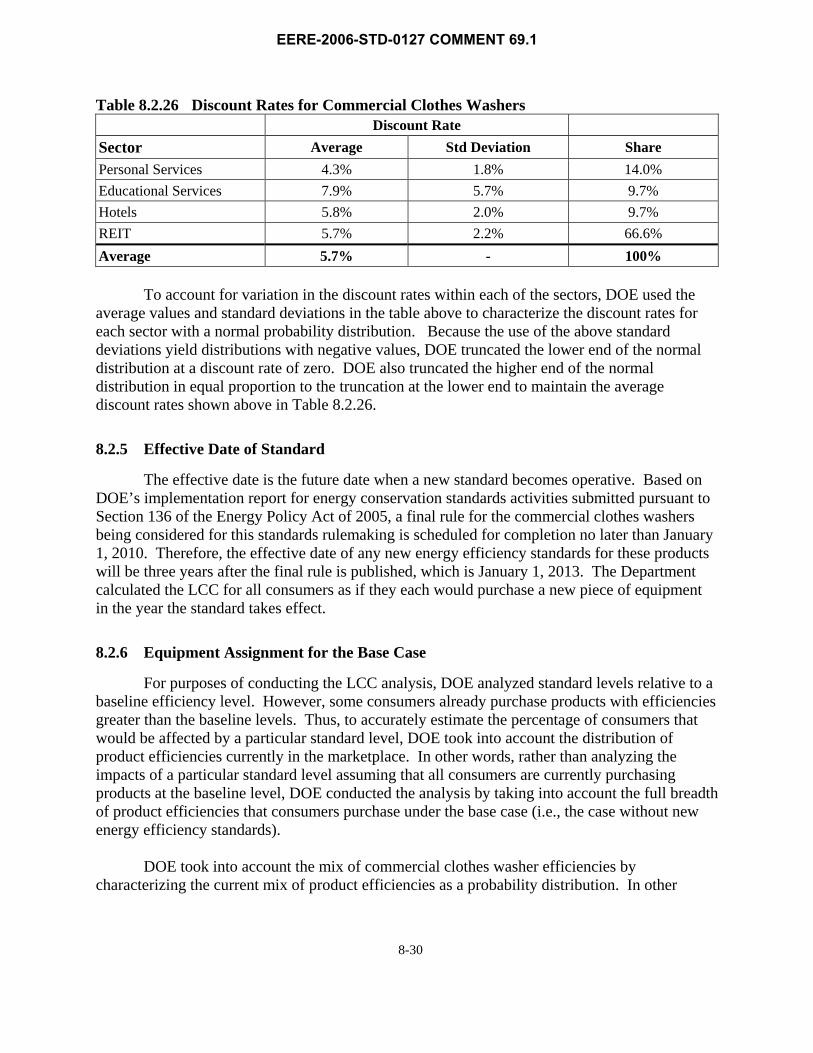
DOE applied this formula to the costs of capital shown in Table 8225 which yielded the discount rates for each of the sectors given in Table 8226 For the calculation of the discount rates DOE assumed an inflation rate of 25 percent (the average of inflation rates over the 2001ndash 2005 time period)23 Because DOE performed the discount rate calculation on companies or firms that typically purchase commercial clothes washers a distribution of discount rates were generated within each sector The standard deviation of the distribution for each sector is provided in Table 8226 To obtain an average discount rate value for the entire commercial clothe washer industry DOE analyzed additional data from the CEE The CEE estimates that there are up to 3000000 commercial clothes washers in use in the United States 2000000 of these in multi-family housing and 420000 in laundromats5 DOE assumed that the remaining 580000 washers are used in universities and educational institutions Using these proportions DOE derived weights of 14 percent 194 percent and 666 percent for personal services educational services and REIT respectively In the absence of any data regarding hotels DOE assumed the weight for educational services was applicable to hotels as well Weighting each sector by its market share DOE estimated the average discount rate for companies that purchase commercial washers to be 57 percent assuming an inflation rate of 25 percent (the average of inflation rates over the 2001ndash2005 time period)22
8-29
EERE-2006-STD-0127 COMMENT 691
Table 8226 Discount Rates for Commercial Clothes Washers Discount Rate Sector Average Std Deviation Share Personal Services 43 18 140 Educational Services 79 57 97 Hotels 58 20 97 REIT 57 22 666 Average 57 - 100
To account for variation in the discount rates within each of the sectors DOE used the average values and standard deviations in the table above to characterize the discount rates for each sector with a normal probability distribution Because the use of the above standard deviations yield distributions with negative values DOE truncated the lower end of the normal distribution at a discount rate of zero DOE also truncated the higher end of the normal distribution in equal proportion to the truncation at the lower end to maintain the average discount rates shown above in Table 8226
825 Effective Date of Standard
The effective date is the future date when a new standard becomes operative Based on DOErsquos implementation report for energy conservation standards activities submitted pursuant to Section 136 of the Energy Policy Act of 2005 a final rule for the commercial clothes washers being considered for this standards rulemaking is scheduled for completion no later than January 1 2010 Therefore the effective date of any new energy efficiency standards for these products will be three years after the final rule is published which is January 1 2013 The Department calculated the LCC for all consumers as if they each would purchase a new piece of equipment in the year the standard takes effect
826 Equipment Assignment for the Base Case
For purposes of conducting the LCC analysis DOE analyzed standard levels relative to a baseline efficiency level However some consumers already purchase products with efficiencies greater than the baseline levels Thus to accurately estimate the percentage of consumers that would be affected by a particular standard level DOE took into account the distribution of product efficiencies currently in the marketplace In other words rather than analyzing the impacts of a particular standard level assuming that all consumers are currently purchasing products at the baseline level DOE conducted the analysis by taking into account the full breadth of product efficiencies that consumers purchase under the base case (ie the case without new energy efficiency standards)
DOE took into account the mix of commercial clothes washer efficiencies by characterizing the current mix of product efficiencies as a probability distribution In other
8-30
EERE-2006-STD-0127 COMMENT 691
words as DOE performed the Monte Carlo simulation each standard level analyzed was evaluated against the distribution of product efficiencies in the base case
Rather than providing market share data AHAM provided shipment-weighted efficiencies of all commercial clothes washers24 That is shipment-weighted efficiencies were not provided separately for the top-loading and front-loading product classes For the year 2005 the shipment-weighted efficiencies of commercial clothes washers are 141 modified energy factor (MEF) and 1091 water factor (WF) Based on the shipment-weighted efficiency data DOE was able to derive the market share of each product class DOE assumed a bi-modal market share distribution consisting of only top-loading equipment meeting current minimum efficiency standards of 126 MEF95 WF and top-loading equipment with an efficiency of 200 MEF55 WF Thus by using a shipment-weighted efficiency of 141 MEF DOE determined that the market share of 126 MEF95 WF washers is 797 percent and the market share of 200 MEF55 WF washers is 203 percenta DOE interprets this result as indicating that in the year 2005 797 percent of the market consists of top-loading washers while 203 percent is comprised of front-loading washers
Subsequent to 2005 energy efficiency tax incentives in the Energy Policy Act of 2005 and extensions as well as new provisions in the Economic Stabilization Act of 2008 have resulted in more front-loading washers being produced by manufacturers DOE reviewed the US Securities and Exchange Commission (SEC) 10K report of the low volume manufacturer (LVM) of commercial clothes washers and determined that manufacturer tax credits in this recent federal legislation have resulted in significantly increased sales of the front-loading washers for the LVM When accounting for the LVMrsquos market share the increase in front-loading sales results in a current market share of 30 percent for front-loading washers Although tax credits are set to expire after 2010 DOE estimates that the tax credits would permanently transform the market so that front-loading washers would continue to comprise 30 percent of the market over the entire forecast period
Knowing the market share of each product class does not provide the distribution of equipment efficiencies within each class Therefore DOE relied on anther data sourcemdashthe California Energy Commission (CEC)25 As discussed in Section 3143 of Chapter 3 Market and Technology Assessment the CEC publishes the MEFs and WFs of commercial clothes washers sold in California Although the range in efficiencies is relatively wide the distribution is based on the number of available models being sold rather than the percent of shipments being sold Without any other data available DOE assumed that the distribution of available models in the CEC data were representative of actual shipments sold in the US Tables 8227 and 8228 present the market shares of the efficiency levels in the base case for top-loading and front-loading washers respectively The tables represent the equipment that establishments would have purchased in the year 2013 in the absence of new standards
a DOE did not consider the shipment-weighted average WF of 1091 in performing the market share calculation
8-31
EERE-2006-STD-0127 COMMENT 691
Table 8227 Top-Loading Commercial Clothes Washers Base Case Market Shares Standard Level MEF WF Market Share
Baseline 126 950 648 1 142 950 338 2 160 850 14
Represents units with the following MEF and WF ratings 126 le MEF lt 142 95 ge WF gt 85 Represents units with the following MEF and WF ratings 142 le MEF lt 160 95 ge WF gt 85 Represents units with the following MEF and WF ratings MEF ge 160 WF le 85
Table 8228 Front-Loading Commercial Clothes Washers Base Case Market Shares Standard Level MEF WF Market Share
Represents units with the following MEF and WF ratings 172 le MEF lt 180 80 ge WF gt 75 Represents units with the following MEF and WF ratings 180 le MEF lt 200 75 ge WF gt 55 Represents units with the following MEF and WF ratings 200 le MEF lt 220 55 ge WF gt 51 dagger Represents units with the following MEF and WF ratings 220 le MEF lt 235 51 ge WF gt 44 daggerdagger Represents units with the following MEF and WF ratings MEF ge 235 WF le 44
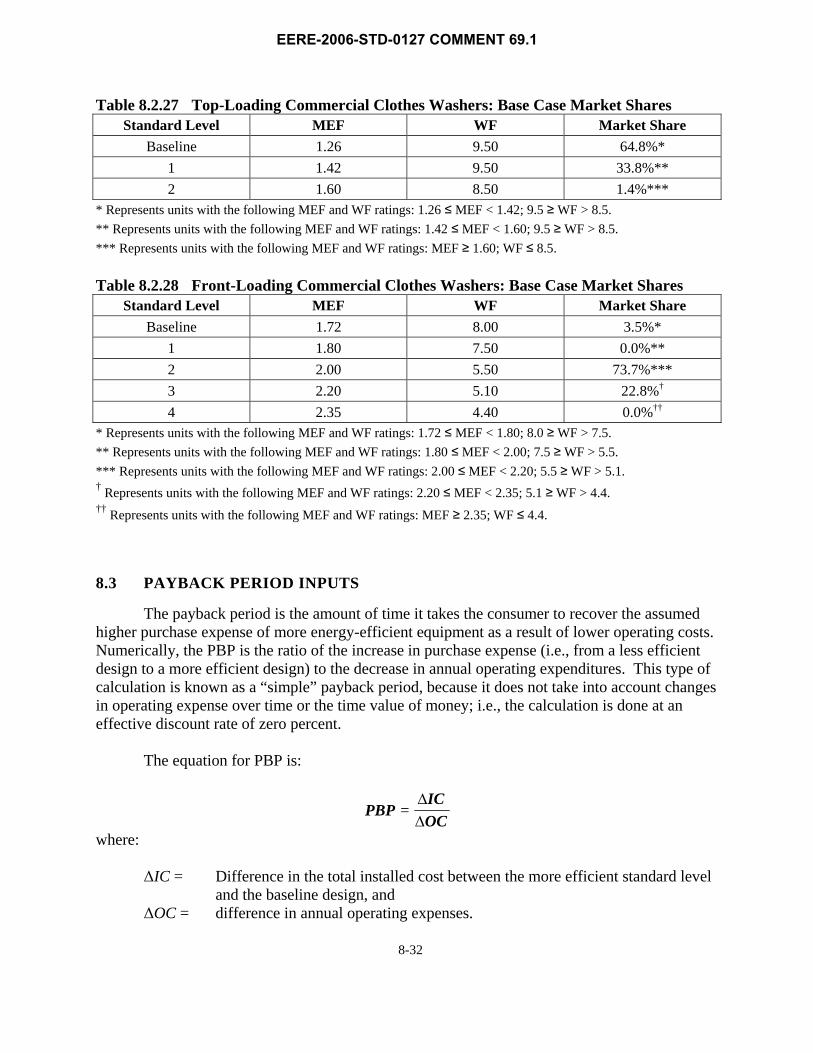
83 PAYBACK PERIOD INPUTS
The payback period is the amount of time it takes the consumer to recover the assumed higher purchase expense of more energy-efficient equipment as a result of lower operating costs Numerically the PBP is the ratio of the increase in purchase expense (ie from a less efficient design to a more efficient design) to the decrease in annual operating expenditures This type of calculation is known as a ldquosimplerdquo payback period because it does not take into account changes in operating expense over time or the time value of money ie the calculation is done at an effective discount rate of zero percent
The equation for PBP is
ΔICPBP =
ΔOC where
ΔIC = Difference in the total installed cost between the more efficient standard level and the baseline design and
ΔOC = difference in annual operating expenses
8-32
EERE-2006-STD-0127 COMMENT 691
Payback periods are expressed in years Payback periods greater than the life of the product mean that the increased total installed cost is not recovered in reduced operating expenses
The data inputs to PBP are the total installed cost of the equipment to the consumer for each efficiency level and the annual (first year) operating expenditures for each standard level The inputs to the total installed cost are the equipment price and the installation cost The inputs to the operating costs are the annual energy (and water) cost the annual repair cost and the annual maintenance cost The PBP uses the same inputs as the LCC analysis as described in section 82 except that energy (and water) price trends and discount rates are not required Since the PBP is a ldquosimplerdquo payback the required energy price is only for the year in which a new standard is to take effectmdashin this case the year 2013 The energy price DOE used in the PBP calculation was the price projected for that year Discount rates are also not required for the simple PBP calculation
84 LIFE-CYCLE COST AND PAYBACK PERIOD RESULTS
This section presents the LCC and PBP results for commercial clothes washers DOErsquos approach for conducting the LCC analysis relied on characterizing the uncertainty and variability of many of the inputs to the analysis with probability distributions DOE used a Monte Carlo simulation technique to perform the LCC calculations DOE calculated the average LCC and LCC savings and the median and average PBP for each of the candidate standard levels These standard levels are also referred to as candidate standard levels (CSL)
DOE calculated LCC savings and PBPs relative to the base case equipment that it assigned to commercial consumers As discussed in section 826 DOE assigned base case equipment that is more efficient than some of the CSLs For that reason the average LCC impacts are not equal to the difference between the LCC of a specific and the LCC of the baseline equipment
In the subsections below DOE presents figures showing the distribution of LCCs in the base case for each product class Also presented below for a specific are figures showing the distribution of LCC impacts and the distribution of PBPs The figures are presented as frequency charts that show the distribution of LCCs LCC impacts and PBPs with their corresponding probability of occurrence DOE generated the figures for the distributions from a Monte Carlo simulation run based on 10000 samples The LCC and PBP calculations were performed 10000 times by sampling from the probability distributions that DOE developed to characterize many of the inputs
Based on the Monte Carlo simulations that DOE performed for each standard-level DOE calculated the share of commercial consumers with a net LCC benefit with a net LCC cost and with no impact DOE considered a commercial user to receive no impact at a given if DOE assigned it base case equipment that is the same as or has higher efficiency than the CSL To
8-33
EERE-2006-STD-0127 COMMENT 691
illustrate the range of LCC and PBP impacts among the commercial clothes washer users the sections below present figures that provide such information for each product class
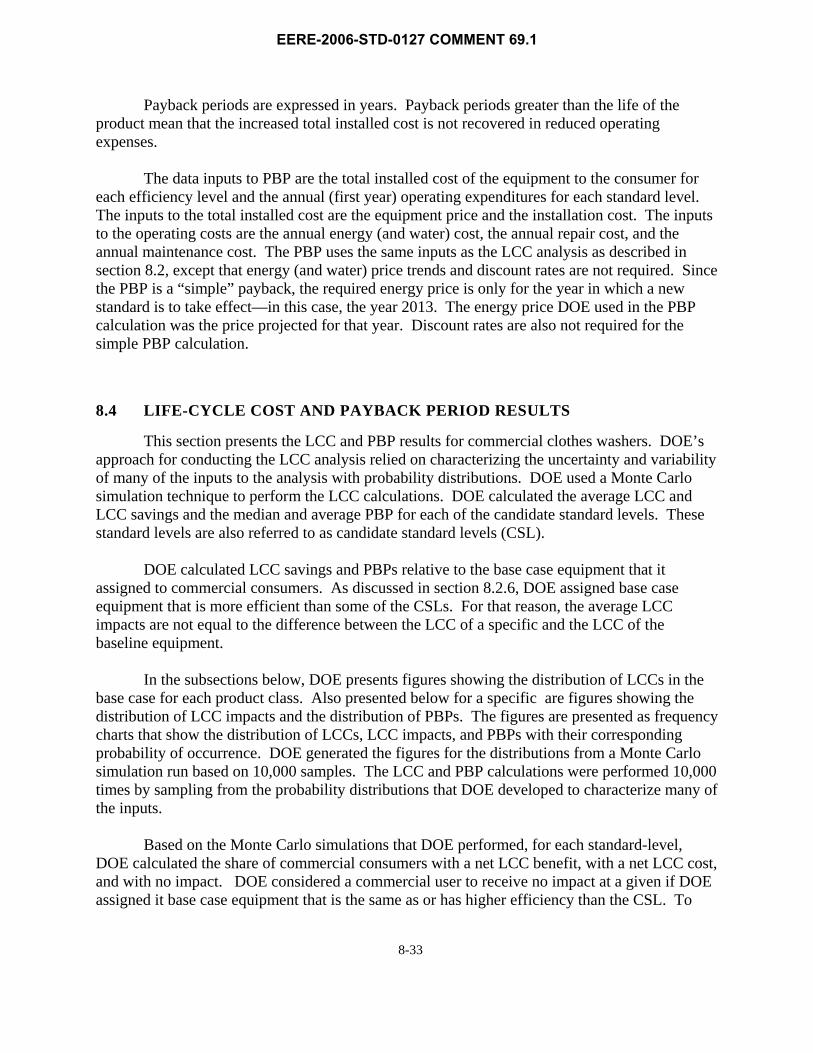
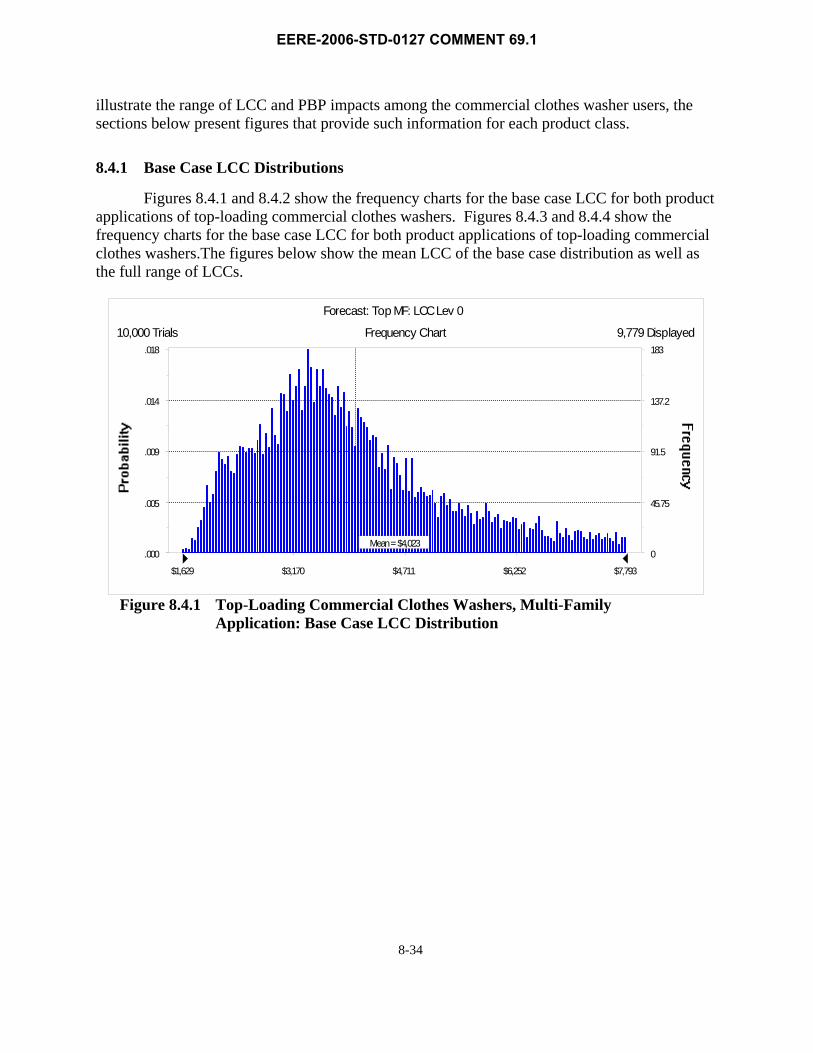
841 Base Case LCC Distributions
Figures 841 and 842 show the frequency charts for the base case LCC for both product applications of top-loading commercial clothes washers Figures 843 and 844 show the frequency charts for the base case LCC for both product applications of top-loading commercial clothes washersThe figures below show the mean LCC of the base case distribution as well as the full range of LCCs
Frequency Chart
Mean= $4023 000
005
009
014
018
0
4575
915
1372
183
$1629 $3170 $4711 $6252 $7793
10000 Trials 9779 Displayed
Forecast Top MF LCC Lev 0
Figure 841 Top-Loading Commercial Clothes Washers Multi-Family Application Base Case LCC Distribution
8-34
EERE-2006-STD-0127 COMMENT 691
Frequency Chart
Mean= $4182 000
004
008
012
016
0
405
81
1215
162
$2139 $3160 $4182 $5203 $6225
10000 Trials 9910 Displayed
Forecast Top Laun LCC Lev 0
Figure 842 Top-Loading Commercial Clothes Washers Laundromat Application Base Case LCC Distribution
Frequency Chart
Mean= $4220 000
004
008
013
017
0
4225
845
1267
169
$2218 $3481 $4743 $6005 $7267
10000 Trials 9777 Displayed
Forecast Front MF LCC Lev 0
Figure 843 Front-Loading Commercial Clothes Washers Multi-Family Application Base Case LCC Distribution
8-35
EERE-2006-STD-0127 COMMENT 691
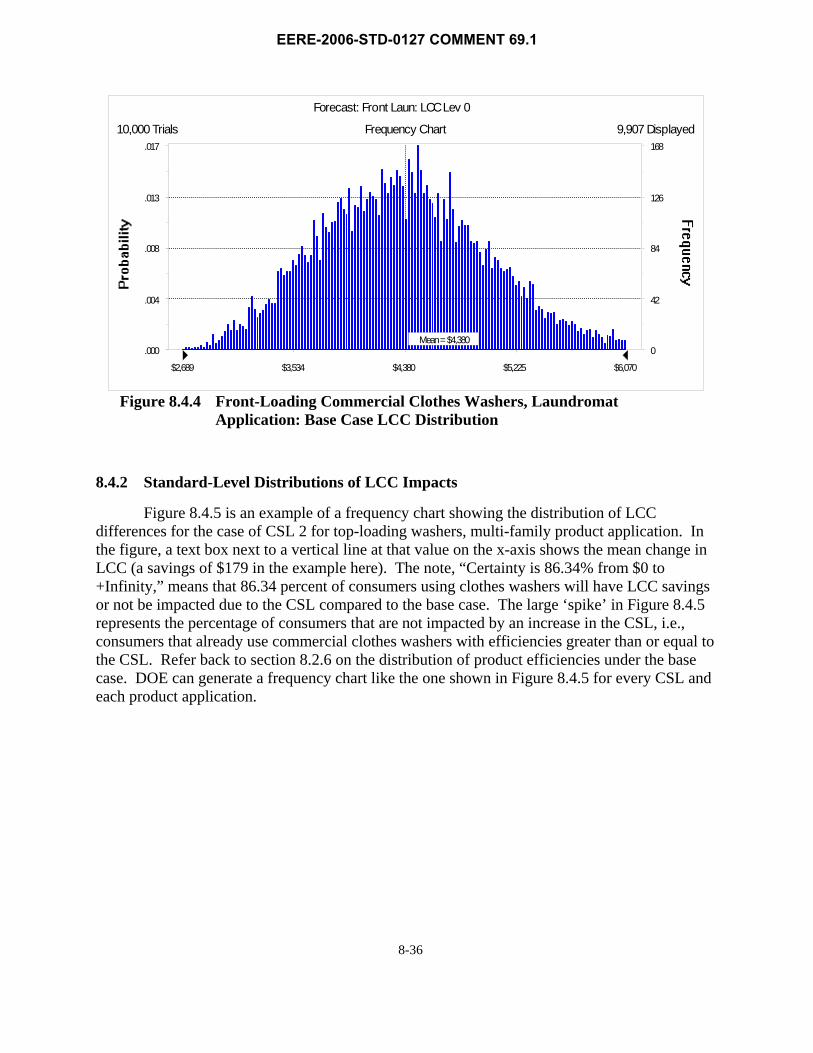
Frequency Chart
Mean= $4380 000
004
008
013
017
0
42
84
126
168
$2689 $3534 $4380 $5225 $6070
10000 Trials 9907 Displayed
Forecast Front Laun LCC Lev 0
Figure 844 Front-Loading Commercial Clothes Washers Laundromat Application Base Case LCC Distribution
842 Standard-Level Distributions of LCC Impacts
Figure 845 is an example of a frequency chart showing the distribution of LCC differences for the case of CSL 2 for top-loading washers multi-family product application In the figure a text box next to a vertical line at that value on the x-axis shows the mean change in LCC (a savings of $179 in the example here) The note ldquoCertainty is 8634 from $0 to +Infinityrdquo means that 8634 percent of consumers using clothes washers will have LCC savings or not be impacted due to the CSL compared to the base case The large lsquospikersquo in Figure 845 represents the percentage of consumers that are not impacted by an increase in the CSL ie consumers that already use commercial clothes washers with efficiencies greater than or equal to the CSL Refer back to section 826 on the distribution of product efficiencies under the base case DOE can generate a frequency chart like the one shown in Figure 845 for every CSL and each product application
8-36
EERE-2006-STD-0127 COMMENT 691
Frequency Chart
Certainty is 8634 from $0 to +Infinity
Mean = $179 000
006
012
018
024
0
5875
1175
1762
235
($146) $61 $268 $474 $681
10000 Trials 9750 Displayed
Forecast To p MF LCC Sav Lev 2
Figure 845 Top-Loading Commercial Clothes Washers Multi-Family Application Distribution of LCC Impacts for CSL 2
843 Standard-Level PBP Distributions
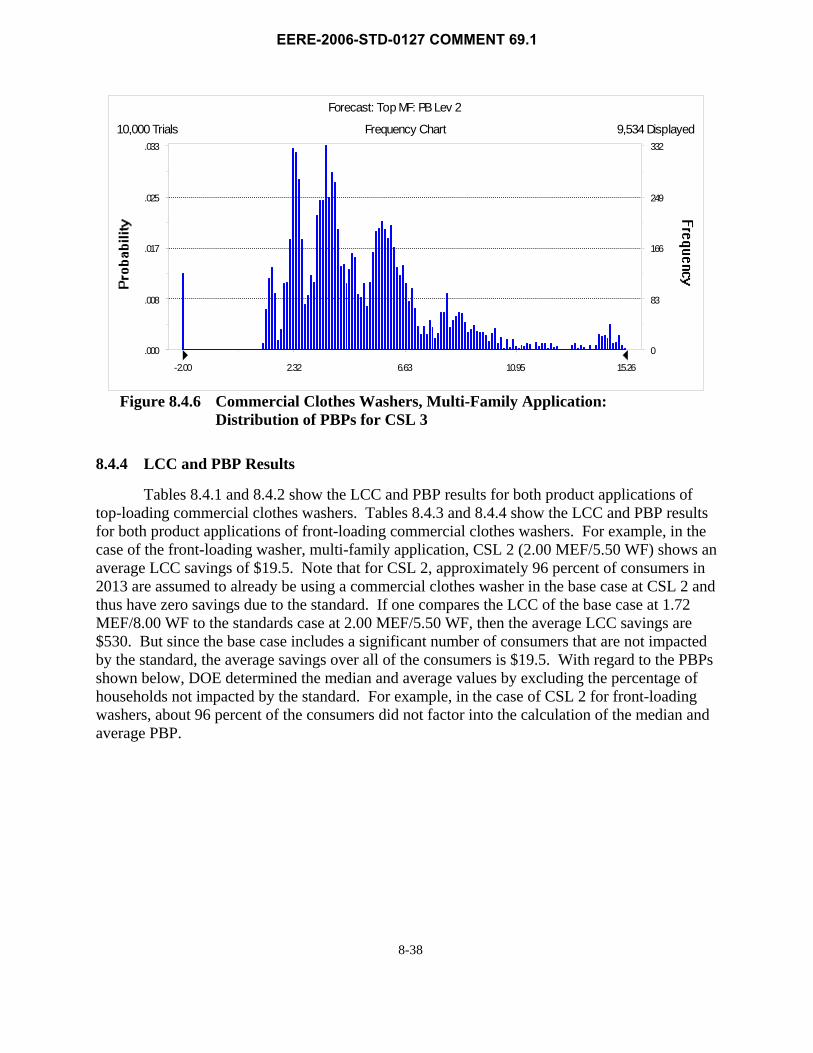
Figure 846 is an example of a frequency chart showing the distribution of payback periods of CSL 2 for top-loading washer multi-family product application The large lsquospikersquo at the PBP value of -200 indicates the percentage of consumers using commercial clothes washers that are not impacted by an increase in the CSL ie consumers that already use top-loading commercial clothes washers with efficiencies equal to or greater than then CSL Refer back to section 826 on the distribution of product efficiencies under the base case DOE can generate a frequency chart like the one shown in Figure 846 for every CSL and each product application
8-37
EERE-2006-STD-0127 COMMENT 691
Frequency Chart
000
008
017
025
033
0
83
166
249
332
-200 232 663 1095 1526
10000 Trials 9534 Displayed
Forecast Top MF PB Lev 2
Figure 846 Commercial Clothes Washers Multi-Family Application Distribution of PBPs for CSL 3
844 LCC and PBP Results
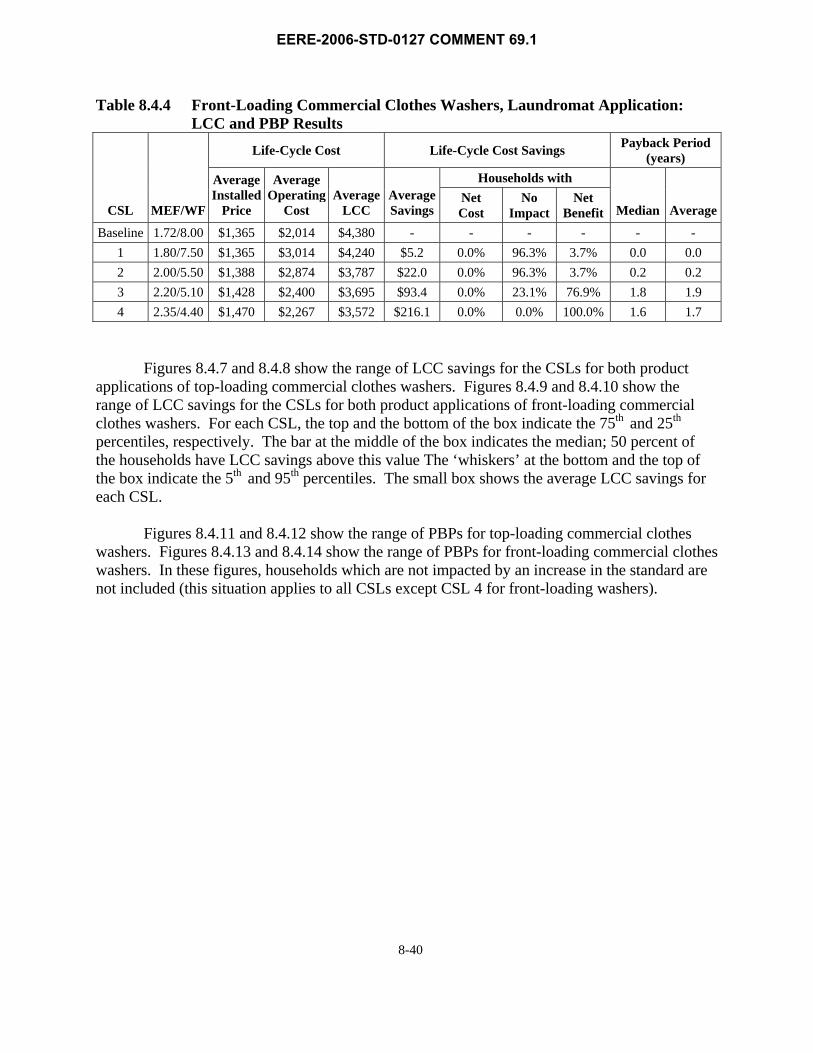
Tables 841 and 842 show the LCC and PBP results for both product applications of top-loading commercial clothes washers Tables 843 and 844 show the LCC and PBP results for both product applications of front-loading commercial clothes washers For example in the case of the front-loading washer multi-family application CSL 2 (200 MEF550 WF) shows an average LCC savings of $195 Note that for CSL 2 approximately 96 percent of consumers in 2013 are assumed to already be using a commercial clothes washer in the base case at CSL 2 and thus have zero savings due to the standard If one compares the LCC of the base case at 172 MEF800 WF to the standards case at 200 MEF550 WF then the average LCC savings are $530 But since the base case includes a significant number of consumers that are not impacted by the standard the average savings over all of the consumers is $195 With regard to the PBPs shown below DOE determined the median and average values by excluding the percentage of households not impacted by the standard For example in the case of CSL 2 for front-loading washers about 96 percent of the consumers did not factor into the calculation of the median and average PBP
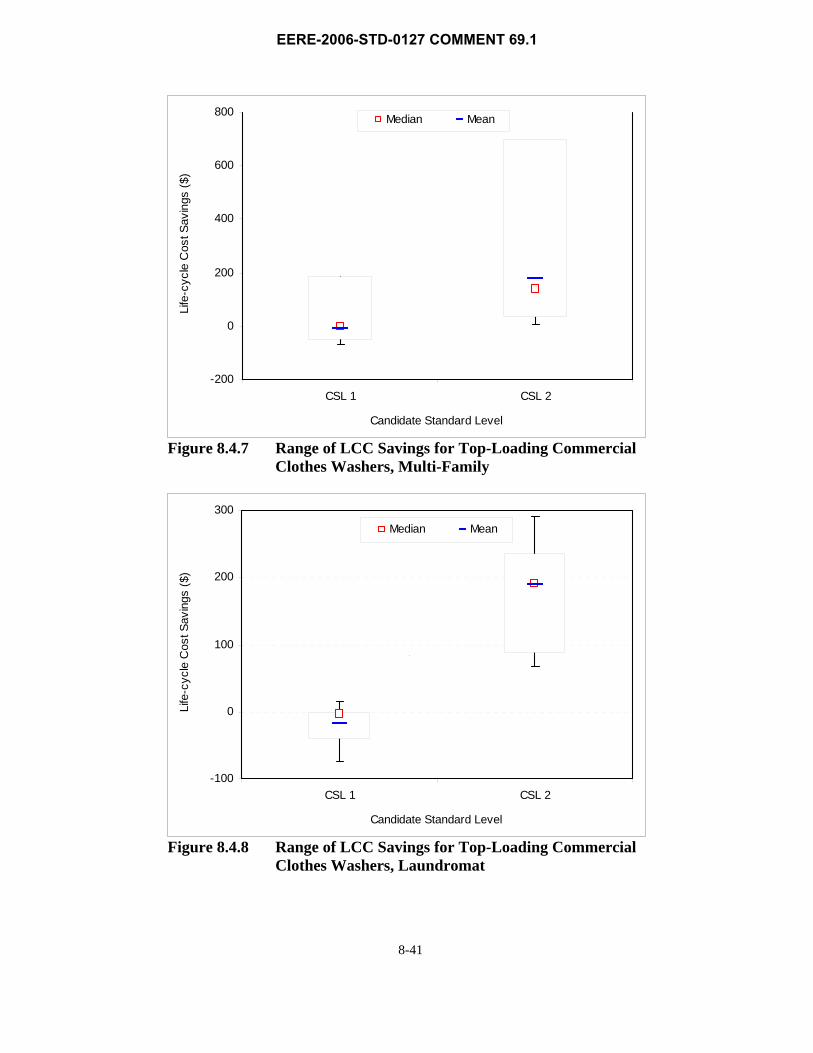
Figures 847 and 848 show the range of LCC savings for the CSLs for both product applications of top-loading commercial clothes washers Figures 849 and 8410 show the range of LCC savings for the CSLs for both product applications of front-loading commercial clothes washers For each CSL the top and the bottom of the box indicate the 75th and 25th
percentiles respectively The bar at the middle of the box indicates the median 50 percent of the households have LCC savings above this value The lsquowhiskersrsquo at the bottom and the top of the box indicate the 5th and 95th percentiles The small box shows the average LCC savings for each CSL
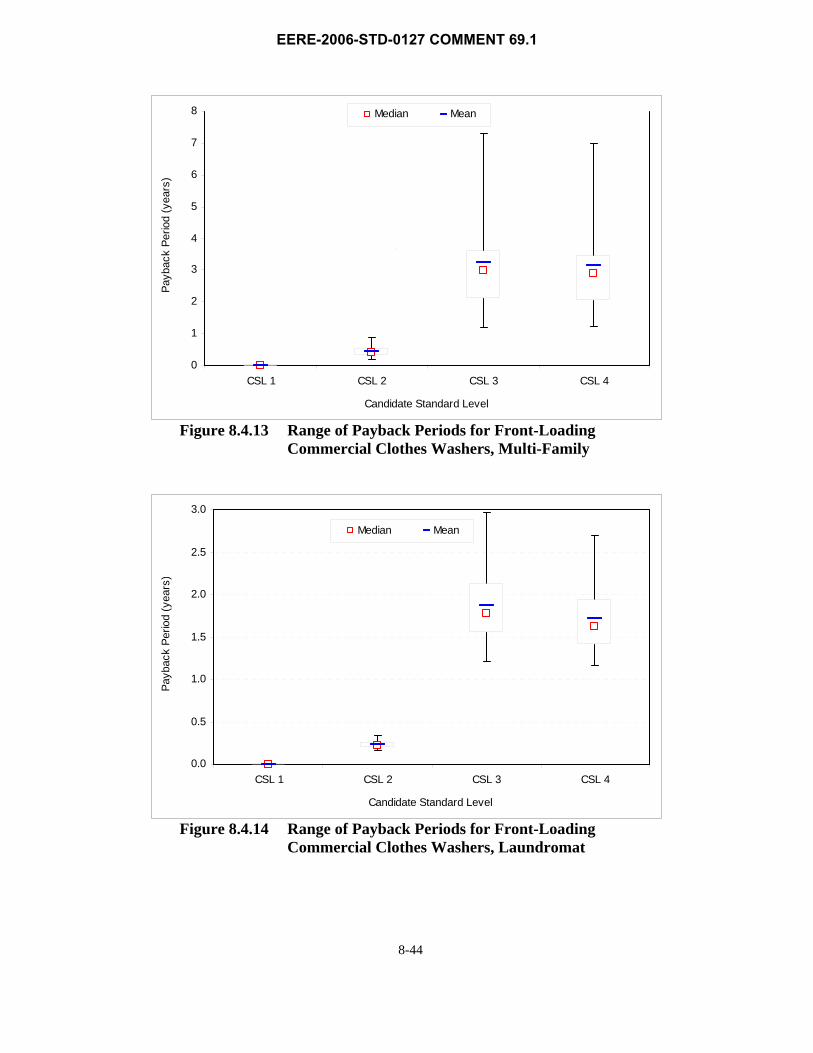
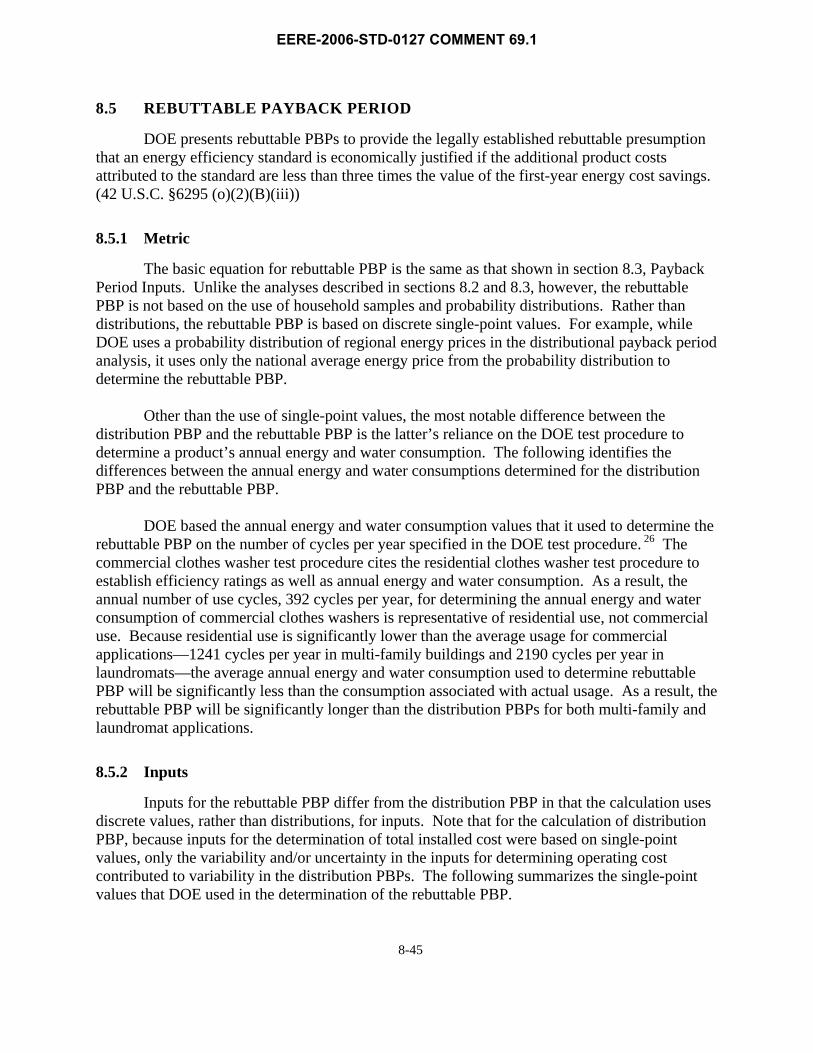
Figures 8411 and 8412 show the range of PBPs for top-loading commercial clothes washers Figures 8413 and 8414 show the range of PBPs for front-loading commercial clothes washers In these figures households which are not impacted by an increase in the standard are not included (this situation applies to all CSLs except CSL 4 for front-loading washers)
8-40
EERE-2006-STD-0127 COMMENT 691
Life
-cyc
le C
ost S
avin
gs ($
)
800
600
400
200
0
-200
Median
Mean
CSL 1 CSL 2
Candidate Standard Level
Figure 847 Range of LCC Savings for Top-Loading Commercial Clothes Washers Multi-Family
300
Life
-cyc
le C
ost S
avin
gs ($
) 200
100
0
-100
Median Mean
CSL 1 CSL 2
Candidate Standard Level
Figure 848 Range of LCC Savings for Top-Loading Commercial Clothes Washers Laundromat
8-41
EERE-2006-STD-0127 COMMENT 691
0
100
200
300
400
500
600
Life
-cyc
le C
ost S
avin
gs ($
)
Median Mean
CSL 1 CSL 2 CSL 3 CSL 4
Candidate Standard Level
Figure 849 Range of LCC Savings for Front-Loading Commercial Clothes Washers Multi-Family
250
Life
-cyc
le C
ost S
avin
gs ($
)
200
150
100
50
0
Median Mean
CSL 1 CSL 2 CSL 3 CSL 4
Candidate Standard Level
Figure 8410 Range of LCC Savings for Front-Loading Commercial Clothes Washers Laundromat
8-42
EERE-2006-STD-0127 COMMENT 691
60
Payb
ack
Perio
d (y
ears
) Pa
ybac
k Pe
riod
(yea
rs)
50
40
30
20
10
0
Figure 8411 Range of Payback Periods for Top-Loading Commercial Clothes Washers Multi-Family
20
Median Mean
CSL 1 CSL 2
Candidate Standard Level
Median Mean
CSL 1 CSL 2
Candidate Standard Level
15
10
5
0
Figure 8412 Range of Payback Periods for Top-Loading Commercial Clothes Washers Laundromat
8-43
EERE-2006-STD-0127 COMMENT 691
0
1
2
3
4
5
6
7
8
CSL 1 CSL 2 CSL 3 CSL 4
Candidate Standard Level
Payb
ack
Perio
d (y
ears
)
Median Mean
Figure 8413 Range of Payback Periods for Front-Loading Commercial Clothes Washers Multi-Family
00
05
10
15
20
25
30
CSL 1 CSL 2 CSL 3 CSL 4
Candidate Standard Level
Payb
ack
Perio
d (y
ears
)
Median Mean
Figure 8414 Range of Payback Periods for Front-Loading Commercial Clothes Washers Laundromat
8-44
EERE-2006-STD-0127 COMMENT 691
85 REBUTTABLE PAYBACK PERIOD
DOE presents rebuttable PBPs to provide the legally established rebuttable presumption that an energy efficiency standard is economically justified if the additional product costs attributed to the standard are less than three times the value of the first-year energy cost savings (42 USC sect6295 (o)(2)(B)(iii))
851 Metric
The basic equation for rebuttable PBP is the same as that shown in section 83 Payback Period Inputs Unlike the analyses described in sections 82 and 83 however the rebuttable PBP is not based on the use of household samples and probability distributions Rather than distributions the rebuttable PBP is based on discrete single-point values For example while DOE uses a probability distribution of regional energy prices in the distributional payback period analysis it uses only the national average energy price from the probability distribution to determine the rebuttable PBP
Other than the use of single-point values the most notable difference between the distribution PBP and the rebuttable PBP is the latterrsquos reliance on the DOE test procedure to determine a productrsquos annual energy and water consumption The following identifies the differences between the annual energy and water consumptions determined for the distribution PBP and the rebuttable PBP
DOE based the annual energy and water consumption values that it used to determine the rebuttable PBP on the number of cycles per year specified in the DOE test procedure 26 The commercial clothes washer test procedure cites the residential clothes washer test procedure to establish efficiency ratings as well as annual energy and water consumption As a result the annual number of use cycles 392 cycles per year for determining the annual energy and water consumption of commercial clothes washers is representative of residential use not commercial use Because residential use is significantly lower than the average usage for commercial applicationsmdash1241 cycles per year in multi-family buildings and 2190 cycles per year in laundromatsmdashthe average annual energy and water consumption used to determine rebuttable PBP will be significantly less than the consumption associated with actual usage As a result the rebuttable PBP will be significantly longer than the distribution PBPs for both multi-family and laundromat applications
852 Inputs
Inputs for the rebuttable PBP differ from the distribution PBP in that the calculation uses discrete values rather than distributions for inputs Note that for the calculation of distribution PBP because inputs for the determination of total installed cost were based on single-point values only the variability andor uncertainty in the inputs for determining operating cost contributed to variability in the distribution PBPs The following summarizes the single-point values that DOE used in the determination of the rebuttable PBP
8-45
EERE-2006-STD-0127 COMMENT 691
bull Manufacturing costs markups sales taxes and installation costs were all based on the single-point values used in the distributional LCC and PBP analysis
bull As described in section 851 annual energy and water consumption is based on the DOE test procedure
bull Energy and water prices are based on national average values for the year that new standards are assumed to take effect
bull An average discount rate or lifetime is not required in the rebuttable PBP calculation
bull The effective date of the standard is assumed to be 2013
853 Results
DOE calculated rebuttable PBPs for each CSL relative to the distribution of product efficiencies assumed for the base case (refer back to section 826 for more details on the base case efficiency distributions for each product) In other words DOE did not determine the rebuttable PBP relative to the baseline efficiency level but relative to the current distribution of product efficiencies DOE determined for the base case (ie the case without new standards) The following sections present the results for the sets of products being analyzed for this standards rulemaking
Tables 851 and 852 present the rebuttable PBPs for top-loading commercial clothes washers under both product applications multi-family buildings and laundromats Tables 853 and 854 present the rebuttable PBPs for front-loading commercial clothes washers under both product applications multi-family buildings and laundromats
1 US Department of Energy-Office of Energy Efficiency and Renewable Energy Energy Conservation Standards for Certain Consumer Products (Dishwashers Dehumidifiers Microwave Ovens and Electric and Gas Kitchen Ranges and Ovens) and for Certain Commercial and Industrial Equipment (Commercial Clothes Washers) Final Rule Federal Register 2009 74(66) pp 16040-16096
2 US Department of Energy-Office of Energy Efficiency and Renewable Energy Technical Support Document Energy Efficiency Program for Consumer Products and Commercial and Industrial Equipment Residential Dishwashers Dehumidifiers Cooking Products and Commercial Clothes Washers March 2009 Washington DC lthttpwww1eereenergygovbuildingsappliance_standardsresidentialcooking_prod ucts_final_rule_tsdhtmlgt
3 Association of Home Appliance Manufacturers AHAM 2005 Fact Book 2005 Washington DC
4 RS Means Mechanical Cost Data 31st Annual Edition 2008 Kingston MA
5 Consortium for Energy Efficiency Commercial Family-Sized Washers An Initiative Description of the Consortium for Energy Efficiency 1998 Boston MA lthttpwwwcee1orgcomcwshcwsh-mainphp3gt
6 US Department of Energy-Energy Information Administration Form EIA-861 for 2007 2007 Washington DC lthttpwwweiadoegovcneafelectricitypageeia861htmlgt
7 US Census Bureau Population estimates Population Population change and estimated components of population change April 1 2000 to July 1 2005 2006 Washington DC lthttpwwwcensusgovpopestdatasetshtmlgt
8 US Department of Energy-Energy Information Administration Natural Gas Monthly 2007 Washington DC lthttpwwweiadoegovoil_gasnatural_gasdata_publicationsnatural_gas_monthlyngmhtmgt
9 Raftelis Financial Consultants Inc 2006 RFCAWWA Water and Wastewater Rate Survey 2006 Charlotte NC Kansas City MO and Pasadena CA lthttpwwwrafteliscomratessurveyhtmlgt
10 US Department of Energy-Energy Information Administration An Updated Annual Energy Outlook 2009 Reference Case Reflecting Provisions of the American Recovery and Reinvestment Act and Recent Changes in the Economic Outlook April 2009 Washington DC SROIAF2009-03 lthttpwwweiadoegovoiafservicerptstimuluspdfsroiaf(2009)03pdfgt
8-48
EERE-2006-STD-0127 COMMENT 691
11 US Department of Energy-Energy Information Administration Annual Energy Outlook 2009 with Projections to 2030 March 2009 Washington DC DOEEIA-0383(2009) lthttpwwweiadoegovoiafaeopdf0383(2009)pdfgt
12 US Department of Labor-Bureau of Labor Statistics Consumer Price Indexes Item Water and sewerage maintenance Series Id CUUR0000SEHG01 US city average (not seasonally adjusted) 2008 Washington DC lthttpwwwblsgovcpihomehtmdatagt
13 Whirlpool Corporation Comment of Whirlpool Corporation Regarding the ANOPR for Cooking Products and Commercial Clothes Washers Docket Number EE-206-STD-2007 RIN 1904-AB49
14 US Department of Energy Technical Support Document Energy Efficiency Standards for Consumer Products Residential Central Air Conditioners and Heat Pumps May 2002 Washington DC Chapter 5 lthttpwwweereenergygovbuildingsappliance_standardsresidentialac_central_1000_rhtmlgt
15 Coin Laundry Association Industry Overview Downers Grove IL lthttpwwwcoinlaundryorgresourcesindustryoverviewcfmgt
16 Southern California Edison 2004-2005 Database for Energy Efficiency Resources (DEER) Update Study Final Report December 2005 Prepared for Southern California Edison by Itron Inc Vancouver WA lthttpwwwcalmacorgpublications2004-05_DEER_Update_Final_Report-Wopdfgt
17 Sullivan GP J W Currie TC Hillman and GB Parker High-Performance Clothes Washer Demonstration at Leisure World Laguna Woods Final Report December 2000 Prepared for Southern California Edison Company by Battelle Pacific Northwest Laboratory Richland WA lthttpeerepnlgovbuilding-technologiesdocscefinal202-22-01pdfgt
18 California Measurement Advisory Committee CALMAC Protocols Appendix F Effective Useful Live Values for Major Energy Efficiency Measures September 2000 lthttpwwwcalmacorgeventsAPX_Fpdfgt
19 Ibbotsons Associates Cost of Capital 2001 Yearbook Data Through March 2001 2001 Chicago IL
20 Damodaran Online The Data Page Cost of Capital by Industry Sector 2006 lthttppagessternnyuedu~adamodargt
21 Ibbotsons Associates Statistics for SIC code 72 2006 lthttpwwwibbotsoncomgt
8-49
EERE-2006-STD-0127 COMMENT 691
22 Ibbotsons Associates SBBI Valuation Edition 2001 Yearbook 2001 Chicago IL pp 38 44
23 US Government Printing Office Economic Report of the President 2006 2006 Washington DC lthttpwwwgpoaccessgoveopindexhtmlgt
24 Association of Home Appliance Manufacturers AHAM Data on Commercial Clothes Washers for DOE Efficiency Standards Rulemaking October 12 2006 Letter to Building Technologies Program US Department of Energy
25 California Energy Commission Appliances Databases ndash Clothes Washers 2009 Sacramento CA lthttpwwwenergycagovappliancesdatabaseexcel_based_filesClothes_Washersgt (Last Accessed February 5 2009)
26 US Office of the Federal Register Code of Federal Regulations Title 10 Part 431 -Energy Conservation Program for Certain Commercial and Industrial Equipment Subpart ImdashCommercial Clothes Washers January 1 2007 Washington DC
8-50
EERE-2006-STD-0127 COMMENT 691
CHAPTER 8 LIFE-CYCLE COST AND PAYBACK PERIOD ANALYSIS
Installation Costs and Total Installed Costs 8-10 Table 828 Front-Loading Commercial Clothes Washers Consumer Equipment
Prices Installation Costs and Total Installed Costs 8-11 Table 829 Inputs for Operating Cost 8-11 Table 8210 Top-Loading Commercial Clothes Washers Multi-Family Application
Annual Energy and Water Use by Efficiency Level 8-14 Table 8211 Top-Loading Commercial Clothes Washers Laundromat Application
Annual Energy and Water Use by Efficiency Level 8-14 Table 8212 Front-Loading Commercial Clothes Washers Multi-Family Application
Annual Energy and Water Use by Efficiency Level 8-15 Table 8213 Front-Loading Commercial Clothes Washers Laundromat Application
Annual Energy and Water Use by Efficiency Level 8-15 Table 8214 Average Commercial Electricity Prices in 2007 8-17 Table 8215 Average Commercial Electricity Prices for Commercial Clothes Washers
in 2008 8-18 Table 8216 Average Commercial Natural Gas Prices in 2007 8-19 Table 8217 Average Commercial Natural Gas Prices for Commercial Clothes Washers
in 2008 8-20 Table 8218 Average Per-Unit-Volume Water Prices in 2006 8-21 Table 8219 Average Per-Unit-Volume Water Prices for Commercial Clothes Washers
in 2008 8-22 Table 8220 Top-Loading Commercial Clothes Washer Annualized Repair Costs 8-25 Table 8221 Front-Loading Commercial Clothes Washer Annualized Repair Costs 8-25 Table 8222 Commercial Clothes Washers Product Lifetime Estimates and Sources 8-26 Table 8223 Commercial Clothes Washers Average Minimum and Maximum
Product Lifetimes 8-26 Table 8224 Data for the Calculation of Weighted-Average Cost of Capital for Sectors
that Purchase Commercial Clothes Washers 8-28 Table 8225 Weighted Average Cost of Capital for Sectors that Purchase Commercial
Clothes Washers 8-29 Table 8226 Discount Rates for Commercial Clothes Washers 8-30 Table 8227 Top-Loading Commercial Clothes Washers Base Case Market Shares 8-32 Table 8228 Front-Loading Commercial Clothes Washers Base Case Market Shares 8-32 Table 841 Top-Loading Commercial Clothes Washers Multi-Family Application
Figure 811 Flow Diagram of Inputs for the Determination of LCC and PBP 8-4 Figure 821 Electricity Price Trends 8-23 Figure 822 Natural Gas Price Trends 8-23 Figure 823 Water Price Trend 8-24 Figure 841 Top-Loading Commercial Clothes Washers Multi-Family Application
Base Case LCC Distribution 8-34 Figure 842 Top-Loading Commercial Clothes Washers Laundromat Application
Base Case LCC Distribution 8-35 Figure 843 Front-Loading Commercial Clothes Washers Multi-Family Application
Base Case LCC Distribution 8-35 Figure 844 Front-Loading Commercial Clothes Washers Laundromat Application
Base Case LCC Distribution 8-36 Figure 845 Top-Loading Commercial Clothes Washers Multi-Family Application
Distribution of LCC Impacts for CSL 2 8-37 Figure 846 Commercial Clothes Washers Multi-Family Application Distribution of
PBPs for CSL 3 8-38 Figure 847 Range of LCC Savings for Top-Loading Commercial Clothes Washers
Multi-Family 8-41 Figure 848 Range of LCC Savings for Top-Loading Commercial Clothes Washers
Laundromat 8-41 Figure 849 Range of LCC Savings for Front-Loading Commercial Clothes Washers
Multi-Family 8-42 Figure 8410 Range of LCC Savings for Front-Loading Commercial Clothes Washers
Laundromat 8-42 Figure 8411 Range of Payback Periods for Top-Loading Commercial Clothes Washers
Multi-Family 8-43 Figure 8412 Range of Payback Periods for Top-Loading Commercial Clothes Washers
Laundromat 8-43 Figure 8413 Range of Payback Periods for Front-Loading Commercial Clothes
Washers Multi-Family 8-44 Figure 8414 Range of Payback Periods for Front-Loading Commercial Clothes
Washers Laundromat 8-44
8-iii
EERE-2006-STD-0127 COMMENT 691
CHAPTER 8 LIFE-CYCLE COST AND PAYBACK PERIOD ANALYSIS
81 INTRODUCTION
This chapter describes the Department of Energy (DOE)rsquos methodology for analyzing the economic impacts of possible energy efficiency standards on individual consumers The effect of standards on individual consumers includes a change in operating expense (usually decreased) and a change in purchase price (usually increased) This chapter describes three metrics DOE used in the consumer analysis to determine the effect of standards on individual consumers
bull Life-cycle cost (LCC) is the total consumer expense over the life of an appliance including purchase expense and operating costs (including energy expenditures) DOE discounts future operating costs to the time of purchase and sums them over the lifetime of the equipment
bull Payback period (PBP) measures the amount of time it takes customers to recover the assumed higher purchase price of more energy-efficient equipment through lower operating costs
bull Rebuttable payback period is a special case of the PBP Where LCC and PBP are estimated over a range of inputs reflecting actual conditions rebuttable payback period is based on laboratory conditions specifically DOE test procedure inputs
Inputs to the LCC and PBP are discussed in sections 82 and 83 respectively of this chapter Results for the LCC and PBP are presented in section 84 The rebuttable PBP is discussed in section 85 Key variables and calculations are presented for each metric DOE performed the calculations discussed here using a series of Microsoft Excelreg spreadsheets which are accessible on the Internet (httpwwweereenergygovbuildingsappliance_standards) Details and instructions for using the spreadsheets are discussed in Appendix 8A
This chapter presents information and results pertaining solely to CCWs As described in section 13 of chapter 1 of this technical support document (TSD) DOE is continuing the rulemaking for energy conservation standards for microwave oven standby power and analyses related to these products will be published in a separate TSD In addition DOE issued a final rule1 adopting energy conservation standards for conventional cooking products (ie cooktops and ovens) and microwave oven energy factor (EF) and details of the analyses for these products are contained in the corresponding final rule TSD2
811 General Approach for LCC and PBP Analysis
Recognizing that several inputs to the determination of consumer LCC and PBP are either variable or uncertain DOE conducted the LCC and PBP analysis by modeling both the uncertainty and variability in the inputs using Monte Carlo simulation and probability
8-1
EERE-2006-STD-0127 COMMENT 691
distributions A detailed explanation of Monte Carlo simulation and the use of probability distributions is contained in Appendix 8B DOE developed LCC and PBP spreadsheet models incorporating both Monte Carlo simulation and probability distributions by using Microsoft Excelreg spreadsheets combined with Crystal Ballreg (a commercially available add-in program)
As described in Chapter 6 DOE established the variability and uncertainty in energy and water use by defining the uncertainty and variability in the usage (in cycles per day) of the equipment As will be described later in this chapter the variability and uncertainty in energy and water pricing are characterized by regional differences in energy and water prices
DOE displays the LCC and PBP results as distributions of impacts compared to the baseline conditions Results are presented at the end of this chapter and are based on 10000 samples per Monte Carlo simulation run To illustrate the implications of the analysis DOE generated a frequency chart depicting the variation in LCC and PBP for each standard level considered
812 Overview of LCC and PBP Inputs
The LCC is the total consumer expense over the life of the equipment including purchase expense and operating expense (including energy expenditures) DOE discounts future operating expenses to the time of purchase and sums them over the lifetime of the equipment The PBP is the change in purchase expense due to an increased efficiency standard divided by the change in annual operating expense that results from the standard It represents the number of years it will take the customer to recover the increased purchase expense through decreased operating expenses
DOE categorizes inputs to the LCC and PBP analysis as follows (1) inputs for establishing the purchase expense otherwise known as the total installed cost and (2) inputs for calculating the operating cost
The primary inputs for establishing the total installed cost are
bull Baseline manufacturer cost The costs incurred by the manufacturer to produce equipment meeting existing minimum efficiency standards
bull Standard-level manufacturer cost increases The change in manufacturer cost associated with producing equipment to meet a particular standard level
bull Markups and sales tax The markups and sales tax associated with converting the manufacturer cost to a consumer equipment price The markups and sale tax are described in detail in Chapter 7 Markups for Equipment Price Determination
bull Installation cost The cost to the consumer of installing the equipment The installation cost represents all costs required to install the equipment other than the marked-up consumer equipment price The installation cost includes labor overhead and any
8-2
EERE-2006-STD-0127 COMMENT 691
miscellaneous materials and parts Thus the total installed cost equals the consumer equipment price plus the installation cost
The primary inputs for calculating the operating cost are
bull Equipment energy and water consumption The equipment energy consumption is the site energy use associated with operating the equipment The water consumption is the site water use associated with operating the equipment Chapter 6 Energy and Water Use Determination details how DOE determined the equipment energy and water consumption based on various data sources
bull Equipment efficiency The equipment efficiency dictates the equipment energy and water consumption associated with standard-level equipment (ie equipment with efficiencies greater than baseline equipment) Chapter 6 Energy and Water Use Determination details how energy and water consumption change with increasing equipment efficiency
bull Energy and water prices Energy and water prices are the prices paid by consumers for energy (ie electricity gas or oil) and water DOE determined current energy prices based on data from the DOE- EIA DOE determined water prices based on data from the American Water Works Association (AWWA)
bull Energy and water price trends DOE used the EIA Annual Energy Outlook 2009 (AEO2009) to forecast energy prices into the future For the results presented in this chapter DOE used the AEO2009 reference case to forecast future energy prices DOE used consumer price index data specific to water and sewerage maintenance from the Bureau of Labor Statistics as the basis for its water price trend
bull Repair and maintenance costs Repair costs are associated with repairing or replacing components that have failed Maintenance costs are associated with maintaining the operation of the equipment
bull Lifetime The age at which the equipment is retired from service
bull Discount rate The rate at which DOE discounted future expenditures to establish their present value
Figure 811 graphically depicts the relationships between the installed cost and operating cost inputs for the calculation of the LCC and PBP In the figure below the yellow boxes indicate the inputs the green boxes indicate intermediate outputs and the blue boxes indicate the final outputs (the LCC and PBP)
8-3
EERE-2006-STD-0127 COMMENT 691
Baseline Manufacturer
Cost
Std-Level Manufacturer
Cost
Manufacturer Markup
Retailer or Distributor
Markup
Sales Tax
Installation Cost
Total Installed Cost
Water Prices
Energy and Water
Consumption
Equipment Price
Lifetime Operating Expense
Annual Energy and Water Expense
Lifetime Repair and Maintenance
Cost
Discount Rate
Energy and Water Price
Trends
Annual Operating Expense
Payback Period
Life-Cycle Cost
Energy Prices
Figure 811 Flow Diagram of Inputs for the Determination of LCC and PBP
Table 811 summarizes the input values that DOE used to calculate the LCC and PBP Each table summarizes the total installed cost inputs and the operating cost inputs including the lifetime discount rate and energy and water price trends DOE characterized all of the total cost inputs with single-point values but characterized several of the operating cost inputs with probability distributions that capture the inputrsquos uncertainty andor variability For those inputs characterized with probability distributions the values provided in the following tables are the average or typical values Also listed in the following tables is the section of the technical support document (TSD) where more detailed information on the inputs can be found
8-4
EERE-2006-STD-0127 COMMENT 691
Table 811 LCC and PBP Input Summary
Input Product Class Average or Typical Value Characterization
TSD Section Reference
Total Installed Cost Inputs
Baseline Manufacturer Cost
Top-Loading 126 MEF950 WF = $29630 Single-Point Value
8212 Front-Loading 172 MEF800 WF = $61102 Single-Point Value
Energy Prices Both Elec = 108 centkWh Gas = 1189 $MMBtu Single-Point Value 8222
Water and Wastewater Prices Both Water = 229 $103 gallon
Wastewater = 297 $103 gallon Singe-Point Value 8222
Repair and Maintenance Costs Both Annualized repair cost =
frac12 Equipment price Lifetime Single-Point Value 8224
Lifetime Both Multi-Family = 1125 years Laundromat = 7125 years Weibull distribution 823
Discount Rate Both 57 Custom distribution 824
Energy Price Trend Both AEO 2009 Reference Case Two sensitivities High amp Low Growth Cases 8223
Water and Wastewater Price Trend Both Bureau of Labor Statistics
Water and sewerage CPI Single forecast 8223
Annual use based on electric water heating and electric clothes drying Annual use provided for baseline product only Annual use decreases with increased product efficiency
8-5
EERE-2006-STD-0127 COMMENT 691
82 LIFE-CYCLE COST INPUTS
Life-cycle cost is the total customer expense over the life of an appliance including purchase expense and operating costs (including energy expenditures) DOE discounts future operating costs to the time of purchase and sums them over the lifetime of the equipment DOE defines LCC by the following equation
N OCtLCC = IC +sum t(1+ r) where
t=1
LCC = Life-cycle cost in dollars IC = Total installed cost in dollars sum = Sum over the lifetime from year 1 to year N N = Lifetime of appliance in years OC = Operating cost in dollars r = Discount rate and t = Year for which operating cost is being determined
DOE expresses dollar values in 2008$
The following sections discuss total installed cost operating cost lifetime and discount rate
821 Total Installed Cost Inputs
DOE defines the total installed cost using the following equation
IC = EQP + INST where
EQP = Equipment price (ie customer price for the equipment only) expressed in dollars and
INST = Installation cost or the customer price to install equipment (ie the cost for labor and materials) also in dollars
The equipment price is based on how the consumer purchases the equipment As discussed in Chapter 7 Markups for Equipment Price Determination DOE defined markups and sales taxes for converting manufacturing costs into consumer equipment prices
Table 821 summarizes the inputs for the determination of total installed cost
8-6
EERE-2006-STD-0127 COMMENT 691
Table 821 Inputs for Total Installed Cost Baseline Manufacturer Cost
Standard-Level Manufacturer Cost
Manufacturer Markup
Retailer or Distributor Markup
Sales Tax
Installation Cost
The baseline manufacturer cost is the cost incurred by the manufacturer to produce equipment meeting existing minimum efficiency standards Standard-level manufacturer cost increases are the change in manufacturer cost associated with producing equipment at a standard level Markups and sales tax convert the manufacturer cost to a consumer equipment price The installation cost is the cost to the consumer of installing the equipment and represents all costs required to install the equipment other than the marked-up consumer equipment price The installation cost includes labor overhead and any miscellaneous materials and parts Thus the total installed cost equals the consumer equipment price plus the installation cost DOE calculated the total installed cost for baseline products based on the following equation
IC BASE = EQPBASE + INSTBASE
= COSTMFG times MUOVERALL _ BASE + INSTBASE
where
ICBASE = Baseline total installed cost EQPBASE = Consumer equipment price for baseline models INSTBASE = Baseline installation cost COSTMFG = Manufacturer cost for baseline models and MUOVERALL_BASE = Baseline overall markup (product of manufacturer markup baseline
retailer or distributor markup and sales tax)
DOE calculated the total installed cost for standard-level products based on the following equation
= IC BASE + (ΔCOSTMFG times MUOVERALL _ INCR + ΔINSTSTD ) where
8-7
EERE-2006-STD-0127 COMMENT 691
ICSTD = Standard-level total installed cost EQPSTD = Consumer equipment price for standard-level models INSTSTD = Standard-level installation cost EQPBASE = Consumer equipment price for baseline models ΔEQPSTD = Change in equipment price for standard-level models INSTBASE = Baseline installation cost ΔINSTSTD = Change in installation cost for standard-level models ICBASE = Baseline total installed cost ΔCOSTMFG = Change in manufacturer cost for standard-level models and MUOVERALL_INCR = Incremental overall markup (product of manufacturer markup
incremental retailer or distributor markup and sales tax)
The remainder of this section provides information about each of the above input variables that DOE used to calculate the total installed cost for cooking products dishwashers dehumidifiers and commercial clothes washers
8212 Baseline Manufacturer Cost
DOE used residential clothes washer data from AHAMrsquos 2005 Fact Book to develop the baseline manufacturer costs for top-loading commercial clothes washers3 According to the AHAM 2005 Fact Book in the year 2005 total clothes washer sales equaled $3373042 million while total industry shipments equaled 9394 million DOE divided total sales by total shipments to arrive at an average manufacturer price of $35906 Based on a manufacturer markup of 126 as determined in section 72 of Chapter 7 Markups for Equipment Price Determination DOE arrived at a baseline manufacturer cost of $28497 in 2006$ As detailed in Chapter 5 Engineering Analysis DOE estimated the cost difference between top-loading and front-loading washers to arrive at the baseline manufacturer cost for front-loading washers Table 822 presents the baseline manufacturer cost as well as the associated baseline modified energy factor and water factor
DOE used a combination of cost data submitted by AHAM and a reverse engineering analysis to develop commercial clothes washer manufacturer cost increases associated with increases in product standard levels Refer to Chapter 5 Engineering Analysis for details Tables 823 and 824 present the standard-level manufacturer cost increases as well as the
8-8
EERE-2006-STD-0127 COMMENT 691
associated modified energy factors and water factors for top-loading and front-loading washers respectively
The overall markup is the value determined by multiplying the manufacturer and retailer markups and the sales tax together to arrive at a single markup value Table 825 shows the overall baseline and incremental markups for commercial clothes washers Refer to Chapter 7 Markups for Equipment Price Determination for details
DOE derived baseline installation costs for commercial clothes washers from data in the RS Means Mechanical Cost Data 20084 This book provides estimates on the labor required to install commercial clothes washers Table 826 summarizes the nationally representative
8-9
EERE-2006-STD-0127 COMMENT 691
average costs associated with the installation of a four-cycle coin operating commercial clothes washer as presented in RS Means Mechanical Cost Data Table 826 provides both bare costs (ie costs before OampP) and installation costs including OampP DOE determined that installation costs would not be impacted with increased standard levels
Table 826 Commercial Clothes Washers Baseline Installation Costs Bare Costs (2005$) Including Overhead amp Profit (2005$)
Installation Type Material Labor Total Total Material Labor Average $1100 $125 $1225 $1400 $1210 $190
Average (2008$) $190 Material costs including OampP equal bare costs plus 10 profit DOE derived labor cost including OampP by subtracting material with OampP from total with OampP Source RS Means Mechanical Cost Data 2008
8216 Total Installed Cost
The total installed cost is the sum of the consumer equipment price and the installation cost Refer back to section 821 to see the equations that DOE used to calculate the total installed cost for baseline and standard-level products
Tables 827 and 828 present the consumer equipment price installation costs and total installed costs for top-loading and front-loading washers respectively Prices and costs are presented at the baseline level and each standard level
Table 827 Top-Loading Commercial Clothes Washers Consumer Equipment Prices Installation Costs and Total Installed Costs
DOE defines the operating cost by the following equation
OC = EC +WC + RC + MC where
EC = Energy expenditure associated with operating the equipment WC = For dishwashers and commercial clothes washers the water expenditure
associated with operating the equipment RC = Repair cost associated with component failure and MC = Service cost for maintaining equipment operation
Table 829 shows the inputs for determining the operating costs The inputs listed in Table 829 are also necessary for determining lifetime operating expenses which include the energy price trends (and water price trends) product lifetime discount rate and effective date of the standard
Table 829 Inputs for Operating Cost Annual Energy (and Water) Consumption
Energy and Water Prices
Repair and Maintenance Costs
Energy and Water Price Trends
Product Lifetime
Discount Rate
Effective Date of Standard
The annual energy consumption is the site energy use associated with operating the equipment The annual water consumption which is applicable to commercial clothes washers is the site water use associated with operating the equipment The annual energy (and water)
8-11
EERE-2006-STD-0127 COMMENT 691
__ __
consumption vary with the product efficiency That is the energy and water consumption associated with standard-level equipment (ie equipment with efficiencies greater than baseline equipment) are less than the consumptions associated with baseline equipment Energy and water prices are the prices paid by consumers for energy (ie electricity gas or oil) and water Multiplying the annual energy and water consumption by the energy and water prices yields the annual energy cost and water cost respectively Repair costs are associated with repairing or replacing components that have failed Maintenance costs are associated with maintaining the operation of the equipment DOE used energy and water price trends to forecast energy and water prices into the future and along with the product lifetime and discount rate to establish the lifetime energy and water costs The product lifetime is the age at which the equipment is retired from service The discount rate is the rate at which DOE discounted future expenditures to establish their present value DOE calculated the operating cost for baseline products based on the following equation
OC = EC +WC + RC + MCBASE BASE BASE BASE BASE
= AEC times PRICE + AWC times PRICE + RC + MCBASE ENERGY BASE WATER BASE BASE
where
OCBASE = Baseline operating cost ECBASE = Energy expenditure associated with operating the baseline equipment WCBASE = For commercial clothes washers the water expenditure associated with
operating the baseline equipment RCBASE = Repair cost associated with component failure for the baseline
equipment MCBASE = Service cost for maintaining baseline equipment operation AECBASE = Annual energy consumption for baseline equipment PRICEENERGY = Energy price AWCBASE = Annual water consumption for baseline equipment and PRICEWATER = Water price
DOE calculated the operating cost for standard-level products based on the following equation
OC = EC +WC + RC + MCSTD STD STD STD STD
= AEC times PRICE + AWC times PRICE + RC + MCSTD ENERGY STD WATER STD STD
= (AEC BASE ΔAEC STD )times PRICE ENERGY + (AWC BASE ΔAWC STD )times PRICEWATER
( + RC ) ( + ΔMC+ RC BASE Δ STD + MC BASE STD )
where
OCSTD = Standard-level operating cost ECSTD = Energy expenditure associated with operating standard-level equipment
8-12
EERE-2006-STD-0127 COMMENT 691
WCSTD = For commercial clothes washers the water expenditure associated with operating standard-level equipment
RCSTD = Repair cost associated with component failure for standard-level equipment
MCSTD = Service cost for maintaining standard-level equipment operation AECSTD = Annual energy consumption for standard-level equipment PRICEENERGY = Energy price AWCSTD = Annual water consumption for standard-level equipment PRICEWATER = Water price ΔAECSTD = Change in annual energy consumption caused by standard-level
equipment ΔAWCSTD = Change in annual water consumption caused by standard-level
equipment ΔRCSTD = Change in repair cost caused by standard-level equipment and ΔMCSTD = Change in maintenance cost caused by standard-level equipment
The remainder of this section provides information about each of the above input variables that DOE used to calculate the operating costs for cooking products dishwashers dehumidifiers and commercial clothes washers
8221 Annual Energy and Water Consumption
Chapter 6 Energy and Water Use Determination details how DOE determined the annual energy and water consumption for baseline and standard-level products
DOE characterized the variability of commercial clothes washer usage based on several studies For multi-family product applications DOE equally weighted each study to establish the variability For laundromat applications DOE used a range of values varying from three to eight cycles per day Refer back to Chapter 6 section 64 to review how DOE characterized commercial clothes washer usage variability
The tables presented below are based on the energy and water use determination analysis described in Chapter 6 Keep in mind that the annual energy and water consumption values in the tables below are averages DOE captured the variability in energy (and water) consumption when it conducted its LCC and PBP analysis
Tables 8210 and 8211 provide the average annual energy and water consumption by efficiency level for top-loading commercial clothes washers Tables 8212 and 8213 provide the average annual energy and water consumption by efficiency level for front-loading commercial clothes washers DOE presents annual consumption based on two applications multi-family housing and laundromats The tables below are similar to Tables 632 through 635 in section 63 from Chapter 6 with the exception that in the tables below the electric and gas water heating and drying consumptions take into account the percentage of buildings in the US that use electric and gas water heaters and dryers In others words the electric and gas water heating and drying consumption in Tables 8210 through 8213 are weighted by the share
8-13
EERE-2006-STD-0127 COMMENT 691
of buildings that use electric and gas water heaters and dryers Based on data from the Consortium for Energy Efficiency (CEE) 5 the shares of electric and gas water heating and drying in multi-family applications are 20 percent and 80 percent electric and gas water heating respectively and 40 percent and 60 percent electric and gas drying respectively Also based on CEE data 100 percent of laundromats use gas water heating and drying
Table 8210 Top-Loading Commercial Clothes Washers Multi-Family Application Annual Energy and Water Use by Efficiency Level
Standard Level
MEF WF
Annual Energy Use Annual
Water Use Water Heating Drying
MachineElectric Gas Electric Gas cuftkWhcyc galcuft kWhyr MMBtuyr kWhyr MMBtuyr kWhyr 1000 galyear
Annual usage based on 34 cycles per day (1241 cycles per year) Electric and gas water heating based on water heater efficiencies of 100 for electric and 75 for gas Water
heater consumption is weighted by the share of buildings with electric (20) and gas (80) water heaters Dryer consumption is weighted by the share of buildings with electric (40) and gas (60) dryers
Table 8211 Top-Loading Commercial Clothes Washers Laundromat Application Annual Energy and Water Use by Efficiency Level
Standard Level
MEF WF
Annual Energy Use Annual
Water Use Water Heating Drying
MachineElectric Gas Electric Gas cuftkWhcyc galcuft kWhyr MMBtuyr kWhyr MMBtuyr kWhyr 1000 galyear
Annual usage based on 6 cycles per day (2190 cycles per year) Electric and gas water heating based on water heater efficiencies of 100 for electric and 75 for gas Water
heater consumption is weighted by the share of buildings with electric (0) and gas (100) water heaters Dryer consumption is weighted by the share of buildings with electric (0) and gas (100) dryers
8-14
EERE-2006-STD-0127 COMMENT 691
Table 8212 Front-Loading Commercial Clothes Washers Multi-Family Application Annual Energy and Water Use by Efficiency Level
Standard Level
MEF WF
Annual Energy Use Annual
Water Use Water Heating Drying
MachineElectric Gas Electric Gas cuftkWhcyc galcuft kWhyr MMBtuyr kWhyr MMBtuyr kWhyr 1000 galyear
Annual usage based on 34 cycles per day (1241 cycles per year) Electric and gas water heating based on water heater efficiencies of 100 for electric and 75 for gas Water
heater consumption is weighted by the share of buildings with electric (20) and gas (80) water heaters Dryer consumption is weighted by the share of buildings with electric (40) and gas (60) dryers
Table 8213 Front-Loading Commercial Clothes Washers Laundromat Application Annual Energy and Water Use by Efficiency Level
Standard Level
MEF WF
Annual Energy Use Annual
Water Use Water Heating Drying
MachineElectric Gas Electric Gas cuftkWhcyc galcuft kWhyr MMBtuyr kWhyr MMBtuyr kWhyr 1000 galyear
Annual usage based on 6 cycles per day (2190 cycles per year) Electric and gas water heating based on water heater efficiencies of 100 for electric and 75 for gas Water
heater consumption is weighted by the share of buildings with electric (0) and gas (100) water heaters Dryer consumption is weighted by the share of buildings with electric (0) and gas (100) dryers
8222 Energy and Water Prices
DOE derived energy prices for 13 geographic areas in the US and derived water prices for the four Census regions Using these data DOE analyzed the variability of energy and water prices at the regional level for cooking products and commercial clothes washers
DOE characterized energy and water price regional variability with probability distributions It based the probability associated with each regional energy and water price on the population weight of each region
8-15
EERE-2006-STD-0127 COMMENT 691
The methodology that DOE used for deriving the energy and water prices is presented below Included are tables that summarize the regional energy and water prices for each product
Energy Prices DOE derived average energy prices from data from EIA DOE calculated prices for each
of 13 geographic areas the nine US Census divisions with four large States (New York Florida Texas and California) treated separately For Census divisions containing one of these large States DOE calculated the regional average values leaving out data for the large Statemdashfor example the Pacific region average does not include California and the West South Central does not include Texas
Commercial Electricity Prices DOE estimated electricity prices for commercial consumers in each of the above
geographic areas using EIA Form 861 data6 These data are published annually and include annual electricity sales in kilowatt hours (kWh) revenues from electricity sales and number of consumers for the residential commercial and industrial sectors for every utility serving final consumers The calculation of an average residential electricity price proceeds in two steps
1 For each utility estimate an average residential price by dividing the residential revenues by residential sales
2 Calculate a regional average price weighting each utility with customers in a region by the number of residential consumers served in that region
Table 8214 shows the results for each geographic region
8-16
EERE-2006-STD-0127 COMMENT 691
Table 8214 Average Commercial Electricity Prices in 2007 Geographic Area Average Price (2007$kWh) New England $0148 Middle Atlantic (excludes NY) $0107 East North Central $0088 West North Central $0072 South Atlantic (excludes FL) $0082 East South Central $0083 West South Central (excludes TX) $0082 Mountain $0081 Pacific (excludes CA) $0091 New York $0163 Florida $0131 Texas $0115 California $0098 Source EIA Form 861
Table 8215 shows the national average commercial electricity prices for commercial clothes washers based on the relative residential consumer weight of each geographic area DOE used 2006 population estimates from the US Census as a proxy to estimate how the national saturation of commercial clothes washers was distributed over the 13 geographic areas7
Because DOE conducted the LCC and PBP analysis in 2008$ all electricity prices are in 2008$ To perform the necessary monetary conversion DOE used the GDP to convert the electricity prices from 2007$ to 2008$
8-17
EERE-2006-STD-0127 COMMENT 691
Table 8215 Average Commercial Electricity Prices for Commercial Clothes Washers in 2008
Geographic Area Average Price
(2008$kWh) Saturations New England $0156 48 Middle Atlantic (excludes NY) $0114 71 East North Central $0093 155 West North Central $0076 67 South Atlantic (excludes FL) $0087 130 East South Central $0088 59 West South Central (excludes TX) $0087 36 Mountain $0085 70 Pacific (excludes CA) $0096 40 New York $0172 64 Florida $0139 60 Texas $0121 79 California $0104 122 National Average Price (2008$kWh) $0108 - Saturations based on 2006 population estimates from Census
Converted to 2008$ by multiplying costs in 2007$ by the ratio of 2008 GDP (11981) to 2007 GDP (11727) Converted the price for year 2007 to the price in 2008 by multiplying the 2007 price by the ratio of the average AEO electricity price in 2008 (2906 $MMBtu) to average AEO electricity price in 2007 (2803 $MMBtu)
Commercial Natural Gas Prices DOE obtained the data for the natural gas price calculation from the EIA publication
Natural Gas Monthly8 This publication includes a compilation of monthly natural gas delivery volumes and average consumer prices by State for residential commercial and industrial customers The Department used the complete annual data for 2007 to calculate an average annul price for each area The calculation of average prices proceeds in two steps
1 Calculate the annul price for each State using a simple average over the appropriate months
2 Calculate a regional price weighting each State in a region by its population
This method differs from the method used to calculate electricity prices because EIA does not provide consumer- or utility-level data on gas consumption and prices The commercial price units in Table 8216 are in dollars per thousand cubic feet ($tcf)
8-18
EERE-2006-STD-0127 COMMENT 691
Table 8216 Average Commercial Natural Gas Prices in 2007 Geographic Area Average Price (2007$tcf) New England $1412 Middle Atlantic (excludes NY) $1249 East North Central $1086 West North Central $1089 South Atlantic (excludes FL) $1294 East South Central $1264 West South Central (excludes TX) $1121 Mountain $1047 Pacific (excludes CA) $1391 New York $1139 Florida $1017 Texas $999 California $1304 Source EIA Natural Gas Monthly
Table 8217 shows the national average commercial natural gas prices for commercial clothes washers based on the relative commercial consumer weight of each geographic area DOE used 2006 population estimates from the US Census as a proxy to estimate how the national saturation of commercial clothes washers was distributed over the 13 geographic areas Because DOE conducted the LCC and PBP analysis in 2008$ all natural gas prices are in 2008$ To perform the necessary monetary conversion DOE used the GDP to convert the gas prices from 2007$ to 2008$
8-19
EERE-2006-STD-0127 COMMENT 691
Table 8217 Average Commercial Natural Gas Prices for Commercial Clothes Washers in 2008
Geographic Area Average Price
(2008$MMBtu) Saturations New England $1443 48 Middle Atlantic (excludes NY) $1277 71 East North Central $1110 155 West North Central $1114 67 South Atlantic (excludes FL) $1323 130 East South Central $1292 59 West South Central (excludes TX) $1146 36 Mountain $1070 70 Pacific (excludes CA) $1422 40 New York $1164 64 Florida $1039 60 Texas $1021 79 California $1333 122 National Average Price (2008$MMBtu) $1189 -
Saturations based on 2005 population estimates from US Census 1 tcf gas = 103 MMBtu Converted to 2008$ by multiplying costs in 2007$ by the ratio of 2008 GDP (11981)
to 2007 GDP (11727) Converted the price for year 2007 to the price in 2008 by multiplying the 2007 price by the ratio of the average AEO gas price in 2008 (1134 $MMBtu) to average AEO gas price in 2007 (1099 $MMBtu)
Water Prices DOE obtained water price data from the year 2006 from the Water and Wastewater Rate
Survey conducted by Raftelis Financial Consultants and the American Water Works Association9 The survey covers approximately 216 water utilities and 153 wastewater utilities with each industry analyzed separately The water survey includes for each utility the cost to consumers of purchasing a given volume of water In this case the data include a division of the total consumer cost into fixed and volumetric charges The calculations use only the volumetric charge to calculate water prices since only this charge would be affected by a change in water consumption Including the fixed charge in the average would lead to a slightly higher water price
The Water and Wastewater Rate Survey provides prices separately for residential and non-residential customers For wastewater utilities the format is similar but the cost refers to the cost of treating a given volume of wastewater In both surveys the non-residential sector is divided into four sub-sectors based on the average monthly volume of water delivered or equivalently the size of the delivery pipe The sub-sectors are named non-manufacturing commercial industrial 1 and industrial 2 DOErsquos analysis uses the commercial category to estimate prices for commercial consumers
8-20
EERE-2006-STD-0127 COMMENT 691
A sample of 216 utilities is not large enough to calculate regional prices for all US Census divisions and large States (for comparison the EIA Form 861 data include more than 3000 utilities) For this reason DOE calculated regional values at the Census region level (Northeast South Midwest and West) The calculation of average per-unit-volume prices proceeds in three steps
1 For each utility calculate the per-unit-volume price by dividing the total volumetric cost by the volume delivered
2 Calculate a State-level average price by weighting each utility in a given State by the number of consumers it serves (either residential or commercial)
3 Calculate a regional average by combining the State-level averages weighting each by the population of that State This third step helps reduce any bias in the sample that may occur due to relative under-sampling of large States
The results of the calculation for the commercial sector are presented in Table 8218 The price units in the table are dollars per thousand gallons ($tg)
Table 8218 Average Per-Unit-Volume Water Prices in 2006 Commercial Region 2005$tg Water 2005$tg Wastewater Northeast $203 $306 Midwest $162 $230 South $200 $227 West $200 $254
Table 8219 shows the national average commercial water and wastewater prices for commercial clothes washers based on the relative commercial consumer weight of each region DOE used 2006 population estimates from the US Census as a proxy to estimate how the national saturation of commercial clothes washers was distributed over the four regions Because DOE conducted the LCC and PBP analysis in 2008$ it needed to convert all water prices into 2008$ To perform the necessary monetary conversion DOE used the GDP to convert the water and wastewater prices from 2005$ to 2008$
8-21
EERE-2006-STD-0127 COMMENT 691
Table 8219 Average Per-Unit-Volume Water Prices for Commercial Clothes Washers in 2008
Region 2008$tg Water 2008$tg Wastewater Saturations Northeast $242 $365 183 Midwest $193 $275 221 South $239 $271 364 West $239 $303 232 National $229 $297 - Saturations based on 2006 population estimates from Census Converted to 2008$ by multiplying costs in 2005$ by the ratio of 2008 GDP (11981) to 2004 GDP (11193)
Converted the price for year 2006 to the price in 2008 by multiplying the 2006 price by the ratio of the average water CPI in 2008 (33133) to average water CPI in 2006 (29720)
8223 Energy and Water Price Trends
DOE used price forecasts by the EIA to estimate the trends in natural gas oil and electricity prices To arrive at prices in future years it multiplied the average prices described in the preceding section (section 8222) by the forecast of annual average price changes in EIArsquos AEO 2009 updated to reflect the American Recovery and Reinvestment Act (AEO 2009 ARRA)10 To estimate the trend after 2030 DOE followed past guidelines provided to the Federal Energy Management Program (FEMP) by EIA and used the average rate of change during 2020ndash2030
The Department set up its analysis to calculate LCC and PBP using three separate projections Reference Low Economic Growth and High Economic Growth These three cases reflect the uncertainty of economic growth in the forecast period The high and low growth cases show the projected effects of alternative growth assumptions on energy markets The AEO 2009 ARRA provides only forecasts for the Reference Case Therefore DOE used the high-growth case and low-growth forecasts from the AEO 2009 March release to estimate high and low growth price trends11 Figures 821 and 822 show the commercial electricity and natural gas price trends respectively based on the three projections For the LCC results presented in section 84 DOE used only the energy price forecasts from the AEO 2009 ARRA Reference Case
8-22
EERE-2006-STD-0127 COMMENT 691
080
085
090
095
100
105
110
115
120
125
2005 2010 2015 2020 2025 2030 2035 2040 2045
Year
Pric
e Tr
end
(200
8 =
1)
High Grow th Case
Reference Case
Low Grow th Case
Figure 821 Electricity Price Trends
070
080
090
100
110
120
130
140
150
2005 2010 2015 2020 2025 2030 2035 2040 2045
Year
Pric
e Tr
end
(200
8 =
1)
High Grow th Case
Reference Case
Low Grow th Case
Figure 822 Natural Gas Price Trends
8-23
EERE-2006-STD-0127 COMMENT 691
To estimate the future trend for water and wastewater prices DOE used data on the historic trend in the national water price index (US city average) from 1970 through 200812
DOE extrapolated the future trend based on the linear growth from 1970 to 2008 But rather than use the extrapolated trend to forecast the prices for the four years after 2008 DOE pinned the annual price to the value in 2008 Otherwise forecasted prices for this four-year time period would have been up to eight percent lower than the price in 2008 Beyond the four-year time period DOE used the extrapolated trend to forecast prices out to the year 2043 Figure 823 shows the historical and projected water price trend data DOE used the forecasted data to estimate water and wastewater prices for commercial clothes washers
0
100
200
300
400
500
600
1970 1980 1990 2000 2010 2020 2030 2040
Year
Wat
er C
PI
Water Price CPI
Linear Extrapolation
Figure 823 Water Price Trend
8224 Repair and Maintenance Costs
Typically small incremental changes in product efficiency incur no or only very small changes in repair and maintenance costs over baseline products However equipment with efficiencies that are significantly higher than the baseline are more likely to incur higher repair and maintenance costs because its higher complexity and higher part count typically increases the cumulative probability of failure
The Whirlpool Corporation estimates that the unit shipments of horizontal-axis commercial clothes washers are less than half that of vertical-axis machines while their in-warranty repair costs are double that of vertical-axis machines13 This suggests that the repair of
8-24
EERE-2006-STD-0127 COMMENT 691
horizontal-axis machines is four times as costly as that of vertical-axis machines Because in-warranty repair costs based on Whirlpoolrsquos experience are greater for horizontal-axis machines that vertical-axis machines DOE estimated that commercial clothes washer repair costs would increase as a function of equipment efficiency DOE utilized an algorithm developed for central air conditioners and heat pumps to estimate repair cost increases14 This algorithm calculates annualized repair costs by dividing the half the equipment retail price by the equipment lifetime as show in the expression below
05 times EQP=RC ANNUAL LIFE
where
RCANNUAL = Annualized repair cost associated with equipment EQP = Consumer equipment price and LIFE = Product lifetime
Tables 8220 and 8221 show for each product class and each product application (multi-family buildings and laundromats) the annualized repair costs for the commercial clothes washer baseline and efficiency levels Annualized repair costs for each product application differ because commercial clothes washer lifetime is different for each application (Product lifetimes are presented below is section 823) The tables also present the consumer equipment prices for the baseline level and each efficiency level
Average product lifetime Multi-family = 113 years Laundromat = 71 years
8-25
EERE-2006-STD-0127 COMMENT 691
823 Product Lifetime
DOE used only primary sources of data to estimate product lifetimes DOE considered the sources listed in Table 8222 to estimate product lifetime
Table 8222 Commercial Clothes Washers Product Lifetime Estimates and Sources Lifetime (years) Source 7 to 10 CEE (1998) 5
Top-Loading (12 to 14 lbs) 5 to 8 Front-Loading (18 to 50 lbs) 10 to 15 CLA 15
8 to 9 ACEEE (2001) 16
5 (high-use) to 13 (low-use) Southern California Edison (2000) 17
15 dagger CALMAC (2000) 18
Used to establish laundromat lifetime only Used to establish multi-family lifetime only Depending on the usage rate the life can be shorter dagger Based on engineering judgment
Because DOE conducted the LCC analysis based on analyzing two product applicationsmdashmulti-family and laundromatsmdashit established separate lifetimes for each product application Because clothes washers in multi-family applications are used less frequently than in laundromats DOE decided to use only those sources that indicated lifetimes of seven years or greater for multi-family applications For laundromats applications where clothes washers receive heavier use DOE decided to use only those sources that indicated lifetimes of 10 years or less DOE then took an average of the lifetime estimates that met the above criteria For multi-family applications the average lifetime turned out to be 113 years while the average lifetime for laundromats was 71 years DOE used the low estimate for the above applicable sources to establish the minimum product lifetime for each product application For multi-family applications the minimum estimate is 7 years and for laundromats it is 5 years To establish the maximum product lifetime DOE took the difference between the minimum and average values (43 years for multi-family and 21 years for laundromats) and added it to the average product lifetime The minimum average and maximum lifetime estimates for each product application are shown in Table 8223
Table 8223 Commercial Clothes Washers Average Minimum and Maximum Product Lifetimes
Product Minimum
years Average
years Maximum
years Multi-Family Laundromats
70 50
113 71
155 93
8-26
EERE-2006-STD-0127 COMMENT 691
DOE characterized the clothes washer product lifetimes for each product application with Weibull distributions Appendix 8C presents the Weibull distributions for commercial clothes washers that DOE used in the LCC and PBP analysis
824 Discount Rates
DOE derived the discount rates for the LCC and PBP analysis from estimates of the finance cost of purchasing the considered products Following financial theory the finance cost of raising funds to purchase appliances can be interpreted as (1) the financial cost of any debt incurred to purchase equipment or (2) the opportunity cost of any equity used to purchase equipment For the residential products the purchase of equipment for new homes entails different finance costs for consumers than the purchase of replacement equipment Thus DOE used different discount rates for new construction and replacement installations
For commercial clothes washers DOE derived the discount rate from the cost of capital of publicly traded firms in the sectors that purchase commercial clothes washers19 These companies typically finance equipment purchases through debt and equity capital DOE estimated the cost of capital of these firms as the weighted average of the cost of equity financing and the cost of debt financing
The costs of debt and equity financing are usually obtainable from publicly available data about the following types of companies in the sectors that purchase commercial clothes washers
bull personal services (including laundromats) bull educational services (which buy washers for dormitories) bull hotels and bull real estate investment trusts (REITs) (ie building owners including owners of
apartment complexes)
Damodaran Online is a widely used source of information about company debt and equity financing for most types of firms and was the source of data for this analysis on educational services hotels and REITs20 Since Damodaran Online does not include data for firms in the personal services sector (SIC 7200) DOE used data from Ibbotsonrsquos Associates for this sector21 Ibbotson Associates is a leading authority on asset allocation with expertise in capital market expectations and portfolio implementation
DOE estimated the cost of equity using the capital asset pricing model (CAPM)22 The CAPM assumes that the cost of equity (ke) for a particular company is proportional to the systematic risk faced by that company where high risk is associated with a high cost of equity and low risk is associated with a low cost of equity The systematic risk facing a firm is determined by several variables the risk coefficient of the firm (β) the expected return on risk-free assets (Rf) and the equity risk premium (ERP) The risk coefficient of the firm indicates the risk associated with that firm relative to the price variability in the stock market The expected return on risk-free assets is defined by the yield on long-term government bonds The ERP represents the difference between the expected stock market return and the risk-free rate The
8-27
EERE-2006-STD-0127 COMMENT 691
cost of equity financing is estimated using the following equation where the variables are defined as above
ke = R f + (βtimes ERP) where
ke = Cost of equity Rf = Expected return on risk-free assets β = Risk coefficient of the firm and ERP = Equity risk premium
The cost of debt financing (kd) is the interest rate paid on money borrowed by a company The cost of debt is estimated by adding a risk adjustment factor (Ra) to the risk-free rate This risk adjustment factor depends on the variability of stock returns represented by standard deviations in stock prices So for firm i the cost of debt financing is
k = R + Rdi f ai
where
kd = Cost of debt financing for firm i Rf = Expected return on risk-free assets and Rai = Risk adjustment factor to risk-free rate for firm i
DOE estimates the weighted-average cost of capital (WACC) using the following equation
WACC = k times w + k times we e d d
where
WACC = Weighted average cost of capital we = Proportion of equity financing and wd = Proportion of debt financing
The values of the parameters used in the calculations are shown in Table 8224 below
Table 8224 Data for the Calculation of Weighted-Average Cost of Capital for Sectors that Purchase Commercial Clothes Washers
Based on the procedure described above and the data in Table 8224 Table 8225 shows the WACC for each of the four sectors that purchase commercial washers
Table 8225 Weighted Average Cost of Capital for Sectors that Purchase Commercial Clothes Washers
Sector Weighted-Average Cost of Capital Personal Services 69 Educational Services 106 Hotels 85 REIT 84
The WACC provides an estimate of the nominal cost of capital for firms that purchase commercial clothes washers The real WACC is calculated by adjusting the cost of capital by the expected rate of inflation using the following formula
1+WACCWACCr = 1
1+ r_
where
WACCr = Real weighted-average cost of capital WACC = Weighted-average cost of capital and r = Inflation rate
DOE applied this formula to the costs of capital shown in Table 8225 which yielded the discount rates for each of the sectors given in Table 8226 For the calculation of the discount rates DOE assumed an inflation rate of 25 percent (the average of inflation rates over the 2001ndash 2005 time period)23 Because DOE performed the discount rate calculation on companies or firms that typically purchase commercial clothes washers a distribution of discount rates were generated within each sector The standard deviation of the distribution for each sector is provided in Table 8226 To obtain an average discount rate value for the entire commercial clothe washer industry DOE analyzed additional data from the CEE The CEE estimates that there are up to 3000000 commercial clothes washers in use in the United States 2000000 of these in multi-family housing and 420000 in laundromats5 DOE assumed that the remaining 580000 washers are used in universities and educational institutions Using these proportions DOE derived weights of 14 percent 194 percent and 666 percent for personal services educational services and REIT respectively In the absence of any data regarding hotels DOE assumed the weight for educational services was applicable to hotels as well Weighting each sector by its market share DOE estimated the average discount rate for companies that purchase commercial washers to be 57 percent assuming an inflation rate of 25 percent (the average of inflation rates over the 2001ndash2005 time period)22
8-29
EERE-2006-STD-0127 COMMENT 691
Table 8226 Discount Rates for Commercial Clothes Washers Discount Rate Sector Average Std Deviation Share Personal Services 43 18 140 Educational Services 79 57 97 Hotels 58 20 97 REIT 57 22 666 Average 57 - 100
To account for variation in the discount rates within each of the sectors DOE used the average values and standard deviations in the table above to characterize the discount rates for each sector with a normal probability distribution Because the use of the above standard deviations yield distributions with negative values DOE truncated the lower end of the normal distribution at a discount rate of zero DOE also truncated the higher end of the normal distribution in equal proportion to the truncation at the lower end to maintain the average discount rates shown above in Table 8226
825 Effective Date of Standard
The effective date is the future date when a new standard becomes operative Based on DOErsquos implementation report for energy conservation standards activities submitted pursuant to Section 136 of the Energy Policy Act of 2005 a final rule for the commercial clothes washers being considered for this standards rulemaking is scheduled for completion no later than January 1 2010 Therefore the effective date of any new energy efficiency standards for these products will be three years after the final rule is published which is January 1 2013 The Department calculated the LCC for all consumers as if they each would purchase a new piece of equipment in the year the standard takes effect
826 Equipment Assignment for the Base Case
For purposes of conducting the LCC analysis DOE analyzed standard levels relative to a baseline efficiency level However some consumers already purchase products with efficiencies greater than the baseline levels Thus to accurately estimate the percentage of consumers that would be affected by a particular standard level DOE took into account the distribution of product efficiencies currently in the marketplace In other words rather than analyzing the impacts of a particular standard level assuming that all consumers are currently purchasing products at the baseline level DOE conducted the analysis by taking into account the full breadth of product efficiencies that consumers purchase under the base case (ie the case without new energy efficiency standards)
DOE took into account the mix of commercial clothes washer efficiencies by characterizing the current mix of product efficiencies as a probability distribution In other
8-30
EERE-2006-STD-0127 COMMENT 691
words as DOE performed the Monte Carlo simulation each standard level analyzed was evaluated against the distribution of product efficiencies in the base case
Rather than providing market share data AHAM provided shipment-weighted efficiencies of all commercial clothes washers24 That is shipment-weighted efficiencies were not provided separately for the top-loading and front-loading product classes For the year 2005 the shipment-weighted efficiencies of commercial clothes washers are 141 modified energy factor (MEF) and 1091 water factor (WF) Based on the shipment-weighted efficiency data DOE was able to derive the market share of each product class DOE assumed a bi-modal market share distribution consisting of only top-loading equipment meeting current minimum efficiency standards of 126 MEF95 WF and top-loading equipment with an efficiency of 200 MEF55 WF Thus by using a shipment-weighted efficiency of 141 MEF DOE determined that the market share of 126 MEF95 WF washers is 797 percent and the market share of 200 MEF55 WF washers is 203 percenta DOE interprets this result as indicating that in the year 2005 797 percent of the market consists of top-loading washers while 203 percent is comprised of front-loading washers
Subsequent to 2005 energy efficiency tax incentives in the Energy Policy Act of 2005 and extensions as well as new provisions in the Economic Stabilization Act of 2008 have resulted in more front-loading washers being produced by manufacturers DOE reviewed the US Securities and Exchange Commission (SEC) 10K report of the low volume manufacturer (LVM) of commercial clothes washers and determined that manufacturer tax credits in this recent federal legislation have resulted in significantly increased sales of the front-loading washers for the LVM When accounting for the LVMrsquos market share the increase in front-loading sales results in a current market share of 30 percent for front-loading washers Although tax credits are set to expire after 2010 DOE estimates that the tax credits would permanently transform the market so that front-loading washers would continue to comprise 30 percent of the market over the entire forecast period
Knowing the market share of each product class does not provide the distribution of equipment efficiencies within each class Therefore DOE relied on anther data sourcemdashthe California Energy Commission (CEC)25 As discussed in Section 3143 of Chapter 3 Market and Technology Assessment the CEC publishes the MEFs and WFs of commercial clothes washers sold in California Although the range in efficiencies is relatively wide the distribution is based on the number of available models being sold rather than the percent of shipments being sold Without any other data available DOE assumed that the distribution of available models in the CEC data were representative of actual shipments sold in the US Tables 8227 and 8228 present the market shares of the efficiency levels in the base case for top-loading and front-loading washers respectively The tables represent the equipment that establishments would have purchased in the year 2013 in the absence of new standards
a DOE did not consider the shipment-weighted average WF of 1091 in performing the market share calculation
8-31
EERE-2006-STD-0127 COMMENT 691
Table 8227 Top-Loading Commercial Clothes Washers Base Case Market Shares Standard Level MEF WF Market Share
Baseline 126 950 648 1 142 950 338 2 160 850 14
Represents units with the following MEF and WF ratings 126 le MEF lt 142 95 ge WF gt 85 Represents units with the following MEF and WF ratings 142 le MEF lt 160 95 ge WF gt 85 Represents units with the following MEF and WF ratings MEF ge 160 WF le 85
Table 8228 Front-Loading Commercial Clothes Washers Base Case Market Shares Standard Level MEF WF Market Share
Represents units with the following MEF and WF ratings 172 le MEF lt 180 80 ge WF gt 75 Represents units with the following MEF and WF ratings 180 le MEF lt 200 75 ge WF gt 55 Represents units with the following MEF and WF ratings 200 le MEF lt 220 55 ge WF gt 51 dagger Represents units with the following MEF and WF ratings 220 le MEF lt 235 51 ge WF gt 44 daggerdagger Represents units with the following MEF and WF ratings MEF ge 235 WF le 44
83 PAYBACK PERIOD INPUTS
The payback period is the amount of time it takes the consumer to recover the assumed higher purchase expense of more energy-efficient equipment as a result of lower operating costs Numerically the PBP is the ratio of the increase in purchase expense (ie from a less efficient design to a more efficient design) to the decrease in annual operating expenditures This type of calculation is known as a ldquosimplerdquo payback period because it does not take into account changes in operating expense over time or the time value of money ie the calculation is done at an effective discount rate of zero percent
The equation for PBP is
ΔICPBP =
ΔOC where
ΔIC = Difference in the total installed cost between the more efficient standard level and the baseline design and
ΔOC = difference in annual operating expenses
8-32
EERE-2006-STD-0127 COMMENT 691
Payback periods are expressed in years Payback periods greater than the life of the product mean that the increased total installed cost is not recovered in reduced operating expenses
The data inputs to PBP are the total installed cost of the equipment to the consumer for each efficiency level and the annual (first year) operating expenditures for each standard level The inputs to the total installed cost are the equipment price and the installation cost The inputs to the operating costs are the annual energy (and water) cost the annual repair cost and the annual maintenance cost The PBP uses the same inputs as the LCC analysis as described in section 82 except that energy (and water) price trends and discount rates are not required Since the PBP is a ldquosimplerdquo payback the required energy price is only for the year in which a new standard is to take effectmdashin this case the year 2013 The energy price DOE used in the PBP calculation was the price projected for that year Discount rates are also not required for the simple PBP calculation
84 LIFE-CYCLE COST AND PAYBACK PERIOD RESULTS
This section presents the LCC and PBP results for commercial clothes washers DOErsquos approach for conducting the LCC analysis relied on characterizing the uncertainty and variability of many of the inputs to the analysis with probability distributions DOE used a Monte Carlo simulation technique to perform the LCC calculations DOE calculated the average LCC and LCC savings and the median and average PBP for each of the candidate standard levels These standard levels are also referred to as candidate standard levels (CSL)
DOE calculated LCC savings and PBPs relative to the base case equipment that it assigned to commercial consumers As discussed in section 826 DOE assigned base case equipment that is more efficient than some of the CSLs For that reason the average LCC impacts are not equal to the difference between the LCC of a specific and the LCC of the baseline equipment
In the subsections below DOE presents figures showing the distribution of LCCs in the base case for each product class Also presented below for a specific are figures showing the distribution of LCC impacts and the distribution of PBPs The figures are presented as frequency charts that show the distribution of LCCs LCC impacts and PBPs with their corresponding probability of occurrence DOE generated the figures for the distributions from a Monte Carlo simulation run based on 10000 samples The LCC and PBP calculations were performed 10000 times by sampling from the probability distributions that DOE developed to characterize many of the inputs
Based on the Monte Carlo simulations that DOE performed for each standard-level DOE calculated the share of commercial consumers with a net LCC benefit with a net LCC cost and with no impact DOE considered a commercial user to receive no impact at a given if DOE assigned it base case equipment that is the same as or has higher efficiency than the CSL To
8-33
EERE-2006-STD-0127 COMMENT 691
illustrate the range of LCC and PBP impacts among the commercial clothes washer users the sections below present figures that provide such information for each product class
841 Base Case LCC Distributions
Figures 841 and 842 show the frequency charts for the base case LCC for both product applications of top-loading commercial clothes washers Figures 843 and 844 show the frequency charts for the base case LCC for both product applications of top-loading commercial clothes washersThe figures below show the mean LCC of the base case distribution as well as the full range of LCCs
Frequency Chart
Mean= $4023 000
005
009
014
018
0
4575
915
1372
183
$1629 $3170 $4711 $6252 $7793
10000 Trials 9779 Displayed
Forecast Top MF LCC Lev 0
Figure 841 Top-Loading Commercial Clothes Washers Multi-Family Application Base Case LCC Distribution
8-34
EERE-2006-STD-0127 COMMENT 691
Frequency Chart
Mean= $4182 000
004
008
012
016
0
405
81
1215
162
$2139 $3160 $4182 $5203 $6225
10000 Trials 9910 Displayed
Forecast Top Laun LCC Lev 0
Figure 842 Top-Loading Commercial Clothes Washers Laundromat Application Base Case LCC Distribution
Frequency Chart
Mean= $4220 000
004
008
013
017
0
4225
845
1267
169
$2218 $3481 $4743 $6005 $7267
10000 Trials 9777 Displayed
Forecast Front MF LCC Lev 0
Figure 843 Front-Loading Commercial Clothes Washers Multi-Family Application Base Case LCC Distribution
8-35
EERE-2006-STD-0127 COMMENT 691
Frequency Chart
Mean= $4380 000
004
008
013
017
0
42
84
126
168
$2689 $3534 $4380 $5225 $6070
10000 Trials 9907 Displayed
Forecast Front Laun LCC Lev 0
Figure 844 Front-Loading Commercial Clothes Washers Laundromat Application Base Case LCC Distribution
842 Standard-Level Distributions of LCC Impacts
Figure 845 is an example of a frequency chart showing the distribution of LCC differences for the case of CSL 2 for top-loading washers multi-family product application In the figure a text box next to a vertical line at that value on the x-axis shows the mean change in LCC (a savings of $179 in the example here) The note ldquoCertainty is 8634 from $0 to +Infinityrdquo means that 8634 percent of consumers using clothes washers will have LCC savings or not be impacted due to the CSL compared to the base case The large lsquospikersquo in Figure 845 represents the percentage of consumers that are not impacted by an increase in the CSL ie consumers that already use commercial clothes washers with efficiencies greater than or equal to the CSL Refer back to section 826 on the distribution of product efficiencies under the base case DOE can generate a frequency chart like the one shown in Figure 845 for every CSL and each product application
8-36
EERE-2006-STD-0127 COMMENT 691
Frequency Chart
Certainty is 8634 from $0 to +Infinity
Mean = $179 000
006
012
018
024
0
5875
1175
1762
235
($146) $61 $268 $474 $681
10000 Trials 9750 Displayed
Forecast To p MF LCC Sav Lev 2
Figure 845 Top-Loading Commercial Clothes Washers Multi-Family Application Distribution of LCC Impacts for CSL 2
843 Standard-Level PBP Distributions
Figure 846 is an example of a frequency chart showing the distribution of payback periods of CSL 2 for top-loading washer multi-family product application The large lsquospikersquo at the PBP value of -200 indicates the percentage of consumers using commercial clothes washers that are not impacted by an increase in the CSL ie consumers that already use top-loading commercial clothes washers with efficiencies equal to or greater than then CSL Refer back to section 826 on the distribution of product efficiencies under the base case DOE can generate a frequency chart like the one shown in Figure 846 for every CSL and each product application
8-37
EERE-2006-STD-0127 COMMENT 691
Frequency Chart
000
008
017
025
033
0
83
166
249
332
-200 232 663 1095 1526
10000 Trials 9534 Displayed
Forecast Top MF PB Lev 2
Figure 846 Commercial Clothes Washers Multi-Family Application Distribution of PBPs for CSL 3
844 LCC and PBP Results
Tables 841 and 842 show the LCC and PBP results for both product applications of top-loading commercial clothes washers Tables 843 and 844 show the LCC and PBP results for both product applications of front-loading commercial clothes washers For example in the case of the front-loading washer multi-family application CSL 2 (200 MEF550 WF) shows an average LCC savings of $195 Note that for CSL 2 approximately 96 percent of consumers in 2013 are assumed to already be using a commercial clothes washer in the base case at CSL 2 and thus have zero savings due to the standard If one compares the LCC of the base case at 172 MEF800 WF to the standards case at 200 MEF550 WF then the average LCC savings are $530 But since the base case includes a significant number of consumers that are not impacted by the standard the average savings over all of the consumers is $195 With regard to the PBPs shown below DOE determined the median and average values by excluding the percentage of households not impacted by the standard For example in the case of CSL 2 for front-loading washers about 96 percent of the consumers did not factor into the calculation of the median and average PBP
Figures 847 and 848 show the range of LCC savings for the CSLs for both product applications of top-loading commercial clothes washers Figures 849 and 8410 show the range of LCC savings for the CSLs for both product applications of front-loading commercial clothes washers For each CSL the top and the bottom of the box indicate the 75th and 25th
percentiles respectively The bar at the middle of the box indicates the median 50 percent of the households have LCC savings above this value The lsquowhiskersrsquo at the bottom and the top of the box indicate the 5th and 95th percentiles The small box shows the average LCC savings for each CSL
Figures 8411 and 8412 show the range of PBPs for top-loading commercial clothes washers Figures 8413 and 8414 show the range of PBPs for front-loading commercial clothes washers In these figures households which are not impacted by an increase in the standard are not included (this situation applies to all CSLs except CSL 4 for front-loading washers)
8-40
EERE-2006-STD-0127 COMMENT 691
Life
-cyc
le C
ost S
avin
gs ($
)
800
600
400
200
0
-200
Median
Mean
CSL 1 CSL 2
Candidate Standard Level
Figure 847 Range of LCC Savings for Top-Loading Commercial Clothes Washers Multi-Family
300
Life
-cyc
le C
ost S
avin
gs ($
) 200
100
0
-100
Median Mean
CSL 1 CSL 2
Candidate Standard Level
Figure 848 Range of LCC Savings for Top-Loading Commercial Clothes Washers Laundromat
8-41
EERE-2006-STD-0127 COMMENT 691
0
100
200
300
400
500
600
Life
-cyc
le C
ost S
avin
gs ($
)
Median Mean
CSL 1 CSL 2 CSL 3 CSL 4
Candidate Standard Level
Figure 849 Range of LCC Savings for Front-Loading Commercial Clothes Washers Multi-Family
250
Life
-cyc
le C
ost S
avin
gs ($
)
200
150
100
50
0
Median Mean
CSL 1 CSL 2 CSL 3 CSL 4
Candidate Standard Level
Figure 8410 Range of LCC Savings for Front-Loading Commercial Clothes Washers Laundromat
8-42
EERE-2006-STD-0127 COMMENT 691
60
Payb
ack
Perio
d (y
ears
) Pa
ybac
k Pe
riod
(yea
rs)
50
40
30
20
10
0
Figure 8411 Range of Payback Periods for Top-Loading Commercial Clothes Washers Multi-Family
20
Median Mean
CSL 1 CSL 2
Candidate Standard Level
Median Mean
CSL 1 CSL 2
Candidate Standard Level
15
10
5
0
Figure 8412 Range of Payback Periods for Top-Loading Commercial Clothes Washers Laundromat
8-43
EERE-2006-STD-0127 COMMENT 691
0
1
2
3
4
5
6
7
8
CSL 1 CSL 2 CSL 3 CSL 4
Candidate Standard Level
Payb
ack
Perio
d (y
ears
)
Median Mean
Figure 8413 Range of Payback Periods for Front-Loading Commercial Clothes Washers Multi-Family
00
05
10
15
20
25
30
CSL 1 CSL 2 CSL 3 CSL 4
Candidate Standard Level
Payb
ack
Perio
d (y
ears
)
Median Mean
Figure 8414 Range of Payback Periods for Front-Loading Commercial Clothes Washers Laundromat
8-44
EERE-2006-STD-0127 COMMENT 691
85 REBUTTABLE PAYBACK PERIOD
DOE presents rebuttable PBPs to provide the legally established rebuttable presumption that an energy efficiency standard is economically justified if the additional product costs attributed to the standard are less than three times the value of the first-year energy cost savings (42 USC sect6295 (o)(2)(B)(iii))
851 Metric
The basic equation for rebuttable PBP is the same as that shown in section 83 Payback Period Inputs Unlike the analyses described in sections 82 and 83 however the rebuttable PBP is not based on the use of household samples and probability distributions Rather than distributions the rebuttable PBP is based on discrete single-point values For example while DOE uses a probability distribution of regional energy prices in the distributional payback period analysis it uses only the national average energy price from the probability distribution to determine the rebuttable PBP
Other than the use of single-point values the most notable difference between the distribution PBP and the rebuttable PBP is the latterrsquos reliance on the DOE test procedure to determine a productrsquos annual energy and water consumption The following identifies the differences between the annual energy and water consumptions determined for the distribution PBP and the rebuttable PBP
DOE based the annual energy and water consumption values that it used to determine the rebuttable PBP on the number of cycles per year specified in the DOE test procedure 26 The commercial clothes washer test procedure cites the residential clothes washer test procedure to establish efficiency ratings as well as annual energy and water consumption As a result the annual number of use cycles 392 cycles per year for determining the annual energy and water consumption of commercial clothes washers is representative of residential use not commercial use Because residential use is significantly lower than the average usage for commercial applicationsmdash1241 cycles per year in multi-family buildings and 2190 cycles per year in laundromatsmdashthe average annual energy and water consumption used to determine rebuttable PBP will be significantly less than the consumption associated with actual usage As a result the rebuttable PBP will be significantly longer than the distribution PBPs for both multi-family and laundromat applications
852 Inputs
Inputs for the rebuttable PBP differ from the distribution PBP in that the calculation uses discrete values rather than distributions for inputs Note that for the calculation of distribution PBP because inputs for the determination of total installed cost were based on single-point values only the variability andor uncertainty in the inputs for determining operating cost contributed to variability in the distribution PBPs The following summarizes the single-point values that DOE used in the determination of the rebuttable PBP
8-45
EERE-2006-STD-0127 COMMENT 691
bull Manufacturing costs markups sales taxes and installation costs were all based on the single-point values used in the distributional LCC and PBP analysis
bull As described in section 851 annual energy and water consumption is based on the DOE test procedure
bull Energy and water prices are based on national average values for the year that new standards are assumed to take effect
bull An average discount rate or lifetime is not required in the rebuttable PBP calculation
bull The effective date of the standard is assumed to be 2013
853 Results
DOE calculated rebuttable PBPs for each CSL relative to the distribution of product efficiencies assumed for the base case (refer back to section 826 for more details on the base case efficiency distributions for each product) In other words DOE did not determine the rebuttable PBP relative to the baseline efficiency level but relative to the current distribution of product efficiencies DOE determined for the base case (ie the case without new standards) The following sections present the results for the sets of products being analyzed for this standards rulemaking
Tables 851 and 852 present the rebuttable PBPs for top-loading commercial clothes washers under both product applications multi-family buildings and laundromats Tables 853 and 854 present the rebuttable PBPs for front-loading commercial clothes washers under both product applications multi-family buildings and laundromats
1 US Department of Energy-Office of Energy Efficiency and Renewable Energy Energy Conservation Standards for Certain Consumer Products (Dishwashers Dehumidifiers Microwave Ovens and Electric and Gas Kitchen Ranges and Ovens) and for Certain Commercial and Industrial Equipment (Commercial Clothes Washers) Final Rule Federal Register 2009 74(66) pp 16040-16096
2 US Department of Energy-Office of Energy Efficiency and Renewable Energy Technical Support Document Energy Efficiency Program for Consumer Products and Commercial and Industrial Equipment Residential Dishwashers Dehumidifiers Cooking Products and Commercial Clothes Washers March 2009 Washington DC lthttpwww1eereenergygovbuildingsappliance_standardsresidentialcooking_prod ucts_final_rule_tsdhtmlgt
3 Association of Home Appliance Manufacturers AHAM 2005 Fact Book 2005 Washington DC
4 RS Means Mechanical Cost Data 31st Annual Edition 2008 Kingston MA
5 Consortium for Energy Efficiency Commercial Family-Sized Washers An Initiative Description of the Consortium for Energy Efficiency 1998 Boston MA lthttpwwwcee1orgcomcwshcwsh-mainphp3gt
6 US Department of Energy-Energy Information Administration Form EIA-861 for 2007 2007 Washington DC lthttpwwweiadoegovcneafelectricitypageeia861htmlgt
7 US Census Bureau Population estimates Population Population change and estimated components of population change April 1 2000 to July 1 2005 2006 Washington DC lthttpwwwcensusgovpopestdatasetshtmlgt
8 US Department of Energy-Energy Information Administration Natural Gas Monthly 2007 Washington DC lthttpwwweiadoegovoil_gasnatural_gasdata_publicationsnatural_gas_monthlyngmhtmgt
9 Raftelis Financial Consultants Inc 2006 RFCAWWA Water and Wastewater Rate Survey 2006 Charlotte NC Kansas City MO and Pasadena CA lthttpwwwrafteliscomratessurveyhtmlgt
10 US Department of Energy-Energy Information Administration An Updated Annual Energy Outlook 2009 Reference Case Reflecting Provisions of the American Recovery and Reinvestment Act and Recent Changes in the Economic Outlook April 2009 Washington DC SROIAF2009-03 lthttpwwweiadoegovoiafservicerptstimuluspdfsroiaf(2009)03pdfgt
8-48
EERE-2006-STD-0127 COMMENT 691
11 US Department of Energy-Energy Information Administration Annual Energy Outlook 2009 with Projections to 2030 March 2009 Washington DC DOEEIA-0383(2009) lthttpwwweiadoegovoiafaeopdf0383(2009)pdfgt
12 US Department of Labor-Bureau of Labor Statistics Consumer Price Indexes Item Water and sewerage maintenance Series Id CUUR0000SEHG01 US city average (not seasonally adjusted) 2008 Washington DC lthttpwwwblsgovcpihomehtmdatagt
13 Whirlpool Corporation Comment of Whirlpool Corporation Regarding the ANOPR for Cooking Products and Commercial Clothes Washers Docket Number EE-206-STD-2007 RIN 1904-AB49
14 US Department of Energy Technical Support Document Energy Efficiency Standards for Consumer Products Residential Central Air Conditioners and Heat Pumps May 2002 Washington DC Chapter 5 lthttpwwweereenergygovbuildingsappliance_standardsresidentialac_central_1000_rhtmlgt
15 Coin Laundry Association Industry Overview Downers Grove IL lthttpwwwcoinlaundryorgresourcesindustryoverviewcfmgt
16 Southern California Edison 2004-2005 Database for Energy Efficiency Resources (DEER) Update Study Final Report December 2005 Prepared for Southern California Edison by Itron Inc Vancouver WA lthttpwwwcalmacorgpublications2004-05_DEER_Update_Final_Report-Wopdfgt
17 Sullivan GP J W Currie TC Hillman and GB Parker High-Performance Clothes Washer Demonstration at Leisure World Laguna Woods Final Report December 2000 Prepared for Southern California Edison Company by Battelle Pacific Northwest Laboratory Richland WA lthttpeerepnlgovbuilding-technologiesdocscefinal202-22-01pdfgt
18 California Measurement Advisory Committee CALMAC Protocols Appendix F Effective Useful Live Values for Major Energy Efficiency Measures September 2000 lthttpwwwcalmacorgeventsAPX_Fpdfgt
19 Ibbotsons Associates Cost of Capital 2001 Yearbook Data Through March 2001 2001 Chicago IL
20 Damodaran Online The Data Page Cost of Capital by Industry Sector 2006 lthttppagessternnyuedu~adamodargt
21 Ibbotsons Associates Statistics for SIC code 72 2006 lthttpwwwibbotsoncomgt
8-49
EERE-2006-STD-0127 COMMENT 691
22 Ibbotsons Associates SBBI Valuation Edition 2001 Yearbook 2001 Chicago IL pp 38 44
23 US Government Printing Office Economic Report of the President 2006 2006 Washington DC lthttpwwwgpoaccessgoveopindexhtmlgt
24 Association of Home Appliance Manufacturers AHAM Data on Commercial Clothes Washers for DOE Efficiency Standards Rulemaking October 12 2006 Letter to Building Technologies Program US Department of Energy
25 California Energy Commission Appliances Databases ndash Clothes Washers 2009 Sacramento CA lthttpwwwenergycagovappliancesdatabaseexcel_based_filesClothes_Washersgt (Last Accessed February 5 2009)
26 US Office of the Federal Register Code of Federal Regulations Title 10 Part 431 -Energy Conservation Program for Certain Commercial and Industrial Equipment Subpart ImdashCommercial Clothes Washers January 1 2007 Washington DC
8-50
EERE-2006-STD-0127 COMMENT 691
CHAPTER 8 LIFE-CYCLE COST AND PAYBACK PERIOD ANALYSIS
81 INTRODUCTION
811 General Approach for LCC and PBP Analysis
812 Overview of LCC and PBP Inputs
82 LIFE-CYCLE COST INPUTS
821 Total Installed Cost Inputs
8212 Baseline Manufacturer Cost
8213 Standard-Level Manufacturer Cost Increases
8214 Overall Markup
8215 Installation Cost
8216 Total Installed Cost
822 Operating Cost Inputs
8221 Annual Energy and Water Consumption
8222 Energy and Water Prices
8223 Energy and Water Price Trends
8224 Repair and Maintenance Costs
823 Product Lifetime
824 Discount Rates
825 Effective Date of Standard
826 Equipment Assignment for the Base Case
83 PAYBACK PERIOD INPUTS
84 LIFE-CYCLE COST AND PAYBACK PERIOD RESULTS
841 Base Case LCC Distributions
842 Standard-Level Distributions of LCC Impacts
843 Standard-Level PBP Distributions
844 LCC and PBP Results
85 REBUTTABLE PAYBACK PERIOD
851 Metric
852 Inputs
853 Results
CHAPTER 8 LIFE-CYCLE COST AND PAYBACK PERIOD ANALYSIS
81 INTRODUCTION
This chapter describes the Department of Energy (DOE)rsquos methodology for analyzing the economic impacts of possible energy efficiency standards on individual consumers The effect of standards on individual consumers includes a change in operating expense (usually decreased) and a change in purchase price (usually increased) This chapter describes three metrics DOE used in the consumer analysis to determine the effect of standards on individual consumers
bull Life-cycle cost (LCC) is the total consumer expense over the life of an appliance including purchase expense and operating costs (including energy expenditures) DOE discounts future operating costs to the time of purchase and sums them over the lifetime of the equipment
bull Payback period (PBP) measures the amount of time it takes customers to recover the assumed higher purchase price of more energy-efficient equipment through lower operating costs
bull Rebuttable payback period is a special case of the PBP Where LCC and PBP are estimated over a range of inputs reflecting actual conditions rebuttable payback period is based on laboratory conditions specifically DOE test procedure inputs
Inputs to the LCC and PBP are discussed in sections 82 and 83 respectively of this chapter Results for the LCC and PBP are presented in section 84 The rebuttable PBP is discussed in section 85 Key variables and calculations are presented for each metric DOE performed the calculations discussed here using a series of Microsoft Excelreg spreadsheets which are accessible on the Internet (httpwwweereenergygovbuildingsappliance_standards) Details and instructions for using the spreadsheets are discussed in Appendix 8A
This chapter presents information and results pertaining solely to CCWs As described in section 13 of chapter 1 of this technical support document (TSD) DOE is continuing the rulemaking for energy conservation standards for microwave oven standby power and analyses related to these products will be published in a separate TSD In addition DOE issued a final rule1 adopting energy conservation standards for conventional cooking products (ie cooktops and ovens) and microwave oven energy factor (EF) and details of the analyses for these products are contained in the corresponding final rule TSD2
811 General Approach for LCC and PBP Analysis
Recognizing that several inputs to the determination of consumer LCC and PBP are either variable or uncertain DOE conducted the LCC and PBP analysis by modeling both the uncertainty and variability in the inputs using Monte Carlo simulation and probability
8-1
EERE-2006-STD-0127 COMMENT 691
distributions A detailed explanation of Monte Carlo simulation and the use of probability distributions is contained in Appendix 8B DOE developed LCC and PBP spreadsheet models incorporating both Monte Carlo simulation and probability distributions by using Microsoft Excelreg spreadsheets combined with Crystal Ballreg (a commercially available add-in program)
As described in Chapter 6 DOE established the variability and uncertainty in energy and water use by defining the uncertainty and variability in the usage (in cycles per day) of the equipment As will be described later in this chapter the variability and uncertainty in energy and water pricing are characterized by regional differences in energy and water prices
DOE displays the LCC and PBP results as distributions of impacts compared to the baseline conditions Results are presented at the end of this chapter and are based on 10000 samples per Monte Carlo simulation run To illustrate the implications of the analysis DOE generated a frequency chart depicting the variation in LCC and PBP for each standard level considered
812 Overview of LCC and PBP Inputs
The LCC is the total consumer expense over the life of the equipment including purchase expense and operating expense (including energy expenditures) DOE discounts future operating expenses to the time of purchase and sums them over the lifetime of the equipment The PBP is the change in purchase expense due to an increased efficiency standard divided by the change in annual operating expense that results from the standard It represents the number of years it will take the customer to recover the increased purchase expense through decreased operating expenses
DOE categorizes inputs to the LCC and PBP analysis as follows (1) inputs for establishing the purchase expense otherwise known as the total installed cost and (2) inputs for calculating the operating cost
The primary inputs for establishing the total installed cost are
bull Baseline manufacturer cost The costs incurred by the manufacturer to produce equipment meeting existing minimum efficiency standards
bull Standard-level manufacturer cost increases The change in manufacturer cost associated with producing equipment to meet a particular standard level
bull Markups and sales tax The markups and sales tax associated with converting the manufacturer cost to a consumer equipment price The markups and sale tax are described in detail in Chapter 7 Markups for Equipment Price Determination
bull Installation cost The cost to the consumer of installing the equipment The installation cost represents all costs required to install the equipment other than the marked-up consumer equipment price The installation cost includes labor overhead and any
8-2
EERE-2006-STD-0127 COMMENT 691
miscellaneous materials and parts Thus the total installed cost equals the consumer equipment price plus the installation cost
The primary inputs for calculating the operating cost are
bull Equipment energy and water consumption The equipment energy consumption is the site energy use associated with operating the equipment The water consumption is the site water use associated with operating the equipment Chapter 6 Energy and Water Use Determination details how DOE determined the equipment energy and water consumption based on various data sources
bull Equipment efficiency The equipment efficiency dictates the equipment energy and water consumption associated with standard-level equipment (ie equipment with efficiencies greater than baseline equipment) Chapter 6 Energy and Water Use Determination details how energy and water consumption change with increasing equipment efficiency
bull Energy and water prices Energy and water prices are the prices paid by consumers for energy (ie electricity gas or oil) and water DOE determined current energy prices based on data from the DOE- EIA DOE determined water prices based on data from the American Water Works Association (AWWA)
bull Energy and water price trends DOE used the EIA Annual Energy Outlook 2009 (AEO2009) to forecast energy prices into the future For the results presented in this chapter DOE used the AEO2009 reference case to forecast future energy prices DOE used consumer price index data specific to water and sewerage maintenance from the Bureau of Labor Statistics as the basis for its water price trend
bull Repair and maintenance costs Repair costs are associated with repairing or replacing components that have failed Maintenance costs are associated with maintaining the operation of the equipment
bull Lifetime The age at which the equipment is retired from service
bull Discount rate The rate at which DOE discounted future expenditures to establish their present value
Figure 811 graphically depicts the relationships between the installed cost and operating cost inputs for the calculation of the LCC and PBP In the figure below the yellow boxes indicate the inputs the green boxes indicate intermediate outputs and the blue boxes indicate the final outputs (the LCC and PBP)
8-3
EERE-2006-STD-0127 COMMENT 691
Baseline Manufacturer
Cost
Std-Level Manufacturer
Cost
Manufacturer Markup
Retailer or Distributor
Markup
Sales Tax
Installation Cost
Total Installed Cost
Water Prices
Energy and Water
Consumption
Equipment Price
Lifetime Operating Expense
Annual Energy and Water Expense
Lifetime Repair and Maintenance
Cost
Discount Rate
Energy and Water Price
Trends
Annual Operating Expense
Payback Period
Life-Cycle Cost
Energy Prices
Figure 811 Flow Diagram of Inputs for the Determination of LCC and PBP
Table 811 summarizes the input values that DOE used to calculate the LCC and PBP Each table summarizes the total installed cost inputs and the operating cost inputs including the lifetime discount rate and energy and water price trends DOE characterized all of the total cost inputs with single-point values but characterized several of the operating cost inputs with probability distributions that capture the inputrsquos uncertainty andor variability For those inputs characterized with probability distributions the values provided in the following tables are the average or typical values Also listed in the following tables is the section of the technical support document (TSD) where more detailed information on the inputs can be found
8-4
EERE-2006-STD-0127 COMMENT 691
Table 811 LCC and PBP Input Summary
Input Product Class Average or Typical Value Characterization
TSD Section Reference
Total Installed Cost Inputs
Baseline Manufacturer Cost
Top-Loading 126 MEF950 WF = $29630 Single-Point Value
8212 Front-Loading 172 MEF800 WF = $61102 Single-Point Value
Energy Prices Both Elec = 108 centkWh Gas = 1189 $MMBtu Single-Point Value 8222
Water and Wastewater Prices Both Water = 229 $103 gallon
Wastewater = 297 $103 gallon Singe-Point Value 8222
Repair and Maintenance Costs Both Annualized repair cost =
frac12 Equipment price Lifetime Single-Point Value 8224
Lifetime Both Multi-Family = 1125 years Laundromat = 7125 years Weibull distribution 823
Discount Rate Both 57 Custom distribution 824
Energy Price Trend Both AEO 2009 Reference Case Two sensitivities High amp Low Growth Cases 8223
Water and Wastewater Price Trend Both Bureau of Labor Statistics
Water and sewerage CPI Single forecast 8223
Annual use based on electric water heating and electric clothes drying Annual use provided for baseline product only Annual use decreases with increased product efficiency
8-5
EERE-2006-STD-0127 COMMENT 691
82 LIFE-CYCLE COST INPUTS
Life-cycle cost is the total customer expense over the life of an appliance including purchase expense and operating costs (including energy expenditures) DOE discounts future operating costs to the time of purchase and sums them over the lifetime of the equipment DOE defines LCC by the following equation
N OCtLCC = IC +sum t(1+ r) where
t=1
LCC = Life-cycle cost in dollars IC = Total installed cost in dollars sum = Sum over the lifetime from year 1 to year N N = Lifetime of appliance in years OC = Operating cost in dollars r = Discount rate and t = Year for which operating cost is being determined
DOE expresses dollar values in 2008$
The following sections discuss total installed cost operating cost lifetime and discount rate
821 Total Installed Cost Inputs
DOE defines the total installed cost using the following equation
IC = EQP + INST where
EQP = Equipment price (ie customer price for the equipment only) expressed in dollars and
INST = Installation cost or the customer price to install equipment (ie the cost for labor and materials) also in dollars
The equipment price is based on how the consumer purchases the equipment As discussed in Chapter 7 Markups for Equipment Price Determination DOE defined markups and sales taxes for converting manufacturing costs into consumer equipment prices
Table 821 summarizes the inputs for the determination of total installed cost
8-6
EERE-2006-STD-0127 COMMENT 691
Table 821 Inputs for Total Installed Cost Baseline Manufacturer Cost
Standard-Level Manufacturer Cost
Manufacturer Markup
Retailer or Distributor Markup
Sales Tax
Installation Cost
The baseline manufacturer cost is the cost incurred by the manufacturer to produce equipment meeting existing minimum efficiency standards Standard-level manufacturer cost increases are the change in manufacturer cost associated with producing equipment at a standard level Markups and sales tax convert the manufacturer cost to a consumer equipment price The installation cost is the cost to the consumer of installing the equipment and represents all costs required to install the equipment other than the marked-up consumer equipment price The installation cost includes labor overhead and any miscellaneous materials and parts Thus the total installed cost equals the consumer equipment price plus the installation cost DOE calculated the total installed cost for baseline products based on the following equation
IC BASE = EQPBASE + INSTBASE
= COSTMFG times MUOVERALL _ BASE + INSTBASE
where
ICBASE = Baseline total installed cost EQPBASE = Consumer equipment price for baseline models INSTBASE = Baseline installation cost COSTMFG = Manufacturer cost for baseline models and MUOVERALL_BASE = Baseline overall markup (product of manufacturer markup baseline
retailer or distributor markup and sales tax)
DOE calculated the total installed cost for standard-level products based on the following equation
= IC BASE + (ΔCOSTMFG times MUOVERALL _ INCR + ΔINSTSTD ) where
8-7
EERE-2006-STD-0127 COMMENT 691
ICSTD = Standard-level total installed cost EQPSTD = Consumer equipment price for standard-level models INSTSTD = Standard-level installation cost EQPBASE = Consumer equipment price for baseline models ΔEQPSTD = Change in equipment price for standard-level models INSTBASE = Baseline installation cost ΔINSTSTD = Change in installation cost for standard-level models ICBASE = Baseline total installed cost ΔCOSTMFG = Change in manufacturer cost for standard-level models and MUOVERALL_INCR = Incremental overall markup (product of manufacturer markup
incremental retailer or distributor markup and sales tax)
The remainder of this section provides information about each of the above input variables that DOE used to calculate the total installed cost for cooking products dishwashers dehumidifiers and commercial clothes washers
8212 Baseline Manufacturer Cost
DOE used residential clothes washer data from AHAMrsquos 2005 Fact Book to develop the baseline manufacturer costs for top-loading commercial clothes washers3 According to the AHAM 2005 Fact Book in the year 2005 total clothes washer sales equaled $3373042 million while total industry shipments equaled 9394 million DOE divided total sales by total shipments to arrive at an average manufacturer price of $35906 Based on a manufacturer markup of 126 as determined in section 72 of Chapter 7 Markups for Equipment Price Determination DOE arrived at a baseline manufacturer cost of $28497 in 2006$ As detailed in Chapter 5 Engineering Analysis DOE estimated the cost difference between top-loading and front-loading washers to arrive at the baseline manufacturer cost for front-loading washers Table 822 presents the baseline manufacturer cost as well as the associated baseline modified energy factor and water factor
DOE used a combination of cost data submitted by AHAM and a reverse engineering analysis to develop commercial clothes washer manufacturer cost increases associated with increases in product standard levels Refer to Chapter 5 Engineering Analysis for details Tables 823 and 824 present the standard-level manufacturer cost increases as well as the
8-8
EERE-2006-STD-0127 COMMENT 691
associated modified energy factors and water factors for top-loading and front-loading washers respectively
The overall markup is the value determined by multiplying the manufacturer and retailer markups and the sales tax together to arrive at a single markup value Table 825 shows the overall baseline and incremental markups for commercial clothes washers Refer to Chapter 7 Markups for Equipment Price Determination for details
DOE derived baseline installation costs for commercial clothes washers from data in the RS Means Mechanical Cost Data 20084 This book provides estimates on the labor required to install commercial clothes washers Table 826 summarizes the nationally representative
8-9
EERE-2006-STD-0127 COMMENT 691
average costs associated with the installation of a four-cycle coin operating commercial clothes washer as presented in RS Means Mechanical Cost Data Table 826 provides both bare costs (ie costs before OampP) and installation costs including OampP DOE determined that installation costs would not be impacted with increased standard levels
Table 826 Commercial Clothes Washers Baseline Installation Costs Bare Costs (2005$) Including Overhead amp Profit (2005$)
Installation Type Material Labor Total Total Material Labor Average $1100 $125 $1225 $1400 $1210 $190
Average (2008$) $190 Material costs including OampP equal bare costs plus 10 profit DOE derived labor cost including OampP by subtracting material with OampP from total with OampP Source RS Means Mechanical Cost Data 2008
8216 Total Installed Cost
The total installed cost is the sum of the consumer equipment price and the installation cost Refer back to section 821 to see the equations that DOE used to calculate the total installed cost for baseline and standard-level products
Tables 827 and 828 present the consumer equipment price installation costs and total installed costs for top-loading and front-loading washers respectively Prices and costs are presented at the baseline level and each standard level
Table 827 Top-Loading Commercial Clothes Washers Consumer Equipment Prices Installation Costs and Total Installed Costs
DOE defines the operating cost by the following equation
OC = EC +WC + RC + MC where
EC = Energy expenditure associated with operating the equipment WC = For dishwashers and commercial clothes washers the water expenditure
associated with operating the equipment RC = Repair cost associated with component failure and MC = Service cost for maintaining equipment operation
Table 829 shows the inputs for determining the operating costs The inputs listed in Table 829 are also necessary for determining lifetime operating expenses which include the energy price trends (and water price trends) product lifetime discount rate and effective date of the standard
Table 829 Inputs for Operating Cost Annual Energy (and Water) Consumption
Energy and Water Prices
Repair and Maintenance Costs
Energy and Water Price Trends
Product Lifetime
Discount Rate
Effective Date of Standard
The annual energy consumption is the site energy use associated with operating the equipment The annual water consumption which is applicable to commercial clothes washers is the site water use associated with operating the equipment The annual energy (and water)
8-11
EERE-2006-STD-0127 COMMENT 691
__ __
consumption vary with the product efficiency That is the energy and water consumption associated with standard-level equipment (ie equipment with efficiencies greater than baseline equipment) are less than the consumptions associated with baseline equipment Energy and water prices are the prices paid by consumers for energy (ie electricity gas or oil) and water Multiplying the annual energy and water consumption by the energy and water prices yields the annual energy cost and water cost respectively Repair costs are associated with repairing or replacing components that have failed Maintenance costs are associated with maintaining the operation of the equipment DOE used energy and water price trends to forecast energy and water prices into the future and along with the product lifetime and discount rate to establish the lifetime energy and water costs The product lifetime is the age at which the equipment is retired from service The discount rate is the rate at which DOE discounted future expenditures to establish their present value DOE calculated the operating cost for baseline products based on the following equation
OC = EC +WC + RC + MCBASE BASE BASE BASE BASE
= AEC times PRICE + AWC times PRICE + RC + MCBASE ENERGY BASE WATER BASE BASE
where
OCBASE = Baseline operating cost ECBASE = Energy expenditure associated with operating the baseline equipment WCBASE = For commercial clothes washers the water expenditure associated with
operating the baseline equipment RCBASE = Repair cost associated with component failure for the baseline
equipment MCBASE = Service cost for maintaining baseline equipment operation AECBASE = Annual energy consumption for baseline equipment PRICEENERGY = Energy price AWCBASE = Annual water consumption for baseline equipment and PRICEWATER = Water price
DOE calculated the operating cost for standard-level products based on the following equation
OC = EC +WC + RC + MCSTD STD STD STD STD
= AEC times PRICE + AWC times PRICE + RC + MCSTD ENERGY STD WATER STD STD
= (AEC BASE ΔAEC STD )times PRICE ENERGY + (AWC BASE ΔAWC STD )times PRICEWATER
( + RC ) ( + ΔMC+ RC BASE Δ STD + MC BASE STD )
where
OCSTD = Standard-level operating cost ECSTD = Energy expenditure associated with operating standard-level equipment
8-12
EERE-2006-STD-0127 COMMENT 691
WCSTD = For commercial clothes washers the water expenditure associated with operating standard-level equipment
RCSTD = Repair cost associated with component failure for standard-level equipment
MCSTD = Service cost for maintaining standard-level equipment operation AECSTD = Annual energy consumption for standard-level equipment PRICEENERGY = Energy price AWCSTD = Annual water consumption for standard-level equipment PRICEWATER = Water price ΔAECSTD = Change in annual energy consumption caused by standard-level
equipment ΔAWCSTD = Change in annual water consumption caused by standard-level
equipment ΔRCSTD = Change in repair cost caused by standard-level equipment and ΔMCSTD = Change in maintenance cost caused by standard-level equipment
The remainder of this section provides information about each of the above input variables that DOE used to calculate the operating costs for cooking products dishwashers dehumidifiers and commercial clothes washers
8221 Annual Energy and Water Consumption
Chapter 6 Energy and Water Use Determination details how DOE determined the annual energy and water consumption for baseline and standard-level products
DOE characterized the variability of commercial clothes washer usage based on several studies For multi-family product applications DOE equally weighted each study to establish the variability For laundromat applications DOE used a range of values varying from three to eight cycles per day Refer back to Chapter 6 section 64 to review how DOE characterized commercial clothes washer usage variability
The tables presented below are based on the energy and water use determination analysis described in Chapter 6 Keep in mind that the annual energy and water consumption values in the tables below are averages DOE captured the variability in energy (and water) consumption when it conducted its LCC and PBP analysis
Tables 8210 and 8211 provide the average annual energy and water consumption by efficiency level for top-loading commercial clothes washers Tables 8212 and 8213 provide the average annual energy and water consumption by efficiency level for front-loading commercial clothes washers DOE presents annual consumption based on two applications multi-family housing and laundromats The tables below are similar to Tables 632 through 635 in section 63 from Chapter 6 with the exception that in the tables below the electric and gas water heating and drying consumptions take into account the percentage of buildings in the US that use electric and gas water heaters and dryers In others words the electric and gas water heating and drying consumption in Tables 8210 through 8213 are weighted by the share
8-13
EERE-2006-STD-0127 COMMENT 691
of buildings that use electric and gas water heaters and dryers Based on data from the Consortium for Energy Efficiency (CEE) 5 the shares of electric and gas water heating and drying in multi-family applications are 20 percent and 80 percent electric and gas water heating respectively and 40 percent and 60 percent electric and gas drying respectively Also based on CEE data 100 percent of laundromats use gas water heating and drying
Table 8210 Top-Loading Commercial Clothes Washers Multi-Family Application Annual Energy and Water Use by Efficiency Level
Standard Level
MEF WF
Annual Energy Use Annual
Water Use Water Heating Drying
MachineElectric Gas Electric Gas cuftkWhcyc galcuft kWhyr MMBtuyr kWhyr MMBtuyr kWhyr 1000 galyear
Annual usage based on 34 cycles per day (1241 cycles per year) Electric and gas water heating based on water heater efficiencies of 100 for electric and 75 for gas Water
heater consumption is weighted by the share of buildings with electric (20) and gas (80) water heaters Dryer consumption is weighted by the share of buildings with electric (40) and gas (60) dryers
Table 8211 Top-Loading Commercial Clothes Washers Laundromat Application Annual Energy and Water Use by Efficiency Level
Standard Level
MEF WF
Annual Energy Use Annual
Water Use Water Heating Drying
MachineElectric Gas Electric Gas cuftkWhcyc galcuft kWhyr MMBtuyr kWhyr MMBtuyr kWhyr 1000 galyear
Annual usage based on 6 cycles per day (2190 cycles per year) Electric and gas water heating based on water heater efficiencies of 100 for electric and 75 for gas Water
heater consumption is weighted by the share of buildings with electric (0) and gas (100) water heaters Dryer consumption is weighted by the share of buildings with electric (0) and gas (100) dryers
8-14
EERE-2006-STD-0127 COMMENT 691
Table 8212 Front-Loading Commercial Clothes Washers Multi-Family Application Annual Energy and Water Use by Efficiency Level
Standard Level
MEF WF
Annual Energy Use Annual
Water Use Water Heating Drying
MachineElectric Gas Electric Gas cuftkWhcyc galcuft kWhyr MMBtuyr kWhyr MMBtuyr kWhyr 1000 galyear
Annual usage based on 34 cycles per day (1241 cycles per year) Electric and gas water heating based on water heater efficiencies of 100 for electric and 75 for gas Water
heater consumption is weighted by the share of buildings with electric (20) and gas (80) water heaters Dryer consumption is weighted by the share of buildings with electric (40) and gas (60) dryers
Table 8213 Front-Loading Commercial Clothes Washers Laundromat Application Annual Energy and Water Use by Efficiency Level
Standard Level
MEF WF
Annual Energy Use Annual
Water Use Water Heating Drying
MachineElectric Gas Electric Gas cuftkWhcyc galcuft kWhyr MMBtuyr kWhyr MMBtuyr kWhyr 1000 galyear
Annual usage based on 6 cycles per day (2190 cycles per year) Electric and gas water heating based on water heater efficiencies of 100 for electric and 75 for gas Water
heater consumption is weighted by the share of buildings with electric (0) and gas (100) water heaters Dryer consumption is weighted by the share of buildings with electric (0) and gas (100) dryers
8222 Energy and Water Prices
DOE derived energy prices for 13 geographic areas in the US and derived water prices for the four Census regions Using these data DOE analyzed the variability of energy and water prices at the regional level for cooking products and commercial clothes washers
DOE characterized energy and water price regional variability with probability distributions It based the probability associated with each regional energy and water price on the population weight of each region
8-15
EERE-2006-STD-0127 COMMENT 691
The methodology that DOE used for deriving the energy and water prices is presented below Included are tables that summarize the regional energy and water prices for each product
Energy Prices DOE derived average energy prices from data from EIA DOE calculated prices for each
of 13 geographic areas the nine US Census divisions with four large States (New York Florida Texas and California) treated separately For Census divisions containing one of these large States DOE calculated the regional average values leaving out data for the large Statemdashfor example the Pacific region average does not include California and the West South Central does not include Texas
Commercial Electricity Prices DOE estimated electricity prices for commercial consumers in each of the above
geographic areas using EIA Form 861 data6 These data are published annually and include annual electricity sales in kilowatt hours (kWh) revenues from electricity sales and number of consumers for the residential commercial and industrial sectors for every utility serving final consumers The calculation of an average residential electricity price proceeds in two steps
1 For each utility estimate an average residential price by dividing the residential revenues by residential sales
2 Calculate a regional average price weighting each utility with customers in a region by the number of residential consumers served in that region
Table 8214 shows the results for each geographic region
8-16
EERE-2006-STD-0127 COMMENT 691
Table 8214 Average Commercial Electricity Prices in 2007 Geographic Area Average Price (2007$kWh) New England $0148 Middle Atlantic (excludes NY) $0107 East North Central $0088 West North Central $0072 South Atlantic (excludes FL) $0082 East South Central $0083 West South Central (excludes TX) $0082 Mountain $0081 Pacific (excludes CA) $0091 New York $0163 Florida $0131 Texas $0115 California $0098 Source EIA Form 861
Table 8215 shows the national average commercial electricity prices for commercial clothes washers based on the relative residential consumer weight of each geographic area DOE used 2006 population estimates from the US Census as a proxy to estimate how the national saturation of commercial clothes washers was distributed over the 13 geographic areas7
Because DOE conducted the LCC and PBP analysis in 2008$ all electricity prices are in 2008$ To perform the necessary monetary conversion DOE used the GDP to convert the electricity prices from 2007$ to 2008$
8-17
EERE-2006-STD-0127 COMMENT 691
Table 8215 Average Commercial Electricity Prices for Commercial Clothes Washers in 2008
Geographic Area Average Price
(2008$kWh) Saturations New England $0156 48 Middle Atlantic (excludes NY) $0114 71 East North Central $0093 155 West North Central $0076 67 South Atlantic (excludes FL) $0087 130 East South Central $0088 59 West South Central (excludes TX) $0087 36 Mountain $0085 70 Pacific (excludes CA) $0096 40 New York $0172 64 Florida $0139 60 Texas $0121 79 California $0104 122 National Average Price (2008$kWh) $0108 - Saturations based on 2006 population estimates from Census
Converted to 2008$ by multiplying costs in 2007$ by the ratio of 2008 GDP (11981) to 2007 GDP (11727) Converted the price for year 2007 to the price in 2008 by multiplying the 2007 price by the ratio of the average AEO electricity price in 2008 (2906 $MMBtu) to average AEO electricity price in 2007 (2803 $MMBtu)
Commercial Natural Gas Prices DOE obtained the data for the natural gas price calculation from the EIA publication
Natural Gas Monthly8 This publication includes a compilation of monthly natural gas delivery volumes and average consumer prices by State for residential commercial and industrial customers The Department used the complete annual data for 2007 to calculate an average annul price for each area The calculation of average prices proceeds in two steps
1 Calculate the annul price for each State using a simple average over the appropriate months
2 Calculate a regional price weighting each State in a region by its population
This method differs from the method used to calculate electricity prices because EIA does not provide consumer- or utility-level data on gas consumption and prices The commercial price units in Table 8216 are in dollars per thousand cubic feet ($tcf)
8-18
EERE-2006-STD-0127 COMMENT 691
Table 8216 Average Commercial Natural Gas Prices in 2007 Geographic Area Average Price (2007$tcf) New England $1412 Middle Atlantic (excludes NY) $1249 East North Central $1086 West North Central $1089 South Atlantic (excludes FL) $1294 East South Central $1264 West South Central (excludes TX) $1121 Mountain $1047 Pacific (excludes CA) $1391 New York $1139 Florida $1017 Texas $999 California $1304 Source EIA Natural Gas Monthly
Table 8217 shows the national average commercial natural gas prices for commercial clothes washers based on the relative commercial consumer weight of each geographic area DOE used 2006 population estimates from the US Census as a proxy to estimate how the national saturation of commercial clothes washers was distributed over the 13 geographic areas Because DOE conducted the LCC and PBP analysis in 2008$ all natural gas prices are in 2008$ To perform the necessary monetary conversion DOE used the GDP to convert the gas prices from 2007$ to 2008$
8-19
EERE-2006-STD-0127 COMMENT 691
Table 8217 Average Commercial Natural Gas Prices for Commercial Clothes Washers in 2008
Geographic Area Average Price
(2008$MMBtu) Saturations New England $1443 48 Middle Atlantic (excludes NY) $1277 71 East North Central $1110 155 West North Central $1114 67 South Atlantic (excludes FL) $1323 130 East South Central $1292 59 West South Central (excludes TX) $1146 36 Mountain $1070 70 Pacific (excludes CA) $1422 40 New York $1164 64 Florida $1039 60 Texas $1021 79 California $1333 122 National Average Price (2008$MMBtu) $1189 -
Saturations based on 2005 population estimates from US Census 1 tcf gas = 103 MMBtu Converted to 2008$ by multiplying costs in 2007$ by the ratio of 2008 GDP (11981)
to 2007 GDP (11727) Converted the price for year 2007 to the price in 2008 by multiplying the 2007 price by the ratio of the average AEO gas price in 2008 (1134 $MMBtu) to average AEO gas price in 2007 (1099 $MMBtu)
Water Prices DOE obtained water price data from the year 2006 from the Water and Wastewater Rate
Survey conducted by Raftelis Financial Consultants and the American Water Works Association9 The survey covers approximately 216 water utilities and 153 wastewater utilities with each industry analyzed separately The water survey includes for each utility the cost to consumers of purchasing a given volume of water In this case the data include a division of the total consumer cost into fixed and volumetric charges The calculations use only the volumetric charge to calculate water prices since only this charge would be affected by a change in water consumption Including the fixed charge in the average would lead to a slightly higher water price
The Water and Wastewater Rate Survey provides prices separately for residential and non-residential customers For wastewater utilities the format is similar but the cost refers to the cost of treating a given volume of wastewater In both surveys the non-residential sector is divided into four sub-sectors based on the average monthly volume of water delivered or equivalently the size of the delivery pipe The sub-sectors are named non-manufacturing commercial industrial 1 and industrial 2 DOErsquos analysis uses the commercial category to estimate prices for commercial consumers
8-20
EERE-2006-STD-0127 COMMENT 691
A sample of 216 utilities is not large enough to calculate regional prices for all US Census divisions and large States (for comparison the EIA Form 861 data include more than 3000 utilities) For this reason DOE calculated regional values at the Census region level (Northeast South Midwest and West) The calculation of average per-unit-volume prices proceeds in three steps
1 For each utility calculate the per-unit-volume price by dividing the total volumetric cost by the volume delivered
2 Calculate a State-level average price by weighting each utility in a given State by the number of consumers it serves (either residential or commercial)
3 Calculate a regional average by combining the State-level averages weighting each by the population of that State This third step helps reduce any bias in the sample that may occur due to relative under-sampling of large States
The results of the calculation for the commercial sector are presented in Table 8218 The price units in the table are dollars per thousand gallons ($tg)
Table 8218 Average Per-Unit-Volume Water Prices in 2006 Commercial Region 2005$tg Water 2005$tg Wastewater Northeast $203 $306 Midwest $162 $230 South $200 $227 West $200 $254
Table 8219 shows the national average commercial water and wastewater prices for commercial clothes washers based on the relative commercial consumer weight of each region DOE used 2006 population estimates from the US Census as a proxy to estimate how the national saturation of commercial clothes washers was distributed over the four regions Because DOE conducted the LCC and PBP analysis in 2008$ it needed to convert all water prices into 2008$ To perform the necessary monetary conversion DOE used the GDP to convert the water and wastewater prices from 2005$ to 2008$
8-21
EERE-2006-STD-0127 COMMENT 691
Table 8219 Average Per-Unit-Volume Water Prices for Commercial Clothes Washers in 2008
Region 2008$tg Water 2008$tg Wastewater Saturations Northeast $242 $365 183 Midwest $193 $275 221 South $239 $271 364 West $239 $303 232 National $229 $297 - Saturations based on 2006 population estimates from Census Converted to 2008$ by multiplying costs in 2005$ by the ratio of 2008 GDP (11981) to 2004 GDP (11193)
Converted the price for year 2006 to the price in 2008 by multiplying the 2006 price by the ratio of the average water CPI in 2008 (33133) to average water CPI in 2006 (29720)
8223 Energy and Water Price Trends
DOE used price forecasts by the EIA to estimate the trends in natural gas oil and electricity prices To arrive at prices in future years it multiplied the average prices described in the preceding section (section 8222) by the forecast of annual average price changes in EIArsquos AEO 2009 updated to reflect the American Recovery and Reinvestment Act (AEO 2009 ARRA)10 To estimate the trend after 2030 DOE followed past guidelines provided to the Federal Energy Management Program (FEMP) by EIA and used the average rate of change during 2020ndash2030
The Department set up its analysis to calculate LCC and PBP using three separate projections Reference Low Economic Growth and High Economic Growth These three cases reflect the uncertainty of economic growth in the forecast period The high and low growth cases show the projected effects of alternative growth assumptions on energy markets The AEO 2009 ARRA provides only forecasts for the Reference Case Therefore DOE used the high-growth case and low-growth forecasts from the AEO 2009 March release to estimate high and low growth price trends11 Figures 821 and 822 show the commercial electricity and natural gas price trends respectively based on the three projections For the LCC results presented in section 84 DOE used only the energy price forecasts from the AEO 2009 ARRA Reference Case
8-22
EERE-2006-STD-0127 COMMENT 691
080
085
090
095
100
105
110
115
120
125
2005 2010 2015 2020 2025 2030 2035 2040 2045
Year
Pric
e Tr
end
(200
8 =
1)
High Grow th Case
Reference Case
Low Grow th Case
Figure 821 Electricity Price Trends
070
080
090
100
110
120
130
140
150
2005 2010 2015 2020 2025 2030 2035 2040 2045
Year
Pric
e Tr
end
(200
8 =
1)
High Grow th Case
Reference Case
Low Grow th Case
Figure 822 Natural Gas Price Trends
8-23
EERE-2006-STD-0127 COMMENT 691
To estimate the future trend for water and wastewater prices DOE used data on the historic trend in the national water price index (US city average) from 1970 through 200812
DOE extrapolated the future trend based on the linear growth from 1970 to 2008 But rather than use the extrapolated trend to forecast the prices for the four years after 2008 DOE pinned the annual price to the value in 2008 Otherwise forecasted prices for this four-year time period would have been up to eight percent lower than the price in 2008 Beyond the four-year time period DOE used the extrapolated trend to forecast prices out to the year 2043 Figure 823 shows the historical and projected water price trend data DOE used the forecasted data to estimate water and wastewater prices for commercial clothes washers
0
100
200
300
400
500
600
1970 1980 1990 2000 2010 2020 2030 2040
Year
Wat
er C
PI
Water Price CPI
Linear Extrapolation
Figure 823 Water Price Trend
8224 Repair and Maintenance Costs
Typically small incremental changes in product efficiency incur no or only very small changes in repair and maintenance costs over baseline products However equipment with efficiencies that are significantly higher than the baseline are more likely to incur higher repair and maintenance costs because its higher complexity and higher part count typically increases the cumulative probability of failure
The Whirlpool Corporation estimates that the unit shipments of horizontal-axis commercial clothes washers are less than half that of vertical-axis machines while their in-warranty repair costs are double that of vertical-axis machines13 This suggests that the repair of
8-24
EERE-2006-STD-0127 COMMENT 691
horizontal-axis machines is four times as costly as that of vertical-axis machines Because in-warranty repair costs based on Whirlpoolrsquos experience are greater for horizontal-axis machines that vertical-axis machines DOE estimated that commercial clothes washer repair costs would increase as a function of equipment efficiency DOE utilized an algorithm developed for central air conditioners and heat pumps to estimate repair cost increases14 This algorithm calculates annualized repair costs by dividing the half the equipment retail price by the equipment lifetime as show in the expression below
05 times EQP=RC ANNUAL LIFE
where
RCANNUAL = Annualized repair cost associated with equipment EQP = Consumer equipment price and LIFE = Product lifetime
Tables 8220 and 8221 show for each product class and each product application (multi-family buildings and laundromats) the annualized repair costs for the commercial clothes washer baseline and efficiency levels Annualized repair costs for each product application differ because commercial clothes washer lifetime is different for each application (Product lifetimes are presented below is section 823) The tables also present the consumer equipment prices for the baseline level and each efficiency level
Average product lifetime Multi-family = 113 years Laundromat = 71 years
8-25
EERE-2006-STD-0127 COMMENT 691
823 Product Lifetime
DOE used only primary sources of data to estimate product lifetimes DOE considered the sources listed in Table 8222 to estimate product lifetime
Table 8222 Commercial Clothes Washers Product Lifetime Estimates and Sources Lifetime (years) Source 7 to 10 CEE (1998) 5
Top-Loading (12 to 14 lbs) 5 to 8 Front-Loading (18 to 50 lbs) 10 to 15 CLA 15
8 to 9 ACEEE (2001) 16
5 (high-use) to 13 (low-use) Southern California Edison (2000) 17
15 dagger CALMAC (2000) 18
Used to establish laundromat lifetime only Used to establish multi-family lifetime only Depending on the usage rate the life can be shorter dagger Based on engineering judgment
Because DOE conducted the LCC analysis based on analyzing two product applicationsmdashmulti-family and laundromatsmdashit established separate lifetimes for each product application Because clothes washers in multi-family applications are used less frequently than in laundromats DOE decided to use only those sources that indicated lifetimes of seven years or greater for multi-family applications For laundromats applications where clothes washers receive heavier use DOE decided to use only those sources that indicated lifetimes of 10 years or less DOE then took an average of the lifetime estimates that met the above criteria For multi-family applications the average lifetime turned out to be 113 years while the average lifetime for laundromats was 71 years DOE used the low estimate for the above applicable sources to establish the minimum product lifetime for each product application For multi-family applications the minimum estimate is 7 years and for laundromats it is 5 years To establish the maximum product lifetime DOE took the difference between the minimum and average values (43 years for multi-family and 21 years for laundromats) and added it to the average product lifetime The minimum average and maximum lifetime estimates for each product application are shown in Table 8223
Table 8223 Commercial Clothes Washers Average Minimum and Maximum Product Lifetimes
Product Minimum
years Average
years Maximum
years Multi-Family Laundromats
70 50
113 71
155 93
8-26
EERE-2006-STD-0127 COMMENT 691
DOE characterized the clothes washer product lifetimes for each product application with Weibull distributions Appendix 8C presents the Weibull distributions for commercial clothes washers that DOE used in the LCC and PBP analysis
824 Discount Rates
DOE derived the discount rates for the LCC and PBP analysis from estimates of the finance cost of purchasing the considered products Following financial theory the finance cost of raising funds to purchase appliances can be interpreted as (1) the financial cost of any debt incurred to purchase equipment or (2) the opportunity cost of any equity used to purchase equipment For the residential products the purchase of equipment for new homes entails different finance costs for consumers than the purchase of replacement equipment Thus DOE used different discount rates for new construction and replacement installations
For commercial clothes washers DOE derived the discount rate from the cost of capital of publicly traded firms in the sectors that purchase commercial clothes washers19 These companies typically finance equipment purchases through debt and equity capital DOE estimated the cost of capital of these firms as the weighted average of the cost of equity financing and the cost of debt financing
The costs of debt and equity financing are usually obtainable from publicly available data about the following types of companies in the sectors that purchase commercial clothes washers
bull personal services (including laundromats) bull educational services (which buy washers for dormitories) bull hotels and bull real estate investment trusts (REITs) (ie building owners including owners of
apartment complexes)
Damodaran Online is a widely used source of information about company debt and equity financing for most types of firms and was the source of data for this analysis on educational services hotels and REITs20 Since Damodaran Online does not include data for firms in the personal services sector (SIC 7200) DOE used data from Ibbotsonrsquos Associates for this sector21 Ibbotson Associates is a leading authority on asset allocation with expertise in capital market expectations and portfolio implementation
DOE estimated the cost of equity using the capital asset pricing model (CAPM)22 The CAPM assumes that the cost of equity (ke) for a particular company is proportional to the systematic risk faced by that company where high risk is associated with a high cost of equity and low risk is associated with a low cost of equity The systematic risk facing a firm is determined by several variables the risk coefficient of the firm (β) the expected return on risk-free assets (Rf) and the equity risk premium (ERP) The risk coefficient of the firm indicates the risk associated with that firm relative to the price variability in the stock market The expected return on risk-free assets is defined by the yield on long-term government bonds The ERP represents the difference between the expected stock market return and the risk-free rate The
8-27
EERE-2006-STD-0127 COMMENT 691
cost of equity financing is estimated using the following equation where the variables are defined as above
ke = R f + (βtimes ERP) where
ke = Cost of equity Rf = Expected return on risk-free assets β = Risk coefficient of the firm and ERP = Equity risk premium
The cost of debt financing (kd) is the interest rate paid on money borrowed by a company The cost of debt is estimated by adding a risk adjustment factor (Ra) to the risk-free rate This risk adjustment factor depends on the variability of stock returns represented by standard deviations in stock prices So for firm i the cost of debt financing is
k = R + Rdi f ai
where
kd = Cost of debt financing for firm i Rf = Expected return on risk-free assets and Rai = Risk adjustment factor to risk-free rate for firm i
DOE estimates the weighted-average cost of capital (WACC) using the following equation
WACC = k times w + k times we e d d
where
WACC = Weighted average cost of capital we = Proportion of equity financing and wd = Proportion of debt financing
The values of the parameters used in the calculations are shown in Table 8224 below
Table 8224 Data for the Calculation of Weighted-Average Cost of Capital for Sectors that Purchase Commercial Clothes Washers
Based on the procedure described above and the data in Table 8224 Table 8225 shows the WACC for each of the four sectors that purchase commercial washers
Table 8225 Weighted Average Cost of Capital for Sectors that Purchase Commercial Clothes Washers
Sector Weighted-Average Cost of Capital Personal Services 69 Educational Services 106 Hotels 85 REIT 84
The WACC provides an estimate of the nominal cost of capital for firms that purchase commercial clothes washers The real WACC is calculated by adjusting the cost of capital by the expected rate of inflation using the following formula
1+WACCWACCr = 1
1+ r_
where
WACCr = Real weighted-average cost of capital WACC = Weighted-average cost of capital and r = Inflation rate
DOE applied this formula to the costs of capital shown in Table 8225 which yielded the discount rates for each of the sectors given in Table 8226 For the calculation of the discount rates DOE assumed an inflation rate of 25 percent (the average of inflation rates over the 2001ndash 2005 time period)23 Because DOE performed the discount rate calculation on companies or firms that typically purchase commercial clothes washers a distribution of discount rates were generated within each sector The standard deviation of the distribution for each sector is provided in Table 8226 To obtain an average discount rate value for the entire commercial clothe washer industry DOE analyzed additional data from the CEE The CEE estimates that there are up to 3000000 commercial clothes washers in use in the United States 2000000 of these in multi-family housing and 420000 in laundromats5 DOE assumed that the remaining 580000 washers are used in universities and educational institutions Using these proportions DOE derived weights of 14 percent 194 percent and 666 percent for personal services educational services and REIT respectively In the absence of any data regarding hotels DOE assumed the weight for educational services was applicable to hotels as well Weighting each sector by its market share DOE estimated the average discount rate for companies that purchase commercial washers to be 57 percent assuming an inflation rate of 25 percent (the average of inflation rates over the 2001ndash2005 time period)22
8-29
EERE-2006-STD-0127 COMMENT 691
Table 8226 Discount Rates for Commercial Clothes Washers Discount Rate Sector Average Std Deviation Share Personal Services 43 18 140 Educational Services 79 57 97 Hotels 58 20 97 REIT 57 22 666 Average 57 - 100
To account for variation in the discount rates within each of the sectors DOE used the average values and standard deviations in the table above to characterize the discount rates for each sector with a normal probability distribution Because the use of the above standard deviations yield distributions with negative values DOE truncated the lower end of the normal distribution at a discount rate of zero DOE also truncated the higher end of the normal distribution in equal proportion to the truncation at the lower end to maintain the average discount rates shown above in Table 8226
825 Effective Date of Standard
The effective date is the future date when a new standard becomes operative Based on DOErsquos implementation report for energy conservation standards activities submitted pursuant to Section 136 of the Energy Policy Act of 2005 a final rule for the commercial clothes washers being considered for this standards rulemaking is scheduled for completion no later than January 1 2010 Therefore the effective date of any new energy efficiency standards for these products will be three years after the final rule is published which is January 1 2013 The Department calculated the LCC for all consumers as if they each would purchase a new piece of equipment in the year the standard takes effect
826 Equipment Assignment for the Base Case
For purposes of conducting the LCC analysis DOE analyzed standard levels relative to a baseline efficiency level However some consumers already purchase products with efficiencies greater than the baseline levels Thus to accurately estimate the percentage of consumers that would be affected by a particular standard level DOE took into account the distribution of product efficiencies currently in the marketplace In other words rather than analyzing the impacts of a particular standard level assuming that all consumers are currently purchasing products at the baseline level DOE conducted the analysis by taking into account the full breadth of product efficiencies that consumers purchase under the base case (ie the case without new energy efficiency standards)
DOE took into account the mix of commercial clothes washer efficiencies by characterizing the current mix of product efficiencies as a probability distribution In other
8-30
EERE-2006-STD-0127 COMMENT 691
words as DOE performed the Monte Carlo simulation each standard level analyzed was evaluated against the distribution of product efficiencies in the base case
Rather than providing market share data AHAM provided shipment-weighted efficiencies of all commercial clothes washers24 That is shipment-weighted efficiencies were not provided separately for the top-loading and front-loading product classes For the year 2005 the shipment-weighted efficiencies of commercial clothes washers are 141 modified energy factor (MEF) and 1091 water factor (WF) Based on the shipment-weighted efficiency data DOE was able to derive the market share of each product class DOE assumed a bi-modal market share distribution consisting of only top-loading equipment meeting current minimum efficiency standards of 126 MEF95 WF and top-loading equipment with an efficiency of 200 MEF55 WF Thus by using a shipment-weighted efficiency of 141 MEF DOE determined that the market share of 126 MEF95 WF washers is 797 percent and the market share of 200 MEF55 WF washers is 203 percenta DOE interprets this result as indicating that in the year 2005 797 percent of the market consists of top-loading washers while 203 percent is comprised of front-loading washers
Subsequent to 2005 energy efficiency tax incentives in the Energy Policy Act of 2005 and extensions as well as new provisions in the Economic Stabilization Act of 2008 have resulted in more front-loading washers being produced by manufacturers DOE reviewed the US Securities and Exchange Commission (SEC) 10K report of the low volume manufacturer (LVM) of commercial clothes washers and determined that manufacturer tax credits in this recent federal legislation have resulted in significantly increased sales of the front-loading washers for the LVM When accounting for the LVMrsquos market share the increase in front-loading sales results in a current market share of 30 percent for front-loading washers Although tax credits are set to expire after 2010 DOE estimates that the tax credits would permanently transform the market so that front-loading washers would continue to comprise 30 percent of the market over the entire forecast period
Knowing the market share of each product class does not provide the distribution of equipment efficiencies within each class Therefore DOE relied on anther data sourcemdashthe California Energy Commission (CEC)25 As discussed in Section 3143 of Chapter 3 Market and Technology Assessment the CEC publishes the MEFs and WFs of commercial clothes washers sold in California Although the range in efficiencies is relatively wide the distribution is based on the number of available models being sold rather than the percent of shipments being sold Without any other data available DOE assumed that the distribution of available models in the CEC data were representative of actual shipments sold in the US Tables 8227 and 8228 present the market shares of the efficiency levels in the base case for top-loading and front-loading washers respectively The tables represent the equipment that establishments would have purchased in the year 2013 in the absence of new standards
a DOE did not consider the shipment-weighted average WF of 1091 in performing the market share calculation
8-31
EERE-2006-STD-0127 COMMENT 691
Table 8227 Top-Loading Commercial Clothes Washers Base Case Market Shares Standard Level MEF WF Market Share
Baseline 126 950 648 1 142 950 338 2 160 850 14
Represents units with the following MEF and WF ratings 126 le MEF lt 142 95 ge WF gt 85 Represents units with the following MEF and WF ratings 142 le MEF lt 160 95 ge WF gt 85 Represents units with the following MEF and WF ratings MEF ge 160 WF le 85
Table 8228 Front-Loading Commercial Clothes Washers Base Case Market Shares Standard Level MEF WF Market Share
Represents units with the following MEF and WF ratings 172 le MEF lt 180 80 ge WF gt 75 Represents units with the following MEF and WF ratings 180 le MEF lt 200 75 ge WF gt 55 Represents units with the following MEF and WF ratings 200 le MEF lt 220 55 ge WF gt 51 dagger Represents units with the following MEF and WF ratings 220 le MEF lt 235 51 ge WF gt 44 daggerdagger Represents units with the following MEF and WF ratings MEF ge 235 WF le 44
83 PAYBACK PERIOD INPUTS
The payback period is the amount of time it takes the consumer to recover the assumed higher purchase expense of more energy-efficient equipment as a result of lower operating costs Numerically the PBP is the ratio of the increase in purchase expense (ie from a less efficient design to a more efficient design) to the decrease in annual operating expenditures This type of calculation is known as a ldquosimplerdquo payback period because it does not take into account changes in operating expense over time or the time value of money ie the calculation is done at an effective discount rate of zero percent
The equation for PBP is
ΔICPBP =
ΔOC where
ΔIC = Difference in the total installed cost between the more efficient standard level and the baseline design and
ΔOC = difference in annual operating expenses
8-32
EERE-2006-STD-0127 COMMENT 691
Payback periods are expressed in years Payback periods greater than the life of the product mean that the increased total installed cost is not recovered in reduced operating expenses
The data inputs to PBP are the total installed cost of the equipment to the consumer for each efficiency level and the annual (first year) operating expenditures for each standard level The inputs to the total installed cost are the equipment price and the installation cost The inputs to the operating costs are the annual energy (and water) cost the annual repair cost and the annual maintenance cost The PBP uses the same inputs as the LCC analysis as described in section 82 except that energy (and water) price trends and discount rates are not required Since the PBP is a ldquosimplerdquo payback the required energy price is only for the year in which a new standard is to take effectmdashin this case the year 2013 The energy price DOE used in the PBP calculation was the price projected for that year Discount rates are also not required for the simple PBP calculation
84 LIFE-CYCLE COST AND PAYBACK PERIOD RESULTS
This section presents the LCC and PBP results for commercial clothes washers DOErsquos approach for conducting the LCC analysis relied on characterizing the uncertainty and variability of many of the inputs to the analysis with probability distributions DOE used a Monte Carlo simulation technique to perform the LCC calculations DOE calculated the average LCC and LCC savings and the median and average PBP for each of the candidate standard levels These standard levels are also referred to as candidate standard levels (CSL)
DOE calculated LCC savings and PBPs relative to the base case equipment that it assigned to commercial consumers As discussed in section 826 DOE assigned base case equipment that is more efficient than some of the CSLs For that reason the average LCC impacts are not equal to the difference between the LCC of a specific and the LCC of the baseline equipment
In the subsections below DOE presents figures showing the distribution of LCCs in the base case for each product class Also presented below for a specific are figures showing the distribution of LCC impacts and the distribution of PBPs The figures are presented as frequency charts that show the distribution of LCCs LCC impacts and PBPs with their corresponding probability of occurrence DOE generated the figures for the distributions from a Monte Carlo simulation run based on 10000 samples The LCC and PBP calculations were performed 10000 times by sampling from the probability distributions that DOE developed to characterize many of the inputs
Based on the Monte Carlo simulations that DOE performed for each standard-level DOE calculated the share of commercial consumers with a net LCC benefit with a net LCC cost and with no impact DOE considered a commercial user to receive no impact at a given if DOE assigned it base case equipment that is the same as or has higher efficiency than the CSL To
8-33
EERE-2006-STD-0127 COMMENT 691
illustrate the range of LCC and PBP impacts among the commercial clothes washer users the sections below present figures that provide such information for each product class
841 Base Case LCC Distributions
Figures 841 and 842 show the frequency charts for the base case LCC for both product applications of top-loading commercial clothes washers Figures 843 and 844 show the frequency charts for the base case LCC for both product applications of top-loading commercial clothes washersThe figures below show the mean LCC of the base case distribution as well as the full range of LCCs
Frequency Chart
Mean= $4023 000
005
009
014
018
0
4575
915
1372
183
$1629 $3170 $4711 $6252 $7793
10000 Trials 9779 Displayed
Forecast Top MF LCC Lev 0
Figure 841 Top-Loading Commercial Clothes Washers Multi-Family Application Base Case LCC Distribution
8-34
EERE-2006-STD-0127 COMMENT 691
Frequency Chart
Mean= $4182 000
004
008
012
016
0
405
81
1215
162
$2139 $3160 $4182 $5203 $6225
10000 Trials 9910 Displayed
Forecast Top Laun LCC Lev 0
Figure 842 Top-Loading Commercial Clothes Washers Laundromat Application Base Case LCC Distribution
Frequency Chart
Mean= $4220 000
004
008
013
017
0
4225
845
1267
169
$2218 $3481 $4743 $6005 $7267
10000 Trials 9777 Displayed
Forecast Front MF LCC Lev 0
Figure 843 Front-Loading Commercial Clothes Washers Multi-Family Application Base Case LCC Distribution
8-35
EERE-2006-STD-0127 COMMENT 691
Frequency Chart
Mean= $4380 000
004
008
013
017
0
42
84
126
168
$2689 $3534 $4380 $5225 $6070
10000 Trials 9907 Displayed
Forecast Front Laun LCC Lev 0
Figure 844 Front-Loading Commercial Clothes Washers Laundromat Application Base Case LCC Distribution
842 Standard-Level Distributions of LCC Impacts
Figure 845 is an example of a frequency chart showing the distribution of LCC differences for the case of CSL 2 for top-loading washers multi-family product application In the figure a text box next to a vertical line at that value on the x-axis shows the mean change in LCC (a savings of $179 in the example here) The note ldquoCertainty is 8634 from $0 to +Infinityrdquo means that 8634 percent of consumers using clothes washers will have LCC savings or not be impacted due to the CSL compared to the base case The large lsquospikersquo in Figure 845 represents the percentage of consumers that are not impacted by an increase in the CSL ie consumers that already use commercial clothes washers with efficiencies greater than or equal to the CSL Refer back to section 826 on the distribution of product efficiencies under the base case DOE can generate a frequency chart like the one shown in Figure 845 for every CSL and each product application
8-36
EERE-2006-STD-0127 COMMENT 691
Frequency Chart
Certainty is 8634 from $0 to +Infinity
Mean = $179 000
006
012
018
024
0
5875
1175
1762
235
($146) $61 $268 $474 $681
10000 Trials 9750 Displayed
Forecast To p MF LCC Sav Lev 2
Figure 845 Top-Loading Commercial Clothes Washers Multi-Family Application Distribution of LCC Impacts for CSL 2
843 Standard-Level PBP Distributions
Figure 846 is an example of a frequency chart showing the distribution of payback periods of CSL 2 for top-loading washer multi-family product application The large lsquospikersquo at the PBP value of -200 indicates the percentage of consumers using commercial clothes washers that are not impacted by an increase in the CSL ie consumers that already use top-loading commercial clothes washers with efficiencies equal to or greater than then CSL Refer back to section 826 on the distribution of product efficiencies under the base case DOE can generate a frequency chart like the one shown in Figure 846 for every CSL and each product application
8-37
EERE-2006-STD-0127 COMMENT 691
Frequency Chart
000
008
017
025
033
0
83
166
249
332
-200 232 663 1095 1526
10000 Trials 9534 Displayed
Forecast Top MF PB Lev 2
Figure 846 Commercial Clothes Washers Multi-Family Application Distribution of PBPs for CSL 3
844 LCC and PBP Results
Tables 841 and 842 show the LCC and PBP results for both product applications of top-loading commercial clothes washers Tables 843 and 844 show the LCC and PBP results for both product applications of front-loading commercial clothes washers For example in the case of the front-loading washer multi-family application CSL 2 (200 MEF550 WF) shows an average LCC savings of $195 Note that for CSL 2 approximately 96 percent of consumers in 2013 are assumed to already be using a commercial clothes washer in the base case at CSL 2 and thus have zero savings due to the standard If one compares the LCC of the base case at 172 MEF800 WF to the standards case at 200 MEF550 WF then the average LCC savings are $530 But since the base case includes a significant number of consumers that are not impacted by the standard the average savings over all of the consumers is $195 With regard to the PBPs shown below DOE determined the median and average values by excluding the percentage of households not impacted by the standard For example in the case of CSL 2 for front-loading washers about 96 percent of the consumers did not factor into the calculation of the median and average PBP
Figures 847 and 848 show the range of LCC savings for the CSLs for both product applications of top-loading commercial clothes washers Figures 849 and 8410 show the range of LCC savings for the CSLs for both product applications of front-loading commercial clothes washers For each CSL the top and the bottom of the box indicate the 75th and 25th
percentiles respectively The bar at the middle of the box indicates the median 50 percent of the households have LCC savings above this value The lsquowhiskersrsquo at the bottom and the top of the box indicate the 5th and 95th percentiles The small box shows the average LCC savings for each CSL
Figures 8411 and 8412 show the range of PBPs for top-loading commercial clothes washers Figures 8413 and 8414 show the range of PBPs for front-loading commercial clothes washers In these figures households which are not impacted by an increase in the standard are not included (this situation applies to all CSLs except CSL 4 for front-loading washers)
8-40
EERE-2006-STD-0127 COMMENT 691
Life
-cyc
le C
ost S
avin
gs ($
)
800
600
400
200
0
-200
Median
Mean
CSL 1 CSL 2
Candidate Standard Level
Figure 847 Range of LCC Savings for Top-Loading Commercial Clothes Washers Multi-Family
300
Life
-cyc
le C
ost S
avin
gs ($
) 200
100
0
-100
Median Mean
CSL 1 CSL 2
Candidate Standard Level
Figure 848 Range of LCC Savings for Top-Loading Commercial Clothes Washers Laundromat
8-41
EERE-2006-STD-0127 COMMENT 691
0
100
200
300
400
500
600
Life
-cyc
le C
ost S
avin
gs ($
)
Median Mean
CSL 1 CSL 2 CSL 3 CSL 4
Candidate Standard Level
Figure 849 Range of LCC Savings for Front-Loading Commercial Clothes Washers Multi-Family
250
Life
-cyc
le C
ost S
avin
gs ($
)
200
150
100
50
0
Median Mean
CSL 1 CSL 2 CSL 3 CSL 4
Candidate Standard Level
Figure 8410 Range of LCC Savings for Front-Loading Commercial Clothes Washers Laundromat
8-42
EERE-2006-STD-0127 COMMENT 691
60
Payb
ack
Perio
d (y
ears
) Pa
ybac
k Pe
riod
(yea
rs)
50
40
30
20
10
0
Figure 8411 Range of Payback Periods for Top-Loading Commercial Clothes Washers Multi-Family
20
Median Mean
CSL 1 CSL 2
Candidate Standard Level
Median Mean
CSL 1 CSL 2
Candidate Standard Level
15
10
5
0
Figure 8412 Range of Payback Periods for Top-Loading Commercial Clothes Washers Laundromat
8-43
EERE-2006-STD-0127 COMMENT 691
0
1
2
3
4
5
6
7
8
CSL 1 CSL 2 CSL 3 CSL 4
Candidate Standard Level
Payb
ack
Perio
d (y
ears
)
Median Mean
Figure 8413 Range of Payback Periods for Front-Loading Commercial Clothes Washers Multi-Family
00
05
10
15
20
25
30
CSL 1 CSL 2 CSL 3 CSL 4
Candidate Standard Level
Payb
ack
Perio
d (y
ears
)
Median Mean
Figure 8414 Range of Payback Periods for Front-Loading Commercial Clothes Washers Laundromat
8-44
EERE-2006-STD-0127 COMMENT 691
85 REBUTTABLE PAYBACK PERIOD
DOE presents rebuttable PBPs to provide the legally established rebuttable presumption that an energy efficiency standard is economically justified if the additional product costs attributed to the standard are less than three times the value of the first-year energy cost savings (42 USC sect6295 (o)(2)(B)(iii))
851 Metric
The basic equation for rebuttable PBP is the same as that shown in section 83 Payback Period Inputs Unlike the analyses described in sections 82 and 83 however the rebuttable PBP is not based on the use of household samples and probability distributions Rather than distributions the rebuttable PBP is based on discrete single-point values For example while DOE uses a probability distribution of regional energy prices in the distributional payback period analysis it uses only the national average energy price from the probability distribution to determine the rebuttable PBP
Other than the use of single-point values the most notable difference between the distribution PBP and the rebuttable PBP is the latterrsquos reliance on the DOE test procedure to determine a productrsquos annual energy and water consumption The following identifies the differences between the annual energy and water consumptions determined for the distribution PBP and the rebuttable PBP
DOE based the annual energy and water consumption values that it used to determine the rebuttable PBP on the number of cycles per year specified in the DOE test procedure 26 The commercial clothes washer test procedure cites the residential clothes washer test procedure to establish efficiency ratings as well as annual energy and water consumption As a result the annual number of use cycles 392 cycles per year for determining the annual energy and water consumption of commercial clothes washers is representative of residential use not commercial use Because residential use is significantly lower than the average usage for commercial applicationsmdash1241 cycles per year in multi-family buildings and 2190 cycles per year in laundromatsmdashthe average annual energy and water consumption used to determine rebuttable PBP will be significantly less than the consumption associated with actual usage As a result the rebuttable PBP will be significantly longer than the distribution PBPs for both multi-family and laundromat applications
852 Inputs
Inputs for the rebuttable PBP differ from the distribution PBP in that the calculation uses discrete values rather than distributions for inputs Note that for the calculation of distribution PBP because inputs for the determination of total installed cost were based on single-point values only the variability andor uncertainty in the inputs for determining operating cost contributed to variability in the distribution PBPs The following summarizes the single-point values that DOE used in the determination of the rebuttable PBP
8-45
EERE-2006-STD-0127 COMMENT 691
bull Manufacturing costs markups sales taxes and installation costs were all based on the single-point values used in the distributional LCC and PBP analysis
bull As described in section 851 annual energy and water consumption is based on the DOE test procedure
bull Energy and water prices are based on national average values for the year that new standards are assumed to take effect
bull An average discount rate or lifetime is not required in the rebuttable PBP calculation
bull The effective date of the standard is assumed to be 2013
853 Results
DOE calculated rebuttable PBPs for each CSL relative to the distribution of product efficiencies assumed for the base case (refer back to section 826 for more details on the base case efficiency distributions for each product) In other words DOE did not determine the rebuttable PBP relative to the baseline efficiency level but relative to the current distribution of product efficiencies DOE determined for the base case (ie the case without new standards) The following sections present the results for the sets of products being analyzed for this standards rulemaking
Tables 851 and 852 present the rebuttable PBPs for top-loading commercial clothes washers under both product applications multi-family buildings and laundromats Tables 853 and 854 present the rebuttable PBPs for front-loading commercial clothes washers under both product applications multi-family buildings and laundromats
1 US Department of Energy-Office of Energy Efficiency and Renewable Energy Energy Conservation Standards for Certain Consumer Products (Dishwashers Dehumidifiers Microwave Ovens and Electric and Gas Kitchen Ranges and Ovens) and for Certain Commercial and Industrial Equipment (Commercial Clothes Washers) Final Rule Federal Register 2009 74(66) pp 16040-16096
2 US Department of Energy-Office of Energy Efficiency and Renewable Energy Technical Support Document Energy Efficiency Program for Consumer Products and Commercial and Industrial Equipment Residential Dishwashers Dehumidifiers Cooking Products and Commercial Clothes Washers March 2009 Washington DC lthttpwww1eereenergygovbuildingsappliance_standardsresidentialcooking_prod ucts_final_rule_tsdhtmlgt
3 Association of Home Appliance Manufacturers AHAM 2005 Fact Book 2005 Washington DC
4 RS Means Mechanical Cost Data 31st Annual Edition 2008 Kingston MA
5 Consortium for Energy Efficiency Commercial Family-Sized Washers An Initiative Description of the Consortium for Energy Efficiency 1998 Boston MA lthttpwwwcee1orgcomcwshcwsh-mainphp3gt
6 US Department of Energy-Energy Information Administration Form EIA-861 for 2007 2007 Washington DC lthttpwwweiadoegovcneafelectricitypageeia861htmlgt
7 US Census Bureau Population estimates Population Population change and estimated components of population change April 1 2000 to July 1 2005 2006 Washington DC lthttpwwwcensusgovpopestdatasetshtmlgt
8 US Department of Energy-Energy Information Administration Natural Gas Monthly 2007 Washington DC lthttpwwweiadoegovoil_gasnatural_gasdata_publicationsnatural_gas_monthlyngmhtmgt
9 Raftelis Financial Consultants Inc 2006 RFCAWWA Water and Wastewater Rate Survey 2006 Charlotte NC Kansas City MO and Pasadena CA lthttpwwwrafteliscomratessurveyhtmlgt
10 US Department of Energy-Energy Information Administration An Updated Annual Energy Outlook 2009 Reference Case Reflecting Provisions of the American Recovery and Reinvestment Act and Recent Changes in the Economic Outlook April 2009 Washington DC SROIAF2009-03 lthttpwwweiadoegovoiafservicerptstimuluspdfsroiaf(2009)03pdfgt
8-48
EERE-2006-STD-0127 COMMENT 691
11 US Department of Energy-Energy Information Administration Annual Energy Outlook 2009 with Projections to 2030 March 2009 Washington DC DOEEIA-0383(2009) lthttpwwweiadoegovoiafaeopdf0383(2009)pdfgt
12 US Department of Labor-Bureau of Labor Statistics Consumer Price Indexes Item Water and sewerage maintenance Series Id CUUR0000SEHG01 US city average (not seasonally adjusted) 2008 Washington DC lthttpwwwblsgovcpihomehtmdatagt
13 Whirlpool Corporation Comment of Whirlpool Corporation Regarding the ANOPR for Cooking Products and Commercial Clothes Washers Docket Number EE-206-STD-2007 RIN 1904-AB49
14 US Department of Energy Technical Support Document Energy Efficiency Standards for Consumer Products Residential Central Air Conditioners and Heat Pumps May 2002 Washington DC Chapter 5 lthttpwwweereenergygovbuildingsappliance_standardsresidentialac_central_1000_rhtmlgt
15 Coin Laundry Association Industry Overview Downers Grove IL lthttpwwwcoinlaundryorgresourcesindustryoverviewcfmgt
16 Southern California Edison 2004-2005 Database for Energy Efficiency Resources (DEER) Update Study Final Report December 2005 Prepared for Southern California Edison by Itron Inc Vancouver WA lthttpwwwcalmacorgpublications2004-05_DEER_Update_Final_Report-Wopdfgt
17 Sullivan GP J W Currie TC Hillman and GB Parker High-Performance Clothes Washer Demonstration at Leisure World Laguna Woods Final Report December 2000 Prepared for Southern California Edison Company by Battelle Pacific Northwest Laboratory Richland WA lthttpeerepnlgovbuilding-technologiesdocscefinal202-22-01pdfgt
18 California Measurement Advisory Committee CALMAC Protocols Appendix F Effective Useful Live Values for Major Energy Efficiency Measures September 2000 lthttpwwwcalmacorgeventsAPX_Fpdfgt
19 Ibbotsons Associates Cost of Capital 2001 Yearbook Data Through March 2001 2001 Chicago IL
20 Damodaran Online The Data Page Cost of Capital by Industry Sector 2006 lthttppagessternnyuedu~adamodargt
21 Ibbotsons Associates Statistics for SIC code 72 2006 lthttpwwwibbotsoncomgt
8-49
EERE-2006-STD-0127 COMMENT 691
22 Ibbotsons Associates SBBI Valuation Edition 2001 Yearbook 2001 Chicago IL pp 38 44
23 US Government Printing Office Economic Report of the President 2006 2006 Washington DC lthttpwwwgpoaccessgoveopindexhtmlgt
24 Association of Home Appliance Manufacturers AHAM Data on Commercial Clothes Washers for DOE Efficiency Standards Rulemaking October 12 2006 Letter to Building Technologies Program US Department of Energy
25 California Energy Commission Appliances Databases ndash Clothes Washers 2009 Sacramento CA lthttpwwwenergycagovappliancesdatabaseexcel_based_filesClothes_Washersgt (Last Accessed February 5 2009)
26 US Office of the Federal Register Code of Federal Regulations Title 10 Part 431 -Energy Conservation Program for Certain Commercial and Industrial Equipment Subpart ImdashCommercial Clothes Washers January 1 2007 Washington DC
8-50
EERE-2006-STD-0127 COMMENT 691
CHAPTER 8 LIFE-CYCLE COST AND PAYBACK PERIOD ANALYSIS
81 INTRODUCTION
811 General Approach for LCC and PBP Analysis
812 Overview of LCC and PBP Inputs
82 LIFE-CYCLE COST INPUTS
821 Total Installed Cost Inputs
8212 Baseline Manufacturer Cost
8213 Standard-Level Manufacturer Cost Increases
8214 Overall Markup
8215 Installation Cost
8216 Total Installed Cost
822 Operating Cost Inputs
8221 Annual Energy and Water Consumption
8222 Energy and Water Prices
8223 Energy and Water Price Trends
8224 Repair and Maintenance Costs
823 Product Lifetime
824 Discount Rates
825 Effective Date of Standard
826 Equipment Assignment for the Base Case
83 PAYBACK PERIOD INPUTS
84 LIFE-CYCLE COST AND PAYBACK PERIOD RESULTS
841 Base Case LCC Distributions
842 Standard-Level Distributions of LCC Impacts
843 Standard-Level PBP Distributions
844 LCC and PBP Results
85 REBUTTABLE PAYBACK PERIOD
851 Metric
852 Inputs
853 Results
82 LIFE-CYCLE COST INPUTS
Life-cycle cost is the total customer expense over the life of an appliance including purchase expense and operating costs (including energy expenditures) DOE discounts future operating costs to the time of purchase and sums them over the lifetime of the equipment DOE defines LCC by the following equation
N OCtLCC = IC +sum t(1+ r) where
t=1
LCC = Life-cycle cost in dollars IC = Total installed cost in dollars sum = Sum over the lifetime from year 1 to year N N = Lifetime of appliance in years OC = Operating cost in dollars r = Discount rate and t = Year for which operating cost is being determined
DOE expresses dollar values in 2008$
The following sections discuss total installed cost operating cost lifetime and discount rate
821 Total Installed Cost Inputs
DOE defines the total installed cost using the following equation
IC = EQP + INST where
EQP = Equipment price (ie customer price for the equipment only) expressed in dollars and
INST = Installation cost or the customer price to install equipment (ie the cost for labor and materials) also in dollars
The equipment price is based on how the consumer purchases the equipment As discussed in Chapter 7 Markups for Equipment Price Determination DOE defined markups and sales taxes for converting manufacturing costs into consumer equipment prices
Table 821 summarizes the inputs for the determination of total installed cost
8-6
EERE-2006-STD-0127 COMMENT 691
Table 821 Inputs for Total Installed Cost Baseline Manufacturer Cost
Standard-Level Manufacturer Cost
Manufacturer Markup
Retailer or Distributor Markup
Sales Tax
Installation Cost
The baseline manufacturer cost is the cost incurred by the manufacturer to produce equipment meeting existing minimum efficiency standards Standard-level manufacturer cost increases are the change in manufacturer cost associated with producing equipment at a standard level Markups and sales tax convert the manufacturer cost to a consumer equipment price The installation cost is the cost to the consumer of installing the equipment and represents all costs required to install the equipment other than the marked-up consumer equipment price The installation cost includes labor overhead and any miscellaneous materials and parts Thus the total installed cost equals the consumer equipment price plus the installation cost DOE calculated the total installed cost for baseline products based on the following equation
IC BASE = EQPBASE + INSTBASE
= COSTMFG times MUOVERALL _ BASE + INSTBASE
where
ICBASE = Baseline total installed cost EQPBASE = Consumer equipment price for baseline models INSTBASE = Baseline installation cost COSTMFG = Manufacturer cost for baseline models and MUOVERALL_BASE = Baseline overall markup (product of manufacturer markup baseline
retailer or distributor markup and sales tax)
DOE calculated the total installed cost for standard-level products based on the following equation
= IC BASE + (ΔCOSTMFG times MUOVERALL _ INCR + ΔINSTSTD ) where
8-7
EERE-2006-STD-0127 COMMENT 691
ICSTD = Standard-level total installed cost EQPSTD = Consumer equipment price for standard-level models INSTSTD = Standard-level installation cost EQPBASE = Consumer equipment price for baseline models ΔEQPSTD = Change in equipment price for standard-level models INSTBASE = Baseline installation cost ΔINSTSTD = Change in installation cost for standard-level models ICBASE = Baseline total installed cost ΔCOSTMFG = Change in manufacturer cost for standard-level models and MUOVERALL_INCR = Incremental overall markup (product of manufacturer markup
incremental retailer or distributor markup and sales tax)
The remainder of this section provides information about each of the above input variables that DOE used to calculate the total installed cost for cooking products dishwashers dehumidifiers and commercial clothes washers
8212 Baseline Manufacturer Cost
DOE used residential clothes washer data from AHAMrsquos 2005 Fact Book to develop the baseline manufacturer costs for top-loading commercial clothes washers3 According to the AHAM 2005 Fact Book in the year 2005 total clothes washer sales equaled $3373042 million while total industry shipments equaled 9394 million DOE divided total sales by total shipments to arrive at an average manufacturer price of $35906 Based on a manufacturer markup of 126 as determined in section 72 of Chapter 7 Markups for Equipment Price Determination DOE arrived at a baseline manufacturer cost of $28497 in 2006$ As detailed in Chapter 5 Engineering Analysis DOE estimated the cost difference between top-loading and front-loading washers to arrive at the baseline manufacturer cost for front-loading washers Table 822 presents the baseline manufacturer cost as well as the associated baseline modified energy factor and water factor
DOE used a combination of cost data submitted by AHAM and a reverse engineering analysis to develop commercial clothes washer manufacturer cost increases associated with increases in product standard levels Refer to Chapter 5 Engineering Analysis for details Tables 823 and 824 present the standard-level manufacturer cost increases as well as the
8-8
EERE-2006-STD-0127 COMMENT 691
associated modified energy factors and water factors for top-loading and front-loading washers respectively
The overall markup is the value determined by multiplying the manufacturer and retailer markups and the sales tax together to arrive at a single markup value Table 825 shows the overall baseline and incremental markups for commercial clothes washers Refer to Chapter 7 Markups for Equipment Price Determination for details
DOE derived baseline installation costs for commercial clothes washers from data in the RS Means Mechanical Cost Data 20084 This book provides estimates on the labor required to install commercial clothes washers Table 826 summarizes the nationally representative
8-9
EERE-2006-STD-0127 COMMENT 691
average costs associated with the installation of a four-cycle coin operating commercial clothes washer as presented in RS Means Mechanical Cost Data Table 826 provides both bare costs (ie costs before OampP) and installation costs including OampP DOE determined that installation costs would not be impacted with increased standard levels
Table 826 Commercial Clothes Washers Baseline Installation Costs Bare Costs (2005$) Including Overhead amp Profit (2005$)
Installation Type Material Labor Total Total Material Labor Average $1100 $125 $1225 $1400 $1210 $190
Average (2008$) $190 Material costs including OampP equal bare costs plus 10 profit DOE derived labor cost including OampP by subtracting material with OampP from total with OampP Source RS Means Mechanical Cost Data 2008
8216 Total Installed Cost
The total installed cost is the sum of the consumer equipment price and the installation cost Refer back to section 821 to see the equations that DOE used to calculate the total installed cost for baseline and standard-level products
Tables 827 and 828 present the consumer equipment price installation costs and total installed costs for top-loading and front-loading washers respectively Prices and costs are presented at the baseline level and each standard level
Table 827 Top-Loading Commercial Clothes Washers Consumer Equipment Prices Installation Costs and Total Installed Costs
DOE defines the operating cost by the following equation
OC = EC +WC + RC + MC where
EC = Energy expenditure associated with operating the equipment WC = For dishwashers and commercial clothes washers the water expenditure
associated with operating the equipment RC = Repair cost associated with component failure and MC = Service cost for maintaining equipment operation
Table 829 shows the inputs for determining the operating costs The inputs listed in Table 829 are also necessary for determining lifetime operating expenses which include the energy price trends (and water price trends) product lifetime discount rate and effective date of the standard
Table 829 Inputs for Operating Cost Annual Energy (and Water) Consumption
Energy and Water Prices
Repair and Maintenance Costs
Energy and Water Price Trends
Product Lifetime
Discount Rate
Effective Date of Standard
The annual energy consumption is the site energy use associated with operating the equipment The annual water consumption which is applicable to commercial clothes washers is the site water use associated with operating the equipment The annual energy (and water)
8-11
EERE-2006-STD-0127 COMMENT 691
__ __
consumption vary with the product efficiency That is the energy and water consumption associated with standard-level equipment (ie equipment with efficiencies greater than baseline equipment) are less than the consumptions associated with baseline equipment Energy and water prices are the prices paid by consumers for energy (ie electricity gas or oil) and water Multiplying the annual energy and water consumption by the energy and water prices yields the annual energy cost and water cost respectively Repair costs are associated with repairing or replacing components that have failed Maintenance costs are associated with maintaining the operation of the equipment DOE used energy and water price trends to forecast energy and water prices into the future and along with the product lifetime and discount rate to establish the lifetime energy and water costs The product lifetime is the age at which the equipment is retired from service The discount rate is the rate at which DOE discounted future expenditures to establish their present value DOE calculated the operating cost for baseline products based on the following equation
OC = EC +WC + RC + MCBASE BASE BASE BASE BASE
= AEC times PRICE + AWC times PRICE + RC + MCBASE ENERGY BASE WATER BASE BASE
where
OCBASE = Baseline operating cost ECBASE = Energy expenditure associated with operating the baseline equipment WCBASE = For commercial clothes washers the water expenditure associated with
operating the baseline equipment RCBASE = Repair cost associated with component failure for the baseline
equipment MCBASE = Service cost for maintaining baseline equipment operation AECBASE = Annual energy consumption for baseline equipment PRICEENERGY = Energy price AWCBASE = Annual water consumption for baseline equipment and PRICEWATER = Water price
DOE calculated the operating cost for standard-level products based on the following equation
OC = EC +WC + RC + MCSTD STD STD STD STD
= AEC times PRICE + AWC times PRICE + RC + MCSTD ENERGY STD WATER STD STD
= (AEC BASE ΔAEC STD )times PRICE ENERGY + (AWC BASE ΔAWC STD )times PRICEWATER
( + RC ) ( + ΔMC+ RC BASE Δ STD + MC BASE STD )
where
OCSTD = Standard-level operating cost ECSTD = Energy expenditure associated with operating standard-level equipment
8-12
EERE-2006-STD-0127 COMMENT 691
WCSTD = For commercial clothes washers the water expenditure associated with operating standard-level equipment
RCSTD = Repair cost associated with component failure for standard-level equipment
MCSTD = Service cost for maintaining standard-level equipment operation AECSTD = Annual energy consumption for standard-level equipment PRICEENERGY = Energy price AWCSTD = Annual water consumption for standard-level equipment PRICEWATER = Water price ΔAECSTD = Change in annual energy consumption caused by standard-level
equipment ΔAWCSTD = Change in annual water consumption caused by standard-level
equipment ΔRCSTD = Change in repair cost caused by standard-level equipment and ΔMCSTD = Change in maintenance cost caused by standard-level equipment
The remainder of this section provides information about each of the above input variables that DOE used to calculate the operating costs for cooking products dishwashers dehumidifiers and commercial clothes washers
8221 Annual Energy and Water Consumption
Chapter 6 Energy and Water Use Determination details how DOE determined the annual energy and water consumption for baseline and standard-level products
DOE characterized the variability of commercial clothes washer usage based on several studies For multi-family product applications DOE equally weighted each study to establish the variability For laundromat applications DOE used a range of values varying from three to eight cycles per day Refer back to Chapter 6 section 64 to review how DOE characterized commercial clothes washer usage variability
The tables presented below are based on the energy and water use determination analysis described in Chapter 6 Keep in mind that the annual energy and water consumption values in the tables below are averages DOE captured the variability in energy (and water) consumption when it conducted its LCC and PBP analysis
Tables 8210 and 8211 provide the average annual energy and water consumption by efficiency level for top-loading commercial clothes washers Tables 8212 and 8213 provide the average annual energy and water consumption by efficiency level for front-loading commercial clothes washers DOE presents annual consumption based on two applications multi-family housing and laundromats The tables below are similar to Tables 632 through 635 in section 63 from Chapter 6 with the exception that in the tables below the electric and gas water heating and drying consumptions take into account the percentage of buildings in the US that use electric and gas water heaters and dryers In others words the electric and gas water heating and drying consumption in Tables 8210 through 8213 are weighted by the share
8-13
EERE-2006-STD-0127 COMMENT 691
of buildings that use electric and gas water heaters and dryers Based on data from the Consortium for Energy Efficiency (CEE) 5 the shares of electric and gas water heating and drying in multi-family applications are 20 percent and 80 percent electric and gas water heating respectively and 40 percent and 60 percent electric and gas drying respectively Also based on CEE data 100 percent of laundromats use gas water heating and drying
Table 8210 Top-Loading Commercial Clothes Washers Multi-Family Application Annual Energy and Water Use by Efficiency Level
Standard Level
MEF WF
Annual Energy Use Annual
Water Use Water Heating Drying
MachineElectric Gas Electric Gas cuftkWhcyc galcuft kWhyr MMBtuyr kWhyr MMBtuyr kWhyr 1000 galyear
Annual usage based on 34 cycles per day (1241 cycles per year) Electric and gas water heating based on water heater efficiencies of 100 for electric and 75 for gas Water
heater consumption is weighted by the share of buildings with electric (20) and gas (80) water heaters Dryer consumption is weighted by the share of buildings with electric (40) and gas (60) dryers
Table 8211 Top-Loading Commercial Clothes Washers Laundromat Application Annual Energy and Water Use by Efficiency Level
Standard Level
MEF WF
Annual Energy Use Annual
Water Use Water Heating Drying
MachineElectric Gas Electric Gas cuftkWhcyc galcuft kWhyr MMBtuyr kWhyr MMBtuyr kWhyr 1000 galyear
Annual usage based on 6 cycles per day (2190 cycles per year) Electric and gas water heating based on water heater efficiencies of 100 for electric and 75 for gas Water
heater consumption is weighted by the share of buildings with electric (0) and gas (100) water heaters Dryer consumption is weighted by the share of buildings with electric (0) and gas (100) dryers
8-14
EERE-2006-STD-0127 COMMENT 691
Table 8212 Front-Loading Commercial Clothes Washers Multi-Family Application Annual Energy and Water Use by Efficiency Level
Standard Level
MEF WF
Annual Energy Use Annual
Water Use Water Heating Drying
MachineElectric Gas Electric Gas cuftkWhcyc galcuft kWhyr MMBtuyr kWhyr MMBtuyr kWhyr 1000 galyear
Annual usage based on 34 cycles per day (1241 cycles per year) Electric and gas water heating based on water heater efficiencies of 100 for electric and 75 for gas Water
heater consumption is weighted by the share of buildings with electric (20) and gas (80) water heaters Dryer consumption is weighted by the share of buildings with electric (40) and gas (60) dryers
Table 8213 Front-Loading Commercial Clothes Washers Laundromat Application Annual Energy and Water Use by Efficiency Level
Standard Level
MEF WF
Annual Energy Use Annual
Water Use Water Heating Drying
MachineElectric Gas Electric Gas cuftkWhcyc galcuft kWhyr MMBtuyr kWhyr MMBtuyr kWhyr 1000 galyear
Annual usage based on 6 cycles per day (2190 cycles per year) Electric and gas water heating based on water heater efficiencies of 100 for electric and 75 for gas Water
heater consumption is weighted by the share of buildings with electric (0) and gas (100) water heaters Dryer consumption is weighted by the share of buildings with electric (0) and gas (100) dryers
8222 Energy and Water Prices
DOE derived energy prices for 13 geographic areas in the US and derived water prices for the four Census regions Using these data DOE analyzed the variability of energy and water prices at the regional level for cooking products and commercial clothes washers
DOE characterized energy and water price regional variability with probability distributions It based the probability associated with each regional energy and water price on the population weight of each region
8-15
EERE-2006-STD-0127 COMMENT 691
The methodology that DOE used for deriving the energy and water prices is presented below Included are tables that summarize the regional energy and water prices for each product
Energy Prices DOE derived average energy prices from data from EIA DOE calculated prices for each
of 13 geographic areas the nine US Census divisions with four large States (New York Florida Texas and California) treated separately For Census divisions containing one of these large States DOE calculated the regional average values leaving out data for the large Statemdashfor example the Pacific region average does not include California and the West South Central does not include Texas
Commercial Electricity Prices DOE estimated electricity prices for commercial consumers in each of the above
geographic areas using EIA Form 861 data6 These data are published annually and include annual electricity sales in kilowatt hours (kWh) revenues from electricity sales and number of consumers for the residential commercial and industrial sectors for every utility serving final consumers The calculation of an average residential electricity price proceeds in two steps
1 For each utility estimate an average residential price by dividing the residential revenues by residential sales
2 Calculate a regional average price weighting each utility with customers in a region by the number of residential consumers served in that region
Table 8214 shows the results for each geographic region
8-16
EERE-2006-STD-0127 COMMENT 691
Table 8214 Average Commercial Electricity Prices in 2007 Geographic Area Average Price (2007$kWh) New England $0148 Middle Atlantic (excludes NY) $0107 East North Central $0088 West North Central $0072 South Atlantic (excludes FL) $0082 East South Central $0083 West South Central (excludes TX) $0082 Mountain $0081 Pacific (excludes CA) $0091 New York $0163 Florida $0131 Texas $0115 California $0098 Source EIA Form 861
Table 8215 shows the national average commercial electricity prices for commercial clothes washers based on the relative residential consumer weight of each geographic area DOE used 2006 population estimates from the US Census as a proxy to estimate how the national saturation of commercial clothes washers was distributed over the 13 geographic areas7
Because DOE conducted the LCC and PBP analysis in 2008$ all electricity prices are in 2008$ To perform the necessary monetary conversion DOE used the GDP to convert the electricity prices from 2007$ to 2008$
8-17
EERE-2006-STD-0127 COMMENT 691
Table 8215 Average Commercial Electricity Prices for Commercial Clothes Washers in 2008
Geographic Area Average Price
(2008$kWh) Saturations New England $0156 48 Middle Atlantic (excludes NY) $0114 71 East North Central $0093 155 West North Central $0076 67 South Atlantic (excludes FL) $0087 130 East South Central $0088 59 West South Central (excludes TX) $0087 36 Mountain $0085 70 Pacific (excludes CA) $0096 40 New York $0172 64 Florida $0139 60 Texas $0121 79 California $0104 122 National Average Price (2008$kWh) $0108 - Saturations based on 2006 population estimates from Census
Converted to 2008$ by multiplying costs in 2007$ by the ratio of 2008 GDP (11981) to 2007 GDP (11727) Converted the price for year 2007 to the price in 2008 by multiplying the 2007 price by the ratio of the average AEO electricity price in 2008 (2906 $MMBtu) to average AEO electricity price in 2007 (2803 $MMBtu)
Commercial Natural Gas Prices DOE obtained the data for the natural gas price calculation from the EIA publication
Natural Gas Monthly8 This publication includes a compilation of monthly natural gas delivery volumes and average consumer prices by State for residential commercial and industrial customers The Department used the complete annual data for 2007 to calculate an average annul price for each area The calculation of average prices proceeds in two steps
1 Calculate the annul price for each State using a simple average over the appropriate months
2 Calculate a regional price weighting each State in a region by its population
This method differs from the method used to calculate electricity prices because EIA does not provide consumer- or utility-level data on gas consumption and prices The commercial price units in Table 8216 are in dollars per thousand cubic feet ($tcf)
8-18
EERE-2006-STD-0127 COMMENT 691
Table 8216 Average Commercial Natural Gas Prices in 2007 Geographic Area Average Price (2007$tcf) New England $1412 Middle Atlantic (excludes NY) $1249 East North Central $1086 West North Central $1089 South Atlantic (excludes FL) $1294 East South Central $1264 West South Central (excludes TX) $1121 Mountain $1047 Pacific (excludes CA) $1391 New York $1139 Florida $1017 Texas $999 California $1304 Source EIA Natural Gas Monthly
Table 8217 shows the national average commercial natural gas prices for commercial clothes washers based on the relative commercial consumer weight of each geographic area DOE used 2006 population estimates from the US Census as a proxy to estimate how the national saturation of commercial clothes washers was distributed over the 13 geographic areas Because DOE conducted the LCC and PBP analysis in 2008$ all natural gas prices are in 2008$ To perform the necessary monetary conversion DOE used the GDP to convert the gas prices from 2007$ to 2008$
8-19
EERE-2006-STD-0127 COMMENT 691
Table 8217 Average Commercial Natural Gas Prices for Commercial Clothes Washers in 2008
Geographic Area Average Price
(2008$MMBtu) Saturations New England $1443 48 Middle Atlantic (excludes NY) $1277 71 East North Central $1110 155 West North Central $1114 67 South Atlantic (excludes FL) $1323 130 East South Central $1292 59 West South Central (excludes TX) $1146 36 Mountain $1070 70 Pacific (excludes CA) $1422 40 New York $1164 64 Florida $1039 60 Texas $1021 79 California $1333 122 National Average Price (2008$MMBtu) $1189 -
Saturations based on 2005 population estimates from US Census 1 tcf gas = 103 MMBtu Converted to 2008$ by multiplying costs in 2007$ by the ratio of 2008 GDP (11981)
to 2007 GDP (11727) Converted the price for year 2007 to the price in 2008 by multiplying the 2007 price by the ratio of the average AEO gas price in 2008 (1134 $MMBtu) to average AEO gas price in 2007 (1099 $MMBtu)
Water Prices DOE obtained water price data from the year 2006 from the Water and Wastewater Rate
Survey conducted by Raftelis Financial Consultants and the American Water Works Association9 The survey covers approximately 216 water utilities and 153 wastewater utilities with each industry analyzed separately The water survey includes for each utility the cost to consumers of purchasing a given volume of water In this case the data include a division of the total consumer cost into fixed and volumetric charges The calculations use only the volumetric charge to calculate water prices since only this charge would be affected by a change in water consumption Including the fixed charge in the average would lead to a slightly higher water price
The Water and Wastewater Rate Survey provides prices separately for residential and non-residential customers For wastewater utilities the format is similar but the cost refers to the cost of treating a given volume of wastewater In both surveys the non-residential sector is divided into four sub-sectors based on the average monthly volume of water delivered or equivalently the size of the delivery pipe The sub-sectors are named non-manufacturing commercial industrial 1 and industrial 2 DOErsquos analysis uses the commercial category to estimate prices for commercial consumers
8-20
EERE-2006-STD-0127 COMMENT 691
A sample of 216 utilities is not large enough to calculate regional prices for all US Census divisions and large States (for comparison the EIA Form 861 data include more than 3000 utilities) For this reason DOE calculated regional values at the Census region level (Northeast South Midwest and West) The calculation of average per-unit-volume prices proceeds in three steps
1 For each utility calculate the per-unit-volume price by dividing the total volumetric cost by the volume delivered
2 Calculate a State-level average price by weighting each utility in a given State by the number of consumers it serves (either residential or commercial)
3 Calculate a regional average by combining the State-level averages weighting each by the population of that State This third step helps reduce any bias in the sample that may occur due to relative under-sampling of large States
The results of the calculation for the commercial sector are presented in Table 8218 The price units in the table are dollars per thousand gallons ($tg)
Table 8218 Average Per-Unit-Volume Water Prices in 2006 Commercial Region 2005$tg Water 2005$tg Wastewater Northeast $203 $306 Midwest $162 $230 South $200 $227 West $200 $254
Table 8219 shows the national average commercial water and wastewater prices for commercial clothes washers based on the relative commercial consumer weight of each region DOE used 2006 population estimates from the US Census as a proxy to estimate how the national saturation of commercial clothes washers was distributed over the four regions Because DOE conducted the LCC and PBP analysis in 2008$ it needed to convert all water prices into 2008$ To perform the necessary monetary conversion DOE used the GDP to convert the water and wastewater prices from 2005$ to 2008$
8-21
EERE-2006-STD-0127 COMMENT 691
Table 8219 Average Per-Unit-Volume Water Prices for Commercial Clothes Washers in 2008
Region 2008$tg Water 2008$tg Wastewater Saturations Northeast $242 $365 183 Midwest $193 $275 221 South $239 $271 364 West $239 $303 232 National $229 $297 - Saturations based on 2006 population estimates from Census Converted to 2008$ by multiplying costs in 2005$ by the ratio of 2008 GDP (11981) to 2004 GDP (11193)
Converted the price for year 2006 to the price in 2008 by multiplying the 2006 price by the ratio of the average water CPI in 2008 (33133) to average water CPI in 2006 (29720)
8223 Energy and Water Price Trends
DOE used price forecasts by the EIA to estimate the trends in natural gas oil and electricity prices To arrive at prices in future years it multiplied the average prices described in the preceding section (section 8222) by the forecast of annual average price changes in EIArsquos AEO 2009 updated to reflect the American Recovery and Reinvestment Act (AEO 2009 ARRA)10 To estimate the trend after 2030 DOE followed past guidelines provided to the Federal Energy Management Program (FEMP) by EIA and used the average rate of change during 2020ndash2030
The Department set up its analysis to calculate LCC and PBP using three separate projections Reference Low Economic Growth and High Economic Growth These three cases reflect the uncertainty of economic growth in the forecast period The high and low growth cases show the projected effects of alternative growth assumptions on energy markets The AEO 2009 ARRA provides only forecasts for the Reference Case Therefore DOE used the high-growth case and low-growth forecasts from the AEO 2009 March release to estimate high and low growth price trends11 Figures 821 and 822 show the commercial electricity and natural gas price trends respectively based on the three projections For the LCC results presented in section 84 DOE used only the energy price forecasts from the AEO 2009 ARRA Reference Case
8-22
EERE-2006-STD-0127 COMMENT 691
080
085
090
095
100
105
110
115
120
125
2005 2010 2015 2020 2025 2030 2035 2040 2045
Year
Pric
e Tr
end
(200
8 =
1)
High Grow th Case
Reference Case
Low Grow th Case
Figure 821 Electricity Price Trends
070
080
090
100
110
120
130
140
150
2005 2010 2015 2020 2025 2030 2035 2040 2045
Year
Pric
e Tr
end
(200
8 =
1)
High Grow th Case
Reference Case
Low Grow th Case
Figure 822 Natural Gas Price Trends
8-23
EERE-2006-STD-0127 COMMENT 691
To estimate the future trend for water and wastewater prices DOE used data on the historic trend in the national water price index (US city average) from 1970 through 200812
DOE extrapolated the future trend based on the linear growth from 1970 to 2008 But rather than use the extrapolated trend to forecast the prices for the four years after 2008 DOE pinned the annual price to the value in 2008 Otherwise forecasted prices for this four-year time period would have been up to eight percent lower than the price in 2008 Beyond the four-year time period DOE used the extrapolated trend to forecast prices out to the year 2043 Figure 823 shows the historical and projected water price trend data DOE used the forecasted data to estimate water and wastewater prices for commercial clothes washers
0
100
200
300
400
500
600
1970 1980 1990 2000 2010 2020 2030 2040
Year
Wat
er C
PI
Water Price CPI
Linear Extrapolation
Figure 823 Water Price Trend
8224 Repair and Maintenance Costs
Typically small incremental changes in product efficiency incur no or only very small changes in repair and maintenance costs over baseline products However equipment with efficiencies that are significantly higher than the baseline are more likely to incur higher repair and maintenance costs because its higher complexity and higher part count typically increases the cumulative probability of failure
The Whirlpool Corporation estimates that the unit shipments of horizontal-axis commercial clothes washers are less than half that of vertical-axis machines while their in-warranty repair costs are double that of vertical-axis machines13 This suggests that the repair of
8-24
EERE-2006-STD-0127 COMMENT 691
horizontal-axis machines is four times as costly as that of vertical-axis machines Because in-warranty repair costs based on Whirlpoolrsquos experience are greater for horizontal-axis machines that vertical-axis machines DOE estimated that commercial clothes washer repair costs would increase as a function of equipment efficiency DOE utilized an algorithm developed for central air conditioners and heat pumps to estimate repair cost increases14 This algorithm calculates annualized repair costs by dividing the half the equipment retail price by the equipment lifetime as show in the expression below
05 times EQP=RC ANNUAL LIFE
where
RCANNUAL = Annualized repair cost associated with equipment EQP = Consumer equipment price and LIFE = Product lifetime
Tables 8220 and 8221 show for each product class and each product application (multi-family buildings and laundromats) the annualized repair costs for the commercial clothes washer baseline and efficiency levels Annualized repair costs for each product application differ because commercial clothes washer lifetime is different for each application (Product lifetimes are presented below is section 823) The tables also present the consumer equipment prices for the baseline level and each efficiency level
Average product lifetime Multi-family = 113 years Laundromat = 71 years
8-25
EERE-2006-STD-0127 COMMENT 691
823 Product Lifetime
DOE used only primary sources of data to estimate product lifetimes DOE considered the sources listed in Table 8222 to estimate product lifetime
Table 8222 Commercial Clothes Washers Product Lifetime Estimates and Sources Lifetime (years) Source 7 to 10 CEE (1998) 5
Top-Loading (12 to 14 lbs) 5 to 8 Front-Loading (18 to 50 lbs) 10 to 15 CLA 15
8 to 9 ACEEE (2001) 16
5 (high-use) to 13 (low-use) Southern California Edison (2000) 17
15 dagger CALMAC (2000) 18
Used to establish laundromat lifetime only Used to establish multi-family lifetime only Depending on the usage rate the life can be shorter dagger Based on engineering judgment
Because DOE conducted the LCC analysis based on analyzing two product applicationsmdashmulti-family and laundromatsmdashit established separate lifetimes for each product application Because clothes washers in multi-family applications are used less frequently than in laundromats DOE decided to use only those sources that indicated lifetimes of seven years or greater for multi-family applications For laundromats applications where clothes washers receive heavier use DOE decided to use only those sources that indicated lifetimes of 10 years or less DOE then took an average of the lifetime estimates that met the above criteria For multi-family applications the average lifetime turned out to be 113 years while the average lifetime for laundromats was 71 years DOE used the low estimate for the above applicable sources to establish the minimum product lifetime for each product application For multi-family applications the minimum estimate is 7 years and for laundromats it is 5 years To establish the maximum product lifetime DOE took the difference between the minimum and average values (43 years for multi-family and 21 years for laundromats) and added it to the average product lifetime The minimum average and maximum lifetime estimates for each product application are shown in Table 8223
Table 8223 Commercial Clothes Washers Average Minimum and Maximum Product Lifetimes
Product Minimum
years Average
years Maximum
years Multi-Family Laundromats
70 50
113 71
155 93
8-26
EERE-2006-STD-0127 COMMENT 691
DOE characterized the clothes washer product lifetimes for each product application with Weibull distributions Appendix 8C presents the Weibull distributions for commercial clothes washers that DOE used in the LCC and PBP analysis
824 Discount Rates
DOE derived the discount rates for the LCC and PBP analysis from estimates of the finance cost of purchasing the considered products Following financial theory the finance cost of raising funds to purchase appliances can be interpreted as (1) the financial cost of any debt incurred to purchase equipment or (2) the opportunity cost of any equity used to purchase equipment For the residential products the purchase of equipment for new homes entails different finance costs for consumers than the purchase of replacement equipment Thus DOE used different discount rates for new construction and replacement installations
For commercial clothes washers DOE derived the discount rate from the cost of capital of publicly traded firms in the sectors that purchase commercial clothes washers19 These companies typically finance equipment purchases through debt and equity capital DOE estimated the cost of capital of these firms as the weighted average of the cost of equity financing and the cost of debt financing
The costs of debt and equity financing are usually obtainable from publicly available data about the following types of companies in the sectors that purchase commercial clothes washers
bull personal services (including laundromats) bull educational services (which buy washers for dormitories) bull hotels and bull real estate investment trusts (REITs) (ie building owners including owners of
apartment complexes)
Damodaran Online is a widely used source of information about company debt and equity financing for most types of firms and was the source of data for this analysis on educational services hotels and REITs20 Since Damodaran Online does not include data for firms in the personal services sector (SIC 7200) DOE used data from Ibbotsonrsquos Associates for this sector21 Ibbotson Associates is a leading authority on asset allocation with expertise in capital market expectations and portfolio implementation
DOE estimated the cost of equity using the capital asset pricing model (CAPM)22 The CAPM assumes that the cost of equity (ke) for a particular company is proportional to the systematic risk faced by that company where high risk is associated with a high cost of equity and low risk is associated with a low cost of equity The systematic risk facing a firm is determined by several variables the risk coefficient of the firm (β) the expected return on risk-free assets (Rf) and the equity risk premium (ERP) The risk coefficient of the firm indicates the risk associated with that firm relative to the price variability in the stock market The expected return on risk-free assets is defined by the yield on long-term government bonds The ERP represents the difference between the expected stock market return and the risk-free rate The
8-27
EERE-2006-STD-0127 COMMENT 691
cost of equity financing is estimated using the following equation where the variables are defined as above
ke = R f + (βtimes ERP) where
ke = Cost of equity Rf = Expected return on risk-free assets β = Risk coefficient of the firm and ERP = Equity risk premium
The cost of debt financing (kd) is the interest rate paid on money borrowed by a company The cost of debt is estimated by adding a risk adjustment factor (Ra) to the risk-free rate This risk adjustment factor depends on the variability of stock returns represented by standard deviations in stock prices So for firm i the cost of debt financing is
k = R + Rdi f ai
where
kd = Cost of debt financing for firm i Rf = Expected return on risk-free assets and Rai = Risk adjustment factor to risk-free rate for firm i
DOE estimates the weighted-average cost of capital (WACC) using the following equation
WACC = k times w + k times we e d d
where
WACC = Weighted average cost of capital we = Proportion of equity financing and wd = Proportion of debt financing
The values of the parameters used in the calculations are shown in Table 8224 below
Table 8224 Data for the Calculation of Weighted-Average Cost of Capital for Sectors that Purchase Commercial Clothes Washers
Based on the procedure described above and the data in Table 8224 Table 8225 shows the WACC for each of the four sectors that purchase commercial washers
Table 8225 Weighted Average Cost of Capital for Sectors that Purchase Commercial Clothes Washers
Sector Weighted-Average Cost of Capital Personal Services 69 Educational Services 106 Hotels 85 REIT 84
The WACC provides an estimate of the nominal cost of capital for firms that purchase commercial clothes washers The real WACC is calculated by adjusting the cost of capital by the expected rate of inflation using the following formula
1+WACCWACCr = 1
1+ r_
where
WACCr = Real weighted-average cost of capital WACC = Weighted-average cost of capital and r = Inflation rate
DOE applied this formula to the costs of capital shown in Table 8225 which yielded the discount rates for each of the sectors given in Table 8226 For the calculation of the discount rates DOE assumed an inflation rate of 25 percent (the average of inflation rates over the 2001ndash 2005 time period)23 Because DOE performed the discount rate calculation on companies or firms that typically purchase commercial clothes washers a distribution of discount rates were generated within each sector The standard deviation of the distribution for each sector is provided in Table 8226 To obtain an average discount rate value for the entire commercial clothe washer industry DOE analyzed additional data from the CEE The CEE estimates that there are up to 3000000 commercial clothes washers in use in the United States 2000000 of these in multi-family housing and 420000 in laundromats5 DOE assumed that the remaining 580000 washers are used in universities and educational institutions Using these proportions DOE derived weights of 14 percent 194 percent and 666 percent for personal services educational services and REIT respectively In the absence of any data regarding hotels DOE assumed the weight for educational services was applicable to hotels as well Weighting each sector by its market share DOE estimated the average discount rate for companies that purchase commercial washers to be 57 percent assuming an inflation rate of 25 percent (the average of inflation rates over the 2001ndash2005 time period)22
8-29
EERE-2006-STD-0127 COMMENT 691
Table 8226 Discount Rates for Commercial Clothes Washers Discount Rate Sector Average Std Deviation Share Personal Services 43 18 140 Educational Services 79 57 97 Hotels 58 20 97 REIT 57 22 666 Average 57 - 100
To account for variation in the discount rates within each of the sectors DOE used the average values and standard deviations in the table above to characterize the discount rates for each sector with a normal probability distribution Because the use of the above standard deviations yield distributions with negative values DOE truncated the lower end of the normal distribution at a discount rate of zero DOE also truncated the higher end of the normal distribution in equal proportion to the truncation at the lower end to maintain the average discount rates shown above in Table 8226
825 Effective Date of Standard
The effective date is the future date when a new standard becomes operative Based on DOErsquos implementation report for energy conservation standards activities submitted pursuant to Section 136 of the Energy Policy Act of 2005 a final rule for the commercial clothes washers being considered for this standards rulemaking is scheduled for completion no later than January 1 2010 Therefore the effective date of any new energy efficiency standards for these products will be three years after the final rule is published which is January 1 2013 The Department calculated the LCC for all consumers as if they each would purchase a new piece of equipment in the year the standard takes effect
826 Equipment Assignment for the Base Case
For purposes of conducting the LCC analysis DOE analyzed standard levels relative to a baseline efficiency level However some consumers already purchase products with efficiencies greater than the baseline levels Thus to accurately estimate the percentage of consumers that would be affected by a particular standard level DOE took into account the distribution of product efficiencies currently in the marketplace In other words rather than analyzing the impacts of a particular standard level assuming that all consumers are currently purchasing products at the baseline level DOE conducted the analysis by taking into account the full breadth of product efficiencies that consumers purchase under the base case (ie the case without new energy efficiency standards)
DOE took into account the mix of commercial clothes washer efficiencies by characterizing the current mix of product efficiencies as a probability distribution In other
8-30
EERE-2006-STD-0127 COMMENT 691
words as DOE performed the Monte Carlo simulation each standard level analyzed was evaluated against the distribution of product efficiencies in the base case
Rather than providing market share data AHAM provided shipment-weighted efficiencies of all commercial clothes washers24 That is shipment-weighted efficiencies were not provided separately for the top-loading and front-loading product classes For the year 2005 the shipment-weighted efficiencies of commercial clothes washers are 141 modified energy factor (MEF) and 1091 water factor (WF) Based on the shipment-weighted efficiency data DOE was able to derive the market share of each product class DOE assumed a bi-modal market share distribution consisting of only top-loading equipment meeting current minimum efficiency standards of 126 MEF95 WF and top-loading equipment with an efficiency of 200 MEF55 WF Thus by using a shipment-weighted efficiency of 141 MEF DOE determined that the market share of 126 MEF95 WF washers is 797 percent and the market share of 200 MEF55 WF washers is 203 percenta DOE interprets this result as indicating that in the year 2005 797 percent of the market consists of top-loading washers while 203 percent is comprised of front-loading washers
Subsequent to 2005 energy efficiency tax incentives in the Energy Policy Act of 2005 and extensions as well as new provisions in the Economic Stabilization Act of 2008 have resulted in more front-loading washers being produced by manufacturers DOE reviewed the US Securities and Exchange Commission (SEC) 10K report of the low volume manufacturer (LVM) of commercial clothes washers and determined that manufacturer tax credits in this recent federal legislation have resulted in significantly increased sales of the front-loading washers for the LVM When accounting for the LVMrsquos market share the increase in front-loading sales results in a current market share of 30 percent for front-loading washers Although tax credits are set to expire after 2010 DOE estimates that the tax credits would permanently transform the market so that front-loading washers would continue to comprise 30 percent of the market over the entire forecast period
Knowing the market share of each product class does not provide the distribution of equipment efficiencies within each class Therefore DOE relied on anther data sourcemdashthe California Energy Commission (CEC)25 As discussed in Section 3143 of Chapter 3 Market and Technology Assessment the CEC publishes the MEFs and WFs of commercial clothes washers sold in California Although the range in efficiencies is relatively wide the distribution is based on the number of available models being sold rather than the percent of shipments being sold Without any other data available DOE assumed that the distribution of available models in the CEC data were representative of actual shipments sold in the US Tables 8227 and 8228 present the market shares of the efficiency levels in the base case for top-loading and front-loading washers respectively The tables represent the equipment that establishments would have purchased in the year 2013 in the absence of new standards
a DOE did not consider the shipment-weighted average WF of 1091 in performing the market share calculation
8-31
EERE-2006-STD-0127 COMMENT 691
Table 8227 Top-Loading Commercial Clothes Washers Base Case Market Shares Standard Level MEF WF Market Share
Baseline 126 950 648 1 142 950 338 2 160 850 14
Represents units with the following MEF and WF ratings 126 le MEF lt 142 95 ge WF gt 85 Represents units with the following MEF and WF ratings 142 le MEF lt 160 95 ge WF gt 85 Represents units with the following MEF and WF ratings MEF ge 160 WF le 85
Table 8228 Front-Loading Commercial Clothes Washers Base Case Market Shares Standard Level MEF WF Market Share
Represents units with the following MEF and WF ratings 172 le MEF lt 180 80 ge WF gt 75 Represents units with the following MEF and WF ratings 180 le MEF lt 200 75 ge WF gt 55 Represents units with the following MEF and WF ratings 200 le MEF lt 220 55 ge WF gt 51 dagger Represents units with the following MEF and WF ratings 220 le MEF lt 235 51 ge WF gt 44 daggerdagger Represents units with the following MEF and WF ratings MEF ge 235 WF le 44
83 PAYBACK PERIOD INPUTS
The payback period is the amount of time it takes the consumer to recover the assumed higher purchase expense of more energy-efficient equipment as a result of lower operating costs Numerically the PBP is the ratio of the increase in purchase expense (ie from a less efficient design to a more efficient design) to the decrease in annual operating expenditures This type of calculation is known as a ldquosimplerdquo payback period because it does not take into account changes in operating expense over time or the time value of money ie the calculation is done at an effective discount rate of zero percent
The equation for PBP is
ΔICPBP =
ΔOC where
ΔIC = Difference in the total installed cost between the more efficient standard level and the baseline design and
ΔOC = difference in annual operating expenses
8-32
EERE-2006-STD-0127 COMMENT 691
Payback periods are expressed in years Payback periods greater than the life of the product mean that the increased total installed cost is not recovered in reduced operating expenses
The data inputs to PBP are the total installed cost of the equipment to the consumer for each efficiency level and the annual (first year) operating expenditures for each standard level The inputs to the total installed cost are the equipment price and the installation cost The inputs to the operating costs are the annual energy (and water) cost the annual repair cost and the annual maintenance cost The PBP uses the same inputs as the LCC analysis as described in section 82 except that energy (and water) price trends and discount rates are not required Since the PBP is a ldquosimplerdquo payback the required energy price is only for the year in which a new standard is to take effectmdashin this case the year 2013 The energy price DOE used in the PBP calculation was the price projected for that year Discount rates are also not required for the simple PBP calculation
84 LIFE-CYCLE COST AND PAYBACK PERIOD RESULTS
This section presents the LCC and PBP results for commercial clothes washers DOErsquos approach for conducting the LCC analysis relied on characterizing the uncertainty and variability of many of the inputs to the analysis with probability distributions DOE used a Monte Carlo simulation technique to perform the LCC calculations DOE calculated the average LCC and LCC savings and the median and average PBP for each of the candidate standard levels These standard levels are also referred to as candidate standard levels (CSL)
DOE calculated LCC savings and PBPs relative to the base case equipment that it assigned to commercial consumers As discussed in section 826 DOE assigned base case equipment that is more efficient than some of the CSLs For that reason the average LCC impacts are not equal to the difference between the LCC of a specific and the LCC of the baseline equipment
In the subsections below DOE presents figures showing the distribution of LCCs in the base case for each product class Also presented below for a specific are figures showing the distribution of LCC impacts and the distribution of PBPs The figures are presented as frequency charts that show the distribution of LCCs LCC impacts and PBPs with their corresponding probability of occurrence DOE generated the figures for the distributions from a Monte Carlo simulation run based on 10000 samples The LCC and PBP calculations were performed 10000 times by sampling from the probability distributions that DOE developed to characterize many of the inputs
Based on the Monte Carlo simulations that DOE performed for each standard-level DOE calculated the share of commercial consumers with a net LCC benefit with a net LCC cost and with no impact DOE considered a commercial user to receive no impact at a given if DOE assigned it base case equipment that is the same as or has higher efficiency than the CSL To
8-33
EERE-2006-STD-0127 COMMENT 691
illustrate the range of LCC and PBP impacts among the commercial clothes washer users the sections below present figures that provide such information for each product class
841 Base Case LCC Distributions
Figures 841 and 842 show the frequency charts for the base case LCC for both product applications of top-loading commercial clothes washers Figures 843 and 844 show the frequency charts for the base case LCC for both product applications of top-loading commercial clothes washersThe figures below show the mean LCC of the base case distribution as well as the full range of LCCs
Frequency Chart
Mean= $4023 000
005
009
014
018
0
4575
915
1372
183
$1629 $3170 $4711 $6252 $7793
10000 Trials 9779 Displayed
Forecast Top MF LCC Lev 0
Figure 841 Top-Loading Commercial Clothes Washers Multi-Family Application Base Case LCC Distribution
8-34
EERE-2006-STD-0127 COMMENT 691
Frequency Chart
Mean= $4182 000
004
008
012
016
0
405
81
1215
162
$2139 $3160 $4182 $5203 $6225
10000 Trials 9910 Displayed
Forecast Top Laun LCC Lev 0
Figure 842 Top-Loading Commercial Clothes Washers Laundromat Application Base Case LCC Distribution
Frequency Chart
Mean= $4220 000
004
008
013
017
0
4225
845
1267
169
$2218 $3481 $4743 $6005 $7267
10000 Trials 9777 Displayed
Forecast Front MF LCC Lev 0
Figure 843 Front-Loading Commercial Clothes Washers Multi-Family Application Base Case LCC Distribution
8-35
EERE-2006-STD-0127 COMMENT 691
Frequency Chart
Mean= $4380 000
004
008
013
017
0
42
84
126
168
$2689 $3534 $4380 $5225 $6070
10000 Trials 9907 Displayed
Forecast Front Laun LCC Lev 0
Figure 844 Front-Loading Commercial Clothes Washers Laundromat Application Base Case LCC Distribution
842 Standard-Level Distributions of LCC Impacts
Figure 845 is an example of a frequency chart showing the distribution of LCC differences for the case of CSL 2 for top-loading washers multi-family product application In the figure a text box next to a vertical line at that value on the x-axis shows the mean change in LCC (a savings of $179 in the example here) The note ldquoCertainty is 8634 from $0 to +Infinityrdquo means that 8634 percent of consumers using clothes washers will have LCC savings or not be impacted due to the CSL compared to the base case The large lsquospikersquo in Figure 845 represents the percentage of consumers that are not impacted by an increase in the CSL ie consumers that already use commercial clothes washers with efficiencies greater than or equal to the CSL Refer back to section 826 on the distribution of product efficiencies under the base case DOE can generate a frequency chart like the one shown in Figure 845 for every CSL and each product application
8-36
EERE-2006-STD-0127 COMMENT 691
Frequency Chart
Certainty is 8634 from $0 to +Infinity
Mean = $179 000
006
012
018
024
0
5875
1175
1762
235
($146) $61 $268 $474 $681
10000 Trials 9750 Displayed
Forecast To p MF LCC Sav Lev 2
Figure 845 Top-Loading Commercial Clothes Washers Multi-Family Application Distribution of LCC Impacts for CSL 2
843 Standard-Level PBP Distributions
Figure 846 is an example of a frequency chart showing the distribution of payback periods of CSL 2 for top-loading washer multi-family product application The large lsquospikersquo at the PBP value of -200 indicates the percentage of consumers using commercial clothes washers that are not impacted by an increase in the CSL ie consumers that already use top-loading commercial clothes washers with efficiencies equal to or greater than then CSL Refer back to section 826 on the distribution of product efficiencies under the base case DOE can generate a frequency chart like the one shown in Figure 846 for every CSL and each product application
8-37
EERE-2006-STD-0127 COMMENT 691
Frequency Chart
000
008
017
025
033
0
83
166
249
332
-200 232 663 1095 1526
10000 Trials 9534 Displayed
Forecast Top MF PB Lev 2
Figure 846 Commercial Clothes Washers Multi-Family Application Distribution of PBPs for CSL 3
844 LCC and PBP Results
Tables 841 and 842 show the LCC and PBP results for both product applications of top-loading commercial clothes washers Tables 843 and 844 show the LCC and PBP results for both product applications of front-loading commercial clothes washers For example in the case of the front-loading washer multi-family application CSL 2 (200 MEF550 WF) shows an average LCC savings of $195 Note that for CSL 2 approximately 96 percent of consumers in 2013 are assumed to already be using a commercial clothes washer in the base case at CSL 2 and thus have zero savings due to the standard If one compares the LCC of the base case at 172 MEF800 WF to the standards case at 200 MEF550 WF then the average LCC savings are $530 But since the base case includes a significant number of consumers that are not impacted by the standard the average savings over all of the consumers is $195 With regard to the PBPs shown below DOE determined the median and average values by excluding the percentage of households not impacted by the standard For example in the case of CSL 2 for front-loading washers about 96 percent of the consumers did not factor into the calculation of the median and average PBP
Figures 847 and 848 show the range of LCC savings for the CSLs for both product applications of top-loading commercial clothes washers Figures 849 and 8410 show the range of LCC savings for the CSLs for both product applications of front-loading commercial clothes washers For each CSL the top and the bottom of the box indicate the 75th and 25th
percentiles respectively The bar at the middle of the box indicates the median 50 percent of the households have LCC savings above this value The lsquowhiskersrsquo at the bottom and the top of the box indicate the 5th and 95th percentiles The small box shows the average LCC savings for each CSL
Figures 8411 and 8412 show the range of PBPs for top-loading commercial clothes washers Figures 8413 and 8414 show the range of PBPs for front-loading commercial clothes washers In these figures households which are not impacted by an increase in the standard are not included (this situation applies to all CSLs except CSL 4 for front-loading washers)
8-40
EERE-2006-STD-0127 COMMENT 691
Life
-cyc
le C
ost S
avin
gs ($
)
800
600
400
200
0
-200
Median
Mean
CSL 1 CSL 2
Candidate Standard Level
Figure 847 Range of LCC Savings for Top-Loading Commercial Clothes Washers Multi-Family
300
Life
-cyc
le C
ost S
avin
gs ($
) 200
100
0
-100
Median Mean
CSL 1 CSL 2
Candidate Standard Level
Figure 848 Range of LCC Savings for Top-Loading Commercial Clothes Washers Laundromat
8-41
EERE-2006-STD-0127 COMMENT 691
0
100
200
300
400
500
600
Life
-cyc
le C
ost S
avin
gs ($
)
Median Mean
CSL 1 CSL 2 CSL 3 CSL 4
Candidate Standard Level
Figure 849 Range of LCC Savings for Front-Loading Commercial Clothes Washers Multi-Family
250
Life
-cyc
le C
ost S
avin
gs ($
)
200
150
100
50
0
Median Mean
CSL 1 CSL 2 CSL 3 CSL 4
Candidate Standard Level
Figure 8410 Range of LCC Savings for Front-Loading Commercial Clothes Washers Laundromat
8-42
EERE-2006-STD-0127 COMMENT 691
60
Payb
ack
Perio
d (y
ears
) Pa
ybac
k Pe
riod
(yea
rs)
50
40
30
20
10
0
Figure 8411 Range of Payback Periods for Top-Loading Commercial Clothes Washers Multi-Family
20
Median Mean
CSL 1 CSL 2
Candidate Standard Level
Median Mean
CSL 1 CSL 2
Candidate Standard Level
15
10
5
0
Figure 8412 Range of Payback Periods for Top-Loading Commercial Clothes Washers Laundromat
8-43
EERE-2006-STD-0127 COMMENT 691
0
1
2
3
4
5
6
7
8
CSL 1 CSL 2 CSL 3 CSL 4
Candidate Standard Level
Payb
ack
Perio
d (y
ears
)
Median Mean
Figure 8413 Range of Payback Periods for Front-Loading Commercial Clothes Washers Multi-Family
00
05
10
15
20
25
30
CSL 1 CSL 2 CSL 3 CSL 4
Candidate Standard Level
Payb
ack
Perio
d (y
ears
)
Median Mean
Figure 8414 Range of Payback Periods for Front-Loading Commercial Clothes Washers Laundromat
8-44
EERE-2006-STD-0127 COMMENT 691
85 REBUTTABLE PAYBACK PERIOD
DOE presents rebuttable PBPs to provide the legally established rebuttable presumption that an energy efficiency standard is economically justified if the additional product costs attributed to the standard are less than three times the value of the first-year energy cost savings (42 USC sect6295 (o)(2)(B)(iii))
851 Metric
The basic equation for rebuttable PBP is the same as that shown in section 83 Payback Period Inputs Unlike the analyses described in sections 82 and 83 however the rebuttable PBP is not based on the use of household samples and probability distributions Rather than distributions the rebuttable PBP is based on discrete single-point values For example while DOE uses a probability distribution of regional energy prices in the distributional payback period analysis it uses only the national average energy price from the probability distribution to determine the rebuttable PBP
Other than the use of single-point values the most notable difference between the distribution PBP and the rebuttable PBP is the latterrsquos reliance on the DOE test procedure to determine a productrsquos annual energy and water consumption The following identifies the differences between the annual energy and water consumptions determined for the distribution PBP and the rebuttable PBP
DOE based the annual energy and water consumption values that it used to determine the rebuttable PBP on the number of cycles per year specified in the DOE test procedure 26 The commercial clothes washer test procedure cites the residential clothes washer test procedure to establish efficiency ratings as well as annual energy and water consumption As a result the annual number of use cycles 392 cycles per year for determining the annual energy and water consumption of commercial clothes washers is representative of residential use not commercial use Because residential use is significantly lower than the average usage for commercial applicationsmdash1241 cycles per year in multi-family buildings and 2190 cycles per year in laundromatsmdashthe average annual energy and water consumption used to determine rebuttable PBP will be significantly less than the consumption associated with actual usage As a result the rebuttable PBP will be significantly longer than the distribution PBPs for both multi-family and laundromat applications
852 Inputs
Inputs for the rebuttable PBP differ from the distribution PBP in that the calculation uses discrete values rather than distributions for inputs Note that for the calculation of distribution PBP because inputs for the determination of total installed cost were based on single-point values only the variability andor uncertainty in the inputs for determining operating cost contributed to variability in the distribution PBPs The following summarizes the single-point values that DOE used in the determination of the rebuttable PBP
8-45
EERE-2006-STD-0127 COMMENT 691
bull Manufacturing costs markups sales taxes and installation costs were all based on the single-point values used in the distributional LCC and PBP analysis
bull As described in section 851 annual energy and water consumption is based on the DOE test procedure
bull Energy and water prices are based on national average values for the year that new standards are assumed to take effect
bull An average discount rate or lifetime is not required in the rebuttable PBP calculation
bull The effective date of the standard is assumed to be 2013
853 Results
DOE calculated rebuttable PBPs for each CSL relative to the distribution of product efficiencies assumed for the base case (refer back to section 826 for more details on the base case efficiency distributions for each product) In other words DOE did not determine the rebuttable PBP relative to the baseline efficiency level but relative to the current distribution of product efficiencies DOE determined for the base case (ie the case without new standards) The following sections present the results for the sets of products being analyzed for this standards rulemaking
Tables 851 and 852 present the rebuttable PBPs for top-loading commercial clothes washers under both product applications multi-family buildings and laundromats Tables 853 and 854 present the rebuttable PBPs for front-loading commercial clothes washers under both product applications multi-family buildings and laundromats
1 US Department of Energy-Office of Energy Efficiency and Renewable Energy Energy Conservation Standards for Certain Consumer Products (Dishwashers Dehumidifiers Microwave Ovens and Electric and Gas Kitchen Ranges and Ovens) and for Certain Commercial and Industrial Equipment (Commercial Clothes Washers) Final Rule Federal Register 2009 74(66) pp 16040-16096
2 US Department of Energy-Office of Energy Efficiency and Renewable Energy Technical Support Document Energy Efficiency Program for Consumer Products and Commercial and Industrial Equipment Residential Dishwashers Dehumidifiers Cooking Products and Commercial Clothes Washers March 2009 Washington DC lthttpwww1eereenergygovbuildingsappliance_standardsresidentialcooking_prod ucts_final_rule_tsdhtmlgt
3 Association of Home Appliance Manufacturers AHAM 2005 Fact Book 2005 Washington DC
4 RS Means Mechanical Cost Data 31st Annual Edition 2008 Kingston MA
5 Consortium for Energy Efficiency Commercial Family-Sized Washers An Initiative Description of the Consortium for Energy Efficiency 1998 Boston MA lthttpwwwcee1orgcomcwshcwsh-mainphp3gt
6 US Department of Energy-Energy Information Administration Form EIA-861 for 2007 2007 Washington DC lthttpwwweiadoegovcneafelectricitypageeia861htmlgt
7 US Census Bureau Population estimates Population Population change and estimated components of population change April 1 2000 to July 1 2005 2006 Washington DC lthttpwwwcensusgovpopestdatasetshtmlgt
8 US Department of Energy-Energy Information Administration Natural Gas Monthly 2007 Washington DC lthttpwwweiadoegovoil_gasnatural_gasdata_publicationsnatural_gas_monthlyngmhtmgt
9 Raftelis Financial Consultants Inc 2006 RFCAWWA Water and Wastewater Rate Survey 2006 Charlotte NC Kansas City MO and Pasadena CA lthttpwwwrafteliscomratessurveyhtmlgt
10 US Department of Energy-Energy Information Administration An Updated Annual Energy Outlook 2009 Reference Case Reflecting Provisions of the American Recovery and Reinvestment Act and Recent Changes in the Economic Outlook April 2009 Washington DC SROIAF2009-03 lthttpwwweiadoegovoiafservicerptstimuluspdfsroiaf(2009)03pdfgt
8-48
EERE-2006-STD-0127 COMMENT 691
11 US Department of Energy-Energy Information Administration Annual Energy Outlook 2009 with Projections to 2030 March 2009 Washington DC DOEEIA-0383(2009) lthttpwwweiadoegovoiafaeopdf0383(2009)pdfgt
12 US Department of Labor-Bureau of Labor Statistics Consumer Price Indexes Item Water and sewerage maintenance Series Id CUUR0000SEHG01 US city average (not seasonally adjusted) 2008 Washington DC lthttpwwwblsgovcpihomehtmdatagt
13 Whirlpool Corporation Comment of Whirlpool Corporation Regarding the ANOPR for Cooking Products and Commercial Clothes Washers Docket Number EE-206-STD-2007 RIN 1904-AB49
14 US Department of Energy Technical Support Document Energy Efficiency Standards for Consumer Products Residential Central Air Conditioners and Heat Pumps May 2002 Washington DC Chapter 5 lthttpwwweereenergygovbuildingsappliance_standardsresidentialac_central_1000_rhtmlgt
15 Coin Laundry Association Industry Overview Downers Grove IL lthttpwwwcoinlaundryorgresourcesindustryoverviewcfmgt
16 Southern California Edison 2004-2005 Database for Energy Efficiency Resources (DEER) Update Study Final Report December 2005 Prepared for Southern California Edison by Itron Inc Vancouver WA lthttpwwwcalmacorgpublications2004-05_DEER_Update_Final_Report-Wopdfgt
17 Sullivan GP J W Currie TC Hillman and GB Parker High-Performance Clothes Washer Demonstration at Leisure World Laguna Woods Final Report December 2000 Prepared for Southern California Edison Company by Battelle Pacific Northwest Laboratory Richland WA lthttpeerepnlgovbuilding-technologiesdocscefinal202-22-01pdfgt
18 California Measurement Advisory Committee CALMAC Protocols Appendix F Effective Useful Live Values for Major Energy Efficiency Measures September 2000 lthttpwwwcalmacorgeventsAPX_Fpdfgt
19 Ibbotsons Associates Cost of Capital 2001 Yearbook Data Through March 2001 2001 Chicago IL
20 Damodaran Online The Data Page Cost of Capital by Industry Sector 2006 lthttppagessternnyuedu~adamodargt
21 Ibbotsons Associates Statistics for SIC code 72 2006 lthttpwwwibbotsoncomgt
8-49
EERE-2006-STD-0127 COMMENT 691
22 Ibbotsons Associates SBBI Valuation Edition 2001 Yearbook 2001 Chicago IL pp 38 44
23 US Government Printing Office Economic Report of the President 2006 2006 Washington DC lthttpwwwgpoaccessgoveopindexhtmlgt
24 Association of Home Appliance Manufacturers AHAM Data on Commercial Clothes Washers for DOE Efficiency Standards Rulemaking October 12 2006 Letter to Building Technologies Program US Department of Energy
25 California Energy Commission Appliances Databases ndash Clothes Washers 2009 Sacramento CA lthttpwwwenergycagovappliancesdatabaseexcel_based_filesClothes_Washersgt (Last Accessed February 5 2009)
26 US Office of the Federal Register Code of Federal Regulations Title 10 Part 431 -Energy Conservation Program for Certain Commercial and Industrial Equipment Subpart ImdashCommercial Clothes Washers January 1 2007 Washington DC
8-50
EERE-2006-STD-0127 COMMENT 691
CHAPTER 8 LIFE-CYCLE COST AND PAYBACK PERIOD ANALYSIS
81 INTRODUCTION
811 General Approach for LCC and PBP Analysis
812 Overview of LCC and PBP Inputs
82 LIFE-CYCLE COST INPUTS
821 Total Installed Cost Inputs
8212 Baseline Manufacturer Cost
8213 Standard-Level Manufacturer Cost Increases
8214 Overall Markup
8215 Installation Cost
8216 Total Installed Cost
822 Operating Cost Inputs
8221 Annual Energy and Water Consumption
8222 Energy and Water Prices
8223 Energy and Water Price Trends
8224 Repair and Maintenance Costs
823 Product Lifetime
824 Discount Rates
825 Effective Date of Standard
826 Equipment Assignment for the Base Case
83 PAYBACK PERIOD INPUTS
84 LIFE-CYCLE COST AND PAYBACK PERIOD RESULTS
841 Base Case LCC Distributions
842 Standard-Level Distributions of LCC Impacts
843 Standard-Level PBP Distributions
844 LCC and PBP Results
85 REBUTTABLE PAYBACK PERIOD
851 Metric
852 Inputs
853 Results
Table 828 Front-Loading Commercial Clothes Washers Consumer Equipment Prices Installation Costs and Total Installed Costs
DOE defines the operating cost by the following equation
OC = EC +WC + RC + MC where
EC = Energy expenditure associated with operating the equipment WC = For dishwashers and commercial clothes washers the water expenditure
associated with operating the equipment RC = Repair cost associated with component failure and MC = Service cost for maintaining equipment operation
Table 829 shows the inputs for determining the operating costs The inputs listed in Table 829 are also necessary for determining lifetime operating expenses which include the energy price trends (and water price trends) product lifetime discount rate and effective date of the standard
Table 829 Inputs for Operating Cost Annual Energy (and Water) Consumption
Energy and Water Prices
Repair and Maintenance Costs
Energy and Water Price Trends
Product Lifetime
Discount Rate
Effective Date of Standard
The annual energy consumption is the site energy use associated with operating the equipment The annual water consumption which is applicable to commercial clothes washers is the site water use associated with operating the equipment The annual energy (and water)
8-11
EERE-2006-STD-0127 COMMENT 691
__ __
consumption vary with the product efficiency That is the energy and water consumption associated with standard-level equipment (ie equipment with efficiencies greater than baseline equipment) are less than the consumptions associated with baseline equipment Energy and water prices are the prices paid by consumers for energy (ie electricity gas or oil) and water Multiplying the annual energy and water consumption by the energy and water prices yields the annual energy cost and water cost respectively Repair costs are associated with repairing or replacing components that have failed Maintenance costs are associated with maintaining the operation of the equipment DOE used energy and water price trends to forecast energy and water prices into the future and along with the product lifetime and discount rate to establish the lifetime energy and water costs The product lifetime is the age at which the equipment is retired from service The discount rate is the rate at which DOE discounted future expenditures to establish their present value DOE calculated the operating cost for baseline products based on the following equation
OC = EC +WC + RC + MCBASE BASE BASE BASE BASE
= AEC times PRICE + AWC times PRICE + RC + MCBASE ENERGY BASE WATER BASE BASE
where
OCBASE = Baseline operating cost ECBASE = Energy expenditure associated with operating the baseline equipment WCBASE = For commercial clothes washers the water expenditure associated with
operating the baseline equipment RCBASE = Repair cost associated with component failure for the baseline
equipment MCBASE = Service cost for maintaining baseline equipment operation AECBASE = Annual energy consumption for baseline equipment PRICEENERGY = Energy price AWCBASE = Annual water consumption for baseline equipment and PRICEWATER = Water price
DOE calculated the operating cost for standard-level products based on the following equation
OC = EC +WC + RC + MCSTD STD STD STD STD
= AEC times PRICE + AWC times PRICE + RC + MCSTD ENERGY STD WATER STD STD
= (AEC BASE ΔAEC STD )times PRICE ENERGY + (AWC BASE ΔAWC STD )times PRICEWATER
( + RC ) ( + ΔMC+ RC BASE Δ STD + MC BASE STD )
where
OCSTD = Standard-level operating cost ECSTD = Energy expenditure associated with operating standard-level equipment
8-12
EERE-2006-STD-0127 COMMENT 691
WCSTD = For commercial clothes washers the water expenditure associated with operating standard-level equipment
RCSTD = Repair cost associated with component failure for standard-level equipment
MCSTD = Service cost for maintaining standard-level equipment operation AECSTD = Annual energy consumption for standard-level equipment PRICEENERGY = Energy price AWCSTD = Annual water consumption for standard-level equipment PRICEWATER = Water price ΔAECSTD = Change in annual energy consumption caused by standard-level
equipment ΔAWCSTD = Change in annual water consumption caused by standard-level
equipment ΔRCSTD = Change in repair cost caused by standard-level equipment and ΔMCSTD = Change in maintenance cost caused by standard-level equipment
The remainder of this section provides information about each of the above input variables that DOE used to calculate the operating costs for cooking products dishwashers dehumidifiers and commercial clothes washers
8221 Annual Energy and Water Consumption
Chapter 6 Energy and Water Use Determination details how DOE determined the annual energy and water consumption for baseline and standard-level products
DOE characterized the variability of commercial clothes washer usage based on several studies For multi-family product applications DOE equally weighted each study to establish the variability For laundromat applications DOE used a range of values varying from three to eight cycles per day Refer back to Chapter 6 section 64 to review how DOE characterized commercial clothes washer usage variability
The tables presented below are based on the energy and water use determination analysis described in Chapter 6 Keep in mind that the annual energy and water consumption values in the tables below are averages DOE captured the variability in energy (and water) consumption when it conducted its LCC and PBP analysis
Tables 8210 and 8211 provide the average annual energy and water consumption by efficiency level for top-loading commercial clothes washers Tables 8212 and 8213 provide the average annual energy and water consumption by efficiency level for front-loading commercial clothes washers DOE presents annual consumption based on two applications multi-family housing and laundromats The tables below are similar to Tables 632 through 635 in section 63 from Chapter 6 with the exception that in the tables below the electric and gas water heating and drying consumptions take into account the percentage of buildings in the US that use electric and gas water heaters and dryers In others words the electric and gas water heating and drying consumption in Tables 8210 through 8213 are weighted by the share
8-13
EERE-2006-STD-0127 COMMENT 691
of buildings that use electric and gas water heaters and dryers Based on data from the Consortium for Energy Efficiency (CEE) 5 the shares of electric and gas water heating and drying in multi-family applications are 20 percent and 80 percent electric and gas water heating respectively and 40 percent and 60 percent electric and gas drying respectively Also based on CEE data 100 percent of laundromats use gas water heating and drying
Table 8210 Top-Loading Commercial Clothes Washers Multi-Family Application Annual Energy and Water Use by Efficiency Level
Standard Level
MEF WF
Annual Energy Use Annual
Water Use Water Heating Drying
MachineElectric Gas Electric Gas cuftkWhcyc galcuft kWhyr MMBtuyr kWhyr MMBtuyr kWhyr 1000 galyear
Annual usage based on 34 cycles per day (1241 cycles per year) Electric and gas water heating based on water heater efficiencies of 100 for electric and 75 for gas Water
heater consumption is weighted by the share of buildings with electric (20) and gas (80) water heaters Dryer consumption is weighted by the share of buildings with electric (40) and gas (60) dryers
Table 8211 Top-Loading Commercial Clothes Washers Laundromat Application Annual Energy and Water Use by Efficiency Level
Standard Level
MEF WF
Annual Energy Use Annual
Water Use Water Heating Drying
MachineElectric Gas Electric Gas cuftkWhcyc galcuft kWhyr MMBtuyr kWhyr MMBtuyr kWhyr 1000 galyear
Annual usage based on 6 cycles per day (2190 cycles per year) Electric and gas water heating based on water heater efficiencies of 100 for electric and 75 for gas Water
heater consumption is weighted by the share of buildings with electric (0) and gas (100) water heaters Dryer consumption is weighted by the share of buildings with electric (0) and gas (100) dryers
8-14
EERE-2006-STD-0127 COMMENT 691
Table 8212 Front-Loading Commercial Clothes Washers Multi-Family Application Annual Energy and Water Use by Efficiency Level
Standard Level
MEF WF
Annual Energy Use Annual
Water Use Water Heating Drying
MachineElectric Gas Electric Gas cuftkWhcyc galcuft kWhyr MMBtuyr kWhyr MMBtuyr kWhyr 1000 galyear
Annual usage based on 34 cycles per day (1241 cycles per year) Electric and gas water heating based on water heater efficiencies of 100 for electric and 75 for gas Water
heater consumption is weighted by the share of buildings with electric (20) and gas (80) water heaters Dryer consumption is weighted by the share of buildings with electric (40) and gas (60) dryers
Table 8213 Front-Loading Commercial Clothes Washers Laundromat Application Annual Energy and Water Use by Efficiency Level
Standard Level
MEF WF
Annual Energy Use Annual
Water Use Water Heating Drying
MachineElectric Gas Electric Gas cuftkWhcyc galcuft kWhyr MMBtuyr kWhyr MMBtuyr kWhyr 1000 galyear
Annual usage based on 6 cycles per day (2190 cycles per year) Electric and gas water heating based on water heater efficiencies of 100 for electric and 75 for gas Water
heater consumption is weighted by the share of buildings with electric (0) and gas (100) water heaters Dryer consumption is weighted by the share of buildings with electric (0) and gas (100) dryers
8222 Energy and Water Prices
DOE derived energy prices for 13 geographic areas in the US and derived water prices for the four Census regions Using these data DOE analyzed the variability of energy and water prices at the regional level for cooking products and commercial clothes washers
DOE characterized energy and water price regional variability with probability distributions It based the probability associated with each regional energy and water price on the population weight of each region
8-15
EERE-2006-STD-0127 COMMENT 691
The methodology that DOE used for deriving the energy and water prices is presented below Included are tables that summarize the regional energy and water prices for each product
Energy Prices DOE derived average energy prices from data from EIA DOE calculated prices for each
of 13 geographic areas the nine US Census divisions with four large States (New York Florida Texas and California) treated separately For Census divisions containing one of these large States DOE calculated the regional average values leaving out data for the large Statemdashfor example the Pacific region average does not include California and the West South Central does not include Texas
Commercial Electricity Prices DOE estimated electricity prices for commercial consumers in each of the above
geographic areas using EIA Form 861 data6 These data are published annually and include annual electricity sales in kilowatt hours (kWh) revenues from electricity sales and number of consumers for the residential commercial and industrial sectors for every utility serving final consumers The calculation of an average residential electricity price proceeds in two steps
1 For each utility estimate an average residential price by dividing the residential revenues by residential sales
2 Calculate a regional average price weighting each utility with customers in a region by the number of residential consumers served in that region
Table 8214 shows the results for each geographic region
8-16
EERE-2006-STD-0127 COMMENT 691
Table 8214 Average Commercial Electricity Prices in 2007 Geographic Area Average Price (2007$kWh) New England $0148 Middle Atlantic (excludes NY) $0107 East North Central $0088 West North Central $0072 South Atlantic (excludes FL) $0082 East South Central $0083 West South Central (excludes TX) $0082 Mountain $0081 Pacific (excludes CA) $0091 New York $0163 Florida $0131 Texas $0115 California $0098 Source EIA Form 861
Table 8215 shows the national average commercial electricity prices for commercial clothes washers based on the relative residential consumer weight of each geographic area DOE used 2006 population estimates from the US Census as a proxy to estimate how the national saturation of commercial clothes washers was distributed over the 13 geographic areas7
Because DOE conducted the LCC and PBP analysis in 2008$ all electricity prices are in 2008$ To perform the necessary monetary conversion DOE used the GDP to convert the electricity prices from 2007$ to 2008$
8-17
EERE-2006-STD-0127 COMMENT 691
Table 8215 Average Commercial Electricity Prices for Commercial Clothes Washers in 2008
Geographic Area Average Price
(2008$kWh) Saturations New England $0156 48 Middle Atlantic (excludes NY) $0114 71 East North Central $0093 155 West North Central $0076 67 South Atlantic (excludes FL) $0087 130 East South Central $0088 59 West South Central (excludes TX) $0087 36 Mountain $0085 70 Pacific (excludes CA) $0096 40 New York $0172 64 Florida $0139 60 Texas $0121 79 California $0104 122 National Average Price (2008$kWh) $0108 - Saturations based on 2006 population estimates from Census
Converted to 2008$ by multiplying costs in 2007$ by the ratio of 2008 GDP (11981) to 2007 GDP (11727) Converted the price for year 2007 to the price in 2008 by multiplying the 2007 price by the ratio of the average AEO electricity price in 2008 (2906 $MMBtu) to average AEO electricity price in 2007 (2803 $MMBtu)
Commercial Natural Gas Prices DOE obtained the data for the natural gas price calculation from the EIA publication
Natural Gas Monthly8 This publication includes a compilation of monthly natural gas delivery volumes and average consumer prices by State for residential commercial and industrial customers The Department used the complete annual data for 2007 to calculate an average annul price for each area The calculation of average prices proceeds in two steps
1 Calculate the annul price for each State using a simple average over the appropriate months
2 Calculate a regional price weighting each State in a region by its population
This method differs from the method used to calculate electricity prices because EIA does not provide consumer- or utility-level data on gas consumption and prices The commercial price units in Table 8216 are in dollars per thousand cubic feet ($tcf)
8-18
EERE-2006-STD-0127 COMMENT 691
Table 8216 Average Commercial Natural Gas Prices in 2007 Geographic Area Average Price (2007$tcf) New England $1412 Middle Atlantic (excludes NY) $1249 East North Central $1086 West North Central $1089 South Atlantic (excludes FL) $1294 East South Central $1264 West South Central (excludes TX) $1121 Mountain $1047 Pacific (excludes CA) $1391 New York $1139 Florida $1017 Texas $999 California $1304 Source EIA Natural Gas Monthly
Table 8217 shows the national average commercial natural gas prices for commercial clothes washers based on the relative commercial consumer weight of each geographic area DOE used 2006 population estimates from the US Census as a proxy to estimate how the national saturation of commercial clothes washers was distributed over the 13 geographic areas Because DOE conducted the LCC and PBP analysis in 2008$ all natural gas prices are in 2008$ To perform the necessary monetary conversion DOE used the GDP to convert the gas prices from 2007$ to 2008$
8-19
EERE-2006-STD-0127 COMMENT 691
Table 8217 Average Commercial Natural Gas Prices for Commercial Clothes Washers in 2008
Geographic Area Average Price
(2008$MMBtu) Saturations New England $1443 48 Middle Atlantic (excludes NY) $1277 71 East North Central $1110 155 West North Central $1114 67 South Atlantic (excludes FL) $1323 130 East South Central $1292 59 West South Central (excludes TX) $1146 36 Mountain $1070 70 Pacific (excludes CA) $1422 40 New York $1164 64 Florida $1039 60 Texas $1021 79 California $1333 122 National Average Price (2008$MMBtu) $1189 -
Saturations based on 2005 population estimates from US Census 1 tcf gas = 103 MMBtu Converted to 2008$ by multiplying costs in 2007$ by the ratio of 2008 GDP (11981)
to 2007 GDP (11727) Converted the price for year 2007 to the price in 2008 by multiplying the 2007 price by the ratio of the average AEO gas price in 2008 (1134 $MMBtu) to average AEO gas price in 2007 (1099 $MMBtu)
Water Prices DOE obtained water price data from the year 2006 from the Water and Wastewater Rate
Survey conducted by Raftelis Financial Consultants and the American Water Works Association9 The survey covers approximately 216 water utilities and 153 wastewater utilities with each industry analyzed separately The water survey includes for each utility the cost to consumers of purchasing a given volume of water In this case the data include a division of the total consumer cost into fixed and volumetric charges The calculations use only the volumetric charge to calculate water prices since only this charge would be affected by a change in water consumption Including the fixed charge in the average would lead to a slightly higher water price
The Water and Wastewater Rate Survey provides prices separately for residential and non-residential customers For wastewater utilities the format is similar but the cost refers to the cost of treating a given volume of wastewater In both surveys the non-residential sector is divided into four sub-sectors based on the average monthly volume of water delivered or equivalently the size of the delivery pipe The sub-sectors are named non-manufacturing commercial industrial 1 and industrial 2 DOErsquos analysis uses the commercial category to estimate prices for commercial consumers
8-20
EERE-2006-STD-0127 COMMENT 691
A sample of 216 utilities is not large enough to calculate regional prices for all US Census divisions and large States (for comparison the EIA Form 861 data include more than 3000 utilities) For this reason DOE calculated regional values at the Census region level (Northeast South Midwest and West) The calculation of average per-unit-volume prices proceeds in three steps
1 For each utility calculate the per-unit-volume price by dividing the total volumetric cost by the volume delivered
2 Calculate a State-level average price by weighting each utility in a given State by the number of consumers it serves (either residential or commercial)
3 Calculate a regional average by combining the State-level averages weighting each by the population of that State This third step helps reduce any bias in the sample that may occur due to relative under-sampling of large States
The results of the calculation for the commercial sector are presented in Table 8218 The price units in the table are dollars per thousand gallons ($tg)
Table 8218 Average Per-Unit-Volume Water Prices in 2006 Commercial Region 2005$tg Water 2005$tg Wastewater Northeast $203 $306 Midwest $162 $230 South $200 $227 West $200 $254
Table 8219 shows the national average commercial water and wastewater prices for commercial clothes washers based on the relative commercial consumer weight of each region DOE used 2006 population estimates from the US Census as a proxy to estimate how the national saturation of commercial clothes washers was distributed over the four regions Because DOE conducted the LCC and PBP analysis in 2008$ it needed to convert all water prices into 2008$ To perform the necessary monetary conversion DOE used the GDP to convert the water and wastewater prices from 2005$ to 2008$
8-21
EERE-2006-STD-0127 COMMENT 691
Table 8219 Average Per-Unit-Volume Water Prices for Commercial Clothes Washers in 2008
Region 2008$tg Water 2008$tg Wastewater Saturations Northeast $242 $365 183 Midwest $193 $275 221 South $239 $271 364 West $239 $303 232 National $229 $297 - Saturations based on 2006 population estimates from Census Converted to 2008$ by multiplying costs in 2005$ by the ratio of 2008 GDP (11981) to 2004 GDP (11193)
Converted the price for year 2006 to the price in 2008 by multiplying the 2006 price by the ratio of the average water CPI in 2008 (33133) to average water CPI in 2006 (29720)
8223 Energy and Water Price Trends
DOE used price forecasts by the EIA to estimate the trends in natural gas oil and electricity prices To arrive at prices in future years it multiplied the average prices described in the preceding section (section 8222) by the forecast of annual average price changes in EIArsquos AEO 2009 updated to reflect the American Recovery and Reinvestment Act (AEO 2009 ARRA)10 To estimate the trend after 2030 DOE followed past guidelines provided to the Federal Energy Management Program (FEMP) by EIA and used the average rate of change during 2020ndash2030
The Department set up its analysis to calculate LCC and PBP using three separate projections Reference Low Economic Growth and High Economic Growth These three cases reflect the uncertainty of economic growth in the forecast period The high and low growth cases show the projected effects of alternative growth assumptions on energy markets The AEO 2009 ARRA provides only forecasts for the Reference Case Therefore DOE used the high-growth case and low-growth forecasts from the AEO 2009 March release to estimate high and low growth price trends11 Figures 821 and 822 show the commercial electricity and natural gas price trends respectively based on the three projections For the LCC results presented in section 84 DOE used only the energy price forecasts from the AEO 2009 ARRA Reference Case
8-22
EERE-2006-STD-0127 COMMENT 691
080
085
090
095
100
105
110
115
120
125
2005 2010 2015 2020 2025 2030 2035 2040 2045
Year
Pric
e Tr
end
(200
8 =
1)
High Grow th Case
Reference Case
Low Grow th Case
Figure 821 Electricity Price Trends
070
080
090
100
110
120
130
140
150
2005 2010 2015 2020 2025 2030 2035 2040 2045
Year
Pric
e Tr
end
(200
8 =
1)
High Grow th Case
Reference Case
Low Grow th Case
Figure 822 Natural Gas Price Trends
8-23
EERE-2006-STD-0127 COMMENT 691
To estimate the future trend for water and wastewater prices DOE used data on the historic trend in the national water price index (US city average) from 1970 through 200812
DOE extrapolated the future trend based on the linear growth from 1970 to 2008 But rather than use the extrapolated trend to forecast the prices for the four years after 2008 DOE pinned the annual price to the value in 2008 Otherwise forecasted prices for this four-year time period would have been up to eight percent lower than the price in 2008 Beyond the four-year time period DOE used the extrapolated trend to forecast prices out to the year 2043 Figure 823 shows the historical and projected water price trend data DOE used the forecasted data to estimate water and wastewater prices for commercial clothes washers
0
100
200
300
400
500
600
1970 1980 1990 2000 2010 2020 2030 2040
Year
Wat
er C
PI
Water Price CPI
Linear Extrapolation
Figure 823 Water Price Trend
8224 Repair and Maintenance Costs
Typically small incremental changes in product efficiency incur no or only very small changes in repair and maintenance costs over baseline products However equipment with efficiencies that are significantly higher than the baseline are more likely to incur higher repair and maintenance costs because its higher complexity and higher part count typically increases the cumulative probability of failure
The Whirlpool Corporation estimates that the unit shipments of horizontal-axis commercial clothes washers are less than half that of vertical-axis machines while their in-warranty repair costs are double that of vertical-axis machines13 This suggests that the repair of
8-24
EERE-2006-STD-0127 COMMENT 691
horizontal-axis machines is four times as costly as that of vertical-axis machines Because in-warranty repair costs based on Whirlpoolrsquos experience are greater for horizontal-axis machines that vertical-axis machines DOE estimated that commercial clothes washer repair costs would increase as a function of equipment efficiency DOE utilized an algorithm developed for central air conditioners and heat pumps to estimate repair cost increases14 This algorithm calculates annualized repair costs by dividing the half the equipment retail price by the equipment lifetime as show in the expression below
05 times EQP=RC ANNUAL LIFE
where
RCANNUAL = Annualized repair cost associated with equipment EQP = Consumer equipment price and LIFE = Product lifetime
Tables 8220 and 8221 show for each product class and each product application (multi-family buildings and laundromats) the annualized repair costs for the commercial clothes washer baseline and efficiency levels Annualized repair costs for each product application differ because commercial clothes washer lifetime is different for each application (Product lifetimes are presented below is section 823) The tables also present the consumer equipment prices for the baseline level and each efficiency level
Average product lifetime Multi-family = 113 years Laundromat = 71 years
8-25
EERE-2006-STD-0127 COMMENT 691
823 Product Lifetime
DOE used only primary sources of data to estimate product lifetimes DOE considered the sources listed in Table 8222 to estimate product lifetime
Table 8222 Commercial Clothes Washers Product Lifetime Estimates and Sources Lifetime (years) Source 7 to 10 CEE (1998) 5
Top-Loading (12 to 14 lbs) 5 to 8 Front-Loading (18 to 50 lbs) 10 to 15 CLA 15
8 to 9 ACEEE (2001) 16
5 (high-use) to 13 (low-use) Southern California Edison (2000) 17
15 dagger CALMAC (2000) 18
Used to establish laundromat lifetime only Used to establish multi-family lifetime only Depending on the usage rate the life can be shorter dagger Based on engineering judgment
Because DOE conducted the LCC analysis based on analyzing two product applicationsmdashmulti-family and laundromatsmdashit established separate lifetimes for each product application Because clothes washers in multi-family applications are used less frequently than in laundromats DOE decided to use only those sources that indicated lifetimes of seven years or greater for multi-family applications For laundromats applications where clothes washers receive heavier use DOE decided to use only those sources that indicated lifetimes of 10 years or less DOE then took an average of the lifetime estimates that met the above criteria For multi-family applications the average lifetime turned out to be 113 years while the average lifetime for laundromats was 71 years DOE used the low estimate for the above applicable sources to establish the minimum product lifetime for each product application For multi-family applications the minimum estimate is 7 years and for laundromats it is 5 years To establish the maximum product lifetime DOE took the difference between the minimum and average values (43 years for multi-family and 21 years for laundromats) and added it to the average product lifetime The minimum average and maximum lifetime estimates for each product application are shown in Table 8223
Table 8223 Commercial Clothes Washers Average Minimum and Maximum Product Lifetimes
Product Minimum
years Average
years Maximum
years Multi-Family Laundromats
70 50
113 71
155 93
8-26
EERE-2006-STD-0127 COMMENT 691
DOE characterized the clothes washer product lifetimes for each product application with Weibull distributions Appendix 8C presents the Weibull distributions for commercial clothes washers that DOE used in the LCC and PBP analysis
824 Discount Rates
DOE derived the discount rates for the LCC and PBP analysis from estimates of the finance cost of purchasing the considered products Following financial theory the finance cost of raising funds to purchase appliances can be interpreted as (1) the financial cost of any debt incurred to purchase equipment or (2) the opportunity cost of any equity used to purchase equipment For the residential products the purchase of equipment for new homes entails different finance costs for consumers than the purchase of replacement equipment Thus DOE used different discount rates for new construction and replacement installations
For commercial clothes washers DOE derived the discount rate from the cost of capital of publicly traded firms in the sectors that purchase commercial clothes washers19 These companies typically finance equipment purchases through debt and equity capital DOE estimated the cost of capital of these firms as the weighted average of the cost of equity financing and the cost of debt financing
The costs of debt and equity financing are usually obtainable from publicly available data about the following types of companies in the sectors that purchase commercial clothes washers
bull personal services (including laundromats) bull educational services (which buy washers for dormitories) bull hotels and bull real estate investment trusts (REITs) (ie building owners including owners of
apartment complexes)
Damodaran Online is a widely used source of information about company debt and equity financing for most types of firms and was the source of data for this analysis on educational services hotels and REITs20 Since Damodaran Online does not include data for firms in the personal services sector (SIC 7200) DOE used data from Ibbotsonrsquos Associates for this sector21 Ibbotson Associates is a leading authority on asset allocation with expertise in capital market expectations and portfolio implementation
DOE estimated the cost of equity using the capital asset pricing model (CAPM)22 The CAPM assumes that the cost of equity (ke) for a particular company is proportional to the systematic risk faced by that company where high risk is associated with a high cost of equity and low risk is associated with a low cost of equity The systematic risk facing a firm is determined by several variables the risk coefficient of the firm (β) the expected return on risk-free assets (Rf) and the equity risk premium (ERP) The risk coefficient of the firm indicates the risk associated with that firm relative to the price variability in the stock market The expected return on risk-free assets is defined by the yield on long-term government bonds The ERP represents the difference between the expected stock market return and the risk-free rate The
8-27
EERE-2006-STD-0127 COMMENT 691
cost of equity financing is estimated using the following equation where the variables are defined as above
ke = R f + (βtimes ERP) where
ke = Cost of equity Rf = Expected return on risk-free assets β = Risk coefficient of the firm and ERP = Equity risk premium
The cost of debt financing (kd) is the interest rate paid on money borrowed by a company The cost of debt is estimated by adding a risk adjustment factor (Ra) to the risk-free rate This risk adjustment factor depends on the variability of stock returns represented by standard deviations in stock prices So for firm i the cost of debt financing is
k = R + Rdi f ai
where
kd = Cost of debt financing for firm i Rf = Expected return on risk-free assets and Rai = Risk adjustment factor to risk-free rate for firm i
DOE estimates the weighted-average cost of capital (WACC) using the following equation
WACC = k times w + k times we e d d
where
WACC = Weighted average cost of capital we = Proportion of equity financing and wd = Proportion of debt financing
The values of the parameters used in the calculations are shown in Table 8224 below
Table 8224 Data for the Calculation of Weighted-Average Cost of Capital for Sectors that Purchase Commercial Clothes Washers
Based on the procedure described above and the data in Table 8224 Table 8225 shows the WACC for each of the four sectors that purchase commercial washers
Table 8225 Weighted Average Cost of Capital for Sectors that Purchase Commercial Clothes Washers
Sector Weighted-Average Cost of Capital Personal Services 69 Educational Services 106 Hotels 85 REIT 84
The WACC provides an estimate of the nominal cost of capital for firms that purchase commercial clothes washers The real WACC is calculated by adjusting the cost of capital by the expected rate of inflation using the following formula
1+WACCWACCr = 1
1+ r_
where
WACCr = Real weighted-average cost of capital WACC = Weighted-average cost of capital and r = Inflation rate
DOE applied this formula to the costs of capital shown in Table 8225 which yielded the discount rates for each of the sectors given in Table 8226 For the calculation of the discount rates DOE assumed an inflation rate of 25 percent (the average of inflation rates over the 2001ndash 2005 time period)23 Because DOE performed the discount rate calculation on companies or firms that typically purchase commercial clothes washers a distribution of discount rates were generated within each sector The standard deviation of the distribution for each sector is provided in Table 8226 To obtain an average discount rate value for the entire commercial clothe washer industry DOE analyzed additional data from the CEE The CEE estimates that there are up to 3000000 commercial clothes washers in use in the United States 2000000 of these in multi-family housing and 420000 in laundromats5 DOE assumed that the remaining 580000 washers are used in universities and educational institutions Using these proportions DOE derived weights of 14 percent 194 percent and 666 percent for personal services educational services and REIT respectively In the absence of any data regarding hotels DOE assumed the weight for educational services was applicable to hotels as well Weighting each sector by its market share DOE estimated the average discount rate for companies that purchase commercial washers to be 57 percent assuming an inflation rate of 25 percent (the average of inflation rates over the 2001ndash2005 time period)22
8-29
EERE-2006-STD-0127 COMMENT 691
Table 8226 Discount Rates for Commercial Clothes Washers Discount Rate Sector Average Std Deviation Share Personal Services 43 18 140 Educational Services 79 57 97 Hotels 58 20 97 REIT 57 22 666 Average 57 - 100
To account for variation in the discount rates within each of the sectors DOE used the average values and standard deviations in the table above to characterize the discount rates for each sector with a normal probability distribution Because the use of the above standard deviations yield distributions with negative values DOE truncated the lower end of the normal distribution at a discount rate of zero DOE also truncated the higher end of the normal distribution in equal proportion to the truncation at the lower end to maintain the average discount rates shown above in Table 8226
825 Effective Date of Standard
The effective date is the future date when a new standard becomes operative Based on DOErsquos implementation report for energy conservation standards activities submitted pursuant to Section 136 of the Energy Policy Act of 2005 a final rule for the commercial clothes washers being considered for this standards rulemaking is scheduled for completion no later than January 1 2010 Therefore the effective date of any new energy efficiency standards for these products will be three years after the final rule is published which is January 1 2013 The Department calculated the LCC for all consumers as if they each would purchase a new piece of equipment in the year the standard takes effect
826 Equipment Assignment for the Base Case
For purposes of conducting the LCC analysis DOE analyzed standard levels relative to a baseline efficiency level However some consumers already purchase products with efficiencies greater than the baseline levels Thus to accurately estimate the percentage of consumers that would be affected by a particular standard level DOE took into account the distribution of product efficiencies currently in the marketplace In other words rather than analyzing the impacts of a particular standard level assuming that all consumers are currently purchasing products at the baseline level DOE conducted the analysis by taking into account the full breadth of product efficiencies that consumers purchase under the base case (ie the case without new energy efficiency standards)
DOE took into account the mix of commercial clothes washer efficiencies by characterizing the current mix of product efficiencies as a probability distribution In other
8-30
EERE-2006-STD-0127 COMMENT 691
words as DOE performed the Monte Carlo simulation each standard level analyzed was evaluated against the distribution of product efficiencies in the base case
Rather than providing market share data AHAM provided shipment-weighted efficiencies of all commercial clothes washers24 That is shipment-weighted efficiencies were not provided separately for the top-loading and front-loading product classes For the year 2005 the shipment-weighted efficiencies of commercial clothes washers are 141 modified energy factor (MEF) and 1091 water factor (WF) Based on the shipment-weighted efficiency data DOE was able to derive the market share of each product class DOE assumed a bi-modal market share distribution consisting of only top-loading equipment meeting current minimum efficiency standards of 126 MEF95 WF and top-loading equipment with an efficiency of 200 MEF55 WF Thus by using a shipment-weighted efficiency of 141 MEF DOE determined that the market share of 126 MEF95 WF washers is 797 percent and the market share of 200 MEF55 WF washers is 203 percenta DOE interprets this result as indicating that in the year 2005 797 percent of the market consists of top-loading washers while 203 percent is comprised of front-loading washers
Subsequent to 2005 energy efficiency tax incentives in the Energy Policy Act of 2005 and extensions as well as new provisions in the Economic Stabilization Act of 2008 have resulted in more front-loading washers being produced by manufacturers DOE reviewed the US Securities and Exchange Commission (SEC) 10K report of the low volume manufacturer (LVM) of commercial clothes washers and determined that manufacturer tax credits in this recent federal legislation have resulted in significantly increased sales of the front-loading washers for the LVM When accounting for the LVMrsquos market share the increase in front-loading sales results in a current market share of 30 percent for front-loading washers Although tax credits are set to expire after 2010 DOE estimates that the tax credits would permanently transform the market so that front-loading washers would continue to comprise 30 percent of the market over the entire forecast period
Knowing the market share of each product class does not provide the distribution of equipment efficiencies within each class Therefore DOE relied on anther data sourcemdashthe California Energy Commission (CEC)25 As discussed in Section 3143 of Chapter 3 Market and Technology Assessment the CEC publishes the MEFs and WFs of commercial clothes washers sold in California Although the range in efficiencies is relatively wide the distribution is based on the number of available models being sold rather than the percent of shipments being sold Without any other data available DOE assumed that the distribution of available models in the CEC data were representative of actual shipments sold in the US Tables 8227 and 8228 present the market shares of the efficiency levels in the base case for top-loading and front-loading washers respectively The tables represent the equipment that establishments would have purchased in the year 2013 in the absence of new standards
a DOE did not consider the shipment-weighted average WF of 1091 in performing the market share calculation
8-31
EERE-2006-STD-0127 COMMENT 691
Table 8227 Top-Loading Commercial Clothes Washers Base Case Market Shares Standard Level MEF WF Market Share
Baseline 126 950 648 1 142 950 338 2 160 850 14
Represents units with the following MEF and WF ratings 126 le MEF lt 142 95 ge WF gt 85 Represents units with the following MEF and WF ratings 142 le MEF lt 160 95 ge WF gt 85 Represents units with the following MEF and WF ratings MEF ge 160 WF le 85
Table 8228 Front-Loading Commercial Clothes Washers Base Case Market Shares Standard Level MEF WF Market Share
Represents units with the following MEF and WF ratings 172 le MEF lt 180 80 ge WF gt 75 Represents units with the following MEF and WF ratings 180 le MEF lt 200 75 ge WF gt 55 Represents units with the following MEF and WF ratings 200 le MEF lt 220 55 ge WF gt 51 dagger Represents units with the following MEF and WF ratings 220 le MEF lt 235 51 ge WF gt 44 daggerdagger Represents units with the following MEF and WF ratings MEF ge 235 WF le 44
83 PAYBACK PERIOD INPUTS
The payback period is the amount of time it takes the consumer to recover the assumed higher purchase expense of more energy-efficient equipment as a result of lower operating costs Numerically the PBP is the ratio of the increase in purchase expense (ie from a less efficient design to a more efficient design) to the decrease in annual operating expenditures This type of calculation is known as a ldquosimplerdquo payback period because it does not take into account changes in operating expense over time or the time value of money ie the calculation is done at an effective discount rate of zero percent
The equation for PBP is
ΔICPBP =
ΔOC where
ΔIC = Difference in the total installed cost between the more efficient standard level and the baseline design and
ΔOC = difference in annual operating expenses
8-32
EERE-2006-STD-0127 COMMENT 691
Payback periods are expressed in years Payback periods greater than the life of the product mean that the increased total installed cost is not recovered in reduced operating expenses
The data inputs to PBP are the total installed cost of the equipment to the consumer for each efficiency level and the annual (first year) operating expenditures for each standard level The inputs to the total installed cost are the equipment price and the installation cost The inputs to the operating costs are the annual energy (and water) cost the annual repair cost and the annual maintenance cost The PBP uses the same inputs as the LCC analysis as described in section 82 except that energy (and water) price trends and discount rates are not required Since the PBP is a ldquosimplerdquo payback the required energy price is only for the year in which a new standard is to take effectmdashin this case the year 2013 The energy price DOE used in the PBP calculation was the price projected for that year Discount rates are also not required for the simple PBP calculation
84 LIFE-CYCLE COST AND PAYBACK PERIOD RESULTS
This section presents the LCC and PBP results for commercial clothes washers DOErsquos approach for conducting the LCC analysis relied on characterizing the uncertainty and variability of many of the inputs to the analysis with probability distributions DOE used a Monte Carlo simulation technique to perform the LCC calculations DOE calculated the average LCC and LCC savings and the median and average PBP for each of the candidate standard levels These standard levels are also referred to as candidate standard levels (CSL)
DOE calculated LCC savings and PBPs relative to the base case equipment that it assigned to commercial consumers As discussed in section 826 DOE assigned base case equipment that is more efficient than some of the CSLs For that reason the average LCC impacts are not equal to the difference between the LCC of a specific and the LCC of the baseline equipment
In the subsections below DOE presents figures showing the distribution of LCCs in the base case for each product class Also presented below for a specific are figures showing the distribution of LCC impacts and the distribution of PBPs The figures are presented as frequency charts that show the distribution of LCCs LCC impacts and PBPs with their corresponding probability of occurrence DOE generated the figures for the distributions from a Monte Carlo simulation run based on 10000 samples The LCC and PBP calculations were performed 10000 times by sampling from the probability distributions that DOE developed to characterize many of the inputs
Based on the Monte Carlo simulations that DOE performed for each standard-level DOE calculated the share of commercial consumers with a net LCC benefit with a net LCC cost and with no impact DOE considered a commercial user to receive no impact at a given if DOE assigned it base case equipment that is the same as or has higher efficiency than the CSL To
8-33
EERE-2006-STD-0127 COMMENT 691
illustrate the range of LCC and PBP impacts among the commercial clothes washer users the sections below present figures that provide such information for each product class
841 Base Case LCC Distributions
Figures 841 and 842 show the frequency charts for the base case LCC for both product applications of top-loading commercial clothes washers Figures 843 and 844 show the frequency charts for the base case LCC for both product applications of top-loading commercial clothes washersThe figures below show the mean LCC of the base case distribution as well as the full range of LCCs
Frequency Chart
Mean= $4023 000
005
009
014
018
0
4575
915
1372
183
$1629 $3170 $4711 $6252 $7793
10000 Trials 9779 Displayed
Forecast Top MF LCC Lev 0
Figure 841 Top-Loading Commercial Clothes Washers Multi-Family Application Base Case LCC Distribution
8-34
EERE-2006-STD-0127 COMMENT 691
Frequency Chart
Mean= $4182 000
004
008
012
016
0
405
81
1215
162
$2139 $3160 $4182 $5203 $6225
10000 Trials 9910 Displayed
Forecast Top Laun LCC Lev 0
Figure 842 Top-Loading Commercial Clothes Washers Laundromat Application Base Case LCC Distribution
Frequency Chart
Mean= $4220 000
004
008
013
017
0
4225
845
1267
169
$2218 $3481 $4743 $6005 $7267
10000 Trials 9777 Displayed
Forecast Front MF LCC Lev 0
Figure 843 Front-Loading Commercial Clothes Washers Multi-Family Application Base Case LCC Distribution
8-35
EERE-2006-STD-0127 COMMENT 691
Frequency Chart
Mean= $4380 000
004
008
013
017
0
42
84
126
168
$2689 $3534 $4380 $5225 $6070
10000 Trials 9907 Displayed
Forecast Front Laun LCC Lev 0
Figure 844 Front-Loading Commercial Clothes Washers Laundromat Application Base Case LCC Distribution
842 Standard-Level Distributions of LCC Impacts
Figure 845 is an example of a frequency chart showing the distribution of LCC differences for the case of CSL 2 for top-loading washers multi-family product application In the figure a text box next to a vertical line at that value on the x-axis shows the mean change in LCC (a savings of $179 in the example here) The note ldquoCertainty is 8634 from $0 to +Infinityrdquo means that 8634 percent of consumers using clothes washers will have LCC savings or not be impacted due to the CSL compared to the base case The large lsquospikersquo in Figure 845 represents the percentage of consumers that are not impacted by an increase in the CSL ie consumers that already use commercial clothes washers with efficiencies greater than or equal to the CSL Refer back to section 826 on the distribution of product efficiencies under the base case DOE can generate a frequency chart like the one shown in Figure 845 for every CSL and each product application
8-36
EERE-2006-STD-0127 COMMENT 691
Frequency Chart
Certainty is 8634 from $0 to +Infinity
Mean = $179 000
006
012
018
024
0
5875
1175
1762
235
($146) $61 $268 $474 $681
10000 Trials 9750 Displayed
Forecast To p MF LCC Sav Lev 2
Figure 845 Top-Loading Commercial Clothes Washers Multi-Family Application Distribution of LCC Impacts for CSL 2
843 Standard-Level PBP Distributions
Figure 846 is an example of a frequency chart showing the distribution of payback periods of CSL 2 for top-loading washer multi-family product application The large lsquospikersquo at the PBP value of -200 indicates the percentage of consumers using commercial clothes washers that are not impacted by an increase in the CSL ie consumers that already use top-loading commercial clothes washers with efficiencies equal to or greater than then CSL Refer back to section 826 on the distribution of product efficiencies under the base case DOE can generate a frequency chart like the one shown in Figure 846 for every CSL and each product application
8-37
EERE-2006-STD-0127 COMMENT 691
Frequency Chart
000
008
017
025
033
0
83
166
249
332
-200 232 663 1095 1526
10000 Trials 9534 Displayed
Forecast Top MF PB Lev 2
Figure 846 Commercial Clothes Washers Multi-Family Application Distribution of PBPs for CSL 3
844 LCC and PBP Results
Tables 841 and 842 show the LCC and PBP results for both product applications of top-loading commercial clothes washers Tables 843 and 844 show the LCC and PBP results for both product applications of front-loading commercial clothes washers For example in the case of the front-loading washer multi-family application CSL 2 (200 MEF550 WF) shows an average LCC savings of $195 Note that for CSL 2 approximately 96 percent of consumers in 2013 are assumed to already be using a commercial clothes washer in the base case at CSL 2 and thus have zero savings due to the standard If one compares the LCC of the base case at 172 MEF800 WF to the standards case at 200 MEF550 WF then the average LCC savings are $530 But since the base case includes a significant number of consumers that are not impacted by the standard the average savings over all of the consumers is $195 With regard to the PBPs shown below DOE determined the median and average values by excluding the percentage of households not impacted by the standard For example in the case of CSL 2 for front-loading washers about 96 percent of the consumers did not factor into the calculation of the median and average PBP
Figures 847 and 848 show the range of LCC savings for the CSLs for both product applications of top-loading commercial clothes washers Figures 849 and 8410 show the range of LCC savings for the CSLs for both product applications of front-loading commercial clothes washers For each CSL the top and the bottom of the box indicate the 75th and 25th
percentiles respectively The bar at the middle of the box indicates the median 50 percent of the households have LCC savings above this value The lsquowhiskersrsquo at the bottom and the top of the box indicate the 5th and 95th percentiles The small box shows the average LCC savings for each CSL
Figures 8411 and 8412 show the range of PBPs for top-loading commercial clothes washers Figures 8413 and 8414 show the range of PBPs for front-loading commercial clothes washers In these figures households which are not impacted by an increase in the standard are not included (this situation applies to all CSLs except CSL 4 for front-loading washers)
8-40
EERE-2006-STD-0127 COMMENT 691
Life
-cyc
le C
ost S
avin
gs ($
)
800
600
400
200
0
-200
Median
Mean
CSL 1 CSL 2
Candidate Standard Level
Figure 847 Range of LCC Savings for Top-Loading Commercial Clothes Washers Multi-Family
300
Life
-cyc
le C
ost S
avin
gs ($
) 200
100
0
-100
Median Mean
CSL 1 CSL 2
Candidate Standard Level
Figure 848 Range of LCC Savings for Top-Loading Commercial Clothes Washers Laundromat
8-41
EERE-2006-STD-0127 COMMENT 691
0
100
200
300
400
500
600
Life
-cyc
le C
ost S
avin
gs ($
)
Median Mean
CSL 1 CSL 2 CSL 3 CSL 4
Candidate Standard Level
Figure 849 Range of LCC Savings for Front-Loading Commercial Clothes Washers Multi-Family
250
Life
-cyc
le C
ost S
avin
gs ($
)
200
150
100
50
0
Median Mean
CSL 1 CSL 2 CSL 3 CSL 4
Candidate Standard Level
Figure 8410 Range of LCC Savings for Front-Loading Commercial Clothes Washers Laundromat
8-42
EERE-2006-STD-0127 COMMENT 691
60
Payb
ack
Perio
d (y
ears
) Pa
ybac
k Pe
riod
(yea
rs)
50
40
30
20
10
0
Figure 8411 Range of Payback Periods for Top-Loading Commercial Clothes Washers Multi-Family
20
Median Mean
CSL 1 CSL 2
Candidate Standard Level
Median Mean
CSL 1 CSL 2
Candidate Standard Level
15
10
5
0
Figure 8412 Range of Payback Periods for Top-Loading Commercial Clothes Washers Laundromat
8-43
EERE-2006-STD-0127 COMMENT 691
0
1
2
3
4
5
6
7
8
CSL 1 CSL 2 CSL 3 CSL 4
Candidate Standard Level
Payb
ack
Perio
d (y
ears
)
Median Mean
Figure 8413 Range of Payback Periods for Front-Loading Commercial Clothes Washers Multi-Family
00
05
10
15
20
25
30
CSL 1 CSL 2 CSL 3 CSL 4
Candidate Standard Level
Payb
ack
Perio
d (y
ears
)
Median Mean
Figure 8414 Range of Payback Periods for Front-Loading Commercial Clothes Washers Laundromat
8-44
EERE-2006-STD-0127 COMMENT 691
85 REBUTTABLE PAYBACK PERIOD
DOE presents rebuttable PBPs to provide the legally established rebuttable presumption that an energy efficiency standard is economically justified if the additional product costs attributed to the standard are less than three times the value of the first-year energy cost savings (42 USC sect6295 (o)(2)(B)(iii))
851 Metric
The basic equation for rebuttable PBP is the same as that shown in section 83 Payback Period Inputs Unlike the analyses described in sections 82 and 83 however the rebuttable PBP is not based on the use of household samples and probability distributions Rather than distributions the rebuttable PBP is based on discrete single-point values For example while DOE uses a probability distribution of regional energy prices in the distributional payback period analysis it uses only the national average energy price from the probability distribution to determine the rebuttable PBP
Other than the use of single-point values the most notable difference between the distribution PBP and the rebuttable PBP is the latterrsquos reliance on the DOE test procedure to determine a productrsquos annual energy and water consumption The following identifies the differences between the annual energy and water consumptions determined for the distribution PBP and the rebuttable PBP
DOE based the annual energy and water consumption values that it used to determine the rebuttable PBP on the number of cycles per year specified in the DOE test procedure 26 The commercial clothes washer test procedure cites the residential clothes washer test procedure to establish efficiency ratings as well as annual energy and water consumption As a result the annual number of use cycles 392 cycles per year for determining the annual energy and water consumption of commercial clothes washers is representative of residential use not commercial use Because residential use is significantly lower than the average usage for commercial applicationsmdash1241 cycles per year in multi-family buildings and 2190 cycles per year in laundromatsmdashthe average annual energy and water consumption used to determine rebuttable PBP will be significantly less than the consumption associated with actual usage As a result the rebuttable PBP will be significantly longer than the distribution PBPs for both multi-family and laundromat applications
852 Inputs
Inputs for the rebuttable PBP differ from the distribution PBP in that the calculation uses discrete values rather than distributions for inputs Note that for the calculation of distribution PBP because inputs for the determination of total installed cost were based on single-point values only the variability andor uncertainty in the inputs for determining operating cost contributed to variability in the distribution PBPs The following summarizes the single-point values that DOE used in the determination of the rebuttable PBP
8-45
EERE-2006-STD-0127 COMMENT 691
bull Manufacturing costs markups sales taxes and installation costs were all based on the single-point values used in the distributional LCC and PBP analysis
bull As described in section 851 annual energy and water consumption is based on the DOE test procedure
bull Energy and water prices are based on national average values for the year that new standards are assumed to take effect
bull An average discount rate or lifetime is not required in the rebuttable PBP calculation
bull The effective date of the standard is assumed to be 2013
853 Results
DOE calculated rebuttable PBPs for each CSL relative to the distribution of product efficiencies assumed for the base case (refer back to section 826 for more details on the base case efficiency distributions for each product) In other words DOE did not determine the rebuttable PBP relative to the baseline efficiency level but relative to the current distribution of product efficiencies DOE determined for the base case (ie the case without new standards) The following sections present the results for the sets of products being analyzed for this standards rulemaking
Tables 851 and 852 present the rebuttable PBPs for top-loading commercial clothes washers under both product applications multi-family buildings and laundromats Tables 853 and 854 present the rebuttable PBPs for front-loading commercial clothes washers under both product applications multi-family buildings and laundromats
1 US Department of Energy-Office of Energy Efficiency and Renewable Energy Energy Conservation Standards for Certain Consumer Products (Dishwashers Dehumidifiers Microwave Ovens and Electric and Gas Kitchen Ranges and Ovens) and for Certain Commercial and Industrial Equipment (Commercial Clothes Washers) Final Rule Federal Register 2009 74(66) pp 16040-16096
2 US Department of Energy-Office of Energy Efficiency and Renewable Energy Technical Support Document Energy Efficiency Program for Consumer Products and Commercial and Industrial Equipment Residential Dishwashers Dehumidifiers Cooking Products and Commercial Clothes Washers March 2009 Washington DC lthttpwww1eereenergygovbuildingsappliance_standardsresidentialcooking_prod ucts_final_rule_tsdhtmlgt
3 Association of Home Appliance Manufacturers AHAM 2005 Fact Book 2005 Washington DC
4 RS Means Mechanical Cost Data 31st Annual Edition 2008 Kingston MA
5 Consortium for Energy Efficiency Commercial Family-Sized Washers An Initiative Description of the Consortium for Energy Efficiency 1998 Boston MA lthttpwwwcee1orgcomcwshcwsh-mainphp3gt
6 US Department of Energy-Energy Information Administration Form EIA-861 for 2007 2007 Washington DC lthttpwwweiadoegovcneafelectricitypageeia861htmlgt
7 US Census Bureau Population estimates Population Population change and estimated components of population change April 1 2000 to July 1 2005 2006 Washington DC lthttpwwwcensusgovpopestdatasetshtmlgt
8 US Department of Energy-Energy Information Administration Natural Gas Monthly 2007 Washington DC lthttpwwweiadoegovoil_gasnatural_gasdata_publicationsnatural_gas_monthlyngmhtmgt
9 Raftelis Financial Consultants Inc 2006 RFCAWWA Water and Wastewater Rate Survey 2006 Charlotte NC Kansas City MO and Pasadena CA lthttpwwwrafteliscomratessurveyhtmlgt
10 US Department of Energy-Energy Information Administration An Updated Annual Energy Outlook 2009 Reference Case Reflecting Provisions of the American Recovery and Reinvestment Act and Recent Changes in the Economic Outlook April 2009 Washington DC SROIAF2009-03 lthttpwwweiadoegovoiafservicerptstimuluspdfsroiaf(2009)03pdfgt
8-48
EERE-2006-STD-0127 COMMENT 691
11 US Department of Energy-Energy Information Administration Annual Energy Outlook 2009 with Projections to 2030 March 2009 Washington DC DOEEIA-0383(2009) lthttpwwweiadoegovoiafaeopdf0383(2009)pdfgt
12 US Department of Labor-Bureau of Labor Statistics Consumer Price Indexes Item Water and sewerage maintenance Series Id CUUR0000SEHG01 US city average (not seasonally adjusted) 2008 Washington DC lthttpwwwblsgovcpihomehtmdatagt
13 Whirlpool Corporation Comment of Whirlpool Corporation Regarding the ANOPR for Cooking Products and Commercial Clothes Washers Docket Number EE-206-STD-2007 RIN 1904-AB49
14 US Department of Energy Technical Support Document Energy Efficiency Standards for Consumer Products Residential Central Air Conditioners and Heat Pumps May 2002 Washington DC Chapter 5 lthttpwwweereenergygovbuildingsappliance_standardsresidentialac_central_1000_rhtmlgt
15 Coin Laundry Association Industry Overview Downers Grove IL lthttpwwwcoinlaundryorgresourcesindustryoverviewcfmgt
16 Southern California Edison 2004-2005 Database for Energy Efficiency Resources (DEER) Update Study Final Report December 2005 Prepared for Southern California Edison by Itron Inc Vancouver WA lthttpwwwcalmacorgpublications2004-05_DEER_Update_Final_Report-Wopdfgt
17 Sullivan GP J W Currie TC Hillman and GB Parker High-Performance Clothes Washer Demonstration at Leisure World Laguna Woods Final Report December 2000 Prepared for Southern California Edison Company by Battelle Pacific Northwest Laboratory Richland WA lthttpeerepnlgovbuilding-technologiesdocscefinal202-22-01pdfgt
18 California Measurement Advisory Committee CALMAC Protocols Appendix F Effective Useful Live Values for Major Energy Efficiency Measures September 2000 lthttpwwwcalmacorgeventsAPX_Fpdfgt
19 Ibbotsons Associates Cost of Capital 2001 Yearbook Data Through March 2001 2001 Chicago IL
20 Damodaran Online The Data Page Cost of Capital by Industry Sector 2006 lthttppagessternnyuedu~adamodargt
21 Ibbotsons Associates Statistics for SIC code 72 2006 lthttpwwwibbotsoncomgt
8-49
EERE-2006-STD-0127 COMMENT 691
22 Ibbotsons Associates SBBI Valuation Edition 2001 Yearbook 2001 Chicago IL pp 38 44
23 US Government Printing Office Economic Report of the President 2006 2006 Washington DC lthttpwwwgpoaccessgoveopindexhtmlgt
24 Association of Home Appliance Manufacturers AHAM Data on Commercial Clothes Washers for DOE Efficiency Standards Rulemaking October 12 2006 Letter to Building Technologies Program US Department of Energy
25 California Energy Commission Appliances Databases ndash Clothes Washers 2009 Sacramento CA lthttpwwwenergycagovappliancesdatabaseexcel_based_filesClothes_Washersgt (Last Accessed February 5 2009)
26 US Office of the Federal Register Code of Federal Regulations Title 10 Part 431 -Energy Conservation Program for Certain Commercial and Industrial Equipment Subpart ImdashCommercial Clothes Washers January 1 2007 Washington DC
8-50
EERE-2006-STD-0127 COMMENT 691
CHAPTER 8 LIFE-CYCLE COST AND PAYBACK PERIOD ANALYSIS
81 INTRODUCTION
811 General Approach for LCC and PBP Analysis
812 Overview of LCC and PBP Inputs
82 LIFE-CYCLE COST INPUTS
821 Total Installed Cost Inputs
8212 Baseline Manufacturer Cost
8213 Standard-Level Manufacturer Cost Increases
8214 Overall Markup
8215 Installation Cost
8216 Total Installed Cost
822 Operating Cost Inputs
8221 Annual Energy and Water Consumption
8222 Energy and Water Prices
8223 Energy and Water Price Trends
8224 Repair and Maintenance Costs
823 Product Lifetime
824 Discount Rates
825 Effective Date of Standard
826 Equipment Assignment for the Base Case
83 PAYBACK PERIOD INPUTS
84 LIFE-CYCLE COST AND PAYBACK PERIOD RESULTS
841 Base Case LCC Distributions
842 Standard-Level Distributions of LCC Impacts
843 Standard-Level PBP Distributions
844 LCC and PBP Results
85 REBUTTABLE PAYBACK PERIOD
851 Metric
852 Inputs
853 Results
080
085
090
095
100
105
110
115
120
125
2005 2010 2015 2020 2025 2030 2035 2040 2045
Year
Pric
e Tr
end
(200
8 =
1)
High Grow th Case
Reference Case
Low Grow th Case
Figure 821 Electricity Price Trends
070
080
090
100
110
120
130
140
150
2005 2010 2015 2020 2025 2030 2035 2040 2045
Year
Pric
e Tr
end
(200
8 =
1)
High Grow th Case
Reference Case
Low Grow th Case
Figure 822 Natural Gas Price Trends
8-23
EERE-2006-STD-0127 COMMENT 691
To estimate the future trend for water and wastewater prices DOE used data on the historic trend in the national water price index (US city average) from 1970 through 200812
DOE extrapolated the future trend based on the linear growth from 1970 to 2008 But rather than use the extrapolated trend to forecast the prices for the four years after 2008 DOE pinned the annual price to the value in 2008 Otherwise forecasted prices for this four-year time period would have been up to eight percent lower than the price in 2008 Beyond the four-year time period DOE used the extrapolated trend to forecast prices out to the year 2043 Figure 823 shows the historical and projected water price trend data DOE used the forecasted data to estimate water and wastewater prices for commercial clothes washers
0
100
200
300
400
500
600
1970 1980 1990 2000 2010 2020 2030 2040
Year
Wat
er C
PI
Water Price CPI
Linear Extrapolation
Figure 823 Water Price Trend
8224 Repair and Maintenance Costs
Typically small incremental changes in product efficiency incur no or only very small changes in repair and maintenance costs over baseline products However equipment with efficiencies that are significantly higher than the baseline are more likely to incur higher repair and maintenance costs because its higher complexity and higher part count typically increases the cumulative probability of failure
The Whirlpool Corporation estimates that the unit shipments of horizontal-axis commercial clothes washers are less than half that of vertical-axis machines while their in-warranty repair costs are double that of vertical-axis machines13 This suggests that the repair of
8-24
EERE-2006-STD-0127 COMMENT 691
horizontal-axis machines is four times as costly as that of vertical-axis machines Because in-warranty repair costs based on Whirlpoolrsquos experience are greater for horizontal-axis machines that vertical-axis machines DOE estimated that commercial clothes washer repair costs would increase as a function of equipment efficiency DOE utilized an algorithm developed for central air conditioners and heat pumps to estimate repair cost increases14 This algorithm calculates annualized repair costs by dividing the half the equipment retail price by the equipment lifetime as show in the expression below
05 times EQP=RC ANNUAL LIFE
where
RCANNUAL = Annualized repair cost associated with equipment EQP = Consumer equipment price and LIFE = Product lifetime
Tables 8220 and 8221 show for each product class and each product application (multi-family buildings and laundromats) the annualized repair costs for the commercial clothes washer baseline and efficiency levels Annualized repair costs for each product application differ because commercial clothes washer lifetime is different for each application (Product lifetimes are presented below is section 823) The tables also present the consumer equipment prices for the baseline level and each efficiency level
Average product lifetime Multi-family = 113 years Laundromat = 71 years
8-25
EERE-2006-STD-0127 COMMENT 691
823 Product Lifetime
DOE used only primary sources of data to estimate product lifetimes DOE considered the sources listed in Table 8222 to estimate product lifetime
Table 8222 Commercial Clothes Washers Product Lifetime Estimates and Sources Lifetime (years) Source 7 to 10 CEE (1998) 5
Top-Loading (12 to 14 lbs) 5 to 8 Front-Loading (18 to 50 lbs) 10 to 15 CLA 15
8 to 9 ACEEE (2001) 16
5 (high-use) to 13 (low-use) Southern California Edison (2000) 17
15 dagger CALMAC (2000) 18
Used to establish laundromat lifetime only Used to establish multi-family lifetime only Depending on the usage rate the life can be shorter dagger Based on engineering judgment
Because DOE conducted the LCC analysis based on analyzing two product applicationsmdashmulti-family and laundromatsmdashit established separate lifetimes for each product application Because clothes washers in multi-family applications are used less frequently than in laundromats DOE decided to use only those sources that indicated lifetimes of seven years or greater for multi-family applications For laundromats applications where clothes washers receive heavier use DOE decided to use only those sources that indicated lifetimes of 10 years or less DOE then took an average of the lifetime estimates that met the above criteria For multi-family applications the average lifetime turned out to be 113 years while the average lifetime for laundromats was 71 years DOE used the low estimate for the above applicable sources to establish the minimum product lifetime for each product application For multi-family applications the minimum estimate is 7 years and for laundromats it is 5 years To establish the maximum product lifetime DOE took the difference between the minimum and average values (43 years for multi-family and 21 years for laundromats) and added it to the average product lifetime The minimum average and maximum lifetime estimates for each product application are shown in Table 8223
Table 8223 Commercial Clothes Washers Average Minimum and Maximum Product Lifetimes
Product Minimum
years Average
years Maximum
years Multi-Family Laundromats
70 50
113 71
155 93
8-26
EERE-2006-STD-0127 COMMENT 691
DOE characterized the clothes washer product lifetimes for each product application with Weibull distributions Appendix 8C presents the Weibull distributions for commercial clothes washers that DOE used in the LCC and PBP analysis
824 Discount Rates
DOE derived the discount rates for the LCC and PBP analysis from estimates of the finance cost of purchasing the considered products Following financial theory the finance cost of raising funds to purchase appliances can be interpreted as (1) the financial cost of any debt incurred to purchase equipment or (2) the opportunity cost of any equity used to purchase equipment For the residential products the purchase of equipment for new homes entails different finance costs for consumers than the purchase of replacement equipment Thus DOE used different discount rates for new construction and replacement installations
For commercial clothes washers DOE derived the discount rate from the cost of capital of publicly traded firms in the sectors that purchase commercial clothes washers19 These companies typically finance equipment purchases through debt and equity capital DOE estimated the cost of capital of these firms as the weighted average of the cost of equity financing and the cost of debt financing
The costs of debt and equity financing are usually obtainable from publicly available data about the following types of companies in the sectors that purchase commercial clothes washers
bull personal services (including laundromats) bull educational services (which buy washers for dormitories) bull hotels and bull real estate investment trusts (REITs) (ie building owners including owners of
apartment complexes)
Damodaran Online is a widely used source of information about company debt and equity financing for most types of firms and was the source of data for this analysis on educational services hotels and REITs20 Since Damodaran Online does not include data for firms in the personal services sector (SIC 7200) DOE used data from Ibbotsonrsquos Associates for this sector21 Ibbotson Associates is a leading authority on asset allocation with expertise in capital market expectations and portfolio implementation
DOE estimated the cost of equity using the capital asset pricing model (CAPM)22 The CAPM assumes that the cost of equity (ke) for a particular company is proportional to the systematic risk faced by that company where high risk is associated with a high cost of equity and low risk is associated with a low cost of equity The systematic risk facing a firm is determined by several variables the risk coefficient of the firm (β) the expected return on risk-free assets (Rf) and the equity risk premium (ERP) The risk coefficient of the firm indicates the risk associated with that firm relative to the price variability in the stock market The expected return on risk-free assets is defined by the yield on long-term government bonds The ERP represents the difference between the expected stock market return and the risk-free rate The
8-27
EERE-2006-STD-0127 COMMENT 691
cost of equity financing is estimated using the following equation where the variables are defined as above
ke = R f + (βtimes ERP) where
ke = Cost of equity Rf = Expected return on risk-free assets β = Risk coefficient of the firm and ERP = Equity risk premium
The cost of debt financing (kd) is the interest rate paid on money borrowed by a company The cost of debt is estimated by adding a risk adjustment factor (Ra) to the risk-free rate This risk adjustment factor depends on the variability of stock returns represented by standard deviations in stock prices So for firm i the cost of debt financing is
k = R + Rdi f ai
where
kd = Cost of debt financing for firm i Rf = Expected return on risk-free assets and Rai = Risk adjustment factor to risk-free rate for firm i
DOE estimates the weighted-average cost of capital (WACC) using the following equation
WACC = k times w + k times we e d d
where
WACC = Weighted average cost of capital we = Proportion of equity financing and wd = Proportion of debt financing
The values of the parameters used in the calculations are shown in Table 8224 below
Table 8224 Data for the Calculation of Weighted-Average Cost of Capital for Sectors that Purchase Commercial Clothes Washers
Based on the procedure described above and the data in Table 8224 Table 8225 shows the WACC for each of the four sectors that purchase commercial washers
Table 8225 Weighted Average Cost of Capital for Sectors that Purchase Commercial Clothes Washers
Sector Weighted-Average Cost of Capital Personal Services 69 Educational Services 106 Hotels 85 REIT 84
The WACC provides an estimate of the nominal cost of capital for firms that purchase commercial clothes washers The real WACC is calculated by adjusting the cost of capital by the expected rate of inflation using the following formula
1+WACCWACCr = 1
1+ r_
where
WACCr = Real weighted-average cost of capital WACC = Weighted-average cost of capital and r = Inflation rate
DOE applied this formula to the costs of capital shown in Table 8225 which yielded the discount rates for each of the sectors given in Table 8226 For the calculation of the discount rates DOE assumed an inflation rate of 25 percent (the average of inflation rates over the 2001ndash 2005 time period)23 Because DOE performed the discount rate calculation on companies or firms that typically purchase commercial clothes washers a distribution of discount rates were generated within each sector The standard deviation of the distribution for each sector is provided in Table 8226 To obtain an average discount rate value for the entire commercial clothe washer industry DOE analyzed additional data from the CEE The CEE estimates that there are up to 3000000 commercial clothes washers in use in the United States 2000000 of these in multi-family housing and 420000 in laundromats5 DOE assumed that the remaining 580000 washers are used in universities and educational institutions Using these proportions DOE derived weights of 14 percent 194 percent and 666 percent for personal services educational services and REIT respectively In the absence of any data regarding hotels DOE assumed the weight for educational services was applicable to hotels as well Weighting each sector by its market share DOE estimated the average discount rate for companies that purchase commercial washers to be 57 percent assuming an inflation rate of 25 percent (the average of inflation rates over the 2001ndash2005 time period)22
8-29
EERE-2006-STD-0127 COMMENT 691
Table 8226 Discount Rates for Commercial Clothes Washers Discount Rate Sector Average Std Deviation Share Personal Services 43 18 140 Educational Services 79 57 97 Hotels 58 20 97 REIT 57 22 666 Average 57 - 100
To account for variation in the discount rates within each of the sectors DOE used the average values and standard deviations in the table above to characterize the discount rates for each sector with a normal probability distribution Because the use of the above standard deviations yield distributions with negative values DOE truncated the lower end of the normal distribution at a discount rate of zero DOE also truncated the higher end of the normal distribution in equal proportion to the truncation at the lower end to maintain the average discount rates shown above in Table 8226
825 Effective Date of Standard
The effective date is the future date when a new standard becomes operative Based on DOErsquos implementation report for energy conservation standards activities submitted pursuant to Section 136 of the Energy Policy Act of 2005 a final rule for the commercial clothes washers being considered for this standards rulemaking is scheduled for completion no later than January 1 2010 Therefore the effective date of any new energy efficiency standards for these products will be three years after the final rule is published which is January 1 2013 The Department calculated the LCC for all consumers as if they each would purchase a new piece of equipment in the year the standard takes effect
826 Equipment Assignment for the Base Case
For purposes of conducting the LCC analysis DOE analyzed standard levels relative to a baseline efficiency level However some consumers already purchase products with efficiencies greater than the baseline levels Thus to accurately estimate the percentage of consumers that would be affected by a particular standard level DOE took into account the distribution of product efficiencies currently in the marketplace In other words rather than analyzing the impacts of a particular standard level assuming that all consumers are currently purchasing products at the baseline level DOE conducted the analysis by taking into account the full breadth of product efficiencies that consumers purchase under the base case (ie the case without new energy efficiency standards)
DOE took into account the mix of commercial clothes washer efficiencies by characterizing the current mix of product efficiencies as a probability distribution In other
8-30
EERE-2006-STD-0127 COMMENT 691
words as DOE performed the Monte Carlo simulation each standard level analyzed was evaluated against the distribution of product efficiencies in the base case
Rather than providing market share data AHAM provided shipment-weighted efficiencies of all commercial clothes washers24 That is shipment-weighted efficiencies were not provided separately for the top-loading and front-loading product classes For the year 2005 the shipment-weighted efficiencies of commercial clothes washers are 141 modified energy factor (MEF) and 1091 water factor (WF) Based on the shipment-weighted efficiency data DOE was able to derive the market share of each product class DOE assumed a bi-modal market share distribution consisting of only top-loading equipment meeting current minimum efficiency standards of 126 MEF95 WF and top-loading equipment with an efficiency of 200 MEF55 WF Thus by using a shipment-weighted efficiency of 141 MEF DOE determined that the market share of 126 MEF95 WF washers is 797 percent and the market share of 200 MEF55 WF washers is 203 percenta DOE interprets this result as indicating that in the year 2005 797 percent of the market consists of top-loading washers while 203 percent is comprised of front-loading washers
Subsequent to 2005 energy efficiency tax incentives in the Energy Policy Act of 2005 and extensions as well as new provisions in the Economic Stabilization Act of 2008 have resulted in more front-loading washers being produced by manufacturers DOE reviewed the US Securities and Exchange Commission (SEC) 10K report of the low volume manufacturer (LVM) of commercial clothes washers and determined that manufacturer tax credits in this recent federal legislation have resulted in significantly increased sales of the front-loading washers for the LVM When accounting for the LVMrsquos market share the increase in front-loading sales results in a current market share of 30 percent for front-loading washers Although tax credits are set to expire after 2010 DOE estimates that the tax credits would permanently transform the market so that front-loading washers would continue to comprise 30 percent of the market over the entire forecast period
Knowing the market share of each product class does not provide the distribution of equipment efficiencies within each class Therefore DOE relied on anther data sourcemdashthe California Energy Commission (CEC)25 As discussed in Section 3143 of Chapter 3 Market and Technology Assessment the CEC publishes the MEFs and WFs of commercial clothes washers sold in California Although the range in efficiencies is relatively wide the distribution is based on the number of available models being sold rather than the percent of shipments being sold Without any other data available DOE assumed that the distribution of available models in the CEC data were representative of actual shipments sold in the US Tables 8227 and 8228 present the market shares of the efficiency levels in the base case for top-loading and front-loading washers respectively The tables represent the equipment that establishments would have purchased in the year 2013 in the absence of new standards
a DOE did not consider the shipment-weighted average WF of 1091 in performing the market share calculation
8-31
EERE-2006-STD-0127 COMMENT 691
Table 8227 Top-Loading Commercial Clothes Washers Base Case Market Shares Standard Level MEF WF Market Share
Baseline 126 950 648 1 142 950 338 2 160 850 14
Represents units with the following MEF and WF ratings 126 le MEF lt 142 95 ge WF gt 85 Represents units with the following MEF and WF ratings 142 le MEF lt 160 95 ge WF gt 85 Represents units with the following MEF and WF ratings MEF ge 160 WF le 85
Table 8228 Front-Loading Commercial Clothes Washers Base Case Market Shares Standard Level MEF WF Market Share
Represents units with the following MEF and WF ratings 172 le MEF lt 180 80 ge WF gt 75 Represents units with the following MEF and WF ratings 180 le MEF lt 200 75 ge WF gt 55 Represents units with the following MEF and WF ratings 200 le MEF lt 220 55 ge WF gt 51 dagger Represents units with the following MEF and WF ratings 220 le MEF lt 235 51 ge WF gt 44 daggerdagger Represents units with the following MEF and WF ratings MEF ge 235 WF le 44
83 PAYBACK PERIOD INPUTS
The payback period is the amount of time it takes the consumer to recover the assumed higher purchase expense of more energy-efficient equipment as a result of lower operating costs Numerically the PBP is the ratio of the increase in purchase expense (ie from a less efficient design to a more efficient design) to the decrease in annual operating expenditures This type of calculation is known as a ldquosimplerdquo payback period because it does not take into account changes in operating expense over time or the time value of money ie the calculation is done at an effective discount rate of zero percent
The equation for PBP is
ΔICPBP =
ΔOC where
ΔIC = Difference in the total installed cost between the more efficient standard level and the baseline design and
ΔOC = difference in annual operating expenses
8-32
EERE-2006-STD-0127 COMMENT 691
Payback periods are expressed in years Payback periods greater than the life of the product mean that the increased total installed cost is not recovered in reduced operating expenses
The data inputs to PBP are the total installed cost of the equipment to the consumer for each efficiency level and the annual (first year) operating expenditures for each standard level The inputs to the total installed cost are the equipment price and the installation cost The inputs to the operating costs are the annual energy (and water) cost the annual repair cost and the annual maintenance cost The PBP uses the same inputs as the LCC analysis as described in section 82 except that energy (and water) price trends and discount rates are not required Since the PBP is a ldquosimplerdquo payback the required energy price is only for the year in which a new standard is to take effectmdashin this case the year 2013 The energy price DOE used in the PBP calculation was the price projected for that year Discount rates are also not required for the simple PBP calculation
84 LIFE-CYCLE COST AND PAYBACK PERIOD RESULTS
This section presents the LCC and PBP results for commercial clothes washers DOErsquos approach for conducting the LCC analysis relied on characterizing the uncertainty and variability of many of the inputs to the analysis with probability distributions DOE used a Monte Carlo simulation technique to perform the LCC calculations DOE calculated the average LCC and LCC savings and the median and average PBP for each of the candidate standard levels These standard levels are also referred to as candidate standard levels (CSL)
DOE calculated LCC savings and PBPs relative to the base case equipment that it assigned to commercial consumers As discussed in section 826 DOE assigned base case equipment that is more efficient than some of the CSLs For that reason the average LCC impacts are not equal to the difference between the LCC of a specific and the LCC of the baseline equipment
In the subsections below DOE presents figures showing the distribution of LCCs in the base case for each product class Also presented below for a specific are figures showing the distribution of LCC impacts and the distribution of PBPs The figures are presented as frequency charts that show the distribution of LCCs LCC impacts and PBPs with their corresponding probability of occurrence DOE generated the figures for the distributions from a Monte Carlo simulation run based on 10000 samples The LCC and PBP calculations were performed 10000 times by sampling from the probability distributions that DOE developed to characterize many of the inputs
Based on the Monte Carlo simulations that DOE performed for each standard-level DOE calculated the share of commercial consumers with a net LCC benefit with a net LCC cost and with no impact DOE considered a commercial user to receive no impact at a given if DOE assigned it base case equipment that is the same as or has higher efficiency than the CSL To
8-33
EERE-2006-STD-0127 COMMENT 691
illustrate the range of LCC and PBP impacts among the commercial clothes washer users the sections below present figures that provide such information for each product class
841 Base Case LCC Distributions
Figures 841 and 842 show the frequency charts for the base case LCC for both product applications of top-loading commercial clothes washers Figures 843 and 844 show the frequency charts for the base case LCC for both product applications of top-loading commercial clothes washersThe figures below show the mean LCC of the base case distribution as well as the full range of LCCs
Frequency Chart
Mean= $4023 000
005
009
014
018
0
4575
915
1372
183
$1629 $3170 $4711 $6252 $7793
10000 Trials 9779 Displayed
Forecast Top MF LCC Lev 0
Figure 841 Top-Loading Commercial Clothes Washers Multi-Family Application Base Case LCC Distribution
8-34
EERE-2006-STD-0127 COMMENT 691
Frequency Chart
Mean= $4182 000
004
008
012
016
0
405
81
1215
162
$2139 $3160 $4182 $5203 $6225
10000 Trials 9910 Displayed
Forecast Top Laun LCC Lev 0
Figure 842 Top-Loading Commercial Clothes Washers Laundromat Application Base Case LCC Distribution
Frequency Chart
Mean= $4220 000
004
008
013
017
0
4225
845
1267
169
$2218 $3481 $4743 $6005 $7267
10000 Trials 9777 Displayed
Forecast Front MF LCC Lev 0
Figure 843 Front-Loading Commercial Clothes Washers Multi-Family Application Base Case LCC Distribution
8-35
EERE-2006-STD-0127 COMMENT 691
Frequency Chart
Mean= $4380 000
004
008
013
017
0
42
84
126
168
$2689 $3534 $4380 $5225 $6070
10000 Trials 9907 Displayed
Forecast Front Laun LCC Lev 0
Figure 844 Front-Loading Commercial Clothes Washers Laundromat Application Base Case LCC Distribution
842 Standard-Level Distributions of LCC Impacts
Figure 845 is an example of a frequency chart showing the distribution of LCC differences for the case of CSL 2 for top-loading washers multi-family product application In the figure a text box next to a vertical line at that value on the x-axis shows the mean change in LCC (a savings of $179 in the example here) The note ldquoCertainty is 8634 from $0 to +Infinityrdquo means that 8634 percent of consumers using clothes washers will have LCC savings or not be impacted due to the CSL compared to the base case The large lsquospikersquo in Figure 845 represents the percentage of consumers that are not impacted by an increase in the CSL ie consumers that already use commercial clothes washers with efficiencies greater than or equal to the CSL Refer back to section 826 on the distribution of product efficiencies under the base case DOE can generate a frequency chart like the one shown in Figure 845 for every CSL and each product application
8-36
EERE-2006-STD-0127 COMMENT 691
Frequency Chart
Certainty is 8634 from $0 to +Infinity
Mean = $179 000
006
012
018
024
0
5875
1175
1762
235
($146) $61 $268 $474 $681
10000 Trials 9750 Displayed
Forecast To p MF LCC Sav Lev 2
Figure 845 Top-Loading Commercial Clothes Washers Multi-Family Application Distribution of LCC Impacts for CSL 2
843 Standard-Level PBP Distributions
Figure 846 is an example of a frequency chart showing the distribution of payback periods of CSL 2 for top-loading washer multi-family product application The large lsquospikersquo at the PBP value of -200 indicates the percentage of consumers using commercial clothes washers that are not impacted by an increase in the CSL ie consumers that already use top-loading commercial clothes washers with efficiencies equal to or greater than then CSL Refer back to section 826 on the distribution of product efficiencies under the base case DOE can generate a frequency chart like the one shown in Figure 846 for every CSL and each product application
8-37
EERE-2006-STD-0127 COMMENT 691
Frequency Chart
000
008
017
025
033
0
83
166
249
332
-200 232 663 1095 1526
10000 Trials 9534 Displayed
Forecast Top MF PB Lev 2
Figure 846 Commercial Clothes Washers Multi-Family Application Distribution of PBPs for CSL 3
844 LCC and PBP Results
Tables 841 and 842 show the LCC and PBP results for both product applications of top-loading commercial clothes washers Tables 843 and 844 show the LCC and PBP results for both product applications of front-loading commercial clothes washers For example in the case of the front-loading washer multi-family application CSL 2 (200 MEF550 WF) shows an average LCC savings of $195 Note that for CSL 2 approximately 96 percent of consumers in 2013 are assumed to already be using a commercial clothes washer in the base case at CSL 2 and thus have zero savings due to the standard If one compares the LCC of the base case at 172 MEF800 WF to the standards case at 200 MEF550 WF then the average LCC savings are $530 But since the base case includes a significant number of consumers that are not impacted by the standard the average savings over all of the consumers is $195 With regard to the PBPs shown below DOE determined the median and average values by excluding the percentage of households not impacted by the standard For example in the case of CSL 2 for front-loading washers about 96 percent of the consumers did not factor into the calculation of the median and average PBP
Figures 847 and 848 show the range of LCC savings for the CSLs for both product applications of top-loading commercial clothes washers Figures 849 and 8410 show the range of LCC savings for the CSLs for both product applications of front-loading commercial clothes washers For each CSL the top and the bottom of the box indicate the 75th and 25th
percentiles respectively The bar at the middle of the box indicates the median 50 percent of the households have LCC savings above this value The lsquowhiskersrsquo at the bottom and the top of the box indicate the 5th and 95th percentiles The small box shows the average LCC savings for each CSL
Figures 8411 and 8412 show the range of PBPs for top-loading commercial clothes washers Figures 8413 and 8414 show the range of PBPs for front-loading commercial clothes washers In these figures households which are not impacted by an increase in the standard are not included (this situation applies to all CSLs except CSL 4 for front-loading washers)
8-40
EERE-2006-STD-0127 COMMENT 691
Life
-cyc
le C
ost S
avin
gs ($
)
800
600
400
200
0
-200
Median
Mean
CSL 1 CSL 2
Candidate Standard Level
Figure 847 Range of LCC Savings for Top-Loading Commercial Clothes Washers Multi-Family
300
Life
-cyc
le C
ost S
avin
gs ($
) 200
100
0
-100
Median Mean
CSL 1 CSL 2
Candidate Standard Level
Figure 848 Range of LCC Savings for Top-Loading Commercial Clothes Washers Laundromat
8-41
EERE-2006-STD-0127 COMMENT 691
0
100
200
300
400
500
600
Life
-cyc
le C
ost S
avin
gs ($
)
Median Mean
CSL 1 CSL 2 CSL 3 CSL 4
Candidate Standard Level
Figure 849 Range of LCC Savings for Front-Loading Commercial Clothes Washers Multi-Family
250
Life
-cyc
le C
ost S
avin
gs ($
)
200
150
100
50
0
Median Mean
CSL 1 CSL 2 CSL 3 CSL 4
Candidate Standard Level
Figure 8410 Range of LCC Savings for Front-Loading Commercial Clothes Washers Laundromat
8-42
EERE-2006-STD-0127 COMMENT 691
60
Payb
ack
Perio
d (y
ears
) Pa
ybac
k Pe
riod
(yea
rs)
50
40
30
20
10
0
Figure 8411 Range of Payback Periods for Top-Loading Commercial Clothes Washers Multi-Family
20
Median Mean
CSL 1 CSL 2
Candidate Standard Level
Median Mean
CSL 1 CSL 2
Candidate Standard Level
15
10
5
0
Figure 8412 Range of Payback Periods for Top-Loading Commercial Clothes Washers Laundromat
8-43
EERE-2006-STD-0127 COMMENT 691
0
1
2
3
4
5
6
7
8
CSL 1 CSL 2 CSL 3 CSL 4
Candidate Standard Level
Payb
ack
Perio
d (y
ears
)
Median Mean
Figure 8413 Range of Payback Periods for Front-Loading Commercial Clothes Washers Multi-Family
00
05
10
15
20
25
30
CSL 1 CSL 2 CSL 3 CSL 4
Candidate Standard Level
Payb
ack
Perio
d (y
ears
)
Median Mean
Figure 8414 Range of Payback Periods for Front-Loading Commercial Clothes Washers Laundromat
8-44
EERE-2006-STD-0127 COMMENT 691
85 REBUTTABLE PAYBACK PERIOD
DOE presents rebuttable PBPs to provide the legally established rebuttable presumption that an energy efficiency standard is economically justified if the additional product costs attributed to the standard are less than three times the value of the first-year energy cost savings (42 USC sect6295 (o)(2)(B)(iii))
851 Metric
The basic equation for rebuttable PBP is the same as that shown in section 83 Payback Period Inputs Unlike the analyses described in sections 82 and 83 however the rebuttable PBP is not based on the use of household samples and probability distributions Rather than distributions the rebuttable PBP is based on discrete single-point values For example while DOE uses a probability distribution of regional energy prices in the distributional payback period analysis it uses only the national average energy price from the probability distribution to determine the rebuttable PBP
Other than the use of single-point values the most notable difference between the distribution PBP and the rebuttable PBP is the latterrsquos reliance on the DOE test procedure to determine a productrsquos annual energy and water consumption The following identifies the differences between the annual energy and water consumptions determined for the distribution PBP and the rebuttable PBP
DOE based the annual energy and water consumption values that it used to determine the rebuttable PBP on the number of cycles per year specified in the DOE test procedure 26 The commercial clothes washer test procedure cites the residential clothes washer test procedure to establish efficiency ratings as well as annual energy and water consumption As a result the annual number of use cycles 392 cycles per year for determining the annual energy and water consumption of commercial clothes washers is representative of residential use not commercial use Because residential use is significantly lower than the average usage for commercial applicationsmdash1241 cycles per year in multi-family buildings and 2190 cycles per year in laundromatsmdashthe average annual energy and water consumption used to determine rebuttable PBP will be significantly less than the consumption associated with actual usage As a result the rebuttable PBP will be significantly longer than the distribution PBPs for both multi-family and laundromat applications
852 Inputs
Inputs for the rebuttable PBP differ from the distribution PBP in that the calculation uses discrete values rather than distributions for inputs Note that for the calculation of distribution PBP because inputs for the determination of total installed cost were based on single-point values only the variability andor uncertainty in the inputs for determining operating cost contributed to variability in the distribution PBPs The following summarizes the single-point values that DOE used in the determination of the rebuttable PBP
8-45
EERE-2006-STD-0127 COMMENT 691
bull Manufacturing costs markups sales taxes and installation costs were all based on the single-point values used in the distributional LCC and PBP analysis
bull As described in section 851 annual energy and water consumption is based on the DOE test procedure
bull Energy and water prices are based on national average values for the year that new standards are assumed to take effect
bull An average discount rate or lifetime is not required in the rebuttable PBP calculation
bull The effective date of the standard is assumed to be 2013
853 Results
DOE calculated rebuttable PBPs for each CSL relative to the distribution of product efficiencies assumed for the base case (refer back to section 826 for more details on the base case efficiency distributions for each product) In other words DOE did not determine the rebuttable PBP relative to the baseline efficiency level but relative to the current distribution of product efficiencies DOE determined for the base case (ie the case without new standards) The following sections present the results for the sets of products being analyzed for this standards rulemaking
Tables 851 and 852 present the rebuttable PBPs for top-loading commercial clothes washers under both product applications multi-family buildings and laundromats Tables 853 and 854 present the rebuttable PBPs for front-loading commercial clothes washers under both product applications multi-family buildings and laundromats
1 US Department of Energy-Office of Energy Efficiency and Renewable Energy Energy Conservation Standards for Certain Consumer Products (Dishwashers Dehumidifiers Microwave Ovens and Electric and Gas Kitchen Ranges and Ovens) and for Certain Commercial and Industrial Equipment (Commercial Clothes Washers) Final Rule Federal Register 2009 74(66) pp 16040-16096
2 US Department of Energy-Office of Energy Efficiency and Renewable Energy Technical Support Document Energy Efficiency Program for Consumer Products and Commercial and Industrial Equipment Residential Dishwashers Dehumidifiers Cooking Products and Commercial Clothes Washers March 2009 Washington DC lthttpwww1eereenergygovbuildingsappliance_standardsresidentialcooking_prod ucts_final_rule_tsdhtmlgt
3 Association of Home Appliance Manufacturers AHAM 2005 Fact Book 2005 Washington DC
4 RS Means Mechanical Cost Data 31st Annual Edition 2008 Kingston MA
5 Consortium for Energy Efficiency Commercial Family-Sized Washers An Initiative Description of the Consortium for Energy Efficiency 1998 Boston MA lthttpwwwcee1orgcomcwshcwsh-mainphp3gt
6 US Department of Energy-Energy Information Administration Form EIA-861 for 2007 2007 Washington DC lthttpwwweiadoegovcneafelectricitypageeia861htmlgt
7 US Census Bureau Population estimates Population Population change and estimated components of population change April 1 2000 to July 1 2005 2006 Washington DC lthttpwwwcensusgovpopestdatasetshtmlgt
8 US Department of Energy-Energy Information Administration Natural Gas Monthly 2007 Washington DC lthttpwwweiadoegovoil_gasnatural_gasdata_publicationsnatural_gas_monthlyngmhtmgt
9 Raftelis Financial Consultants Inc 2006 RFCAWWA Water and Wastewater Rate Survey 2006 Charlotte NC Kansas City MO and Pasadena CA lthttpwwwrafteliscomratessurveyhtmlgt
10 US Department of Energy-Energy Information Administration An Updated Annual Energy Outlook 2009 Reference Case Reflecting Provisions of the American Recovery and Reinvestment Act and Recent Changes in the Economic Outlook April 2009 Washington DC SROIAF2009-03 lthttpwwweiadoegovoiafservicerptstimuluspdfsroiaf(2009)03pdfgt
8-48
EERE-2006-STD-0127 COMMENT 691
11 US Department of Energy-Energy Information Administration Annual Energy Outlook 2009 with Projections to 2030 March 2009 Washington DC DOEEIA-0383(2009) lthttpwwweiadoegovoiafaeopdf0383(2009)pdfgt
12 US Department of Labor-Bureau of Labor Statistics Consumer Price Indexes Item Water and sewerage maintenance Series Id CUUR0000SEHG01 US city average (not seasonally adjusted) 2008 Washington DC lthttpwwwblsgovcpihomehtmdatagt
13 Whirlpool Corporation Comment of Whirlpool Corporation Regarding the ANOPR for Cooking Products and Commercial Clothes Washers Docket Number EE-206-STD-2007 RIN 1904-AB49
14 US Department of Energy Technical Support Document Energy Efficiency Standards for Consumer Products Residential Central Air Conditioners and Heat Pumps May 2002 Washington DC Chapter 5 lthttpwwweereenergygovbuildingsappliance_standardsresidentialac_central_1000_rhtmlgt
15 Coin Laundry Association Industry Overview Downers Grove IL lthttpwwwcoinlaundryorgresourcesindustryoverviewcfmgt
16 Southern California Edison 2004-2005 Database for Energy Efficiency Resources (DEER) Update Study Final Report December 2005 Prepared for Southern California Edison by Itron Inc Vancouver WA lthttpwwwcalmacorgpublications2004-05_DEER_Update_Final_Report-Wopdfgt
17 Sullivan GP J W Currie TC Hillman and GB Parker High-Performance Clothes Washer Demonstration at Leisure World Laguna Woods Final Report December 2000 Prepared for Southern California Edison Company by Battelle Pacific Northwest Laboratory Richland WA lthttpeerepnlgovbuilding-technologiesdocscefinal202-22-01pdfgt
18 California Measurement Advisory Committee CALMAC Protocols Appendix F Effective Useful Live Values for Major Energy Efficiency Measures September 2000 lthttpwwwcalmacorgeventsAPX_Fpdfgt
19 Ibbotsons Associates Cost of Capital 2001 Yearbook Data Through March 2001 2001 Chicago IL
20 Damodaran Online The Data Page Cost of Capital by Industry Sector 2006 lthttppagessternnyuedu~adamodargt
21 Ibbotsons Associates Statistics for SIC code 72 2006 lthttpwwwibbotsoncomgt
8-49
EERE-2006-STD-0127 COMMENT 691
22 Ibbotsons Associates SBBI Valuation Edition 2001 Yearbook 2001 Chicago IL pp 38 44
23 US Government Printing Office Economic Report of the President 2006 2006 Washington DC lthttpwwwgpoaccessgoveopindexhtmlgt
24 Association of Home Appliance Manufacturers AHAM Data on Commercial Clothes Washers for DOE Efficiency Standards Rulemaking October 12 2006 Letter to Building Technologies Program US Department of Energy
25 California Energy Commission Appliances Databases ndash Clothes Washers 2009 Sacramento CA lthttpwwwenergycagovappliancesdatabaseexcel_based_filesClothes_Washersgt (Last Accessed February 5 2009)
26 US Office of the Federal Register Code of Federal Regulations Title 10 Part 431 -Energy Conservation Program for Certain Commercial and Industrial Equipment Subpart ImdashCommercial Clothes Washers January 1 2007 Washington DC
8-50
EERE-2006-STD-0127 COMMENT 691
CHAPTER 8 LIFE-CYCLE COST AND PAYBACK PERIOD ANALYSIS
81 INTRODUCTION
811 General Approach for LCC and PBP Analysis
812 Overview of LCC and PBP Inputs
82 LIFE-CYCLE COST INPUTS
821 Total Installed Cost Inputs
8212 Baseline Manufacturer Cost
8213 Standard-Level Manufacturer Cost Increases
8214 Overall Markup
8215 Installation Cost
8216 Total Installed Cost
822 Operating Cost Inputs
8221 Annual Energy and Water Consumption
8222 Energy and Water Prices
8223 Energy and Water Price Trends
8224 Repair and Maintenance Costs
823 Product Lifetime
824 Discount Rates
825 Effective Date of Standard
826 Equipment Assignment for the Base Case
83 PAYBACK PERIOD INPUTS
84 LIFE-CYCLE COST AND PAYBACK PERIOD RESULTS
841 Base Case LCC Distributions
842 Standard-Level Distributions of LCC Impacts
843 Standard-Level PBP Distributions
844 LCC and PBP Results
85 REBUTTABLE PAYBACK PERIOD
851 Metric
852 Inputs
853 Results
823 Product Lifetime
DOE used only primary sources of data to estimate product lifetimes DOE considered the sources listed in Table 8222 to estimate product lifetime
Table 8222 Commercial Clothes Washers Product Lifetime Estimates and Sources Lifetime (years) Source 7 to 10 CEE (1998) 5
Top-Loading (12 to 14 lbs) 5 to 8 Front-Loading (18 to 50 lbs) 10 to 15 CLA 15
8 to 9 ACEEE (2001) 16
5 (high-use) to 13 (low-use) Southern California Edison (2000) 17
15 dagger CALMAC (2000) 18
Used to establish laundromat lifetime only Used to establish multi-family lifetime only Depending on the usage rate the life can be shorter dagger Based on engineering judgment
Because DOE conducted the LCC analysis based on analyzing two product applicationsmdashmulti-family and laundromatsmdashit established separate lifetimes for each product application Because clothes washers in multi-family applications are used less frequently than in laundromats DOE decided to use only those sources that indicated lifetimes of seven years or greater for multi-family applications For laundromats applications where clothes washers receive heavier use DOE decided to use only those sources that indicated lifetimes of 10 years or less DOE then took an average of the lifetime estimates that met the above criteria For multi-family applications the average lifetime turned out to be 113 years while the average lifetime for laundromats was 71 years DOE used the low estimate for the above applicable sources to establish the minimum product lifetime for each product application For multi-family applications the minimum estimate is 7 years and for laundromats it is 5 years To establish the maximum product lifetime DOE took the difference between the minimum and average values (43 years for multi-family and 21 years for laundromats) and added it to the average product lifetime The minimum average and maximum lifetime estimates for each product application are shown in Table 8223
Table 8223 Commercial Clothes Washers Average Minimum and Maximum Product Lifetimes
Product Minimum
years Average
years Maximum
years Multi-Family Laundromats
70 50
113 71
155 93
8-26
EERE-2006-STD-0127 COMMENT 691
DOE characterized the clothes washer product lifetimes for each product application with Weibull distributions Appendix 8C presents the Weibull distributions for commercial clothes washers that DOE used in the LCC and PBP analysis
824 Discount Rates
DOE derived the discount rates for the LCC and PBP analysis from estimates of the finance cost of purchasing the considered products Following financial theory the finance cost of raising funds to purchase appliances can be interpreted as (1) the financial cost of any debt incurred to purchase equipment or (2) the opportunity cost of any equity used to purchase equipment For the residential products the purchase of equipment for new homes entails different finance costs for consumers than the purchase of replacement equipment Thus DOE used different discount rates for new construction and replacement installations
For commercial clothes washers DOE derived the discount rate from the cost of capital of publicly traded firms in the sectors that purchase commercial clothes washers19 These companies typically finance equipment purchases through debt and equity capital DOE estimated the cost of capital of these firms as the weighted average of the cost of equity financing and the cost of debt financing
The costs of debt and equity financing are usually obtainable from publicly available data about the following types of companies in the sectors that purchase commercial clothes washers
bull personal services (including laundromats) bull educational services (which buy washers for dormitories) bull hotels and bull real estate investment trusts (REITs) (ie building owners including owners of
apartment complexes)
Damodaran Online is a widely used source of information about company debt and equity financing for most types of firms and was the source of data for this analysis on educational services hotels and REITs20 Since Damodaran Online does not include data for firms in the personal services sector (SIC 7200) DOE used data from Ibbotsonrsquos Associates for this sector21 Ibbotson Associates is a leading authority on asset allocation with expertise in capital market expectations and portfolio implementation
DOE estimated the cost of equity using the capital asset pricing model (CAPM)22 The CAPM assumes that the cost of equity (ke) for a particular company is proportional to the systematic risk faced by that company where high risk is associated with a high cost of equity and low risk is associated with a low cost of equity The systematic risk facing a firm is determined by several variables the risk coefficient of the firm (β) the expected return on risk-free assets (Rf) and the equity risk premium (ERP) The risk coefficient of the firm indicates the risk associated with that firm relative to the price variability in the stock market The expected return on risk-free assets is defined by the yield on long-term government bonds The ERP represents the difference between the expected stock market return and the risk-free rate The
8-27
EERE-2006-STD-0127 COMMENT 691
cost of equity financing is estimated using the following equation where the variables are defined as above
ke = R f + (βtimes ERP) where
ke = Cost of equity Rf = Expected return on risk-free assets β = Risk coefficient of the firm and ERP = Equity risk premium
The cost of debt financing (kd) is the interest rate paid on money borrowed by a company The cost of debt is estimated by adding a risk adjustment factor (Ra) to the risk-free rate This risk adjustment factor depends on the variability of stock returns represented by standard deviations in stock prices So for firm i the cost of debt financing is
k = R + Rdi f ai
where
kd = Cost of debt financing for firm i Rf = Expected return on risk-free assets and Rai = Risk adjustment factor to risk-free rate for firm i
DOE estimates the weighted-average cost of capital (WACC) using the following equation
WACC = k times w + k times we e d d
where
WACC = Weighted average cost of capital we = Proportion of equity financing and wd = Proportion of debt financing
The values of the parameters used in the calculations are shown in Table 8224 below
Table 8224 Data for the Calculation of Weighted-Average Cost of Capital for Sectors that Purchase Commercial Clothes Washers
Based on the procedure described above and the data in Table 8224 Table 8225 shows the WACC for each of the four sectors that purchase commercial washers
Table 8225 Weighted Average Cost of Capital for Sectors that Purchase Commercial Clothes Washers
Sector Weighted-Average Cost of Capital Personal Services 69 Educational Services 106 Hotels 85 REIT 84
The WACC provides an estimate of the nominal cost of capital for firms that purchase commercial clothes washers The real WACC is calculated by adjusting the cost of capital by the expected rate of inflation using the following formula
1+WACCWACCr = 1
1+ r_
where
WACCr = Real weighted-average cost of capital WACC = Weighted-average cost of capital and r = Inflation rate
DOE applied this formula to the costs of capital shown in Table 8225 which yielded the discount rates for each of the sectors given in Table 8226 For the calculation of the discount rates DOE assumed an inflation rate of 25 percent (the average of inflation rates over the 2001ndash 2005 time period)23 Because DOE performed the discount rate calculation on companies or firms that typically purchase commercial clothes washers a distribution of discount rates were generated within each sector The standard deviation of the distribution for each sector is provided in Table 8226 To obtain an average discount rate value for the entire commercial clothe washer industry DOE analyzed additional data from the CEE The CEE estimates that there are up to 3000000 commercial clothes washers in use in the United States 2000000 of these in multi-family housing and 420000 in laundromats5 DOE assumed that the remaining 580000 washers are used in universities and educational institutions Using these proportions DOE derived weights of 14 percent 194 percent and 666 percent for personal services educational services and REIT respectively In the absence of any data regarding hotels DOE assumed the weight for educational services was applicable to hotels as well Weighting each sector by its market share DOE estimated the average discount rate for companies that purchase commercial washers to be 57 percent assuming an inflation rate of 25 percent (the average of inflation rates over the 2001ndash2005 time period)22
8-29
EERE-2006-STD-0127 COMMENT 691
Table 8226 Discount Rates for Commercial Clothes Washers Discount Rate Sector Average Std Deviation Share Personal Services 43 18 140 Educational Services 79 57 97 Hotels 58 20 97 REIT 57 22 666 Average 57 - 100
To account for variation in the discount rates within each of the sectors DOE used the average values and standard deviations in the table above to characterize the discount rates for each sector with a normal probability distribution Because the use of the above standard deviations yield distributions with negative values DOE truncated the lower end of the normal distribution at a discount rate of zero DOE also truncated the higher end of the normal distribution in equal proportion to the truncation at the lower end to maintain the average discount rates shown above in Table 8226
825 Effective Date of Standard
The effective date is the future date when a new standard becomes operative Based on DOErsquos implementation report for energy conservation standards activities submitted pursuant to Section 136 of the Energy Policy Act of 2005 a final rule for the commercial clothes washers being considered for this standards rulemaking is scheduled for completion no later than January 1 2010 Therefore the effective date of any new energy efficiency standards for these products will be three years after the final rule is published which is January 1 2013 The Department calculated the LCC for all consumers as if they each would purchase a new piece of equipment in the year the standard takes effect
826 Equipment Assignment for the Base Case
For purposes of conducting the LCC analysis DOE analyzed standard levels relative to a baseline efficiency level However some consumers already purchase products with efficiencies greater than the baseline levels Thus to accurately estimate the percentage of consumers that would be affected by a particular standard level DOE took into account the distribution of product efficiencies currently in the marketplace In other words rather than analyzing the impacts of a particular standard level assuming that all consumers are currently purchasing products at the baseline level DOE conducted the analysis by taking into account the full breadth of product efficiencies that consumers purchase under the base case (ie the case without new energy efficiency standards)
DOE took into account the mix of commercial clothes washer efficiencies by characterizing the current mix of product efficiencies as a probability distribution In other
8-30
EERE-2006-STD-0127 COMMENT 691
words as DOE performed the Monte Carlo simulation each standard level analyzed was evaluated against the distribution of product efficiencies in the base case
Rather than providing market share data AHAM provided shipment-weighted efficiencies of all commercial clothes washers24 That is shipment-weighted efficiencies were not provided separately for the top-loading and front-loading product classes For the year 2005 the shipment-weighted efficiencies of commercial clothes washers are 141 modified energy factor (MEF) and 1091 water factor (WF) Based on the shipment-weighted efficiency data DOE was able to derive the market share of each product class DOE assumed a bi-modal market share distribution consisting of only top-loading equipment meeting current minimum efficiency standards of 126 MEF95 WF and top-loading equipment with an efficiency of 200 MEF55 WF Thus by using a shipment-weighted efficiency of 141 MEF DOE determined that the market share of 126 MEF95 WF washers is 797 percent and the market share of 200 MEF55 WF washers is 203 percenta DOE interprets this result as indicating that in the year 2005 797 percent of the market consists of top-loading washers while 203 percent is comprised of front-loading washers
Subsequent to 2005 energy efficiency tax incentives in the Energy Policy Act of 2005 and extensions as well as new provisions in the Economic Stabilization Act of 2008 have resulted in more front-loading washers being produced by manufacturers DOE reviewed the US Securities and Exchange Commission (SEC) 10K report of the low volume manufacturer (LVM) of commercial clothes washers and determined that manufacturer tax credits in this recent federal legislation have resulted in significantly increased sales of the front-loading washers for the LVM When accounting for the LVMrsquos market share the increase in front-loading sales results in a current market share of 30 percent for front-loading washers Although tax credits are set to expire after 2010 DOE estimates that the tax credits would permanently transform the market so that front-loading washers would continue to comprise 30 percent of the market over the entire forecast period
Knowing the market share of each product class does not provide the distribution of equipment efficiencies within each class Therefore DOE relied on anther data sourcemdashthe California Energy Commission (CEC)25 As discussed in Section 3143 of Chapter 3 Market and Technology Assessment the CEC publishes the MEFs and WFs of commercial clothes washers sold in California Although the range in efficiencies is relatively wide the distribution is based on the number of available models being sold rather than the percent of shipments being sold Without any other data available DOE assumed that the distribution of available models in the CEC data were representative of actual shipments sold in the US Tables 8227 and 8228 present the market shares of the efficiency levels in the base case for top-loading and front-loading washers respectively The tables represent the equipment that establishments would have purchased in the year 2013 in the absence of new standards
a DOE did not consider the shipment-weighted average WF of 1091 in performing the market share calculation
8-31
EERE-2006-STD-0127 COMMENT 691
Table 8227 Top-Loading Commercial Clothes Washers Base Case Market Shares Standard Level MEF WF Market Share
Baseline 126 950 648 1 142 950 338 2 160 850 14
Represents units with the following MEF and WF ratings 126 le MEF lt 142 95 ge WF gt 85 Represents units with the following MEF and WF ratings 142 le MEF lt 160 95 ge WF gt 85 Represents units with the following MEF and WF ratings MEF ge 160 WF le 85
Table 8228 Front-Loading Commercial Clothes Washers Base Case Market Shares Standard Level MEF WF Market Share
Represents units with the following MEF and WF ratings 172 le MEF lt 180 80 ge WF gt 75 Represents units with the following MEF and WF ratings 180 le MEF lt 200 75 ge WF gt 55 Represents units with the following MEF and WF ratings 200 le MEF lt 220 55 ge WF gt 51 dagger Represents units with the following MEF and WF ratings 220 le MEF lt 235 51 ge WF gt 44 daggerdagger Represents units with the following MEF and WF ratings MEF ge 235 WF le 44
83 PAYBACK PERIOD INPUTS
The payback period is the amount of time it takes the consumer to recover the assumed higher purchase expense of more energy-efficient equipment as a result of lower operating costs Numerically the PBP is the ratio of the increase in purchase expense (ie from a less efficient design to a more efficient design) to the decrease in annual operating expenditures This type of calculation is known as a ldquosimplerdquo payback period because it does not take into account changes in operating expense over time or the time value of money ie the calculation is done at an effective discount rate of zero percent
The equation for PBP is
ΔICPBP =
ΔOC where
ΔIC = Difference in the total installed cost between the more efficient standard level and the baseline design and
ΔOC = difference in annual operating expenses
8-32
EERE-2006-STD-0127 COMMENT 691
Payback periods are expressed in years Payback periods greater than the life of the product mean that the increased total installed cost is not recovered in reduced operating expenses
The data inputs to PBP are the total installed cost of the equipment to the consumer for each efficiency level and the annual (first year) operating expenditures for each standard level The inputs to the total installed cost are the equipment price and the installation cost The inputs to the operating costs are the annual energy (and water) cost the annual repair cost and the annual maintenance cost The PBP uses the same inputs as the LCC analysis as described in section 82 except that energy (and water) price trends and discount rates are not required Since the PBP is a ldquosimplerdquo payback the required energy price is only for the year in which a new standard is to take effectmdashin this case the year 2013 The energy price DOE used in the PBP calculation was the price projected for that year Discount rates are also not required for the simple PBP calculation
84 LIFE-CYCLE COST AND PAYBACK PERIOD RESULTS
This section presents the LCC and PBP results for commercial clothes washers DOErsquos approach for conducting the LCC analysis relied on characterizing the uncertainty and variability of many of the inputs to the analysis with probability distributions DOE used a Monte Carlo simulation technique to perform the LCC calculations DOE calculated the average LCC and LCC savings and the median and average PBP for each of the candidate standard levels These standard levels are also referred to as candidate standard levels (CSL)
DOE calculated LCC savings and PBPs relative to the base case equipment that it assigned to commercial consumers As discussed in section 826 DOE assigned base case equipment that is more efficient than some of the CSLs For that reason the average LCC impacts are not equal to the difference between the LCC of a specific and the LCC of the baseline equipment
In the subsections below DOE presents figures showing the distribution of LCCs in the base case for each product class Also presented below for a specific are figures showing the distribution of LCC impacts and the distribution of PBPs The figures are presented as frequency charts that show the distribution of LCCs LCC impacts and PBPs with their corresponding probability of occurrence DOE generated the figures for the distributions from a Monte Carlo simulation run based on 10000 samples The LCC and PBP calculations were performed 10000 times by sampling from the probability distributions that DOE developed to characterize many of the inputs
Based on the Monte Carlo simulations that DOE performed for each standard-level DOE calculated the share of commercial consumers with a net LCC benefit with a net LCC cost and with no impact DOE considered a commercial user to receive no impact at a given if DOE assigned it base case equipment that is the same as or has higher efficiency than the CSL To
8-33
EERE-2006-STD-0127 COMMENT 691
illustrate the range of LCC and PBP impacts among the commercial clothes washer users the sections below present figures that provide such information for each product class
841 Base Case LCC Distributions
Figures 841 and 842 show the frequency charts for the base case LCC for both product applications of top-loading commercial clothes washers Figures 843 and 844 show the frequency charts for the base case LCC for both product applications of top-loading commercial clothes washersThe figures below show the mean LCC of the base case distribution as well as the full range of LCCs
Frequency Chart
Mean= $4023 000
005
009
014
018
0
4575
915
1372
183
$1629 $3170 $4711 $6252 $7793
10000 Trials 9779 Displayed
Forecast Top MF LCC Lev 0
Figure 841 Top-Loading Commercial Clothes Washers Multi-Family Application Base Case LCC Distribution
8-34
EERE-2006-STD-0127 COMMENT 691
Frequency Chart
Mean= $4182 000
004
008
012
016
0
405
81
1215
162
$2139 $3160 $4182 $5203 $6225
10000 Trials 9910 Displayed
Forecast Top Laun LCC Lev 0
Figure 842 Top-Loading Commercial Clothes Washers Laundromat Application Base Case LCC Distribution
Frequency Chart
Mean= $4220 000
004
008
013
017
0
4225
845
1267
169
$2218 $3481 $4743 $6005 $7267
10000 Trials 9777 Displayed
Forecast Front MF LCC Lev 0
Figure 843 Front-Loading Commercial Clothes Washers Multi-Family Application Base Case LCC Distribution
8-35
EERE-2006-STD-0127 COMMENT 691
Frequency Chart
Mean= $4380 000
004
008
013
017
0
42
84
126
168
$2689 $3534 $4380 $5225 $6070
10000 Trials 9907 Displayed
Forecast Front Laun LCC Lev 0
Figure 844 Front-Loading Commercial Clothes Washers Laundromat Application Base Case LCC Distribution
842 Standard-Level Distributions of LCC Impacts
Figure 845 is an example of a frequency chart showing the distribution of LCC differences for the case of CSL 2 for top-loading washers multi-family product application In the figure a text box next to a vertical line at that value on the x-axis shows the mean change in LCC (a savings of $179 in the example here) The note ldquoCertainty is 8634 from $0 to +Infinityrdquo means that 8634 percent of consumers using clothes washers will have LCC savings or not be impacted due to the CSL compared to the base case The large lsquospikersquo in Figure 845 represents the percentage of consumers that are not impacted by an increase in the CSL ie consumers that already use commercial clothes washers with efficiencies greater than or equal to the CSL Refer back to section 826 on the distribution of product efficiencies under the base case DOE can generate a frequency chart like the one shown in Figure 845 for every CSL and each product application
8-36
EERE-2006-STD-0127 COMMENT 691
Frequency Chart
Certainty is 8634 from $0 to +Infinity
Mean = $179 000
006
012
018
024
0
5875
1175
1762
235
($146) $61 $268 $474 $681
10000 Trials 9750 Displayed
Forecast To p MF LCC Sav Lev 2
Figure 845 Top-Loading Commercial Clothes Washers Multi-Family Application Distribution of LCC Impacts for CSL 2
843 Standard-Level PBP Distributions
Figure 846 is an example of a frequency chart showing the distribution of payback periods of CSL 2 for top-loading washer multi-family product application The large lsquospikersquo at the PBP value of -200 indicates the percentage of consumers using commercial clothes washers that are not impacted by an increase in the CSL ie consumers that already use top-loading commercial clothes washers with efficiencies equal to or greater than then CSL Refer back to section 826 on the distribution of product efficiencies under the base case DOE can generate a frequency chart like the one shown in Figure 846 for every CSL and each product application
8-37
EERE-2006-STD-0127 COMMENT 691
Frequency Chart
000
008
017
025
033
0
83
166
249
332
-200 232 663 1095 1526
10000 Trials 9534 Displayed
Forecast Top MF PB Lev 2
Figure 846 Commercial Clothes Washers Multi-Family Application Distribution of PBPs for CSL 3
844 LCC and PBP Results
Tables 841 and 842 show the LCC and PBP results for both product applications of top-loading commercial clothes washers Tables 843 and 844 show the LCC and PBP results for both product applications of front-loading commercial clothes washers For example in the case of the front-loading washer multi-family application CSL 2 (200 MEF550 WF) shows an average LCC savings of $195 Note that for CSL 2 approximately 96 percent of consumers in 2013 are assumed to already be using a commercial clothes washer in the base case at CSL 2 and thus have zero savings due to the standard If one compares the LCC of the base case at 172 MEF800 WF to the standards case at 200 MEF550 WF then the average LCC savings are $530 But since the base case includes a significant number of consumers that are not impacted by the standard the average savings over all of the consumers is $195 With regard to the PBPs shown below DOE determined the median and average values by excluding the percentage of households not impacted by the standard For example in the case of CSL 2 for front-loading washers about 96 percent of the consumers did not factor into the calculation of the median and average PBP
Figures 847 and 848 show the range of LCC savings for the CSLs for both product applications of top-loading commercial clothes washers Figures 849 and 8410 show the range of LCC savings for the CSLs for both product applications of front-loading commercial clothes washers For each CSL the top and the bottom of the box indicate the 75th and 25th
percentiles respectively The bar at the middle of the box indicates the median 50 percent of the households have LCC savings above this value The lsquowhiskersrsquo at the bottom and the top of the box indicate the 5th and 95th percentiles The small box shows the average LCC savings for each CSL
Figures 8411 and 8412 show the range of PBPs for top-loading commercial clothes washers Figures 8413 and 8414 show the range of PBPs for front-loading commercial clothes washers In these figures households which are not impacted by an increase in the standard are not included (this situation applies to all CSLs except CSL 4 for front-loading washers)
8-40
EERE-2006-STD-0127 COMMENT 691
Life
-cyc
le C
ost S
avin
gs ($
)
800
600
400
200
0
-200
Median
Mean
CSL 1 CSL 2
Candidate Standard Level
Figure 847 Range of LCC Savings for Top-Loading Commercial Clothes Washers Multi-Family
300
Life
-cyc
le C
ost S
avin
gs ($
) 200
100
0
-100
Median Mean
CSL 1 CSL 2
Candidate Standard Level
Figure 848 Range of LCC Savings for Top-Loading Commercial Clothes Washers Laundromat
8-41
EERE-2006-STD-0127 COMMENT 691
0
100
200
300
400
500
600
Life
-cyc
le C
ost S
avin
gs ($
)
Median Mean
CSL 1 CSL 2 CSL 3 CSL 4
Candidate Standard Level
Figure 849 Range of LCC Savings for Front-Loading Commercial Clothes Washers Multi-Family
250
Life
-cyc
le C
ost S
avin
gs ($
)
200
150
100
50
0
Median Mean
CSL 1 CSL 2 CSL 3 CSL 4
Candidate Standard Level
Figure 8410 Range of LCC Savings for Front-Loading Commercial Clothes Washers Laundromat
8-42
EERE-2006-STD-0127 COMMENT 691
60
Payb
ack
Perio
d (y
ears
) Pa
ybac
k Pe
riod
(yea
rs)
50
40
30
20
10
0
Figure 8411 Range of Payback Periods for Top-Loading Commercial Clothes Washers Multi-Family
20
Median Mean
CSL 1 CSL 2
Candidate Standard Level
Median Mean
CSL 1 CSL 2
Candidate Standard Level
15
10
5
0
Figure 8412 Range of Payback Periods for Top-Loading Commercial Clothes Washers Laundromat
8-43
EERE-2006-STD-0127 COMMENT 691
0
1
2
3
4
5
6
7
8
CSL 1 CSL 2 CSL 3 CSL 4
Candidate Standard Level
Payb
ack
Perio
d (y
ears
)
Median Mean
Figure 8413 Range of Payback Periods for Front-Loading Commercial Clothes Washers Multi-Family
00
05
10
15
20
25
30
CSL 1 CSL 2 CSL 3 CSL 4
Candidate Standard Level
Payb
ack
Perio
d (y
ears
)
Median Mean
Figure 8414 Range of Payback Periods for Front-Loading Commercial Clothes Washers Laundromat
8-44
EERE-2006-STD-0127 COMMENT 691
85 REBUTTABLE PAYBACK PERIOD
DOE presents rebuttable PBPs to provide the legally established rebuttable presumption that an energy efficiency standard is economically justified if the additional product costs attributed to the standard are less than three times the value of the first-year energy cost savings (42 USC sect6295 (o)(2)(B)(iii))
851 Metric
The basic equation for rebuttable PBP is the same as that shown in section 83 Payback Period Inputs Unlike the analyses described in sections 82 and 83 however the rebuttable PBP is not based on the use of household samples and probability distributions Rather than distributions the rebuttable PBP is based on discrete single-point values For example while DOE uses a probability distribution of regional energy prices in the distributional payback period analysis it uses only the national average energy price from the probability distribution to determine the rebuttable PBP
Other than the use of single-point values the most notable difference between the distribution PBP and the rebuttable PBP is the latterrsquos reliance on the DOE test procedure to determine a productrsquos annual energy and water consumption The following identifies the differences between the annual energy and water consumptions determined for the distribution PBP and the rebuttable PBP
DOE based the annual energy and water consumption values that it used to determine the rebuttable PBP on the number of cycles per year specified in the DOE test procedure 26 The commercial clothes washer test procedure cites the residential clothes washer test procedure to establish efficiency ratings as well as annual energy and water consumption As a result the annual number of use cycles 392 cycles per year for determining the annual energy and water consumption of commercial clothes washers is representative of residential use not commercial use Because residential use is significantly lower than the average usage for commercial applicationsmdash1241 cycles per year in multi-family buildings and 2190 cycles per year in laundromatsmdashthe average annual energy and water consumption used to determine rebuttable PBP will be significantly less than the consumption associated with actual usage As a result the rebuttable PBP will be significantly longer than the distribution PBPs for both multi-family and laundromat applications
852 Inputs
Inputs for the rebuttable PBP differ from the distribution PBP in that the calculation uses discrete values rather than distributions for inputs Note that for the calculation of distribution PBP because inputs for the determination of total installed cost were based on single-point values only the variability andor uncertainty in the inputs for determining operating cost contributed to variability in the distribution PBPs The following summarizes the single-point values that DOE used in the determination of the rebuttable PBP
8-45
EERE-2006-STD-0127 COMMENT 691
bull Manufacturing costs markups sales taxes and installation costs were all based on the single-point values used in the distributional LCC and PBP analysis
bull As described in section 851 annual energy and water consumption is based on the DOE test procedure
bull Energy and water prices are based on national average values for the year that new standards are assumed to take effect
bull An average discount rate or lifetime is not required in the rebuttable PBP calculation
bull The effective date of the standard is assumed to be 2013
853 Results
DOE calculated rebuttable PBPs for each CSL relative to the distribution of product efficiencies assumed for the base case (refer back to section 826 for more details on the base case efficiency distributions for each product) In other words DOE did not determine the rebuttable PBP relative to the baseline efficiency level but relative to the current distribution of product efficiencies DOE determined for the base case (ie the case without new standards) The following sections present the results for the sets of products being analyzed for this standards rulemaking
Tables 851 and 852 present the rebuttable PBPs for top-loading commercial clothes washers under both product applications multi-family buildings and laundromats Tables 853 and 854 present the rebuttable PBPs for front-loading commercial clothes washers under both product applications multi-family buildings and laundromats
1 US Department of Energy-Office of Energy Efficiency and Renewable Energy Energy Conservation Standards for Certain Consumer Products (Dishwashers Dehumidifiers Microwave Ovens and Electric and Gas Kitchen Ranges and Ovens) and for Certain Commercial and Industrial Equipment (Commercial Clothes Washers) Final Rule Federal Register 2009 74(66) pp 16040-16096
2 US Department of Energy-Office of Energy Efficiency and Renewable Energy Technical Support Document Energy Efficiency Program for Consumer Products and Commercial and Industrial Equipment Residential Dishwashers Dehumidifiers Cooking Products and Commercial Clothes Washers March 2009 Washington DC lthttpwww1eereenergygovbuildingsappliance_standardsresidentialcooking_prod ucts_final_rule_tsdhtmlgt
3 Association of Home Appliance Manufacturers AHAM 2005 Fact Book 2005 Washington DC
4 RS Means Mechanical Cost Data 31st Annual Edition 2008 Kingston MA
5 Consortium for Energy Efficiency Commercial Family-Sized Washers An Initiative Description of the Consortium for Energy Efficiency 1998 Boston MA lthttpwwwcee1orgcomcwshcwsh-mainphp3gt
6 US Department of Energy-Energy Information Administration Form EIA-861 for 2007 2007 Washington DC lthttpwwweiadoegovcneafelectricitypageeia861htmlgt
7 US Census Bureau Population estimates Population Population change and estimated components of population change April 1 2000 to July 1 2005 2006 Washington DC lthttpwwwcensusgovpopestdatasetshtmlgt
8 US Department of Energy-Energy Information Administration Natural Gas Monthly 2007 Washington DC lthttpwwweiadoegovoil_gasnatural_gasdata_publicationsnatural_gas_monthlyngmhtmgt
9 Raftelis Financial Consultants Inc 2006 RFCAWWA Water and Wastewater Rate Survey 2006 Charlotte NC Kansas City MO and Pasadena CA lthttpwwwrafteliscomratessurveyhtmlgt
10 US Department of Energy-Energy Information Administration An Updated Annual Energy Outlook 2009 Reference Case Reflecting Provisions of the American Recovery and Reinvestment Act and Recent Changes in the Economic Outlook April 2009 Washington DC SROIAF2009-03 lthttpwwweiadoegovoiafservicerptstimuluspdfsroiaf(2009)03pdfgt
8-48
EERE-2006-STD-0127 COMMENT 691
11 US Department of Energy-Energy Information Administration Annual Energy Outlook 2009 with Projections to 2030 March 2009 Washington DC DOEEIA-0383(2009) lthttpwwweiadoegovoiafaeopdf0383(2009)pdfgt
12 US Department of Labor-Bureau of Labor Statistics Consumer Price Indexes Item Water and sewerage maintenance Series Id CUUR0000SEHG01 US city average (not seasonally adjusted) 2008 Washington DC lthttpwwwblsgovcpihomehtmdatagt
13 Whirlpool Corporation Comment of Whirlpool Corporation Regarding the ANOPR for Cooking Products and Commercial Clothes Washers Docket Number EE-206-STD-2007 RIN 1904-AB49
14 US Department of Energy Technical Support Document Energy Efficiency Standards for Consumer Products Residential Central Air Conditioners and Heat Pumps May 2002 Washington DC Chapter 5 lthttpwwweereenergygovbuildingsappliance_standardsresidentialac_central_1000_rhtmlgt
15 Coin Laundry Association Industry Overview Downers Grove IL lthttpwwwcoinlaundryorgresourcesindustryoverviewcfmgt
16 Southern California Edison 2004-2005 Database for Energy Efficiency Resources (DEER) Update Study Final Report December 2005 Prepared for Southern California Edison by Itron Inc Vancouver WA lthttpwwwcalmacorgpublications2004-05_DEER_Update_Final_Report-Wopdfgt
17 Sullivan GP J W Currie TC Hillman and GB Parker High-Performance Clothes Washer Demonstration at Leisure World Laguna Woods Final Report December 2000 Prepared for Southern California Edison Company by Battelle Pacific Northwest Laboratory Richland WA lthttpeerepnlgovbuilding-technologiesdocscefinal202-22-01pdfgt
18 California Measurement Advisory Committee CALMAC Protocols Appendix F Effective Useful Live Values for Major Energy Efficiency Measures September 2000 lthttpwwwcalmacorgeventsAPX_Fpdfgt
19 Ibbotsons Associates Cost of Capital 2001 Yearbook Data Through March 2001 2001 Chicago IL
20 Damodaran Online The Data Page Cost of Capital by Industry Sector 2006 lthttppagessternnyuedu~adamodargt
21 Ibbotsons Associates Statistics for SIC code 72 2006 lthttpwwwibbotsoncomgt
8-49
EERE-2006-STD-0127 COMMENT 691
22 Ibbotsons Associates SBBI Valuation Edition 2001 Yearbook 2001 Chicago IL pp 38 44
23 US Government Printing Office Economic Report of the President 2006 2006 Washington DC lthttpwwwgpoaccessgoveopindexhtmlgt
24 Association of Home Appliance Manufacturers AHAM Data on Commercial Clothes Washers for DOE Efficiency Standards Rulemaking October 12 2006 Letter to Building Technologies Program US Department of Energy
25 California Energy Commission Appliances Databases ndash Clothes Washers 2009 Sacramento CA lthttpwwwenergycagovappliancesdatabaseexcel_based_filesClothes_Washersgt (Last Accessed February 5 2009)
26 US Office of the Federal Register Code of Federal Regulations Title 10 Part 431 -Energy Conservation Program for Certain Commercial and Industrial Equipment Subpart ImdashCommercial Clothes Washers January 1 2007 Washington DC
8-50
EERE-2006-STD-0127 COMMENT 691
CHAPTER 8 LIFE-CYCLE COST AND PAYBACK PERIOD ANALYSIS
81 INTRODUCTION
811 General Approach for LCC and PBP Analysis
812 Overview of LCC and PBP Inputs
82 LIFE-CYCLE COST INPUTS
821 Total Installed Cost Inputs
8212 Baseline Manufacturer Cost
8213 Standard-Level Manufacturer Cost Increases
8214 Overall Markup
8215 Installation Cost
8216 Total Installed Cost
822 Operating Cost Inputs
8221 Annual Energy and Water Consumption
8222 Energy and Water Prices
8223 Energy and Water Price Trends
8224 Repair and Maintenance Costs
823 Product Lifetime
824 Discount Rates
825 Effective Date of Standard
826 Equipment Assignment for the Base Case
83 PAYBACK PERIOD INPUTS
84 LIFE-CYCLE COST AND PAYBACK PERIOD RESULTS
841 Base Case LCC Distributions
842 Standard-Level Distributions of LCC Impacts
843 Standard-Level PBP Distributions
844 LCC and PBP Results
85 REBUTTABLE PAYBACK PERIOD
851 Metric
852 Inputs
853 Results
Frequency Chart
000
008
017
025
033
0
83
166
249
332
-200 232 663 1095 1526
10000 Trials 9534 Displayed
Forecast Top MF PB Lev 2
Figure 846 Commercial Clothes Washers Multi-Family Application Distribution of PBPs for CSL 3
844 LCC and PBP Results
Tables 841 and 842 show the LCC and PBP results for both product applications of top-loading commercial clothes washers Tables 843 and 844 show the LCC and PBP results for both product applications of front-loading commercial clothes washers For example in the case of the front-loading washer multi-family application CSL 2 (200 MEF550 WF) shows an average LCC savings of $195 Note that for CSL 2 approximately 96 percent of consumers in 2013 are assumed to already be using a commercial clothes washer in the base case at CSL 2 and thus have zero savings due to the standard If one compares the LCC of the base case at 172 MEF800 WF to the standards case at 200 MEF550 WF then the average LCC savings are $530 But since the base case includes a significant number of consumers that are not impacted by the standard the average savings over all of the consumers is $195 With regard to the PBPs shown below DOE determined the median and average values by excluding the percentage of households not impacted by the standard For example in the case of CSL 2 for front-loading washers about 96 percent of the consumers did not factor into the calculation of the median and average PBP
Figures 847 and 848 show the range of LCC savings for the CSLs for both product applications of top-loading commercial clothes washers Figures 849 and 8410 show the range of LCC savings for the CSLs for both product applications of front-loading commercial clothes washers For each CSL the top and the bottom of the box indicate the 75th and 25th
percentiles respectively The bar at the middle of the box indicates the median 50 percent of the households have LCC savings above this value The lsquowhiskersrsquo at the bottom and the top of the box indicate the 5th and 95th percentiles The small box shows the average LCC savings for each CSL
Figures 8411 and 8412 show the range of PBPs for top-loading commercial clothes washers Figures 8413 and 8414 show the range of PBPs for front-loading commercial clothes washers In these figures households which are not impacted by an increase in the standard are not included (this situation applies to all CSLs except CSL 4 for front-loading washers)
8-40
EERE-2006-STD-0127 COMMENT 691
Life
-cyc
le C
ost S
avin
gs ($
)
800
600
400
200
0
-200
Median
Mean
CSL 1 CSL 2
Candidate Standard Level
Figure 847 Range of LCC Savings for Top-Loading Commercial Clothes Washers Multi-Family
300
Life
-cyc
le C
ost S
avin
gs ($
) 200
100
0
-100
Median Mean
CSL 1 CSL 2
Candidate Standard Level
Figure 848 Range of LCC Savings for Top-Loading Commercial Clothes Washers Laundromat
8-41
EERE-2006-STD-0127 COMMENT 691
0
100
200
300
400
500
600
Life
-cyc
le C
ost S
avin
gs ($
)
Median Mean
CSL 1 CSL 2 CSL 3 CSL 4
Candidate Standard Level
Figure 849 Range of LCC Savings for Front-Loading Commercial Clothes Washers Multi-Family
250
Life
-cyc
le C
ost S
avin
gs ($
)
200
150
100
50
0
Median Mean
CSL 1 CSL 2 CSL 3 CSL 4
Candidate Standard Level
Figure 8410 Range of LCC Savings for Front-Loading Commercial Clothes Washers Laundromat
8-42
EERE-2006-STD-0127 COMMENT 691
60
Payb
ack
Perio
d (y
ears
) Pa
ybac
k Pe
riod
(yea
rs)
50
40
30
20
10
0
Figure 8411 Range of Payback Periods for Top-Loading Commercial Clothes Washers Multi-Family
20
Median Mean
CSL 1 CSL 2
Candidate Standard Level
Median Mean
CSL 1 CSL 2
Candidate Standard Level
15
10
5
0
Figure 8412 Range of Payback Periods for Top-Loading Commercial Clothes Washers Laundromat
8-43
EERE-2006-STD-0127 COMMENT 691
0
1
2
3
4
5
6
7
8
CSL 1 CSL 2 CSL 3 CSL 4
Candidate Standard Level
Payb
ack
Perio
d (y
ears
)
Median Mean
Figure 8413 Range of Payback Periods for Front-Loading Commercial Clothes Washers Multi-Family
00
05
10
15
20
25
30
CSL 1 CSL 2 CSL 3 CSL 4
Candidate Standard Level
Payb
ack
Perio
d (y
ears
)
Median Mean
Figure 8414 Range of Payback Periods for Front-Loading Commercial Clothes Washers Laundromat
8-44
EERE-2006-STD-0127 COMMENT 691
85 REBUTTABLE PAYBACK PERIOD
DOE presents rebuttable PBPs to provide the legally established rebuttable presumption that an energy efficiency standard is economically justified if the additional product costs attributed to the standard are less than three times the value of the first-year energy cost savings (42 USC sect6295 (o)(2)(B)(iii))
851 Metric
The basic equation for rebuttable PBP is the same as that shown in section 83 Payback Period Inputs Unlike the analyses described in sections 82 and 83 however the rebuttable PBP is not based on the use of household samples and probability distributions Rather than distributions the rebuttable PBP is based on discrete single-point values For example while DOE uses a probability distribution of regional energy prices in the distributional payback period analysis it uses only the national average energy price from the probability distribution to determine the rebuttable PBP
Other than the use of single-point values the most notable difference between the distribution PBP and the rebuttable PBP is the latterrsquos reliance on the DOE test procedure to determine a productrsquos annual energy and water consumption The following identifies the differences between the annual energy and water consumptions determined for the distribution PBP and the rebuttable PBP
DOE based the annual energy and water consumption values that it used to determine the rebuttable PBP on the number of cycles per year specified in the DOE test procedure 26 The commercial clothes washer test procedure cites the residential clothes washer test procedure to establish efficiency ratings as well as annual energy and water consumption As a result the annual number of use cycles 392 cycles per year for determining the annual energy and water consumption of commercial clothes washers is representative of residential use not commercial use Because residential use is significantly lower than the average usage for commercial applicationsmdash1241 cycles per year in multi-family buildings and 2190 cycles per year in laundromatsmdashthe average annual energy and water consumption used to determine rebuttable PBP will be significantly less than the consumption associated with actual usage As a result the rebuttable PBP will be significantly longer than the distribution PBPs for both multi-family and laundromat applications
852 Inputs
Inputs for the rebuttable PBP differ from the distribution PBP in that the calculation uses discrete values rather than distributions for inputs Note that for the calculation of distribution PBP because inputs for the determination of total installed cost were based on single-point values only the variability andor uncertainty in the inputs for determining operating cost contributed to variability in the distribution PBPs The following summarizes the single-point values that DOE used in the determination of the rebuttable PBP
8-45
EERE-2006-STD-0127 COMMENT 691
bull Manufacturing costs markups sales taxes and installation costs were all based on the single-point values used in the distributional LCC and PBP analysis
bull As described in section 851 annual energy and water consumption is based on the DOE test procedure
bull Energy and water prices are based on national average values for the year that new standards are assumed to take effect
bull An average discount rate or lifetime is not required in the rebuttable PBP calculation
bull The effective date of the standard is assumed to be 2013
853 Results
DOE calculated rebuttable PBPs for each CSL relative to the distribution of product efficiencies assumed for the base case (refer back to section 826 for more details on the base case efficiency distributions for each product) In other words DOE did not determine the rebuttable PBP relative to the baseline efficiency level but relative to the current distribution of product efficiencies DOE determined for the base case (ie the case without new standards) The following sections present the results for the sets of products being analyzed for this standards rulemaking
Tables 851 and 852 present the rebuttable PBPs for top-loading commercial clothes washers under both product applications multi-family buildings and laundromats Tables 853 and 854 present the rebuttable PBPs for front-loading commercial clothes washers under both product applications multi-family buildings and laundromats
1 US Department of Energy-Office of Energy Efficiency and Renewable Energy Energy Conservation Standards for Certain Consumer Products (Dishwashers Dehumidifiers Microwave Ovens and Electric and Gas Kitchen Ranges and Ovens) and for Certain Commercial and Industrial Equipment (Commercial Clothes Washers) Final Rule Federal Register 2009 74(66) pp 16040-16096
2 US Department of Energy-Office of Energy Efficiency and Renewable Energy Technical Support Document Energy Efficiency Program for Consumer Products and Commercial and Industrial Equipment Residential Dishwashers Dehumidifiers Cooking Products and Commercial Clothes Washers March 2009 Washington DC lthttpwww1eereenergygovbuildingsappliance_standardsresidentialcooking_prod ucts_final_rule_tsdhtmlgt
3 Association of Home Appliance Manufacturers AHAM 2005 Fact Book 2005 Washington DC
4 RS Means Mechanical Cost Data 31st Annual Edition 2008 Kingston MA
5 Consortium for Energy Efficiency Commercial Family-Sized Washers An Initiative Description of the Consortium for Energy Efficiency 1998 Boston MA lthttpwwwcee1orgcomcwshcwsh-mainphp3gt
6 US Department of Energy-Energy Information Administration Form EIA-861 for 2007 2007 Washington DC lthttpwwweiadoegovcneafelectricitypageeia861htmlgt
7 US Census Bureau Population estimates Population Population change and estimated components of population change April 1 2000 to July 1 2005 2006 Washington DC lthttpwwwcensusgovpopestdatasetshtmlgt
8 US Department of Energy-Energy Information Administration Natural Gas Monthly 2007 Washington DC lthttpwwweiadoegovoil_gasnatural_gasdata_publicationsnatural_gas_monthlyngmhtmgt
9 Raftelis Financial Consultants Inc 2006 RFCAWWA Water and Wastewater Rate Survey 2006 Charlotte NC Kansas City MO and Pasadena CA lthttpwwwrafteliscomratessurveyhtmlgt
10 US Department of Energy-Energy Information Administration An Updated Annual Energy Outlook 2009 Reference Case Reflecting Provisions of the American Recovery and Reinvestment Act and Recent Changes in the Economic Outlook April 2009 Washington DC SROIAF2009-03 lthttpwwweiadoegovoiafservicerptstimuluspdfsroiaf(2009)03pdfgt
8-48
EERE-2006-STD-0127 COMMENT 691
11 US Department of Energy-Energy Information Administration Annual Energy Outlook 2009 with Projections to 2030 March 2009 Washington DC DOEEIA-0383(2009) lthttpwwweiadoegovoiafaeopdf0383(2009)pdfgt
12 US Department of Labor-Bureau of Labor Statistics Consumer Price Indexes Item Water and sewerage maintenance Series Id CUUR0000SEHG01 US city average (not seasonally adjusted) 2008 Washington DC lthttpwwwblsgovcpihomehtmdatagt
13 Whirlpool Corporation Comment of Whirlpool Corporation Regarding the ANOPR for Cooking Products and Commercial Clothes Washers Docket Number EE-206-STD-2007 RIN 1904-AB49
14 US Department of Energy Technical Support Document Energy Efficiency Standards for Consumer Products Residential Central Air Conditioners and Heat Pumps May 2002 Washington DC Chapter 5 lthttpwwweereenergygovbuildingsappliance_standardsresidentialac_central_1000_rhtmlgt
15 Coin Laundry Association Industry Overview Downers Grove IL lthttpwwwcoinlaundryorgresourcesindustryoverviewcfmgt
16 Southern California Edison 2004-2005 Database for Energy Efficiency Resources (DEER) Update Study Final Report December 2005 Prepared for Southern California Edison by Itron Inc Vancouver WA lthttpwwwcalmacorgpublications2004-05_DEER_Update_Final_Report-Wopdfgt
17 Sullivan GP J W Currie TC Hillman and GB Parker High-Performance Clothes Washer Demonstration at Leisure World Laguna Woods Final Report December 2000 Prepared for Southern California Edison Company by Battelle Pacific Northwest Laboratory Richland WA lthttpeerepnlgovbuilding-technologiesdocscefinal202-22-01pdfgt
18 California Measurement Advisory Committee CALMAC Protocols Appendix F Effective Useful Live Values for Major Energy Efficiency Measures September 2000 lthttpwwwcalmacorgeventsAPX_Fpdfgt
19 Ibbotsons Associates Cost of Capital 2001 Yearbook Data Through March 2001 2001 Chicago IL
20 Damodaran Online The Data Page Cost of Capital by Industry Sector 2006 lthttppagessternnyuedu~adamodargt
21 Ibbotsons Associates Statistics for SIC code 72 2006 lthttpwwwibbotsoncomgt
8-49
EERE-2006-STD-0127 COMMENT 691
22 Ibbotsons Associates SBBI Valuation Edition 2001 Yearbook 2001 Chicago IL pp 38 44
23 US Government Printing Office Economic Report of the President 2006 2006 Washington DC lthttpwwwgpoaccessgoveopindexhtmlgt
24 Association of Home Appliance Manufacturers AHAM Data on Commercial Clothes Washers for DOE Efficiency Standards Rulemaking October 12 2006 Letter to Building Technologies Program US Department of Energy
25 California Energy Commission Appliances Databases ndash Clothes Washers 2009 Sacramento CA lthttpwwwenergycagovappliancesdatabaseexcel_based_filesClothes_Washersgt (Last Accessed February 5 2009)
26 US Office of the Federal Register Code of Federal Regulations Title 10 Part 431 -Energy Conservation Program for Certain Commercial and Industrial Equipment Subpart ImdashCommercial Clothes Washers January 1 2007 Washington DC
8-50
EERE-2006-STD-0127 COMMENT 691
CHAPTER 8 LIFE-CYCLE COST AND PAYBACK PERIOD ANALYSIS
81 INTRODUCTION
811 General Approach for LCC and PBP Analysis
812 Overview of LCC and PBP Inputs
82 LIFE-CYCLE COST INPUTS
821 Total Installed Cost Inputs
8212 Baseline Manufacturer Cost
8213 Standard-Level Manufacturer Cost Increases
8214 Overall Markup
8215 Installation Cost
8216 Total Installed Cost
822 Operating Cost Inputs
8221 Annual Energy and Water Consumption
8222 Energy and Water Prices
8223 Energy and Water Price Trends
8224 Repair and Maintenance Costs
823 Product Lifetime
824 Discount Rates
825 Effective Date of Standard
826 Equipment Assignment for the Base Case
83 PAYBACK PERIOD INPUTS
84 LIFE-CYCLE COST AND PAYBACK PERIOD RESULTS
841 Base Case LCC Distributions
842 Standard-Level Distributions of LCC Impacts
843 Standard-Level PBP Distributions
844 LCC and PBP Results
85 REBUTTABLE PAYBACK PERIOD
851 Metric
852 Inputs
853 Results
Life
-cyc
le C
ost S
avin
gs ($
)
800
600
400
200
0
-200
Median
Mean
CSL 1 CSL 2
Candidate Standard Level
Figure 847 Range of LCC Savings for Top-Loading Commercial Clothes Washers Multi-Family
300
Life
-cyc
le C
ost S
avin
gs ($
) 200
100
0
-100
Median Mean
CSL 1 CSL 2
Candidate Standard Level
Figure 848 Range of LCC Savings for Top-Loading Commercial Clothes Washers Laundromat
8-41
EERE-2006-STD-0127 COMMENT 691
0
100
200
300
400
500
600
Life
-cyc
le C
ost S
avin
gs ($
)
Median Mean
CSL 1 CSL 2 CSL 3 CSL 4
Candidate Standard Level
Figure 849 Range of LCC Savings for Front-Loading Commercial Clothes Washers Multi-Family
250
Life
-cyc
le C
ost S
avin
gs ($
)
200
150
100
50
0
Median Mean
CSL 1 CSL 2 CSL 3 CSL 4
Candidate Standard Level
Figure 8410 Range of LCC Savings for Front-Loading Commercial Clothes Washers Laundromat
8-42
EERE-2006-STD-0127 COMMENT 691
60
Payb
ack
Perio
d (y
ears
) Pa
ybac
k Pe
riod
(yea
rs)
50
40
30
20
10
0
Figure 8411 Range of Payback Periods for Top-Loading Commercial Clothes Washers Multi-Family
20
Median Mean
CSL 1 CSL 2
Candidate Standard Level
Median Mean
CSL 1 CSL 2
Candidate Standard Level
15
10
5
0
Figure 8412 Range of Payback Periods for Top-Loading Commercial Clothes Washers Laundromat
8-43
EERE-2006-STD-0127 COMMENT 691
0
1
2
3
4
5
6
7
8
CSL 1 CSL 2 CSL 3 CSL 4
Candidate Standard Level
Payb
ack
Perio
d (y
ears
)
Median Mean
Figure 8413 Range of Payback Periods for Front-Loading Commercial Clothes Washers Multi-Family
00
05
10
15
20
25
30
CSL 1 CSL 2 CSL 3 CSL 4
Candidate Standard Level
Payb
ack
Perio
d (y
ears
)
Median Mean
Figure 8414 Range of Payback Periods for Front-Loading Commercial Clothes Washers Laundromat
8-44
EERE-2006-STD-0127 COMMENT 691
85 REBUTTABLE PAYBACK PERIOD
DOE presents rebuttable PBPs to provide the legally established rebuttable presumption that an energy efficiency standard is economically justified if the additional product costs attributed to the standard are less than three times the value of the first-year energy cost savings (42 USC sect6295 (o)(2)(B)(iii))
851 Metric
The basic equation for rebuttable PBP is the same as that shown in section 83 Payback Period Inputs Unlike the analyses described in sections 82 and 83 however the rebuttable PBP is not based on the use of household samples and probability distributions Rather than distributions the rebuttable PBP is based on discrete single-point values For example while DOE uses a probability distribution of regional energy prices in the distributional payback period analysis it uses only the national average energy price from the probability distribution to determine the rebuttable PBP
Other than the use of single-point values the most notable difference between the distribution PBP and the rebuttable PBP is the latterrsquos reliance on the DOE test procedure to determine a productrsquos annual energy and water consumption The following identifies the differences between the annual energy and water consumptions determined for the distribution PBP and the rebuttable PBP
DOE based the annual energy and water consumption values that it used to determine the rebuttable PBP on the number of cycles per year specified in the DOE test procedure 26 The commercial clothes washer test procedure cites the residential clothes washer test procedure to establish efficiency ratings as well as annual energy and water consumption As a result the annual number of use cycles 392 cycles per year for determining the annual energy and water consumption of commercial clothes washers is representative of residential use not commercial use Because residential use is significantly lower than the average usage for commercial applicationsmdash1241 cycles per year in multi-family buildings and 2190 cycles per year in laundromatsmdashthe average annual energy and water consumption used to determine rebuttable PBP will be significantly less than the consumption associated with actual usage As a result the rebuttable PBP will be significantly longer than the distribution PBPs for both multi-family and laundromat applications
852 Inputs
Inputs for the rebuttable PBP differ from the distribution PBP in that the calculation uses discrete values rather than distributions for inputs Note that for the calculation of distribution PBP because inputs for the determination of total installed cost were based on single-point values only the variability andor uncertainty in the inputs for determining operating cost contributed to variability in the distribution PBPs The following summarizes the single-point values that DOE used in the determination of the rebuttable PBP
8-45
EERE-2006-STD-0127 COMMENT 691
bull Manufacturing costs markups sales taxes and installation costs were all based on the single-point values used in the distributional LCC and PBP analysis
bull As described in section 851 annual energy and water consumption is based on the DOE test procedure
bull Energy and water prices are based on national average values for the year that new standards are assumed to take effect
bull An average discount rate or lifetime is not required in the rebuttable PBP calculation
bull The effective date of the standard is assumed to be 2013
853 Results
DOE calculated rebuttable PBPs for each CSL relative to the distribution of product efficiencies assumed for the base case (refer back to section 826 for more details on the base case efficiency distributions for each product) In other words DOE did not determine the rebuttable PBP relative to the baseline efficiency level but relative to the current distribution of product efficiencies DOE determined for the base case (ie the case without new standards) The following sections present the results for the sets of products being analyzed for this standards rulemaking
Tables 851 and 852 present the rebuttable PBPs for top-loading commercial clothes washers under both product applications multi-family buildings and laundromats Tables 853 and 854 present the rebuttable PBPs for front-loading commercial clothes washers under both product applications multi-family buildings and laundromats
1 US Department of Energy-Office of Energy Efficiency and Renewable Energy Energy Conservation Standards for Certain Consumer Products (Dishwashers Dehumidifiers Microwave Ovens and Electric and Gas Kitchen Ranges and Ovens) and for Certain Commercial and Industrial Equipment (Commercial Clothes Washers) Final Rule Federal Register 2009 74(66) pp 16040-16096
2 US Department of Energy-Office of Energy Efficiency and Renewable Energy Technical Support Document Energy Efficiency Program for Consumer Products and Commercial and Industrial Equipment Residential Dishwashers Dehumidifiers Cooking Products and Commercial Clothes Washers March 2009 Washington DC lthttpwww1eereenergygovbuildingsappliance_standardsresidentialcooking_prod ucts_final_rule_tsdhtmlgt
3 Association of Home Appliance Manufacturers AHAM 2005 Fact Book 2005 Washington DC
4 RS Means Mechanical Cost Data 31st Annual Edition 2008 Kingston MA
5 Consortium for Energy Efficiency Commercial Family-Sized Washers An Initiative Description of the Consortium for Energy Efficiency 1998 Boston MA lthttpwwwcee1orgcomcwshcwsh-mainphp3gt
6 US Department of Energy-Energy Information Administration Form EIA-861 for 2007 2007 Washington DC lthttpwwweiadoegovcneafelectricitypageeia861htmlgt
7 US Census Bureau Population estimates Population Population change and estimated components of population change April 1 2000 to July 1 2005 2006 Washington DC lthttpwwwcensusgovpopestdatasetshtmlgt
8 US Department of Energy-Energy Information Administration Natural Gas Monthly 2007 Washington DC lthttpwwweiadoegovoil_gasnatural_gasdata_publicationsnatural_gas_monthlyngmhtmgt
9 Raftelis Financial Consultants Inc 2006 RFCAWWA Water and Wastewater Rate Survey 2006 Charlotte NC Kansas City MO and Pasadena CA lthttpwwwrafteliscomratessurveyhtmlgt
10 US Department of Energy-Energy Information Administration An Updated Annual Energy Outlook 2009 Reference Case Reflecting Provisions of the American Recovery and Reinvestment Act and Recent Changes in the Economic Outlook April 2009 Washington DC SROIAF2009-03 lthttpwwweiadoegovoiafservicerptstimuluspdfsroiaf(2009)03pdfgt
8-48
EERE-2006-STD-0127 COMMENT 691
11 US Department of Energy-Energy Information Administration Annual Energy Outlook 2009 with Projections to 2030 March 2009 Washington DC DOEEIA-0383(2009) lthttpwwweiadoegovoiafaeopdf0383(2009)pdfgt
12 US Department of Labor-Bureau of Labor Statistics Consumer Price Indexes Item Water and sewerage maintenance Series Id CUUR0000SEHG01 US city average (not seasonally adjusted) 2008 Washington DC lthttpwwwblsgovcpihomehtmdatagt
13 Whirlpool Corporation Comment of Whirlpool Corporation Regarding the ANOPR for Cooking Products and Commercial Clothes Washers Docket Number EE-206-STD-2007 RIN 1904-AB49
14 US Department of Energy Technical Support Document Energy Efficiency Standards for Consumer Products Residential Central Air Conditioners and Heat Pumps May 2002 Washington DC Chapter 5 lthttpwwweereenergygovbuildingsappliance_standardsresidentialac_central_1000_rhtmlgt
15 Coin Laundry Association Industry Overview Downers Grove IL lthttpwwwcoinlaundryorgresourcesindustryoverviewcfmgt
16 Southern California Edison 2004-2005 Database for Energy Efficiency Resources (DEER) Update Study Final Report December 2005 Prepared for Southern California Edison by Itron Inc Vancouver WA lthttpwwwcalmacorgpublications2004-05_DEER_Update_Final_Report-Wopdfgt
17 Sullivan GP J W Currie TC Hillman and GB Parker High-Performance Clothes Washer Demonstration at Leisure World Laguna Woods Final Report December 2000 Prepared for Southern California Edison Company by Battelle Pacific Northwest Laboratory Richland WA lthttpeerepnlgovbuilding-technologiesdocscefinal202-22-01pdfgt
18 California Measurement Advisory Committee CALMAC Protocols Appendix F Effective Useful Live Values for Major Energy Efficiency Measures September 2000 lthttpwwwcalmacorgeventsAPX_Fpdfgt
19 Ibbotsons Associates Cost of Capital 2001 Yearbook Data Through March 2001 2001 Chicago IL
20 Damodaran Online The Data Page Cost of Capital by Industry Sector 2006 lthttppagessternnyuedu~adamodargt
21 Ibbotsons Associates Statistics for SIC code 72 2006 lthttpwwwibbotsoncomgt
8-49
EERE-2006-STD-0127 COMMENT 691
22 Ibbotsons Associates SBBI Valuation Edition 2001 Yearbook 2001 Chicago IL pp 38 44
23 US Government Printing Office Economic Report of the President 2006 2006 Washington DC lthttpwwwgpoaccessgoveopindexhtmlgt
24 Association of Home Appliance Manufacturers AHAM Data on Commercial Clothes Washers for DOE Efficiency Standards Rulemaking October 12 2006 Letter to Building Technologies Program US Department of Energy
25 California Energy Commission Appliances Databases ndash Clothes Washers 2009 Sacramento CA lthttpwwwenergycagovappliancesdatabaseexcel_based_filesClothes_Washersgt (Last Accessed February 5 2009)
26 US Office of the Federal Register Code of Federal Regulations Title 10 Part 431 -Energy Conservation Program for Certain Commercial and Industrial Equipment Subpart ImdashCommercial Clothes Washers January 1 2007 Washington DC
8-50
EERE-2006-STD-0127 COMMENT 691
CHAPTER 8 LIFE-CYCLE COST AND PAYBACK PERIOD ANALYSIS
81 INTRODUCTION
811 General Approach for LCC and PBP Analysis
812 Overview of LCC and PBP Inputs
82 LIFE-CYCLE COST INPUTS
821 Total Installed Cost Inputs
8212 Baseline Manufacturer Cost
8213 Standard-Level Manufacturer Cost Increases
8214 Overall Markup
8215 Installation Cost
8216 Total Installed Cost
822 Operating Cost Inputs
8221 Annual Energy and Water Consumption
8222 Energy and Water Prices
8223 Energy and Water Price Trends
8224 Repair and Maintenance Costs
823 Product Lifetime
824 Discount Rates
825 Effective Date of Standard
826 Equipment Assignment for the Base Case
83 PAYBACK PERIOD INPUTS
84 LIFE-CYCLE COST AND PAYBACK PERIOD RESULTS
841 Base Case LCC Distributions
842 Standard-Level Distributions of LCC Impacts
843 Standard-Level PBP Distributions
844 LCC and PBP Results
85 REBUTTABLE PAYBACK PERIOD
851 Metric
852 Inputs
853 Results
0
100
200
300
400
500
600
Life
-cyc
le C
ost S
avin
gs ($
)
Median Mean
CSL 1 CSL 2 CSL 3 CSL 4
Candidate Standard Level
Figure 849 Range of LCC Savings for Front-Loading Commercial Clothes Washers Multi-Family
250
Life
-cyc
le C
ost S
avin
gs ($
)
200
150
100
50
0
Median Mean
CSL 1 CSL 2 CSL 3 CSL 4
Candidate Standard Level
Figure 8410 Range of LCC Savings for Front-Loading Commercial Clothes Washers Laundromat
8-42
EERE-2006-STD-0127 COMMENT 691
60
Payb
ack
Perio
d (y
ears
) Pa
ybac
k Pe
riod
(yea
rs)
50
40
30
20
10
0
Figure 8411 Range of Payback Periods for Top-Loading Commercial Clothes Washers Multi-Family
20
Median Mean
CSL 1 CSL 2
Candidate Standard Level
Median Mean
CSL 1 CSL 2
Candidate Standard Level
15
10
5
0
Figure 8412 Range of Payback Periods for Top-Loading Commercial Clothes Washers Laundromat
8-43
EERE-2006-STD-0127 COMMENT 691
0
1
2
3
4
5
6
7
8
CSL 1 CSL 2 CSL 3 CSL 4
Candidate Standard Level
Payb
ack
Perio
d (y
ears
)
Median Mean
Figure 8413 Range of Payback Periods for Front-Loading Commercial Clothes Washers Multi-Family
00
05
10
15
20
25
30
CSL 1 CSL 2 CSL 3 CSL 4
Candidate Standard Level
Payb
ack
Perio
d (y
ears
)
Median Mean
Figure 8414 Range of Payback Periods for Front-Loading Commercial Clothes Washers Laundromat
8-44
EERE-2006-STD-0127 COMMENT 691
85 REBUTTABLE PAYBACK PERIOD
DOE presents rebuttable PBPs to provide the legally established rebuttable presumption that an energy efficiency standard is economically justified if the additional product costs attributed to the standard are less than three times the value of the first-year energy cost savings (42 USC sect6295 (o)(2)(B)(iii))
851 Metric
The basic equation for rebuttable PBP is the same as that shown in section 83 Payback Period Inputs Unlike the analyses described in sections 82 and 83 however the rebuttable PBP is not based on the use of household samples and probability distributions Rather than distributions the rebuttable PBP is based on discrete single-point values For example while DOE uses a probability distribution of regional energy prices in the distributional payback period analysis it uses only the national average energy price from the probability distribution to determine the rebuttable PBP
Other than the use of single-point values the most notable difference between the distribution PBP and the rebuttable PBP is the latterrsquos reliance on the DOE test procedure to determine a productrsquos annual energy and water consumption The following identifies the differences between the annual energy and water consumptions determined for the distribution PBP and the rebuttable PBP
DOE based the annual energy and water consumption values that it used to determine the rebuttable PBP on the number of cycles per year specified in the DOE test procedure 26 The commercial clothes washer test procedure cites the residential clothes washer test procedure to establish efficiency ratings as well as annual energy and water consumption As a result the annual number of use cycles 392 cycles per year for determining the annual energy and water consumption of commercial clothes washers is representative of residential use not commercial use Because residential use is significantly lower than the average usage for commercial applicationsmdash1241 cycles per year in multi-family buildings and 2190 cycles per year in laundromatsmdashthe average annual energy and water consumption used to determine rebuttable PBP will be significantly less than the consumption associated with actual usage As a result the rebuttable PBP will be significantly longer than the distribution PBPs for both multi-family and laundromat applications
852 Inputs
Inputs for the rebuttable PBP differ from the distribution PBP in that the calculation uses discrete values rather than distributions for inputs Note that for the calculation of distribution PBP because inputs for the determination of total installed cost were based on single-point values only the variability andor uncertainty in the inputs for determining operating cost contributed to variability in the distribution PBPs The following summarizes the single-point values that DOE used in the determination of the rebuttable PBP
8-45
EERE-2006-STD-0127 COMMENT 691
bull Manufacturing costs markups sales taxes and installation costs were all based on the single-point values used in the distributional LCC and PBP analysis
bull As described in section 851 annual energy and water consumption is based on the DOE test procedure
bull Energy and water prices are based on national average values for the year that new standards are assumed to take effect
bull An average discount rate or lifetime is not required in the rebuttable PBP calculation
bull The effective date of the standard is assumed to be 2013
853 Results
DOE calculated rebuttable PBPs for each CSL relative to the distribution of product efficiencies assumed for the base case (refer back to section 826 for more details on the base case efficiency distributions for each product) In other words DOE did not determine the rebuttable PBP relative to the baseline efficiency level but relative to the current distribution of product efficiencies DOE determined for the base case (ie the case without new standards) The following sections present the results for the sets of products being analyzed for this standards rulemaking
Tables 851 and 852 present the rebuttable PBPs for top-loading commercial clothes washers under both product applications multi-family buildings and laundromats Tables 853 and 854 present the rebuttable PBPs for front-loading commercial clothes washers under both product applications multi-family buildings and laundromats
1 US Department of Energy-Office of Energy Efficiency and Renewable Energy Energy Conservation Standards for Certain Consumer Products (Dishwashers Dehumidifiers Microwave Ovens and Electric and Gas Kitchen Ranges and Ovens) and for Certain Commercial and Industrial Equipment (Commercial Clothes Washers) Final Rule Federal Register 2009 74(66) pp 16040-16096
2 US Department of Energy-Office of Energy Efficiency and Renewable Energy Technical Support Document Energy Efficiency Program for Consumer Products and Commercial and Industrial Equipment Residential Dishwashers Dehumidifiers Cooking Products and Commercial Clothes Washers March 2009 Washington DC lthttpwww1eereenergygovbuildingsappliance_standardsresidentialcooking_prod ucts_final_rule_tsdhtmlgt
3 Association of Home Appliance Manufacturers AHAM 2005 Fact Book 2005 Washington DC
4 RS Means Mechanical Cost Data 31st Annual Edition 2008 Kingston MA
5 Consortium for Energy Efficiency Commercial Family-Sized Washers An Initiative Description of the Consortium for Energy Efficiency 1998 Boston MA lthttpwwwcee1orgcomcwshcwsh-mainphp3gt
6 US Department of Energy-Energy Information Administration Form EIA-861 for 2007 2007 Washington DC lthttpwwweiadoegovcneafelectricitypageeia861htmlgt
7 US Census Bureau Population estimates Population Population change and estimated components of population change April 1 2000 to July 1 2005 2006 Washington DC lthttpwwwcensusgovpopestdatasetshtmlgt
8 US Department of Energy-Energy Information Administration Natural Gas Monthly 2007 Washington DC lthttpwwweiadoegovoil_gasnatural_gasdata_publicationsnatural_gas_monthlyngmhtmgt
9 Raftelis Financial Consultants Inc 2006 RFCAWWA Water and Wastewater Rate Survey 2006 Charlotte NC Kansas City MO and Pasadena CA lthttpwwwrafteliscomratessurveyhtmlgt
10 US Department of Energy-Energy Information Administration An Updated Annual Energy Outlook 2009 Reference Case Reflecting Provisions of the American Recovery and Reinvestment Act and Recent Changes in the Economic Outlook April 2009 Washington DC SROIAF2009-03 lthttpwwweiadoegovoiafservicerptstimuluspdfsroiaf(2009)03pdfgt
8-48
EERE-2006-STD-0127 COMMENT 691
11 US Department of Energy-Energy Information Administration Annual Energy Outlook 2009 with Projections to 2030 March 2009 Washington DC DOEEIA-0383(2009) lthttpwwweiadoegovoiafaeopdf0383(2009)pdfgt
12 US Department of Labor-Bureau of Labor Statistics Consumer Price Indexes Item Water and sewerage maintenance Series Id CUUR0000SEHG01 US city average (not seasonally adjusted) 2008 Washington DC lthttpwwwblsgovcpihomehtmdatagt
13 Whirlpool Corporation Comment of Whirlpool Corporation Regarding the ANOPR for Cooking Products and Commercial Clothes Washers Docket Number EE-206-STD-2007 RIN 1904-AB49
14 US Department of Energy Technical Support Document Energy Efficiency Standards for Consumer Products Residential Central Air Conditioners and Heat Pumps May 2002 Washington DC Chapter 5 lthttpwwweereenergygovbuildingsappliance_standardsresidentialac_central_1000_rhtmlgt
15 Coin Laundry Association Industry Overview Downers Grove IL lthttpwwwcoinlaundryorgresourcesindustryoverviewcfmgt
16 Southern California Edison 2004-2005 Database for Energy Efficiency Resources (DEER) Update Study Final Report December 2005 Prepared for Southern California Edison by Itron Inc Vancouver WA lthttpwwwcalmacorgpublications2004-05_DEER_Update_Final_Report-Wopdfgt
17 Sullivan GP J W Currie TC Hillman and GB Parker High-Performance Clothes Washer Demonstration at Leisure World Laguna Woods Final Report December 2000 Prepared for Southern California Edison Company by Battelle Pacific Northwest Laboratory Richland WA lthttpeerepnlgovbuilding-technologiesdocscefinal202-22-01pdfgt
18 California Measurement Advisory Committee CALMAC Protocols Appendix F Effective Useful Live Values for Major Energy Efficiency Measures September 2000 lthttpwwwcalmacorgeventsAPX_Fpdfgt
19 Ibbotsons Associates Cost of Capital 2001 Yearbook Data Through March 2001 2001 Chicago IL
20 Damodaran Online The Data Page Cost of Capital by Industry Sector 2006 lthttppagessternnyuedu~adamodargt
21 Ibbotsons Associates Statistics for SIC code 72 2006 lthttpwwwibbotsoncomgt
8-49
EERE-2006-STD-0127 COMMENT 691
22 Ibbotsons Associates SBBI Valuation Edition 2001 Yearbook 2001 Chicago IL pp 38 44
23 US Government Printing Office Economic Report of the President 2006 2006 Washington DC lthttpwwwgpoaccessgoveopindexhtmlgt
24 Association of Home Appliance Manufacturers AHAM Data on Commercial Clothes Washers for DOE Efficiency Standards Rulemaking October 12 2006 Letter to Building Technologies Program US Department of Energy
25 California Energy Commission Appliances Databases ndash Clothes Washers 2009 Sacramento CA lthttpwwwenergycagovappliancesdatabaseexcel_based_filesClothes_Washersgt (Last Accessed February 5 2009)
26 US Office of the Federal Register Code of Federal Regulations Title 10 Part 431 -Energy Conservation Program for Certain Commercial and Industrial Equipment Subpart ImdashCommercial Clothes Washers January 1 2007 Washington DC
8-50
EERE-2006-STD-0127 COMMENT 691
CHAPTER 8 LIFE-CYCLE COST AND PAYBACK PERIOD ANALYSIS
81 INTRODUCTION
811 General Approach for LCC and PBP Analysis
812 Overview of LCC and PBP Inputs
82 LIFE-CYCLE COST INPUTS
821 Total Installed Cost Inputs
8212 Baseline Manufacturer Cost
8213 Standard-Level Manufacturer Cost Increases
8214 Overall Markup
8215 Installation Cost
8216 Total Installed Cost
822 Operating Cost Inputs
8221 Annual Energy and Water Consumption
8222 Energy and Water Prices
8223 Energy and Water Price Trends
8224 Repair and Maintenance Costs
823 Product Lifetime
824 Discount Rates
825 Effective Date of Standard
826 Equipment Assignment for the Base Case
83 PAYBACK PERIOD INPUTS
84 LIFE-CYCLE COST AND PAYBACK PERIOD RESULTS
841 Base Case LCC Distributions
842 Standard-Level Distributions of LCC Impacts
843 Standard-Level PBP Distributions
844 LCC and PBP Results
85 REBUTTABLE PAYBACK PERIOD
851 Metric
852 Inputs
853 Results
85 REBUTTABLE PAYBACK PERIOD
DOE presents rebuttable PBPs to provide the legally established rebuttable presumption that an energy efficiency standard is economically justified if the additional product costs attributed to the standard are less than three times the value of the first-year energy cost savings (42 USC sect6295 (o)(2)(B)(iii))
851 Metric
The basic equation for rebuttable PBP is the same as that shown in section 83 Payback Period Inputs Unlike the analyses described in sections 82 and 83 however the rebuttable PBP is not based on the use of household samples and probability distributions Rather than distributions the rebuttable PBP is based on discrete single-point values For example while DOE uses a probability distribution of regional energy prices in the distributional payback period analysis it uses only the national average energy price from the probability distribution to determine the rebuttable PBP
Other than the use of single-point values the most notable difference between the distribution PBP and the rebuttable PBP is the latterrsquos reliance on the DOE test procedure to determine a productrsquos annual energy and water consumption The following identifies the differences between the annual energy and water consumptions determined for the distribution PBP and the rebuttable PBP
DOE based the annual energy and water consumption values that it used to determine the rebuttable PBP on the number of cycles per year specified in the DOE test procedure 26 The commercial clothes washer test procedure cites the residential clothes washer test procedure to establish efficiency ratings as well as annual energy and water consumption As a result the annual number of use cycles 392 cycles per year for determining the annual energy and water consumption of commercial clothes washers is representative of residential use not commercial use Because residential use is significantly lower than the average usage for commercial applicationsmdash1241 cycles per year in multi-family buildings and 2190 cycles per year in laundromatsmdashthe average annual energy and water consumption used to determine rebuttable PBP will be significantly less than the consumption associated with actual usage As a result the rebuttable PBP will be significantly longer than the distribution PBPs for both multi-family and laundromat applications
852 Inputs
Inputs for the rebuttable PBP differ from the distribution PBP in that the calculation uses discrete values rather than distributions for inputs Note that for the calculation of distribution PBP because inputs for the determination of total installed cost were based on single-point values only the variability andor uncertainty in the inputs for determining operating cost contributed to variability in the distribution PBPs The following summarizes the single-point values that DOE used in the determination of the rebuttable PBP
8-45
EERE-2006-STD-0127 COMMENT 691
bull Manufacturing costs markups sales taxes and installation costs were all based on the single-point values used in the distributional LCC and PBP analysis
bull As described in section 851 annual energy and water consumption is based on the DOE test procedure
bull Energy and water prices are based on national average values for the year that new standards are assumed to take effect
bull An average discount rate or lifetime is not required in the rebuttable PBP calculation
bull The effective date of the standard is assumed to be 2013
853 Results
DOE calculated rebuttable PBPs for each CSL relative to the distribution of product efficiencies assumed for the base case (refer back to section 826 for more details on the base case efficiency distributions for each product) In other words DOE did not determine the rebuttable PBP relative to the baseline efficiency level but relative to the current distribution of product efficiencies DOE determined for the base case (ie the case without new standards) The following sections present the results for the sets of products being analyzed for this standards rulemaking
Tables 851 and 852 present the rebuttable PBPs for top-loading commercial clothes washers under both product applications multi-family buildings and laundromats Tables 853 and 854 present the rebuttable PBPs for front-loading commercial clothes washers under both product applications multi-family buildings and laundromats
1 US Department of Energy-Office of Energy Efficiency and Renewable Energy Energy Conservation Standards for Certain Consumer Products (Dishwashers Dehumidifiers Microwave Ovens and Electric and Gas Kitchen Ranges and Ovens) and for Certain Commercial and Industrial Equipment (Commercial Clothes Washers) Final Rule Federal Register 2009 74(66) pp 16040-16096
2 US Department of Energy-Office of Energy Efficiency and Renewable Energy Technical Support Document Energy Efficiency Program for Consumer Products and Commercial and Industrial Equipment Residential Dishwashers Dehumidifiers Cooking Products and Commercial Clothes Washers March 2009 Washington DC lthttpwww1eereenergygovbuildingsappliance_standardsresidentialcooking_prod ucts_final_rule_tsdhtmlgt
3 Association of Home Appliance Manufacturers AHAM 2005 Fact Book 2005 Washington DC
4 RS Means Mechanical Cost Data 31st Annual Edition 2008 Kingston MA
5 Consortium for Energy Efficiency Commercial Family-Sized Washers An Initiative Description of the Consortium for Energy Efficiency 1998 Boston MA lthttpwwwcee1orgcomcwshcwsh-mainphp3gt
6 US Department of Energy-Energy Information Administration Form EIA-861 for 2007 2007 Washington DC lthttpwwweiadoegovcneafelectricitypageeia861htmlgt
7 US Census Bureau Population estimates Population Population change and estimated components of population change April 1 2000 to July 1 2005 2006 Washington DC lthttpwwwcensusgovpopestdatasetshtmlgt
8 US Department of Energy-Energy Information Administration Natural Gas Monthly 2007 Washington DC lthttpwwweiadoegovoil_gasnatural_gasdata_publicationsnatural_gas_monthlyngmhtmgt
9 Raftelis Financial Consultants Inc 2006 RFCAWWA Water and Wastewater Rate Survey 2006 Charlotte NC Kansas City MO and Pasadena CA lthttpwwwrafteliscomratessurveyhtmlgt
10 US Department of Energy-Energy Information Administration An Updated Annual Energy Outlook 2009 Reference Case Reflecting Provisions of the American Recovery and Reinvestment Act and Recent Changes in the Economic Outlook April 2009 Washington DC SROIAF2009-03 lthttpwwweiadoegovoiafservicerptstimuluspdfsroiaf(2009)03pdfgt
8-48
EERE-2006-STD-0127 COMMENT 691
11 US Department of Energy-Energy Information Administration Annual Energy Outlook 2009 with Projections to 2030 March 2009 Washington DC DOEEIA-0383(2009) lthttpwwweiadoegovoiafaeopdf0383(2009)pdfgt
12 US Department of Labor-Bureau of Labor Statistics Consumer Price Indexes Item Water and sewerage maintenance Series Id CUUR0000SEHG01 US city average (not seasonally adjusted) 2008 Washington DC lthttpwwwblsgovcpihomehtmdatagt
13 Whirlpool Corporation Comment of Whirlpool Corporation Regarding the ANOPR for Cooking Products and Commercial Clothes Washers Docket Number EE-206-STD-2007 RIN 1904-AB49
14 US Department of Energy Technical Support Document Energy Efficiency Standards for Consumer Products Residential Central Air Conditioners and Heat Pumps May 2002 Washington DC Chapter 5 lthttpwwweereenergygovbuildingsappliance_standardsresidentialac_central_1000_rhtmlgt
15 Coin Laundry Association Industry Overview Downers Grove IL lthttpwwwcoinlaundryorgresourcesindustryoverviewcfmgt
16 Southern California Edison 2004-2005 Database for Energy Efficiency Resources (DEER) Update Study Final Report December 2005 Prepared for Southern California Edison by Itron Inc Vancouver WA lthttpwwwcalmacorgpublications2004-05_DEER_Update_Final_Report-Wopdfgt
17 Sullivan GP J W Currie TC Hillman and GB Parker High-Performance Clothes Washer Demonstration at Leisure World Laguna Woods Final Report December 2000 Prepared for Southern California Edison Company by Battelle Pacific Northwest Laboratory Richland WA lthttpeerepnlgovbuilding-technologiesdocscefinal202-22-01pdfgt
18 California Measurement Advisory Committee CALMAC Protocols Appendix F Effective Useful Live Values for Major Energy Efficiency Measures September 2000 lthttpwwwcalmacorgeventsAPX_Fpdfgt
19 Ibbotsons Associates Cost of Capital 2001 Yearbook Data Through March 2001 2001 Chicago IL
20 Damodaran Online The Data Page Cost of Capital by Industry Sector 2006 lthttppagessternnyuedu~adamodargt
21 Ibbotsons Associates Statistics for SIC code 72 2006 lthttpwwwibbotsoncomgt
8-49
EERE-2006-STD-0127 COMMENT 691
22 Ibbotsons Associates SBBI Valuation Edition 2001 Yearbook 2001 Chicago IL pp 38 44
23 US Government Printing Office Economic Report of the President 2006 2006 Washington DC lthttpwwwgpoaccessgoveopindexhtmlgt
24 Association of Home Appliance Manufacturers AHAM Data on Commercial Clothes Washers for DOE Efficiency Standards Rulemaking October 12 2006 Letter to Building Technologies Program US Department of Energy
25 California Energy Commission Appliances Databases ndash Clothes Washers 2009 Sacramento CA lthttpwwwenergycagovappliancesdatabaseexcel_based_filesClothes_Washersgt (Last Accessed February 5 2009)
26 US Office of the Federal Register Code of Federal Regulations Title 10 Part 431 -Energy Conservation Program for Certain Commercial and Industrial Equipment Subpart ImdashCommercial Clothes Washers January 1 2007 Washington DC
8-50
EERE-2006-STD-0127 COMMENT 691
CHAPTER 8 LIFE-CYCLE COST AND PAYBACK PERIOD ANALYSIS
81 INTRODUCTION
811 General Approach for LCC and PBP Analysis
812 Overview of LCC and PBP Inputs
82 LIFE-CYCLE COST INPUTS
821 Total Installed Cost Inputs
8212 Baseline Manufacturer Cost
8213 Standard-Level Manufacturer Cost Increases
8214 Overall Markup
8215 Installation Cost
8216 Total Installed Cost
822 Operating Cost Inputs
8221 Annual Energy and Water Consumption
8222 Energy and Water Prices
8223 Energy and Water Price Trends
8224 Repair and Maintenance Costs
823 Product Lifetime
824 Discount Rates
825 Effective Date of Standard
826 Equipment Assignment for the Base Case
83 PAYBACK PERIOD INPUTS
84 LIFE-CYCLE COST AND PAYBACK PERIOD RESULTS
841 Base Case LCC Distributions
842 Standard-Level Distributions of LCC Impacts
843 Standard-Level PBP Distributions
844 LCC and PBP Results
85 REBUTTABLE PAYBACK PERIOD
851 Metric
852 Inputs
853 Results
bull Manufacturing costs markups sales taxes and installation costs were all based on the single-point values used in the distributional LCC and PBP analysis
bull As described in section 851 annual energy and water consumption is based on the DOE test procedure
bull Energy and water prices are based on national average values for the year that new standards are assumed to take effect
bull An average discount rate or lifetime is not required in the rebuttable PBP calculation
bull The effective date of the standard is assumed to be 2013
853 Results
DOE calculated rebuttable PBPs for each CSL relative to the distribution of product efficiencies assumed for the base case (refer back to section 826 for more details on the base case efficiency distributions for each product) In other words DOE did not determine the rebuttable PBP relative to the baseline efficiency level but relative to the current distribution of product efficiencies DOE determined for the base case (ie the case without new standards) The following sections present the results for the sets of products being analyzed for this standards rulemaking
Tables 851 and 852 present the rebuttable PBPs for top-loading commercial clothes washers under both product applications multi-family buildings and laundromats Tables 853 and 854 present the rebuttable PBPs for front-loading commercial clothes washers under both product applications multi-family buildings and laundromats
1 US Department of Energy-Office of Energy Efficiency and Renewable Energy Energy Conservation Standards for Certain Consumer Products (Dishwashers Dehumidifiers Microwave Ovens and Electric and Gas Kitchen Ranges and Ovens) and for Certain Commercial and Industrial Equipment (Commercial Clothes Washers) Final Rule Federal Register 2009 74(66) pp 16040-16096
2 US Department of Energy-Office of Energy Efficiency and Renewable Energy Technical Support Document Energy Efficiency Program for Consumer Products and Commercial and Industrial Equipment Residential Dishwashers Dehumidifiers Cooking Products and Commercial Clothes Washers March 2009 Washington DC lthttpwww1eereenergygovbuildingsappliance_standardsresidentialcooking_prod ucts_final_rule_tsdhtmlgt
3 Association of Home Appliance Manufacturers AHAM 2005 Fact Book 2005 Washington DC
4 RS Means Mechanical Cost Data 31st Annual Edition 2008 Kingston MA
5 Consortium for Energy Efficiency Commercial Family-Sized Washers An Initiative Description of the Consortium for Energy Efficiency 1998 Boston MA lthttpwwwcee1orgcomcwshcwsh-mainphp3gt
6 US Department of Energy-Energy Information Administration Form EIA-861 for 2007 2007 Washington DC lthttpwwweiadoegovcneafelectricitypageeia861htmlgt
7 US Census Bureau Population estimates Population Population change and estimated components of population change April 1 2000 to July 1 2005 2006 Washington DC lthttpwwwcensusgovpopestdatasetshtmlgt
8 US Department of Energy-Energy Information Administration Natural Gas Monthly 2007 Washington DC lthttpwwweiadoegovoil_gasnatural_gasdata_publicationsnatural_gas_monthlyngmhtmgt
9 Raftelis Financial Consultants Inc 2006 RFCAWWA Water and Wastewater Rate Survey 2006 Charlotte NC Kansas City MO and Pasadena CA lthttpwwwrafteliscomratessurveyhtmlgt
10 US Department of Energy-Energy Information Administration An Updated Annual Energy Outlook 2009 Reference Case Reflecting Provisions of the American Recovery and Reinvestment Act and Recent Changes in the Economic Outlook April 2009 Washington DC SROIAF2009-03 lthttpwwweiadoegovoiafservicerptstimuluspdfsroiaf(2009)03pdfgt
8-48
EERE-2006-STD-0127 COMMENT 691
11 US Department of Energy-Energy Information Administration Annual Energy Outlook 2009 with Projections to 2030 March 2009 Washington DC DOEEIA-0383(2009) lthttpwwweiadoegovoiafaeopdf0383(2009)pdfgt
12 US Department of Labor-Bureau of Labor Statistics Consumer Price Indexes Item Water and sewerage maintenance Series Id CUUR0000SEHG01 US city average (not seasonally adjusted) 2008 Washington DC lthttpwwwblsgovcpihomehtmdatagt
13 Whirlpool Corporation Comment of Whirlpool Corporation Regarding the ANOPR for Cooking Products and Commercial Clothes Washers Docket Number EE-206-STD-2007 RIN 1904-AB49
14 US Department of Energy Technical Support Document Energy Efficiency Standards for Consumer Products Residential Central Air Conditioners and Heat Pumps May 2002 Washington DC Chapter 5 lthttpwwweereenergygovbuildingsappliance_standardsresidentialac_central_1000_rhtmlgt
15 Coin Laundry Association Industry Overview Downers Grove IL lthttpwwwcoinlaundryorgresourcesindustryoverviewcfmgt
16 Southern California Edison 2004-2005 Database for Energy Efficiency Resources (DEER) Update Study Final Report December 2005 Prepared for Southern California Edison by Itron Inc Vancouver WA lthttpwwwcalmacorgpublications2004-05_DEER_Update_Final_Report-Wopdfgt
17 Sullivan GP J W Currie TC Hillman and GB Parker High-Performance Clothes Washer Demonstration at Leisure World Laguna Woods Final Report December 2000 Prepared for Southern California Edison Company by Battelle Pacific Northwest Laboratory Richland WA lthttpeerepnlgovbuilding-technologiesdocscefinal202-22-01pdfgt
18 California Measurement Advisory Committee CALMAC Protocols Appendix F Effective Useful Live Values for Major Energy Efficiency Measures September 2000 lthttpwwwcalmacorgeventsAPX_Fpdfgt
19 Ibbotsons Associates Cost of Capital 2001 Yearbook Data Through March 2001 2001 Chicago IL
20 Damodaran Online The Data Page Cost of Capital by Industry Sector 2006 lthttppagessternnyuedu~adamodargt
21 Ibbotsons Associates Statistics for SIC code 72 2006 lthttpwwwibbotsoncomgt
8-49
EERE-2006-STD-0127 COMMENT 691
22 Ibbotsons Associates SBBI Valuation Edition 2001 Yearbook 2001 Chicago IL pp 38 44
23 US Government Printing Office Economic Report of the President 2006 2006 Washington DC lthttpwwwgpoaccessgoveopindexhtmlgt
24 Association of Home Appliance Manufacturers AHAM Data on Commercial Clothes Washers for DOE Efficiency Standards Rulemaking October 12 2006 Letter to Building Technologies Program US Department of Energy
25 California Energy Commission Appliances Databases ndash Clothes Washers 2009 Sacramento CA lthttpwwwenergycagovappliancesdatabaseexcel_based_filesClothes_Washersgt (Last Accessed February 5 2009)
26 US Office of the Federal Register Code of Federal Regulations Title 10 Part 431 -Energy Conservation Program for Certain Commercial and Industrial Equipment Subpart ImdashCommercial Clothes Washers January 1 2007 Washington DC
8-50
EERE-2006-STD-0127 COMMENT 691
CHAPTER 8 LIFE-CYCLE COST AND PAYBACK PERIOD ANALYSIS
81 INTRODUCTION
811 General Approach for LCC and PBP Analysis
812 Overview of LCC and PBP Inputs
82 LIFE-CYCLE COST INPUTS
821 Total Installed Cost Inputs
8212 Baseline Manufacturer Cost
8213 Standard-Level Manufacturer Cost Increases
8214 Overall Markup
8215 Installation Cost
8216 Total Installed Cost
822 Operating Cost Inputs
8221 Annual Energy and Water Consumption
8222 Energy and Water Prices
8223 Energy and Water Price Trends
8224 Repair and Maintenance Costs
823 Product Lifetime
824 Discount Rates
825 Effective Date of Standard
826 Equipment Assignment for the Base Case
83 PAYBACK PERIOD INPUTS
84 LIFE-CYCLE COST AND PAYBACK PERIOD RESULTS
841 Base Case LCC Distributions
842 Standard-Level Distributions of LCC Impacts
843 Standard-Level PBP Distributions
844 LCC and PBP Results
85 REBUTTABLE PAYBACK PERIOD
851 Metric
852 Inputs
853 Results
REFERENCES
1 US Department of Energy-Office of Energy Efficiency and Renewable Energy Energy Conservation Standards for Certain Consumer Products (Dishwashers Dehumidifiers Microwave Ovens and Electric and Gas Kitchen Ranges and Ovens) and for Certain Commercial and Industrial Equipment (Commercial Clothes Washers) Final Rule Federal Register 2009 74(66) pp 16040-16096
2 US Department of Energy-Office of Energy Efficiency and Renewable Energy Technical Support Document Energy Efficiency Program for Consumer Products and Commercial and Industrial Equipment Residential Dishwashers Dehumidifiers Cooking Products and Commercial Clothes Washers March 2009 Washington DC lthttpwww1eereenergygovbuildingsappliance_standardsresidentialcooking_prod ucts_final_rule_tsdhtmlgt
3 Association of Home Appliance Manufacturers AHAM 2005 Fact Book 2005 Washington DC
4 RS Means Mechanical Cost Data 31st Annual Edition 2008 Kingston MA
5 Consortium for Energy Efficiency Commercial Family-Sized Washers An Initiative Description of the Consortium for Energy Efficiency 1998 Boston MA lthttpwwwcee1orgcomcwshcwsh-mainphp3gt
6 US Department of Energy-Energy Information Administration Form EIA-861 for 2007 2007 Washington DC lthttpwwweiadoegovcneafelectricitypageeia861htmlgt
7 US Census Bureau Population estimates Population Population change and estimated components of population change April 1 2000 to July 1 2005 2006 Washington DC lthttpwwwcensusgovpopestdatasetshtmlgt
8 US Department of Energy-Energy Information Administration Natural Gas Monthly 2007 Washington DC lthttpwwweiadoegovoil_gasnatural_gasdata_publicationsnatural_gas_monthlyngmhtmgt
9 Raftelis Financial Consultants Inc 2006 RFCAWWA Water and Wastewater Rate Survey 2006 Charlotte NC Kansas City MO and Pasadena CA lthttpwwwrafteliscomratessurveyhtmlgt
10 US Department of Energy-Energy Information Administration An Updated Annual Energy Outlook 2009 Reference Case Reflecting Provisions of the American Recovery and Reinvestment Act and Recent Changes in the Economic Outlook April 2009 Washington DC SROIAF2009-03 lthttpwwweiadoegovoiafservicerptstimuluspdfsroiaf(2009)03pdfgt
8-48
EERE-2006-STD-0127 COMMENT 691
11 US Department of Energy-Energy Information Administration Annual Energy Outlook 2009 with Projections to 2030 March 2009 Washington DC DOEEIA-0383(2009) lthttpwwweiadoegovoiafaeopdf0383(2009)pdfgt
12 US Department of Labor-Bureau of Labor Statistics Consumer Price Indexes Item Water and sewerage maintenance Series Id CUUR0000SEHG01 US city average (not seasonally adjusted) 2008 Washington DC lthttpwwwblsgovcpihomehtmdatagt
13 Whirlpool Corporation Comment of Whirlpool Corporation Regarding the ANOPR for Cooking Products and Commercial Clothes Washers Docket Number EE-206-STD-2007 RIN 1904-AB49
14 US Department of Energy Technical Support Document Energy Efficiency Standards for Consumer Products Residential Central Air Conditioners and Heat Pumps May 2002 Washington DC Chapter 5 lthttpwwweereenergygovbuildingsappliance_standardsresidentialac_central_1000_rhtmlgt
15 Coin Laundry Association Industry Overview Downers Grove IL lthttpwwwcoinlaundryorgresourcesindustryoverviewcfmgt
16 Southern California Edison 2004-2005 Database for Energy Efficiency Resources (DEER) Update Study Final Report December 2005 Prepared for Southern California Edison by Itron Inc Vancouver WA lthttpwwwcalmacorgpublications2004-05_DEER_Update_Final_Report-Wopdfgt
17 Sullivan GP J W Currie TC Hillman and GB Parker High-Performance Clothes Washer Demonstration at Leisure World Laguna Woods Final Report December 2000 Prepared for Southern California Edison Company by Battelle Pacific Northwest Laboratory Richland WA lthttpeerepnlgovbuilding-technologiesdocscefinal202-22-01pdfgt
18 California Measurement Advisory Committee CALMAC Protocols Appendix F Effective Useful Live Values for Major Energy Efficiency Measures September 2000 lthttpwwwcalmacorgeventsAPX_Fpdfgt
19 Ibbotsons Associates Cost of Capital 2001 Yearbook Data Through March 2001 2001 Chicago IL
20 Damodaran Online The Data Page Cost of Capital by Industry Sector 2006 lthttppagessternnyuedu~adamodargt
21 Ibbotsons Associates Statistics for SIC code 72 2006 lthttpwwwibbotsoncomgt
8-49
EERE-2006-STD-0127 COMMENT 691
22 Ibbotsons Associates SBBI Valuation Edition 2001 Yearbook 2001 Chicago IL pp 38 44
23 US Government Printing Office Economic Report of the President 2006 2006 Washington DC lthttpwwwgpoaccessgoveopindexhtmlgt
24 Association of Home Appliance Manufacturers AHAM Data on Commercial Clothes Washers for DOE Efficiency Standards Rulemaking October 12 2006 Letter to Building Technologies Program US Department of Energy
25 California Energy Commission Appliances Databases ndash Clothes Washers 2009 Sacramento CA lthttpwwwenergycagovappliancesdatabaseexcel_based_filesClothes_Washersgt (Last Accessed February 5 2009)
26 US Office of the Federal Register Code of Federal Regulations Title 10 Part 431 -Energy Conservation Program for Certain Commercial and Industrial Equipment Subpart ImdashCommercial Clothes Washers January 1 2007 Washington DC
8-50
EERE-2006-STD-0127 COMMENT 691
CHAPTER 8 LIFE-CYCLE COST AND PAYBACK PERIOD ANALYSIS
81 INTRODUCTION
811 General Approach for LCC and PBP Analysis
812 Overview of LCC and PBP Inputs
82 LIFE-CYCLE COST INPUTS
821 Total Installed Cost Inputs
8212 Baseline Manufacturer Cost
8213 Standard-Level Manufacturer Cost Increases
8214 Overall Markup
8215 Installation Cost
8216 Total Installed Cost
822 Operating Cost Inputs
8221 Annual Energy and Water Consumption
8222 Energy and Water Prices
8223 Energy and Water Price Trends
8224 Repair and Maintenance Costs
823 Product Lifetime
824 Discount Rates
825 Effective Date of Standard
826 Equipment Assignment for the Base Case
83 PAYBACK PERIOD INPUTS
84 LIFE-CYCLE COST AND PAYBACK PERIOD RESULTS
841 Base Case LCC Distributions
842 Standard-Level Distributions of LCC Impacts
843 Standard-Level PBP Distributions
844 LCC and PBP Results
85 REBUTTABLE PAYBACK PERIOD
851 Metric
852 Inputs
853 Results
22 Ibbotsons Associates SBBI Valuation Edition 2001 Yearbook 2001 Chicago IL pp 38 44
23 US Government Printing Office Economic Report of the President 2006 2006 Washington DC lthttpwwwgpoaccessgoveopindexhtmlgt
24 Association of Home Appliance Manufacturers AHAM Data on Commercial Clothes Washers for DOE Efficiency Standards Rulemaking October 12 2006 Letter to Building Technologies Program US Department of Energy
25 California Energy Commission Appliances Databases ndash Clothes Washers 2009 Sacramento CA lthttpwwwenergycagovappliancesdatabaseexcel_based_filesClothes_Washersgt (Last Accessed February 5 2009)
26 US Office of the Federal Register Code of Federal Regulations Title 10 Part 431 -Energy Conservation Program for Certain Commercial and Industrial Equipment Subpart ImdashCommercial Clothes Washers January 1 2007 Washington DC
8-50
EERE-2006-STD-0127 COMMENT 691
CHAPTER 8 LIFE-CYCLE COST AND PAYBACK PERIOD ANALYSIS