Chapter 9 - 2 • When we combine two elements... what equilibrium state do we get? • In particular, if we specify... --a composition (e.g., wt% Cu - wt% Ni), and --a temperature (T ) then... How many phases do we get? What is the composition of each phase? How much of each phase do we get? Chapter 9: Phase Diagrams Phase B Phase A Nickel atom Copper atom
Transcript
Chapter 9 - 2
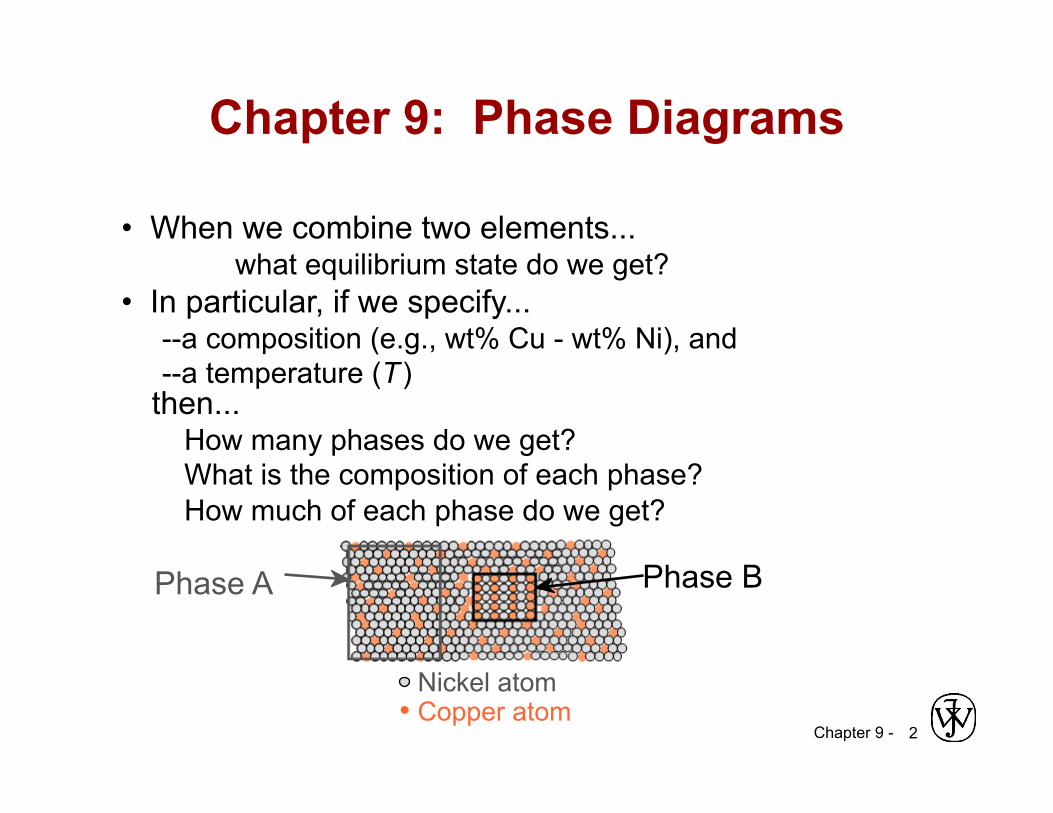
• When we combine two elements... what equilibrium state do we get? • In particular, if we specify... --a composition (e.g., wt% Cu - wt% Ni), and --a temperature (T )
then... How many phases do we get? What is the composition of each phase? How much of each phase do we get?
Chapter 9: Phase Diagrams
Phase B Phase A
Nickel atom Copper atom
Chapter 9 -
Definitions and basic concepts
• Component: pure metals and/or compounds of which an alloy is composed
• System: a specific body of material under consideration
• A phase: a homogeneous portion of a system that has uniform physical and chemical characteristics
• Equilibrium: a system is at equilibrium if its free energy is at a minimum under some specified combination of temperature, pressure, and composition.
• Phase equilibrium: minimum energy for a system with multiple phases
• Phase diagram: information about phases as function of T, composition, and pressure
Chapter 9 -
Solubility limit
• A maximum concentration of solute atoms may dissolve in the solvent
• Solubility increases with T
Chapter 9 - 5
Phase Equilibria: Solubility Limit
65
Sucrose/Water Phase Diagram
Pure
Su
gar
Tem
pera
ture
(°C
) 0 20 40 60 80 100
Co =Composition (wt% sugar)
L (liquid solution
i.e., syrup)
Solubility Limit L
(liquid) + S
(solid sugar) 20
4 0 6 0 8 0
10 0
Pure
W
ater
Question: What is the solubility limit at 20C? Answer: 65wt% sugar. If Co < 65wt% sugar: syrup If Co > 65wt% sugar: syrup + sugar.
• Solubility limit increases with T: e.g., if T = 100C, solubility limit = 80wt% sugar.
Chapter 9 - 6
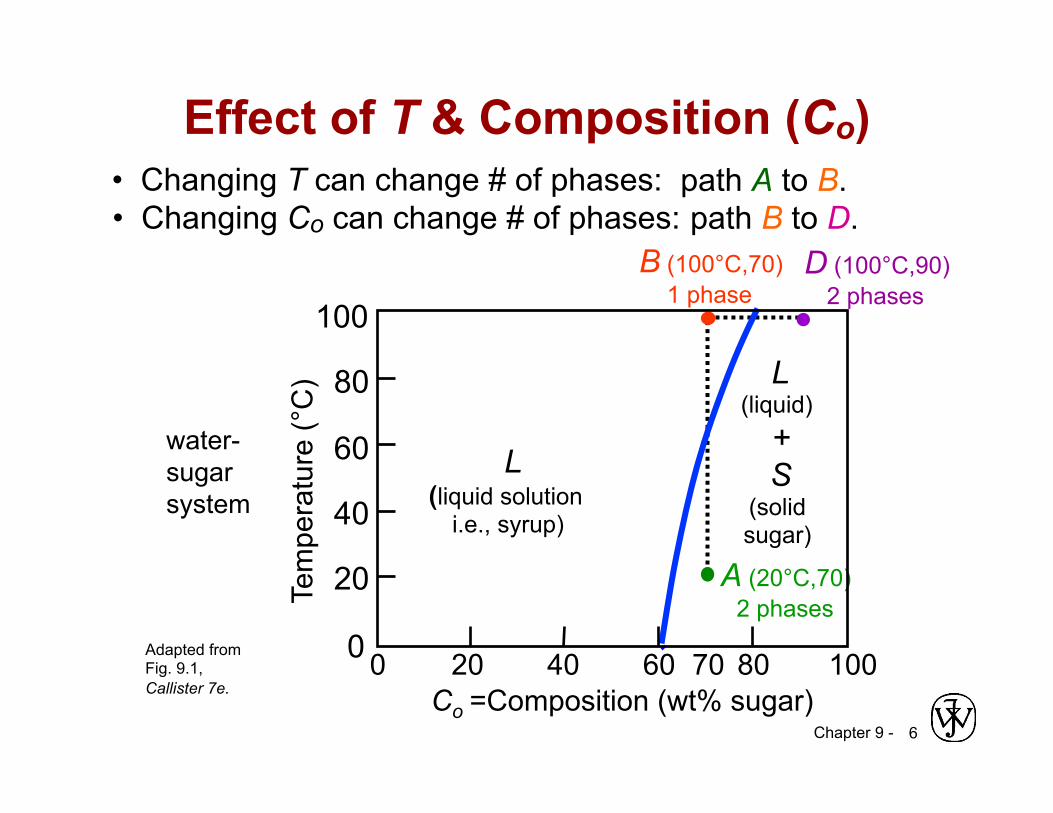
Effect of T & Composition (Co) • Changing T can change # of phases:
Adapted from Fig. 9.1, Callister 7e.
D (100°C,90) 2 phases
B (100°C,70) 1 phase
path A to B. • Changing Co can change # of phases: path B to D.
A (20°C,70) 2 phases
70 80 100 60 40 20 0
Tem
pera
ture
(°C
)
Co =Composition (wt% sugar)
L ( liquid solution
i.e., syrup)
20
100
40
60
80
0
L (liquid)
+ S
(solid sugar)
water- sugar system
Chapter 9 - 7
Binary Isomorphous system
Crystal Structure
electroneg r (nm)
Ni FCC 1.9 0.1246 Cu FCC 1.8 0.1278
• Both have the same crystal structure (FCC) and have similar electronegativities and atomic radii (W. Hume – Rothery rules) suggesting high mutual solubility.
Simple solution system (e.g., Ni-Cu solution)
• Ni and Cu are totally miscible in all proportions.
Chapter 9 - 8
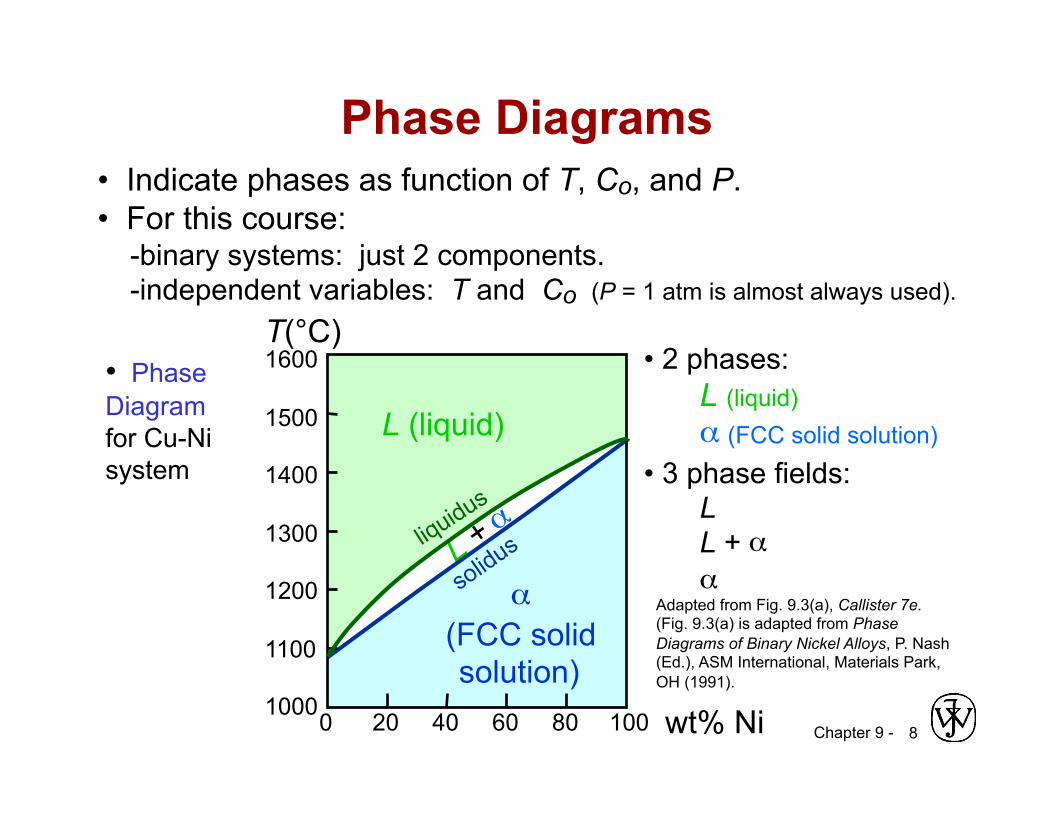
Phase Diagrams • Indicate phases as function of T, Co, and P. • For this course: -binary systems: just 2 components. -independent variables: T and Co (P = 1 atm is almost always used).
• Phase Diagram for Cu-Ni system
Adapted from Fig. 9.3(a), Callister 7e. (Fig. 9.3(a) is adapted from Phase Diagrams of Binary Nickel Alloys, P. Nash (Ed.), ASM International, Materials Park, OH (1991).
• 2 phases: L (liquid) α (FCC solid solution)
• 3 phase fields: L L + α α
wt% Ni 20 40 60 80 100 0 1000
1100
1200
1300
1400
1500
1600 T(°C)
L (liquid)
α (FCC solid solution)
Chapter 9 - 9
wt% Ni 20 40 60 80 100 0 1000
1100
1200
1300
1400
1500
1600 T(°C)
L (liquid)
α (FCC solid solution)
Cu-Ni phase
diagram
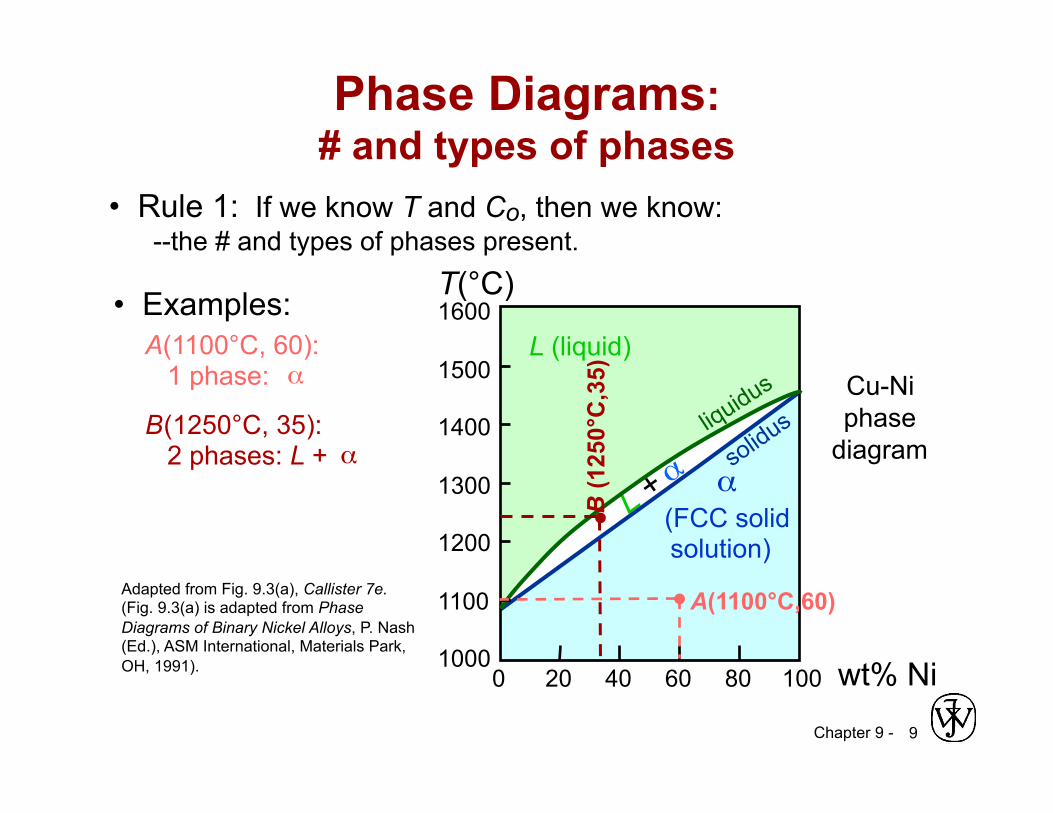
Phase Diagrams: # and types of phases
• Rule 1: If we know T and Co, then we know: --the # and types of phases present.
• Examples: A(1100°C, 60): 1 phase: α B (1250°C, 35): 2 phases: L + α
Adapted from Fig. 9.3(a), Callister 7e. (Fig. 9.3(a) is adapted from Phase Diagrams of Binary Nickel Alloys, P. Nash (Ed.), ASM International, Materials Park, OH, 1991).
B (1
250°
C,3
5)
A(1100°C,60)
Chapter 9 - 10
wt% Ni 20
1200
1300
T(°C)
L (liquid)
α (solid)
30 40 50
Cu-Ni system
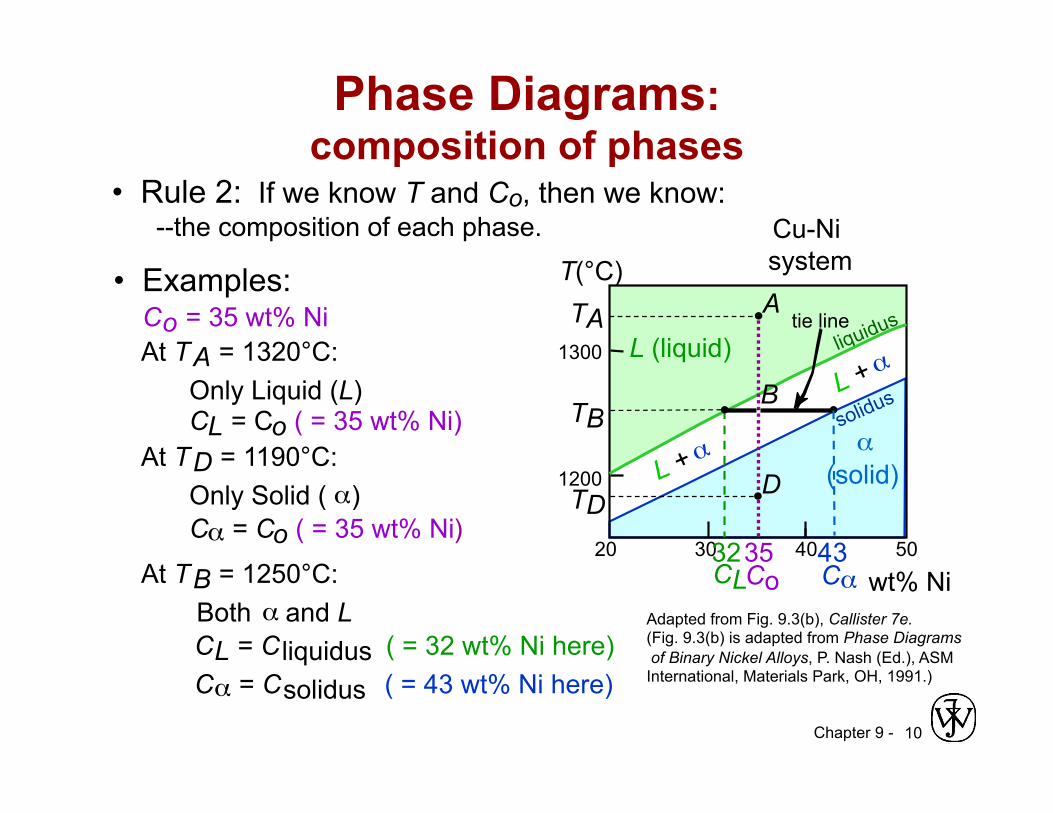
Phase Diagrams: composition of phases
• Rule 2: If we know T and Co, then we know: --the composition of each phase.
• Examples: T A A
35 C o
32 C L
At T A = 1320°C: Only Liquid (L) C L = C o ( = 35 wt% Ni)
At T B = 1250°C: Both α and L
C L = C liquidus ( = 32 wt% Ni here) C α = C solidus ( = 43 wt% Ni here)
At T D = 1190°C: Only Solid ( α ) C α = C o ( = 35 wt% Ni )
C o = 35 wt% Ni
Adapted from Fig. 9.3(b), Callister 7e. (Fig. 9.3(b) is adapted from Phase Diagrams of Binary Nickel Alloys, P. Nash (Ed.), ASM International, Materials Park, OH, 1991.)
B T B
D T D
tie line
4 C α 3
Chapter 9 - 11
• Tie line – connects the phases in equilibrium with each other - essentially an isotherm
The Lever Rule
How much of each phase? Think of it as a lever (teeter-totter)
ML Mα
R S
wt% Ni 20
1200
1300
T(°C)
L (liquid)
α (solid)
3 0 4 0 5 0
B T B
tie line
C o C L C α
S R
Adapted from Fig. 9.3(b), Callister 7e.
Chapter 9 - 12
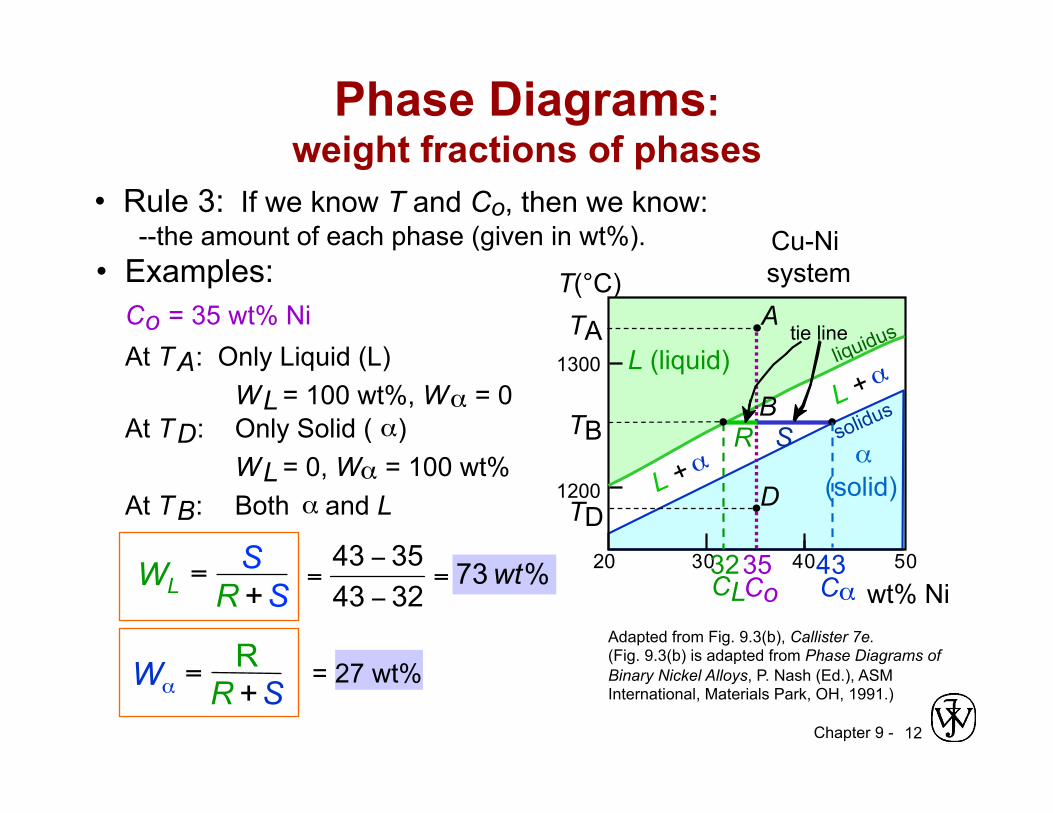
• Rule 3: If we know T and Co, then we know: --the amount of each phase (given in wt%). • Examples:
At T A : Only Liquid (L) W L = 100 wt%, W α = 0
At T D : Only Solid ( α ) W L = 0, W α = 100 wt%
C o = 35 wt% Ni
Adapted from Fig. 9.3(b), Callister 7e. (Fig. 9.3(b) is adapted from Phase Diagrams of Binary Nickel Alloys, P. Nash (Ed.), ASM International, Materials Park, OH, 1991.)
Phase Diagrams: weight fractions of phases
wt% Ni 20
1200
1300
T(°C)
L (liquid)
α (solid)
3 0 4 0 5 0
Cu-Ni system
T A A
35 C o
32 C L
B T B
D T D
tie line
4 C α 3
R S
At T B : Both α and L
= 27 wt%
WL = S
R + S
Wα = R
R + S
Chapter 9 - 13
wt% Ni 20
120 0
130 0
3 0 4 0 5 0 110 0
L (liquid)
α (solid)
T(°C)
A
35 C o
L: 35wt%Ni Cu-Ni
system
• Phase diagram: Cu-Ni system. • System is: --binary i.e., 2 components: Cu and Ni. --isomorphous i.e., complete solubility of one component in another; α phase field extends from 0 to 100 wt% Ni.
Adapted from Fig. 9.4, Callister 7e.
• Consider Co = 35 wt%Ni.
Ex: Cooling in a Cu-Ni Binary
46 35 43 32
α : 43 wt% Ni L: 32 wt% Ni
L: 24 wt% Ni α : 36 wt% Ni
B α: 46 wt% Ni L: 35 wt% Ni
C D
E
24 36
Chapter 9 - 14
• Cα changes as we solidify. • Cu-Ni case:
• Fast rate of cooling: Cored structure
• Slow rate of cooling: Equilibrium structure
First α to solidify has Cα = 46 wt% Ni. Last α to solidify has Cα = 35 wt% Ni.
Cored vs Equilibrium Phases
First α to solidify: 46 wt% Ni
Uniform C α : 35 wt% Ni
Last α to solidify: < 35 wt% Ni
Chapter 9 - 15
: Min. melting TE
2 components has a special composition with a min. melting T.
Adapted from Fig. 9.7, Callister 7e.
Binary-Eutectic Systems
• Eutectic transition L(CE) α(CαE) + β(CβE)
• 3 single phase regions (L, α, β ) • Limited solubility:
α : mostly Cu β : mostly Ag
• TE : No liquid below TE • CE composition
Ex.: Cu-Ag system Cu-Ag system
L (liquid)
α L + α L + β β
α + β
Co , wt% Ag 20 40 60 80 100 0 200
1200 T(°C)
400
600
800
1000
CE
TE 8.0 71.9 91.2 779°C
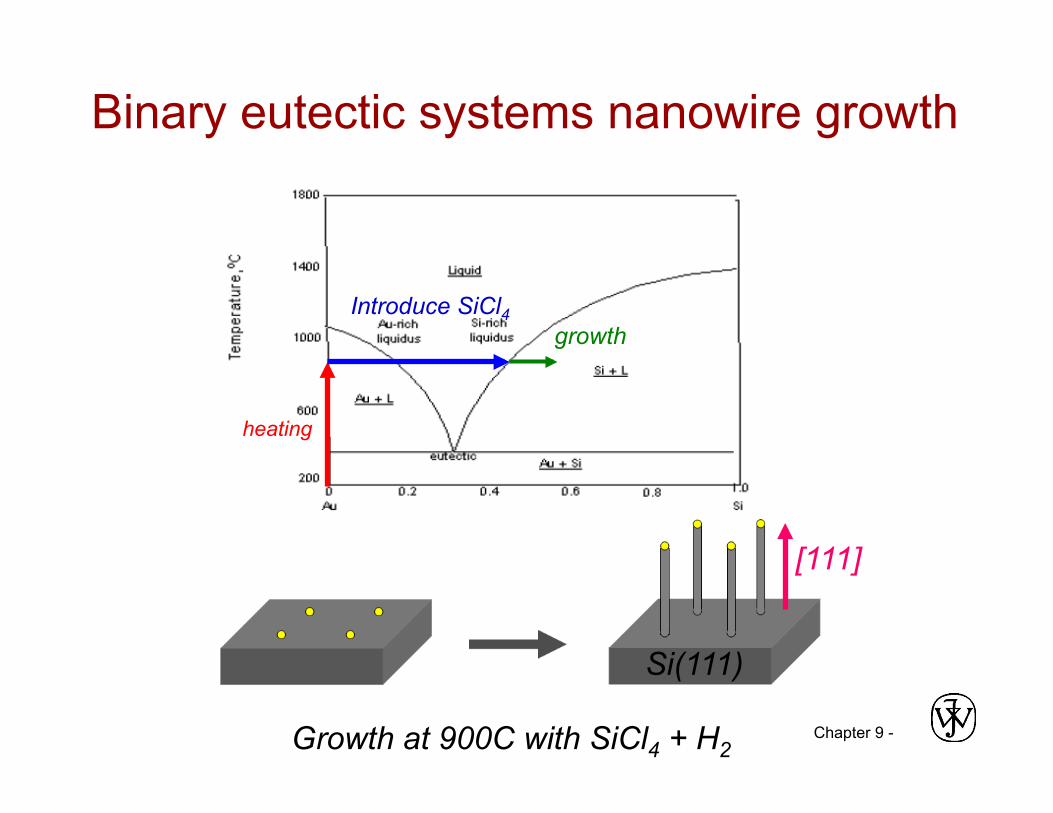
Chapter 9 - Growth at 900C with SiCl4 + H2
heating
Introduce SiCl4 growth
Si(111)
[111]
Binary eutectic systems nanowire growth
Chapter 9 -
Silicon nanowires
17
Chapter 9 -
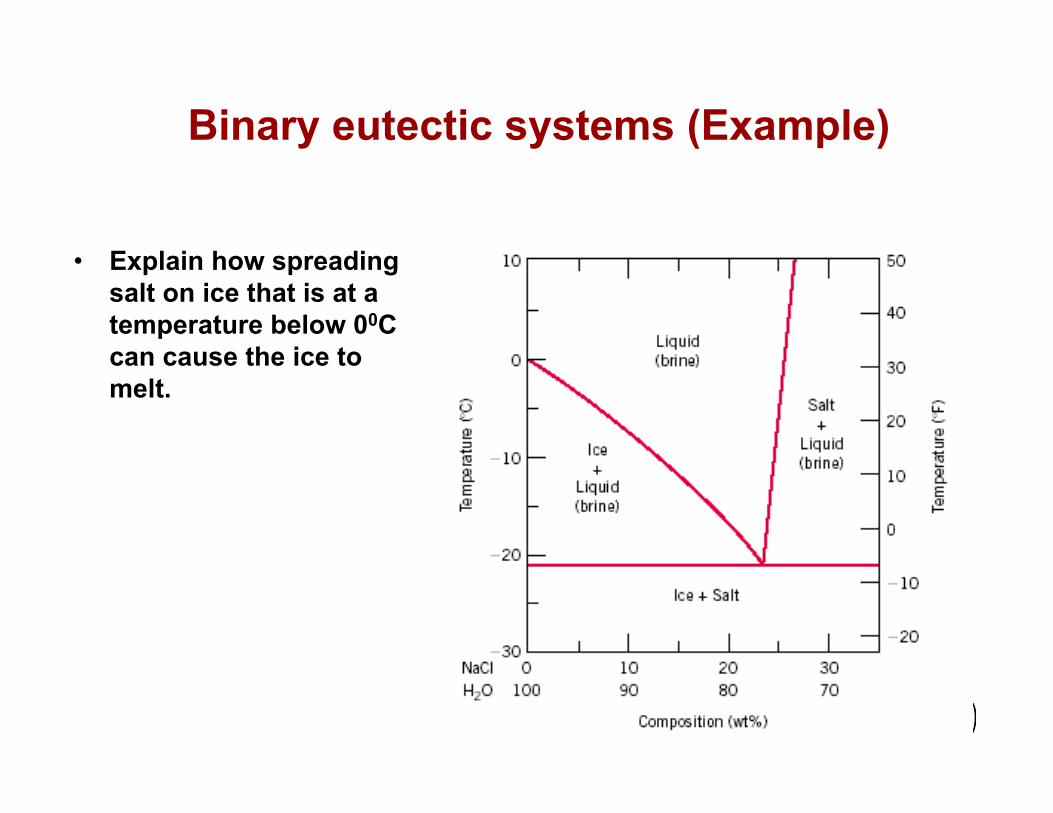
Binary eutectic systems (Example)
• Explain how spreading salt on ice that is at a temperature below 00C can cause the ice to melt.
Chapter 9 - 19
L + α L + β
α + β
200
T(°C)
18.3
C, wt% Sn 20 60 80 100 0
300
100
L (liquid)
α 183°C 61.9 97.8
β
• For a 40 wt% Sn-60 wt% Pb alloy at 150°C, find... --the phases present: Pb-Sn
system
EX: Pb-Sn Eutectic System (1)
α + β --compositions of phases:
CO = 40 wt% Sn
--the relative amount of each phase:
150
40 Co
11 Cα
99 Cβ
S R
Cα = 11 wt% Sn Cβ = 99 wt% Sn
W α = Cβ - CO Cβ - Cα
= 99 - 40 99 - 11
= 59 88
= 67 wt%
S R+S
=
W β = CO - Cα Cβ - Cα
= R R+S
= 29 88
= 33 wt% = 40 - 11 99 - 11
Adapted from Fig. 9.8, Callister 7e.
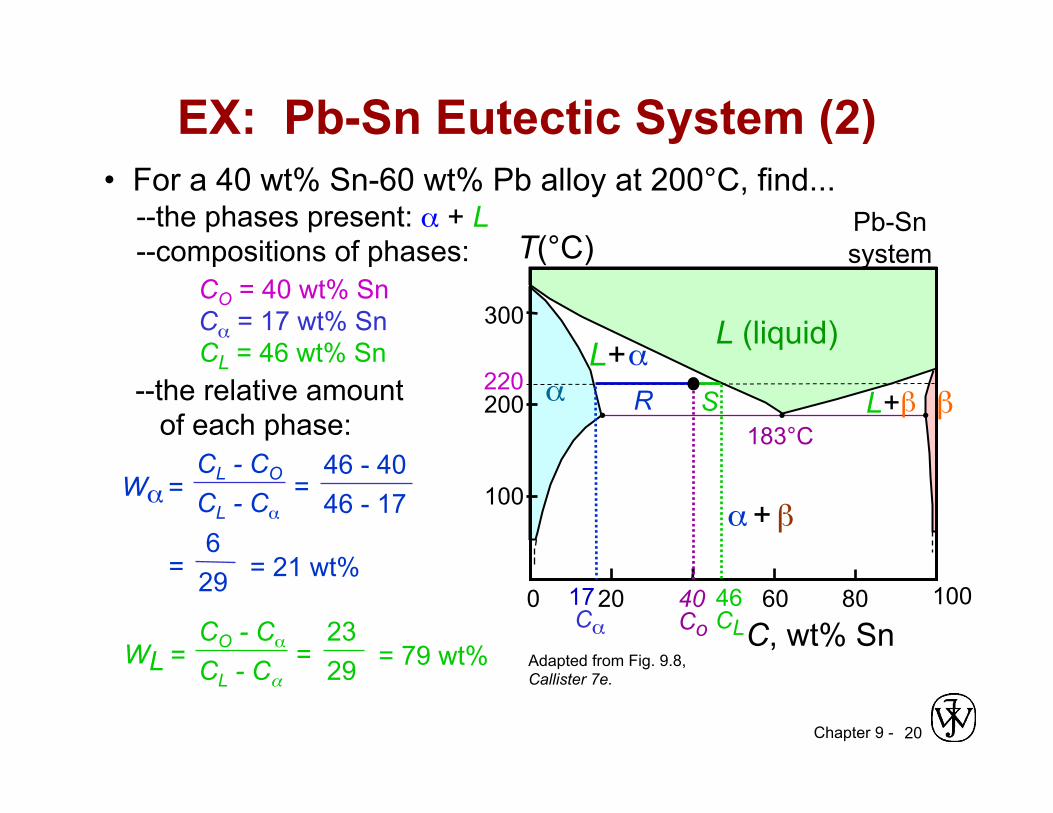
Chapter 9 - 20
L + β
α + β
200
T(°C)
C, wt% Sn 20 60 80 100 0
300
100
L (liquid)
α β L + α
183°C
• For a 40 wt% Sn-60 wt% Pb alloy at 200°C, find... --the phases present: Pb-Sn