Chapter 9 Quality Management – Focus on 6 Sigma. Total Quality Management Defined Malcolm Baldrige National Quality Award Components of Quality Costs of Quality Continuous Improvement Six Sigma Quality Tools Benchmarking Fail-safe Design ISO 9000. Total Quality Management (TQM) Defined. - PowerPoint PPT Presentation
40
1 s used in class may be different from slides in student pack Chapter 9 Quality Management – Focus on 6 Sigma Total Quality Management Defined Malcolm Baldrige National Quality Award Components of Quality Costs of Quality Continuous Improvement Six Sigma Quality Tools Benchmarking Fail-safe Design ISO 9000
Transcript
1Slides used in class may be different from slides in student pack
Chapter 9
Quality Management – Focus on 6 Sigma
Total Quality Management Defined Malcolm Baldrige National Quality Award Components of Quality Costs of Quality Continuous Improvement Six Sigma Quality Tools Benchmarking Fail-safe Design ISO 9000
2Slides used in class may be different from slides in student pack
Total Quality Management (TQM)Defined
Total quality management: managing the
entire organization so that it excels on all
dimensions of products and services that are
important to the customer.
3Slides used in class may be different from slides in student pack
Leadership Strategic Planning Customer and Market Focus Information and Analysis Human Resource Focus Process Management Business Results
Malcolm Baldrige National Quality AwardEstablished 1987, Revised in 1999
4Slides used in class may be different from slides in student pack
Categories for the Baldrige Award Manufacturing companies or subsidiaries that
–
–
Service companies or subsidiaries that sell service Small businesses Health care organizations Educational institutions
5Slides used in class may be different from slides in student pack
Components of Quality Design quality: Inherent value of the
product in the marketplace
–
Conformance quality: Degree to which the product or service design specifications are met
6Slides used in class may be different from slides in student pack
Costs of Quality
Costs ofQuality
7Slides used in class may be different from slides in student pack
Continuous Improvement (CI) Management's view of performance
standards of the organization–
The way management views the contribution and role of its workforce–
8Slides used in class may be different from slides in student pack
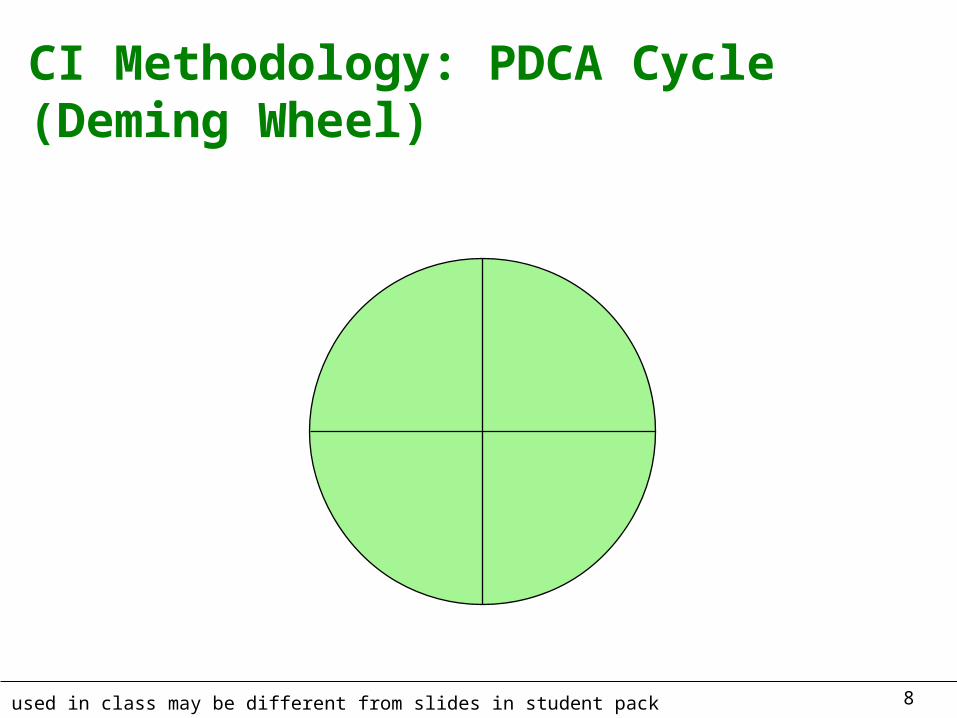
CI Methodology: PDCA Cycle (Deming Wheel)
9Slides used in class may be different from slides in student pack
Six Sigma Quality A philosophy and set
of methods companies use to eliminate defects in their products and processes
Seeks to reduce variation in the processes that lead to product defects
The name, “six sigma” refers to the variation that exists within plus or minus six standard deviations of the process outputs
10Slides used in class may be different from slides in student pack
Six Sigma Quality (Continued) Six Sigma allows managers to readily
describe process performance using a common metric: Defects Per Million Opportunities (DPMO)
1,000,000 x
units of No. x
unit per error for
iesopportunit ofNumber
defects ofNumber
DPMO 1,000,000 x
units of No. x
unit per error for
iesopportunit ofNumber
defects ofNumber
DPMO
11Slides used in class may be different from slides in student pack
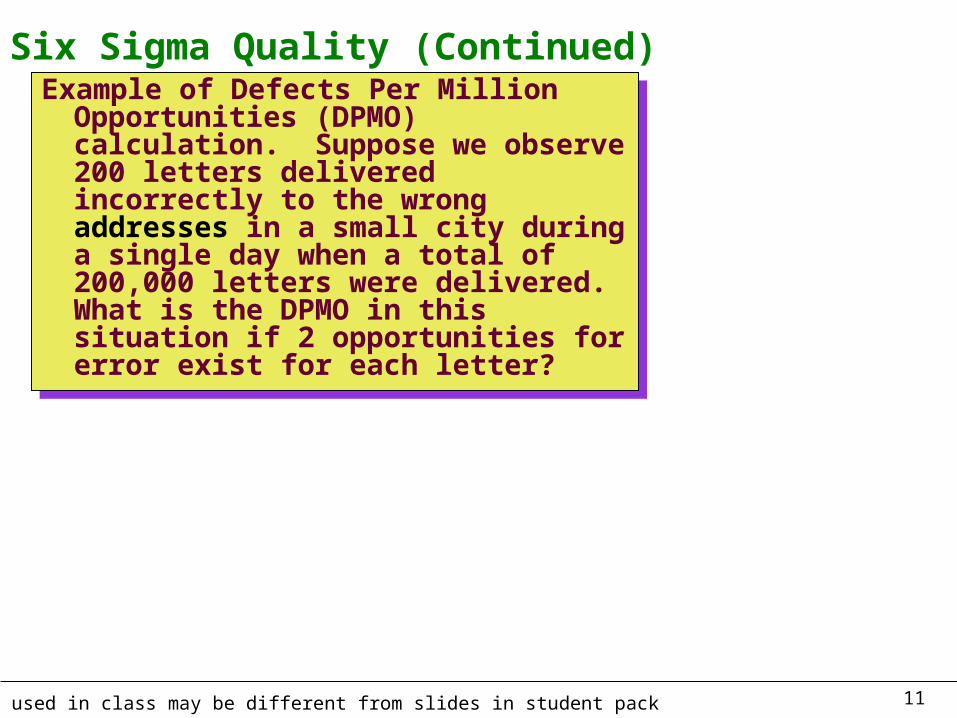
Six Sigma Quality (Continued)Example of Defects Per Million
Opportunities (DPMO) calculation. Suppose we observe 200 letters delivered incorrectly to the wrong addresses in a small city during a single day when a total of 200,000 letters were delivered. What is the DPMO in this situation if 2 opportunities for error exist for each letter?
Example of Defects Per Million Opportunities (DPMO) calculation. Suppose we observe 200 letters delivered incorrectly to the wrong addresses in a small city during a single day when a total of 200,000 letters were delivered. What is the DPMO in this situation if 2 opportunities for error exist for each letter?
12Slides used in class may be different from slides in student pack
Six Sigma Quality: DMAIC Cycle
Define, Measure, Analyze, Improve, and Control (DMAIC)
Developed by General Electric as a means of focusing effort on quality using a methodological approach
Overall focus of the methodology is to understand and achieve what the customer wants
DMAIC consists of five steps….
13Slides used in class may be different from slides in student pack
Six Sigma Quality: DMAIC Cycle (Cont.)
1. Define (D)
2. Measure (M)
3. Analyze (A)
4. Improve (I)
5. Control (C)
14Slides used in class may be different from slides in student pack
Example to illustrate the DMAIC process…
Suppose we are a manufacturer of breakfast cereals. Consumer Reports has just published an article that shows that we frequently have less than 16 ounces of cereal in a box.
What should we do?
15Slides used in class may be different from slides in student pack
Step 1 - Define Customers –
Project – our boxes of cereal are reported to contain less than 16 ounces of cereal. Determine how large the problem is and what should be done about it.
Critical-to-quality characteristic:
16Slides used in class may be different from slides in student pack
2 - Measure
How and what should would we measure to evaluate the extent of the problem?
What are acceptable limits on this measure?
17Slides used in class may be different from slides in student pack
2 – Measure (continued)
Let’s assume that the government says that we must be within ± 5 percent of the weight advertised on the box.
Upper Tolerance Limit =
Lower Tolerance Limit =
18Slides used in class may be different from slides in student pack
2 – Measure (continued)
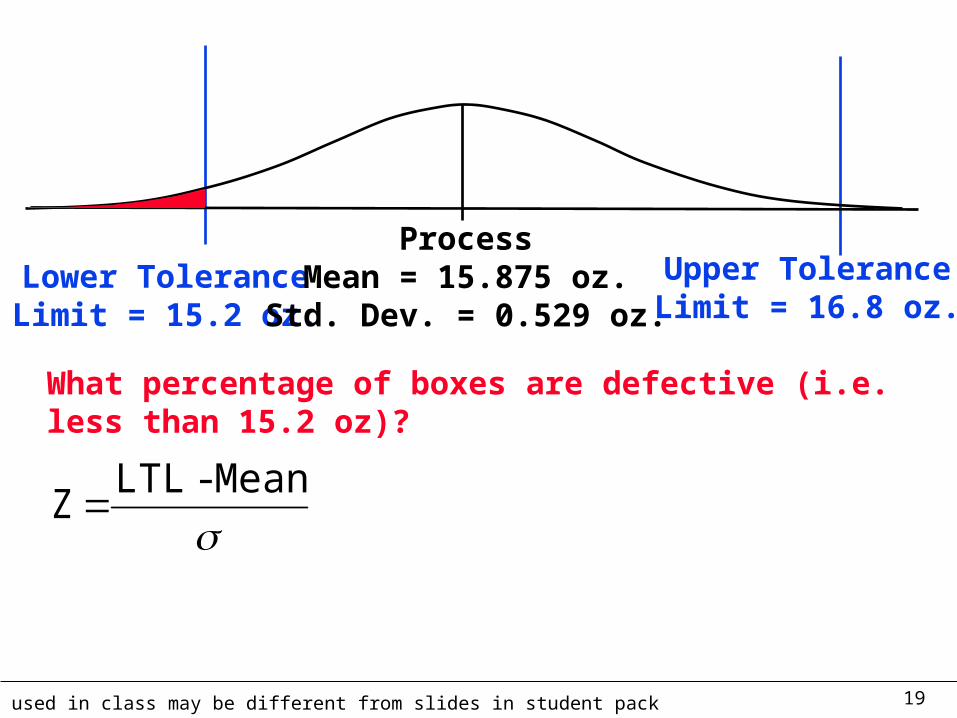
We go out and buy 1,000 boxes of cereal and find that they weigh an average of 15.875 ounces with a standard deviation of 0.529 ounces.
What percentage of boxes are outside the tolerance limits?
19Slides used in class may be different from slides in student pack
Upper ToleranceLimit = 16.8 oz.
Lower ToleranceLimit = 15.2 oz.
ProcessMean = 15.875 oz.
Std. Dev. = 0.529 oz.
What percentage of boxes are defective (i.e. less than 15.2 oz)?
Mean - LTL
Z
20Slides used in class may be different from slides in student pack
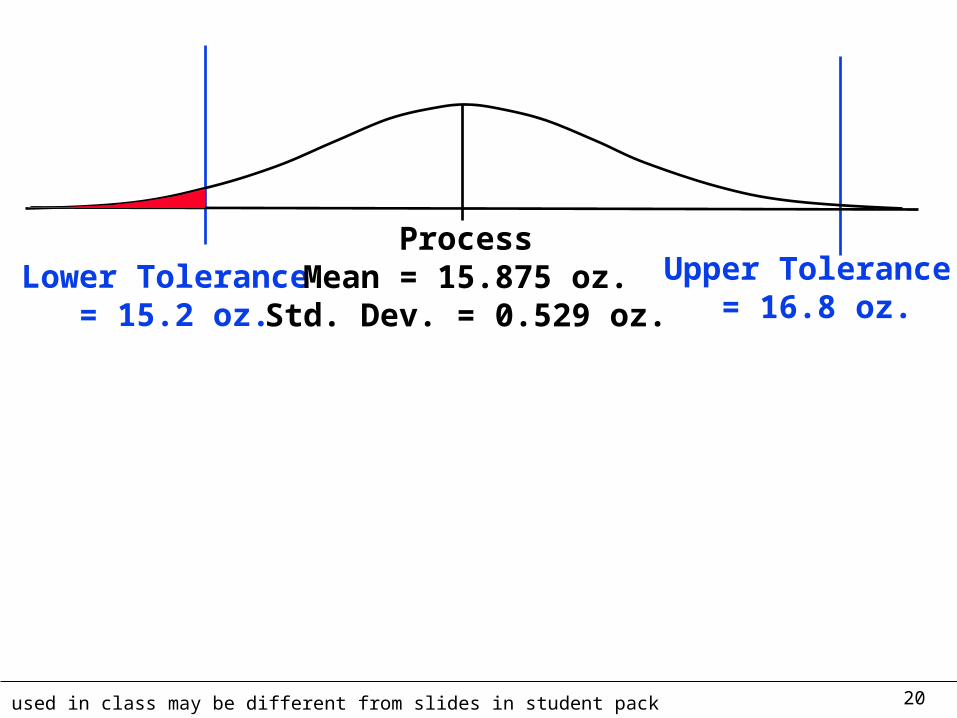
Upper Tolerance = 16.8 oz.
Lower Tolerance = 15.2 oz.
ProcessMean = 15.875 oz.
Std. Dev. = 0.529 oz.
21Slides used in class may be different from slides in student pack
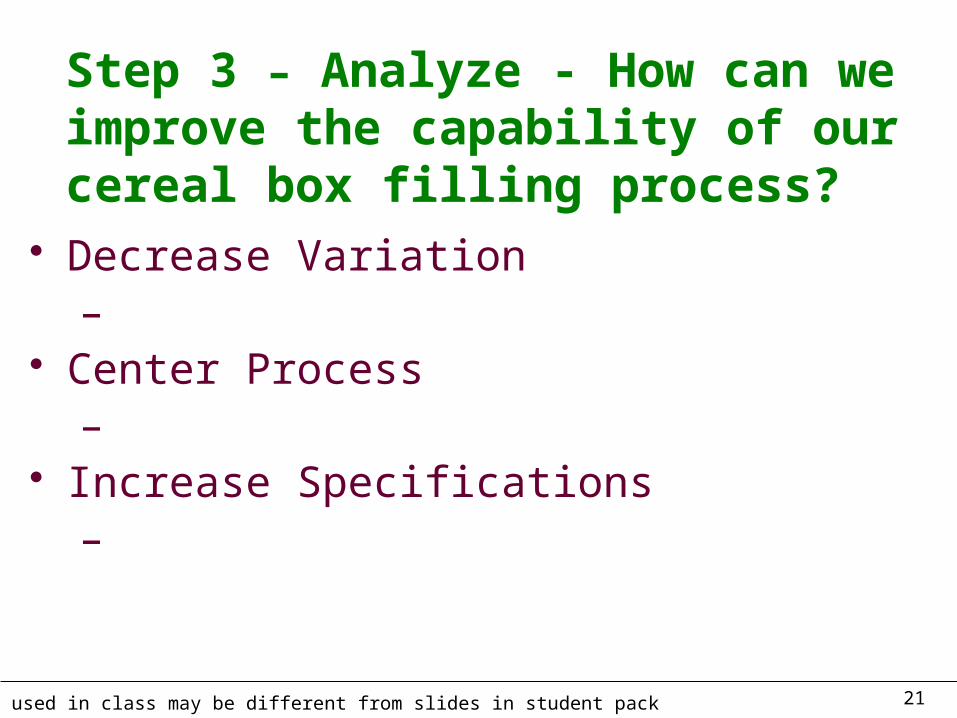
Step 3 – Analyze - How can we improve the capability of our cereal box filling process?
Decrease Variation–
Center Process–
Increase Specifications–
22Slides used in class may be different from slides in student pack
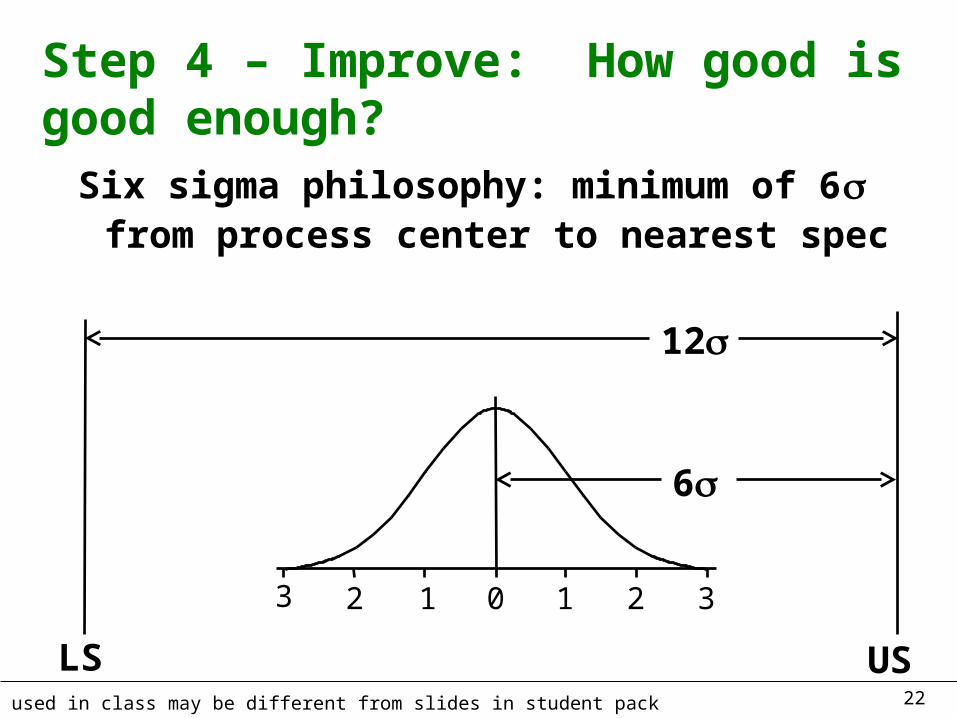
Step 4 – Improve: How good is good enough?
Six sigma philosophy: minimum of 6 from process center to nearest spec
1 23 1 02 3
12
6
LS US
23Slides used in class may be different from slides in student pack
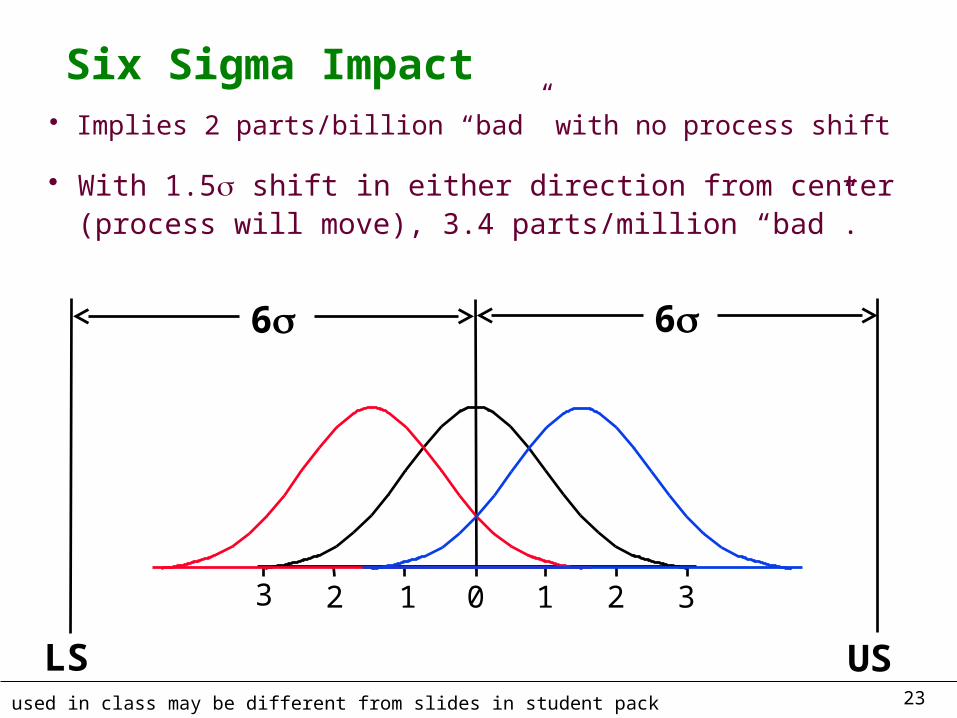
Six Sigma Impact Implies 2 parts/billion “bad” with no process shift
1 23 1 02 3
6
LS US
With 1.5 shift in either direction from center (process will move), 3.4 parts/million “bad”.
6
24Slides used in class may be different from slides in student pack
Step 5 – Control
Statistical Process Control (SPC)– Use data from the actual process– Estimate distributions– Look at capability - is good quality
possible?– Statistically monitor the process over
time
25Slides used in class may be different from slides in student pack
Six Sigma Roles and Responsibilities
1. Executive leaders must champion the process of improvement
2. Corporation-wide training in Six Sigma concepts and tools
• • •
3. Setting stretch objectives for improvement
4. Continuous reinforcement and rewards
26Slides used in class may be different from slides in student pack
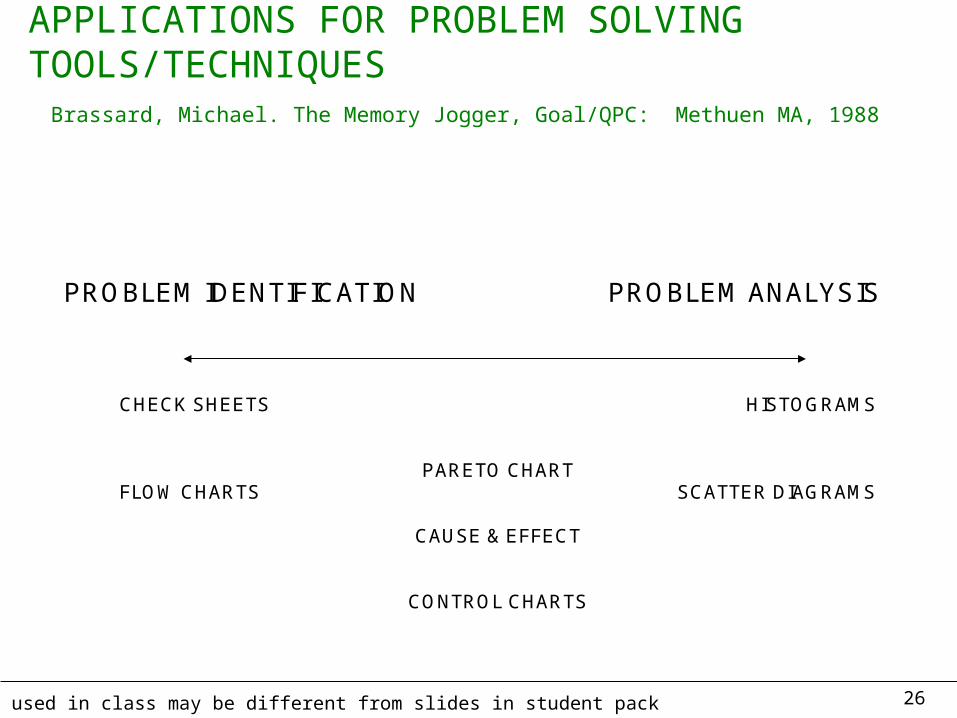
APPLICATIONS FOR PROBLEM SOLVING TOOLS/TECHNIQUES Brassard, Michael. The Memory Jogger, Goal/QPC: Methuen MA, 1988
PROBLEM IDENTIFICATION PROBLEM ANALYSIS
CHECK SHEETS HISTOGRAMS
PARETO CHARTFLOW CHARTS SCATTER DIAGRAMS
CAUSE & EFFECT
CONTROL CHARTS
27Slides used in class may be different from slides in student pack
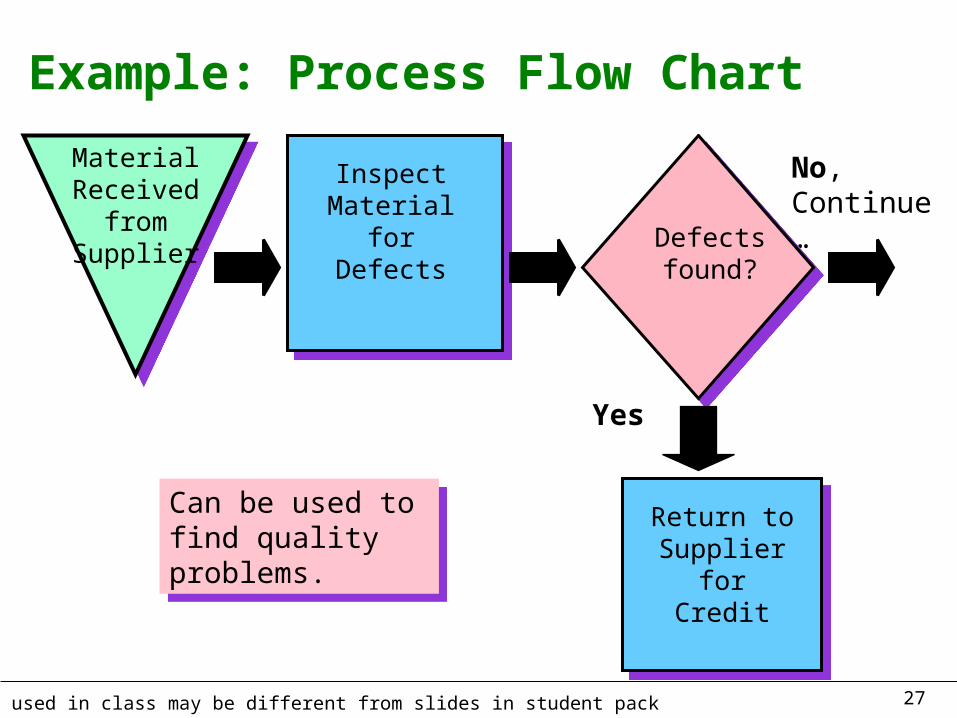
Example: Process Flow Chart
No, Continue…
Material Received
from Supplier
Inspect Material for
Defects Defects found?
Return to Supplier for
Credit
Yes
Can be used to find quality problems.
Can be used to find quality problems.
28Slides used in class may be different from slides in student pack
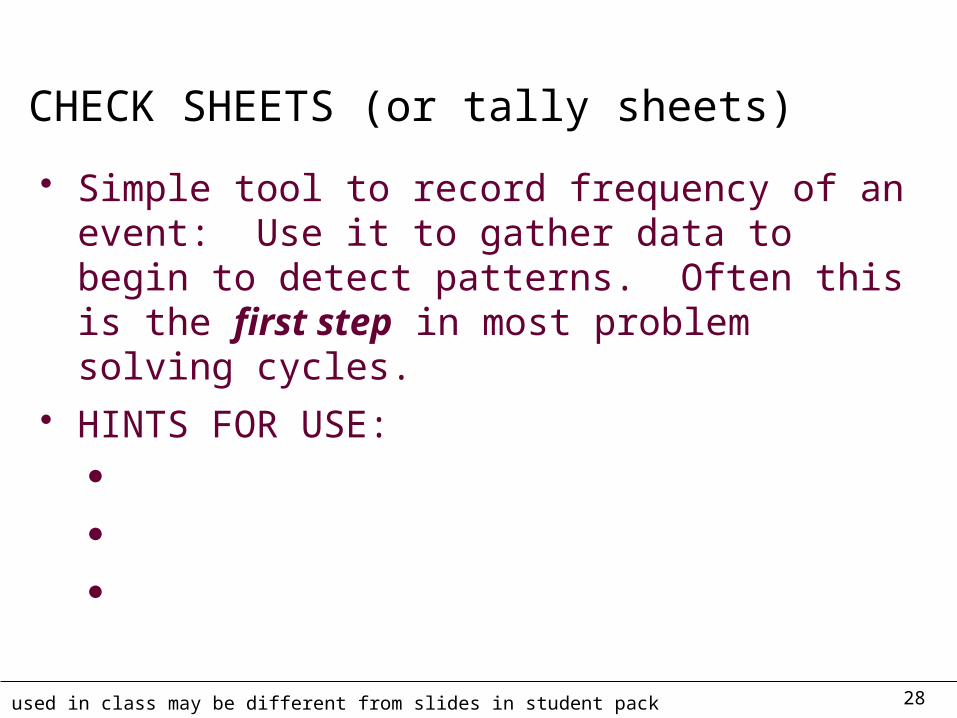
CHECK SHEETS (or tally sheets)
Simple tool to record frequency of an event: Use it to gather data to begin to detect patterns. Often this is the first step in most problem solving cycles.
HINTS FOR USE:
29Slides used in class may be different from slides in student pack
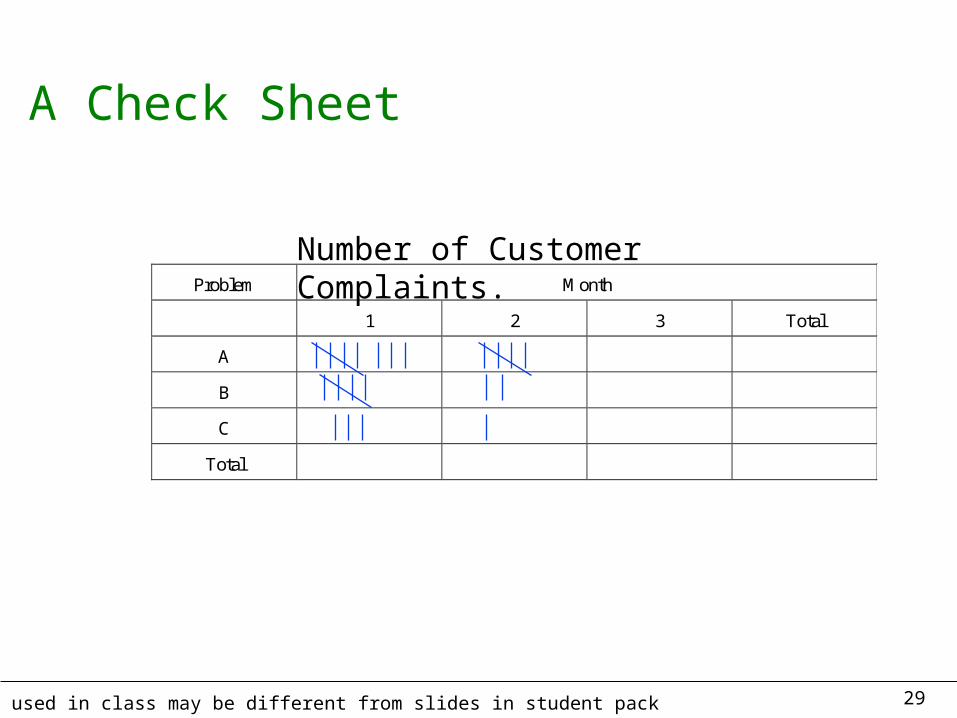
A Check Sheet
Problem Month
1 2 3 Total
A
B
C
Total
Number of Customer Complaints.
30Slides used in class may be different from slides in student pack
PARETO CHARTS
A vertical bar graph that helps us prioritize problems
Portrays attribute data (frequency of each type of defect or problem) gathered from check sheets.
31Slides used in class may be different from slides in student pack
Problem(most recent6 months)
Number ofCustomer
Complaints
CumumulativePercent
Print Quality 23 37.7%
ExcessFlash
13 59.02%
Type Error 6 68.85%
LateShipment
6 78.69%
MisplacePrint
4 85.25%
Bad Count 4 91.80%
Rough Edge 3 96.72%
Missing Ring 2 100%
Total 61
32Slides used in class may be different from slides in student pack
Pareto Chart
0.00%
5.00%
10.00%
15.00%
20.00%
25.00%
30.00%
35.00%
40.00%
Problems
0.00%
20.00%
40.00%
60.00%
80.00%
100.00%
120.00%
Percentage
Cumulative Percentage
33Slides used in class may be different from slides in student pack
Example: Cause & Effect Diagram
ManMachine
MaterialMethod
Environment
Possible causes:Possible causes:
Effect
The results or effect.
The results or effect.
34Slides used in class may be different from slides in student pack
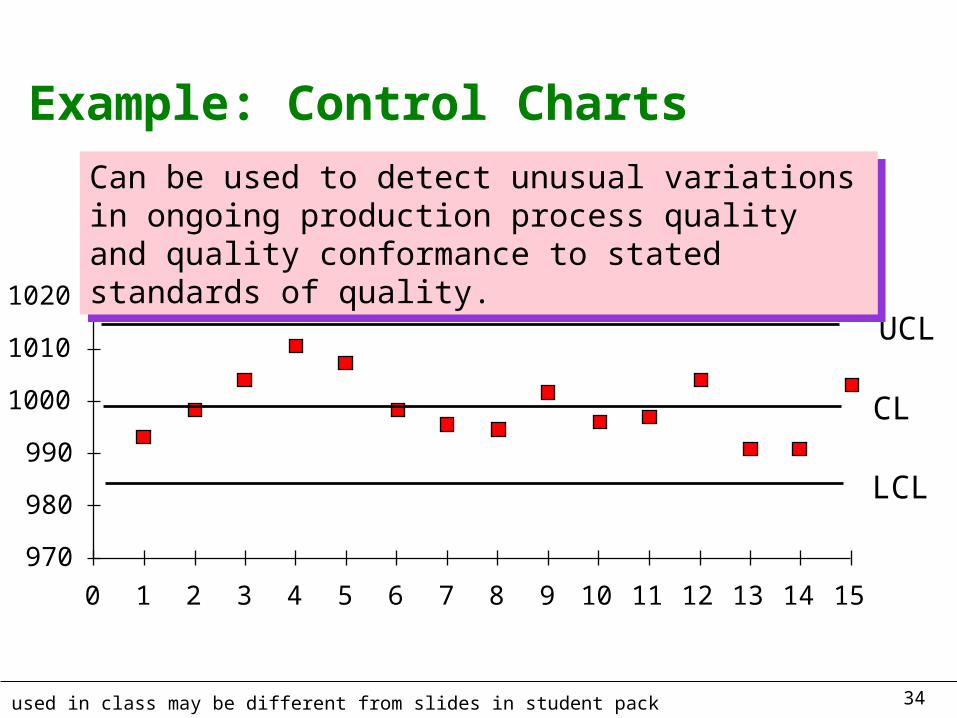
Example: Control Charts
970
980
990
1000
1010
1020
0 1 2 3 4 5 6 7 8 9 10 11 12 13 14 15
LCL
UCL
Can be used to detect unusual variations in ongoing production process quality and quality conformance to stated standards of quality.
Can be used to detect unusual variations in ongoing production process quality and quality conformance to stated standards of quality.
CL
35Slides used in class may be different from slides in student pack
Example: HistogramN
um
be
r o
f Lo
ts
Data Ranges, i.e., temperature
Defects in lot
0 1 2 3 4
36Slides used in class may be different from slides in student pack
SCATTER DIAGRAMS:
These charts portray the relationship between two variables. Use them to explore hypotheses you generate about causes and effects. If a relationship shows some correlation check it out mathematically.
Scatter Graph, Platen Pressure vs Defects/Batch
0123456789
0 10 20 30 40 50 60 70
Platen Pressure
Def
ects
/Bat
ch
Here it looks like platen pressure and defects/batch show a high degree ofcorrelation. Hmm …
37Slides used in class may be different from slides in student pack
Other Six Sigma Tools Failure Mode and Effect Analysis
(DMEA) is a structured approach to identify, estimate, prioritize, and evaluate risk of possible failures at each stage in the process
Design of Experiments (DOE) a statistical test to determine cause-and-effect relationships between process variables and output
38Slides used in class may be different from slides in student pack
Benchmarking
1.
2.
3.
4.
39Slides used in class may be different from slides in student pack
The Shingo System: Fail-Safe Design
Shingo’s argument:– – –
Poka-Yoke includes:– –
40Slides used in class may be different from slides in student pack
ISO 9000
Series of standards agreed upon by the International Organization for Standardization (ISO)
Adopted in 1987
More than 100 countries
A prerequisite for global competition?
ISO 9000 directs you to "document what you do and then do as you documented."