45 CHAPTER 9 RESULTS The results chapter is divided into four sections. The first section discusses the results of manipulation checks, which ensured that the respondents perceived the stimuli in the way the researcher wanted them to. The second section describes CFA/Measurement Model results for the reliability and validity of the seven (7) constructs, which were used in the model. Third section details about the SEM results and hypothesized model’s fit and fourth section of results provide the findings of t-tests. 9.1. Manipulation Checks There were two (2) manipulation checks for the study. The final data (N=480) was divided in four groups. For each brand, there were two groups of responses (for congruent and incongruent celebrity). Manipulation checks were conducted for the variables ‘Familiarity’ and ‘Celebrity Endorser-Brand Congruence’. Table-8 shows the results of the manipulation checks for brand ‘Levi’s’ and Table-9 shows the results for the manipulation checks for brand ‘Nokia’. Table-8. Results of Manipulation Checks (Levi’s Brand) Variables Celebrities Mean t-value Familiarity Priyanka Chopra Rani Mukherjee 6.00 5.91 0.532 ns Celebrity-Brand Congruence Priyanka Chopra Rani Mukherjee 5.13 2.85 14.339** **P<0.01, *P<0.05, ns = Not Significant
Transcript
45
CHAPTER 9
RESULTS
The results chapter is divided into four sections. The first section discusses the results of
manipulation checks, which ensured that the respondents perceived the stimuli in the way the
researcher wanted them to. The second section describes CFA/Measurement Model results
for the reliability and validity of the seven (7) constructs, which were used in the model.
Third section details about the SEM results and hypothesized model’s fit and fourth section
of results provide the findings of t-tests.
9.1. Manipulation Checks
There were two (2) manipulation checks for the study. The final data (N=480) was divided in
four groups. For each brand, there were two groups of responses (for congruent and
incongruent celebrity). Manipulation checks were conducted for the variables ‘Familiarity’
and ‘Celebrity Endorser-Brand Congruence’. Table-8 shows the results of the manipulation
checks for brand ‘Levi’s’ and Table-9 shows the results for the manipulation checks for brand
‘Nokia’.
Table-8. Results of Manipulation Checks (Levi’s Brand)
Variables Celebrities Mean t-value
Familiarity
Priyanka Chopra
Rani Mukherjee
6.00
5.91
0.532ns
Celebrity-Brand
Congruence
Priyanka Chopra
Rani Mukherjee
5.13
2.85
14.339**
**P<0.01, *P<0.05, ns = Not Significant
Table-9. Results of Manipulation Checks (Nokia Brand)
Variables Celebrities Mean t-value
Familiarity
Vijender Singh
Sresanth
5.34
5.25
0.438ns
Celebrity-Brand
Congruence
Vijender Singh
Sresanth
4.27
3.23
6.166**
**P<0.01, *P<0.05, ns = Not Significant
Results of manipulation checks for both the brands show the successful manipulation
of variables ‘Familiarity’ and ‘Celebrity-Brand Congruence’. For ‘Levi’s’ brand, both the
celebrities Priyanka Chopra (mean = 6.00) and Rani Mukherjee (mean = 5.91) had similar
levels of perceived familiarity (t = 0.532, p > 0.05). Hence there won’t be any impact of
celebrity’s familiarity on consumer attitudes. Further, Priyanka Chopra (mean = 5.13) was
perceived significantly higher (t = 14.339, p < 0.05) than Rani Mukherjee (mean = 2.85) on
congruence with brand’s personality, satisfying the study’s assumptions of congruent and
incongruent celebrity. For ‘Nokia’ brand, Vijender Singh (mean = 5.34) and Sreesanth (mean
= 5.25) were perceived to be equally familiar to the participants (t = 0.438, p > 0.05). On
congruence with brand’s personality, Vijender Singh (mean = 4.27) was significantly higher
(t = 6.166, p < 0.05) than Sreesanth (mean = 3.23), again satisfying the study’s assumptions
on congruence.
9.2. Test of Construct Validity and Reliability for Latent Factors (Measurement Model)
This phase of results, discuss the various tests of reliability and construct validity for all
seven (7) factors used for the model. Construct validity is the extent to which a set of
observed variables/items actually reflects the theoretical latent construct those items are
designed to measure (Hair et al., 2009). Evidence of construct validity substantiate that the
item measures taken from a sample represent the actual true score of population. Construct
validity has four important components: Face validity, Convergent validity, Discriminant
validity and Nomological validity (Hair et al., 2009).
Face validity tests whether the items provide the same information related to its
constructs or not (Hair et. al, 2009). As mentioned earlier in chapters of research design and
questionnaire design, the items/questions to measure the constructs were adopted from the
past literature. And further, the questionnaires used in this study were shown to two experts
and they validated those questions. It satisfies the face validity of the constructs.
Convergent validity is established when the items of a specific construct converge or
share a high proportion of variance. There are several ways to check the convergent validity.
High factor loadings of items on its factor indicate that they converge on a single factor.
Various studies have suggested that the standardized factor loadings should be 0.5 or higher,
and ideally 0.7 or higher (Hair et al., 2009). Second measure to check convergent validity is
the ‘Average Variance Extracted (AVE)’. This value is calculated by dividing summation of
squares of all the factor loadings of items under a factor by number of items under that factor.
AVE value of 0.5 or higher suggests adequate convergence (Hair et al., 2009). The third
measure for convergent validity is the ‘Construct Reliability’. It is calculated by dividing
squared sum of factor loadings by sum of squared sum of factor loadings and the sum of error
variance. Its value of 0.7 or higher is construed as the good evidence of convergent validity.
Further, Reliability coefficient Cronbach’s α shows the internal consistency in responses to a
particular construct. Its value of 0.8 or higher suggests good reliability of that construct. A
series of CFAs were conducted to confirm the convergent validity of each factor. Results of
all these CFAs and Reliability coefficients are shown in tables for each factor.
9.2.1. Endorser Personality and Brand Personality Congruence (CONGR)
CFA results for the factor ‘CONGR’ showed a good fit of the model. Chi-square value (with
degrees of freedom 6) for this model was 8.263. Table-10 provides the indices for goodness
of fit for this construct with their recommended values.
Table-10. Model Fit Indices for CONGR
Fit Indices Recommended Value* Measurement Model
Chi-square to degree of
freedom ratio (CMIN/df) 3.000 or below 1.377
Root mean square of error
approximate (RMSEA) 0.070 or below 0.028
Standardized root mean
residual (SRMR) 0.070 or below 0.005
Comparative Fit Indices
(CFI) 0.900 or above 0.999
Tucker-Lewis Index (TLI) 0.900 or above 0.998
The statistical tool ‘Mplus’ doesn’t provide GFI and AGFI values (Byrne, 2012).
Other parameters are shown in Table-11.
* Browne and Cudeck, 1993; Hu & Bentler, 1999; Hair at al., 2009; and Byrne, 2012.
Table-11. CFA Results for CONGR
Factors/Items
Std. Factor
Loading
Variance
Explained
Factor 1: Endorser-Brand Congruence
Please indicate your opinion on the
appropriateness of the celebrity endorser as the
brand ambassador of Levi’s/Nokia based on
personality traits of both.
(a) Very Inappropriate-Very Appropriate
(b) Inconsistent-Consistent
(c) Very Unlikely Match-Very Likely Match
(d) Very Irrelevant-Very Relevant
(e) Doesn’t Match-Matches Very well
(f) Doesn’t Go Together-Goes Together
0.877**
0.819**
0.931**
0.927**
0.933**
0.916**
0.769**
0.670**
0.866**
0.859**
0.871**
0.840**
**P<0.01, *P<0.05, ns = Not Significant
For this model, AVE was 0.812, construct reliability was 0.963 and Cronbach’s α was
0.964. CFA results show that the convergent validity and reliability of the construct
‘CONGR’ are good as each factor loading is more than 0.7; Variance explained by each item
is more than 0.5; AVE is more than 0.5; construct reliability is more than 0.7; and reliability
coefficient or Cronbach’s α is more than 0.8.
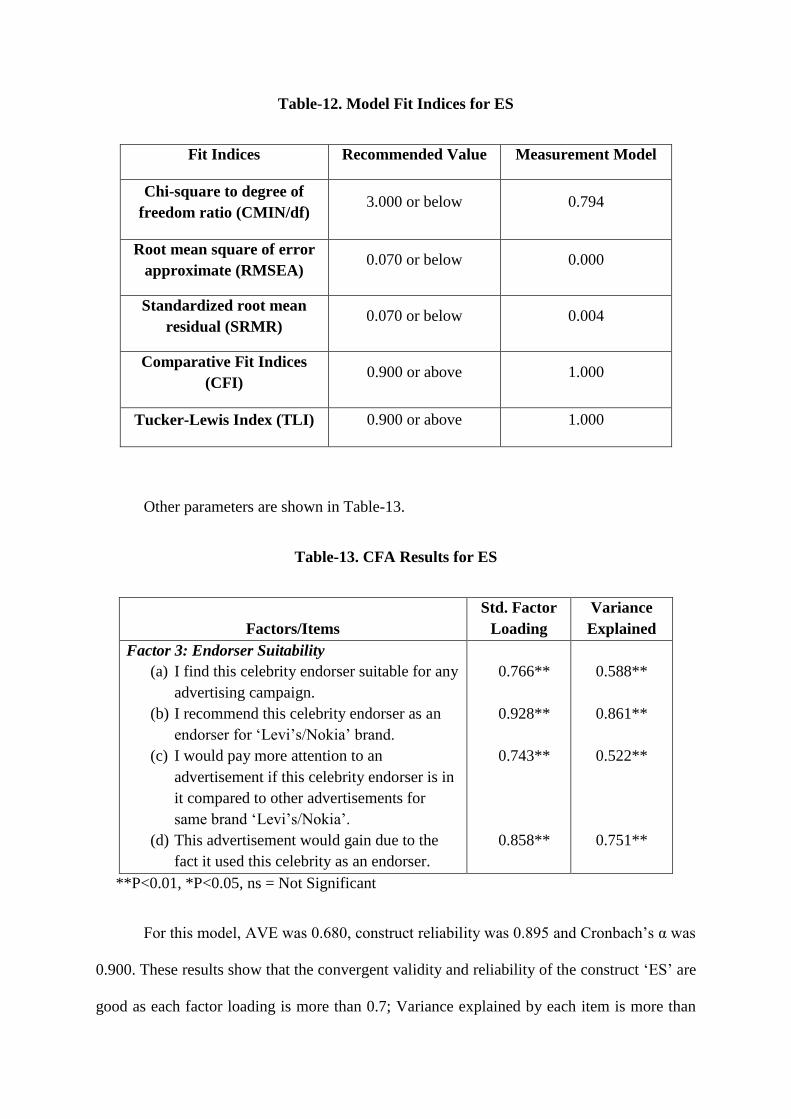
9.2.2. Endorser Suitability (ES)
CFA results for the factor ‘ES’ too showed a good fit of the model. Chi-square value (with
degrees of freedom 1) for this model was 0.794. Table-12 provides the indices for goodness
of fit for this construct with their recommended values.
Table-12. Model Fit Indices for ES
Fit Indices Recommended Value Measurement Model
Chi-square to degree of
freedom ratio (CMIN/df) 3.000 or below 0.794
Root mean square of error
approximate (RMSEA) 0.070 or below 0.000
Standardized root mean
residual (SRMR) 0.070 or below 0.004
Comparative Fit Indices
(CFI) 0.900 or above 1.000
Tucker-Lewis Index (TLI) 0.900 or above 1.000
Other parameters are shown in Table-13.
Table-13. CFA Results for ES
Factors/Items
Std. Factor
Loading
Variance
Explained
Factor 3: Endorser Suitability
(a) I find this celebrity endorser suitable for any
advertising campaign.
(b) I recommend this celebrity endorser as an
endorser for ‘Levi’s/Nokia’ brand.
(c) I would pay more attention to an
advertisement if this celebrity endorser is in
it compared to other advertisements for
same brand ‘Levi’s/Nokia’.
(d) This advertisement would gain due to the
fact it used this celebrity as an endorser.
0.766**
0.928**
0.743**
0.858**
0.588**
0.861**
0.522**
0.751**
**P<0.01, *P<0.05, ns = Not Significant
For this model, AVE was 0.680, construct reliability was 0.895 and Cronbach’s α was
0.900. These results show that the convergent validity and reliability of the construct ‘ES’ are
good as each factor loading is more than 0.7; Variance explained by each item is more than
0.5; AVE is more than 0.5; construct reliability is more than 0.7; and reliability coefficient or
Cronbach’s α is more than 0.8.
9.2.3. Endorser Credibility (EC)
CFA results for the factor ‘EC’ showed a good fit of the model. Chi-square value (with
degrees of freedom 84) for this model was 189.137. Table-14 provides the indices for
goodness of fit for this construct with their recommended values.
Table-14. Model fit Indices for EC
Fit Indices Recommended Value Measurement Model
Chi-square to degree of
freedom ratio (CMIN/df) 3.000 or below 2.251
Root mean square of error
approximate (RMSEA) 0.070 or below 0.051
Standardized root mean
residual (SRMR) 0.070 or below 0.028
Comparative Fit Indices
(CFI) 0.900 or above 0.979
Tucker-Lewis Index (TLI) 0.900 or above 0.974
Other parameters are shown in Table-15. For this model, AVE was 0.634, construct
reliability was 0.768 and Cronbach’s α was 0.924. These results show that the convergent
validity and reliability of the construct ‘EC’ are good as almost all factor loadings are more
than 0.7; Variance explained by almost all items are more than 0.5; AVE is more than 0.5;
construct reliability is more than 0.7; and reliability coefficient or Cronbach’s α is more than
0.8.
Table-15. CFA Results for EC
Factors/Items
Std. Factor
Loading
Variance
Explained
Factor 2: Source Credibility
Please indicate your opinion about the celebrity
endorser on the following items. The last five
items should be considered with respect to the
brand advertised.
1. Attractiveness
(a) Unattractive-Attractive
(b) Not Classy-Classy
(c) Ugly-Handsome/Beautiful
(d) Plain-Ugly
(e) Not Sexy-Sexy
2. Trustworthiness
(f) Untrustworthy-Trustworthy
(g) Undependable-Dependable
(h) Dishonest-Honest
(i) Unreliable-Reliable
(j) Insincere-Sincere
3. Expertise
(k) Not an Expert-Expert
(l) Inexperienced-Experienced
(m) Unknowledgeable- Knowledgeable
(n) Unqualified-Qualified
(o) Unskilled-Skilled
0.917**α
0.864**
0.832**
0.798**
0.842**
0.802**
0.727**α
0.710**
0.513**
0.739**
0.868**
0.772**
0.731**α
0.801**
0.846**
0.872**
0.832**
0.809**
0.840**β
0.747**
0.692**
0.636**
0.710**
0.644**
0.528**β
0.505**
0.263**
0.546**
0.753**
0.596**
0.534**β
0.641**
0.716**
0.761**
0.693**
0.654**
**P<0.01, *P<0.05, ns = Not Significant
9.2.4. Advertisement Believability (ABL)
Results related to the CFA conducted for the construct ‘ABL’ are shown in Table-16
α Factor loadings of second order construct EC on first order constructs Attractiveness, Trustworthiness and
Expertise
β Variance explained by first order constructs Attractiveness, Trustworthiness and Expertise
Table-16. CFA Results for ABL
Factors/Items
Std. Factor
Loading
Variance
Explained
Factor 4: Believability/Credibility of
Advertisement
Indicate your opinion on the
believability/credibility of the advertisement
shown.
(a) Highly Unbelievable-Highly Believable
(b) Highly Incredible-Highly Credible
0.806**
0.769**
0.650**
0.592**
**P<0.01, *P<0.05, ns = Not Significant
For this model, AVE was 0.621, construct reliability was 0.765 and Correlation
coefficient was 0.886. These results show that the convergent validity and reliability of the
construct ‘ABL’ are good as each factor loading is more than 0.7; Variance explained by each
item is more than 0.5; AVE is more than 0.5; construct reliability is more than 0.7; and
correlation coefficient is more than 0.8. The construct ‘ABL’ had only two items therefore
the correlation coefficient is better indicator for the internal consistency than Cronbach’s
alpha.
9.2.5. Attitude toward Advertisement (AA)
CFA results for the factor ‘AA’ showed a good fit of the model. Chi-square value (with
degrees of freedom 2) for this model was 5.369. Table-17 provides the indices for goodness
of fit for this construct with their recommended values.
Table-17. Model Fit Indices for AA
Fit Indices Recommended Value Measurement Model
Chi-square to degree of
freedom ratio (CMIN/df) 3.000 or below 2.684
Root mean square of error
approximate (RMSEA) 0.070 or below 0.059
Standardized root mean
residual (SRMR) 0.070 or below 0.005
Comparative Fit Indices
(CFI) 0.900 or above 0.998
Tucker-Lewis Index (TLI) 0.900 or above 0.995
Other parameters are shown in Table-18.
Table-18. CFA Results for AA
Factors/Items
Std. Factor
Loading
Variance
Explained
Factor 5: Attitude toward Advertisement
Rate your attitude toward the advertisement
using the following scales.
(a) Unpleasant-Pleasant
(b) Not likeable-likeable
(c) Unfavourable-Favourable
(d) Bad-Good
0.865**
0.921**
0.909**
0.912**
0.749**
0.848**
0.827**
0.832**
**P<0.01, *P<0.05, ns = Not Significant
For this model, AVE was 0.814, construct reliability was 0.946 and Cronbach’s α was
0.945. These results show that the convergent validity and reliability of the construct ‘AA’
too are good as each factor loading is more than 0.7; Variance explained by each item is more
than 0.5; AVE is more than 0.5; construct reliability is more than 0.7; and reliability
coefficient or Cronbach’s α is more than 0.8.
9.2.6. Attitude toward Brand (AB)
CFA results for the factor ‘AB’ showed a good fit of the model. Chi-square value (with
degrees of freedom 1) for this model was 1.351. Table-19 provides the indices for goodness
of fit for this construct with their recommended values.
Table-19. Model Fit Indices for AB
Fit Indices Recommended Value Measurement Model
Chi-square to degree of
freedom ratio (CMIN/df) 3.000 or below 1.351
Root mean square of error
approximate (RMSEA) 0.070 or below 0.027
Standardized root mean
residual (SRMR) 0.070 or below 0.003
Comparative Fit Indices
(CFI) 0.900 or above 1.000
Tucker-Lewis Index (TLI) 0.900 or above 0.999
Other parameters are shown in Table-20.
Table-20. CFA Results for AB
Factors/Items
Std. Factor
Loading
Variance
Explained
Factor 6: Attitude toward the Brand
Rate your attitude toward the
Levi’s/Nokia using the following scales.
(a) Unpleasant-Pleasant
(b) Not likeable-likeable
(c) Unfavourable-Favourable
(d) Bad-Good
0.816**
0.919**
0.890**
0.881**
0.665**
0.844**
0.792**
0.777**
**P<0.01, *P<0.05, ns = Not Significant
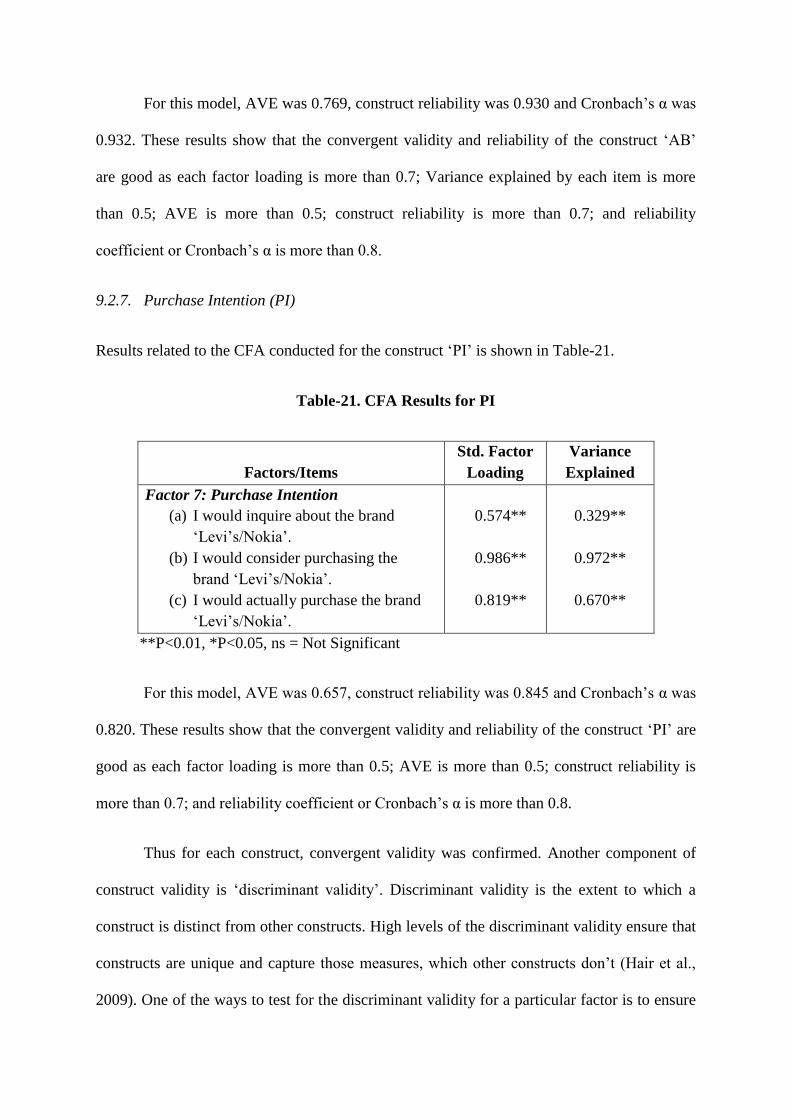
For this model, AVE was 0.769, construct reliability was 0.930 and Cronbach’s α was
0.932. These results show that the convergent validity and reliability of the construct ‘AB’
are good as each factor loading is more than 0.7; Variance explained by each item is more
than 0.5; AVE is more than 0.5; construct reliability is more than 0.7; and reliability
coefficient or Cronbach’s α is more than 0.8.
9.2.7. Purchase Intention (PI)
Results related to the CFA conducted for the construct ‘PI’ is shown in Table-21.
Table-21. CFA Results for PI
Factors/Items
Std. Factor
Loading
Variance
Explained
Factor 7: Purchase Intention
(a) I would inquire about the brand
‘Levi’s/Nokia’.
(b) I would consider purchasing the
brand ‘Levi’s/Nokia’.
(c) I would actually purchase the brand
‘Levi’s/Nokia’.
0.574**
0.986**
0.819**
0.329**
0.972**
0.670**
**P<0.01, *P<0.05, ns = Not Significant
For this model, AVE was 0.657, construct reliability was 0.845 and Cronbach’s α was
0.820. These results show that the convergent validity and reliability of the construct ‘PI’ are
good as each factor loading is more than 0.5; AVE is more than 0.5; construct reliability is
more than 0.7; and reliability coefficient or Cronbach’s α is more than 0.8.
Thus for each construct, convergent validity was confirmed. Another component of
construct validity is ‘discriminant validity’. Discriminant validity is the extent to which a
construct is distinct from other constructs. High levels of the discriminant validity ensure that
constructs are unique and capture those measures, which other constructs don’t (Hair et al.,
2009). One of the ways to test for the discriminant validity for a particular factor is to ensure
the AVE of that factor would be higher than squared inter-factors correlations. Result related
to the discriminant validity has been shown in Table-22.
Table-22. AVE and Covariance Matrix
CONGR EC ES ABL AA AB PI
CONGR 0.812
EC 0.565 0.637
ES 0.652 0.543 0.680
ABL 0.546 0.571 0.609 0.621
AA 0.403 0.471 0.516 0.576 0.814
AB 0.014 0.017 0.018 0.026 0.036 0.782
PI 0.003 0.004 0.004 0.006 0.009 0.254 0.657
From Table-22, it could be observed that ‘Average Variance Extracted (AVE)’ for
each construct (diagonally in bold letters) is more than the squared inter-construct
correlations. Hence, the discriminant validity of all seven constructs has been confirmed.
Nomological validity and predictive validity are confirmed by examining whether the
construct is significantly correlated to the other related constructs or not (Hair et al., 2009).
This validity got confirmed through the significant relationships between constructs in the
structural model shown in next section. Thus the construct validity of all the constructs has
been confirmed.
9.3. The Structural Model Results
‘Structural Equation Modeling’ with the help of ‘Mplus version 6.12’ was performed to test
the hypothesized relationships shown in Figure-1. The model fit parameters given by Mplus
output have been provided in Table-23.
Table-23. Model Fit Parameters
MODEL FIT INFORMATION
Number of Free Parameters 139
Chi-Square Test of Model Fit
Value 1123.387
Degrees of Freedom 640
CMIN/df 1.755
P-Value 0.0000
RMSEA (Root Mean Square Error Of
Approximation)
Estimate 0.040
90 Percent C.I. 0.036 0.043
Probability RMSEA <= .05 1.000
CFI/TLI
CFI 0.971
TLI 0.968
SRMR (Standardized Root Mean Square
Residual) Value 0.037
The structural model suggested in this study (Figure-1) was tested using the maximum
likelihood method with Mplus 6.12. The results showed an acceptable fit of the proposed
structural model with χ2 (480) = 1123.387, df = 640, p = .00, CMIN/df = 1.755, RMSEA =
.040, CFI = .971, TLI = .968, and SRMR = .037 (Hair et al., 2009; Hu and Bentler, 1999;
Browne and Cudeck, 1993). Mplus doesn’t provide the GFI and AGFI values (Byrne, 2012).
The standardized model path coefficients and their corresponding p-values have been


![DATA ANALYSIS, RESULTS AND DISCUSSIONshodhganga.inflibnet.ac.in/bitstream/10603/62097/11/11...[82] CHAPTER – IV DATA ANALYSIS, RESULTS AND DISCUSSION In this chapter obtained results](https://static.documents.pub/doc/80x56/5ec86e40997044603330e83f/data-analysis-results-and-82-chapter-a-iv-data-analysis-results-and-discussion.jpg)


