67
Infrastructure and Asset Management Plan 2020-2029 Chapter 9 Transport DRAFT

Infrastructure and Asset Management Plan
2020-2029
Chapter 9
Transport
DRAFT

Document Control
Synergy Record Number TBA
Rev No Date Revision Details Author Reviewer(s) Approver
1 25 Sep 2020 Draft CAS Elected Members Elected Members
2 20 October 2020
Revision incorporating comments from Elected Members
CAS Elected Members Audit and Risk Committee
3 29 October 2020
Revision incorporating comments from Audit Committee
CAS Elected Members Council
4 10 November 2020
Consultation Version CSA

Contents
1. EXECUTIVE SUMMARY ........................................................................................................................................... 1
1.1 The Purpose of the Plan .................................................................................................................................... 1
1.2 Asset Description ............................................................................................................................................... 1
1.3 What Does it Cost?............................................................................................................................................ 1
1.4 Plans for the Future ........................................................................................................................................... 2
1.5 Measuring our Performance .............................................................................................................................. 2
1.5 The Next Steps .................................................................................................................................................. 3
2. INTRODUCTION ....................................................................................................................................................... 4
2.1 Background ....................................................................................................................................................... 4
2.1.1 Strategic Linkages ..................................................................................................................................... 4
2.1.2 Infrastructure and Assets included in the plan .......................................................................................... 4
2.2 Goals and Objectives of Asset Management .................................................................................................... 4
2.3 Plan Framework ................................................................................................................................................ 4
3. LEVELS OF SERVICE .............................................................................................................................................. 6
3.1 Customer Research and Expectations .............................................................................................................. 6
3.2 Strategic and Corporate Goals .......................................................................................................................... 7
3.3 Legislative Requirements .................................................................................................................................. 7
3.4 Levels of Service ............................................................................................................................................... 7
3.3.1 Customer Values ....................................................................................................................................... 8
3.3.1 Community Levels of Service .................................................................................................................... 9
3.3.3 Technical Levels of Service ..................................................................................................................... 11
4. FUTURE DEMAND ................................................................................................................................................. 14
4.1 Demand Drivers and Forecast ........................................................................................................................ 14
4.2 Climate Change ............................................................................................................................................... 14
4.3 Legislation change........................................................................................................................................... 15
4.4 Changes in Technology ................................................................................................................................... 15
4.5 Demand Management Plan ............................................................................................................................. 15
4.6 New Assets from Growth ................................................................................................................................. 16
5. LIFECYCLE MANAGEMENT PLAN ........................................................................................................................ 17
5.1 Background Data ............................................................................................................................................. 17
5.1.1 Physical Parameters ................................................................................................................................ 17
5.1.2 Asset Capacity and Performance ........................................................................................................... 20
5.1.3 Asset Condition ....................................................................................................................................... 21
5.1.4 Asset Valuation ........................................................................................................................................ 22

5.2 Risk Management Plan ................................................................................................................................... 24
5.3 Maintenance Plan ............................................................................................................................................ 27
5.3.1 Maintenance Types ................................................................................................................................. 27
5.3.2 Maintenance Arrangements .................................................................................................................... 28
5.3.3 Standards and Specifications .................................................................................................................. 28
5.3.4 Maintenance Expenditure Patterns ......................................................................................................... 28
5.4 Renewal Plan .................................................................................................................................................. 29
5.4.1 Renewal Priority ...................................................................................................................................... 29
5.4.2 Renewal Standards ................................................................................................................................. 30
5.4.3 Summary of future renewal expenditure ................................................................................................. 31
5.4.4 Renewal Back log .................................................................................................................................... 31
5.4.5 Renewal Projection .................................................................................................................................. 31
5.5 New and Upgrade Plan ................................................................................................................................... 32
5.5.1 Selection Criteria ........................................................................................................................................... 32
5.5.2 Standards and Specifications ........................................................................................................................ 32
5.5.3 Future upgrades/new assets expenditure ..................................................................................................... 32
5.6 Disposal Plan ................................................................................................................................................... 33
6 FINANCIAL SUMMARY .......................................................................................................................................... 34
6.1 Financial Statements and Projections ............................................................................................................. 34
6.1.1 Sustainability of Service Delivery .................................................................................................................. 34
6.2 Funding Strategy ............................................................................................................................................. 36
6.3 Valuation Forecasts ......................................................................................................................................... 36
6.4 Key Assumptions made in Financial Forecasts .............................................................................................. 37
7 ASSET MANAGEMENT PRACTICES .................................................................................................................... 39
7.1 Accounting/Financial Systems ........................................................................................................................ 39
7.2 Asset Information System ............................................................................................................................... 39
7.3 Information Flow Requirements and Processes ............................................................................................. 39
7.4 Standards and Guidelines ............................................................................................................................... 39
8 PLAN IMPROVEMENT AND MONITORING .......................................................................................................... 40
8.1 Performance Measures ................................................................................................................................... 40
8.2 Improvement Plan ........................................................................................................................................... 40
8.3 Monitoring and Review Procedures ................................................................................................................ 41
9 REFERENCES ........................................................................................................................................................ 42
APPENDIX A – Transport Planned operating, capital renewal and capital upgrade expenditure .................................. 43
APPENDIX B – Transport Rules for Finance and Asset Finda ....................................................................................... 44
APPENDIX C – Strategic Document Recommendations ................................................................................................ 46
APPENDIX D – Road Classification Maps ...................................................................................................................... 50

APPENDIX E – Road Cross Section Standard Drawings ............................................................................................... 51
APPENDIX F – Renewal Priorities – Roads ................................................................................................................... 54
APPENDIX G – Renewal Priorities – Other Transport Assets ........................................................................................ 57
APPENDIX H – Upgrade Priorities .................................................................................................................................. 58
APPENDIX I – Road Action Plan .................................................................................................................................... 60
Tables
Table 1: Lifecycle Costs .................................................................................................................................................... 2
Table 2: Planned Maintenance and Renewal Expenditure ............................................................................................... 2
Table 3: Assets Covered by the IAMP - Transport ............................................................................................................ 4
Table 4: Strategic Goals and how they are addressed in this IAMP ................................................................................. 7
Table 5: Customer Values ................................................................................................................................................. 8
Table 6: Community Levels of Service .............................................................................................................................. 9
Table 7: Technical Levels of Service – Sealed Roads .................................................................................................... 11
Table 8: Climate Change Adaptation Plan Actions ......................................................................................................... 14
Table 9: Demand Management Plan .............................................................................................................................. 15
Table 10: Physical Parameters, including age profile ..................................................................................................... 17
Table 11: Transport Asset Service Hierarchy ................................................................................................................. 19
Table 12: Service Deficiencies ........................................................................................................................................ 20
Table 13: Valuation Summary as at 30 June 2020 ......................................................................................................... 23
Table 14: Risk Assessment Summary ............................................................................................................................ 25
Table 15: Historic Maintenance Expenditure .................................................................................................................. 28
Table 16: Renewal Priority Ranking Criteria ................................................................................................................... 30
Table 17: Summary of life cycle costs ............................................................................................................................. 34
Table 18: Accumulative Renewal Funding Gap .............................................................................................................. 35
Table 19: Improvement Plan ........................................................................................................................................... 40

Figures
Figure 1: Visitor satisfaction with quality of road signage ................................................................................................. 6
Figure 2: Visitor satisfaction with quality of roads ............................................................................................................. 6
Figure 3: Asset Condition - Sealed Roads ...................................................................................................................... 21
Figure 4: Asset Condition - Sheeted Roads .................................................................................................................... 21
Figure 5: Asset Condition - Carparks .............................................................................................................................. 22
Figure 6: Asset Condition - Footpaths ............................................................................................................................. 22
Figure 7: Maintenance Expenditure Projections ............................................................................................................. 29
Figure 8: Projected Renewal Expenditure ....................................................................................................................... 31
Figure 9: New and Upgrade Forecast ............................................................................................................................. 32
Figure 10: Financial Projections - Operating, Capital Upgrade and Capital Renewal .................................................... 34
Figure 11: Projected Asset Renewals – Including $2m DPTI funding ............................................................................ 35
Figure 12: Current Replacement Cost Forecast ............................................................... Error! Bookmark not defined.
Figure 13: Depreciation Forecast ...................................................................................... Error! Bookmark not defined.
Figure 14: Depreciated Replacement Cost Forecast ........................................................ Error! Bookmark not defined.

1. EXECUTIVE SUMMARY
This IAMP, Chapter 9, is to be read with IAMP Chapter 1 – General Statements.
1.1 The Purpose of the Plan
Refer Chapter 1 – General Statements.
This chapter covers the infrastructure assets that comprise a Transport network to enable safe and efficient travel on Kangaroo Island.
1.2 Asset Description
Assets included in this IAMP - Chapter 9, Transport are:1
Roads (Township, Rural and Access Roads2) Road Surfaces:
Sealed, Pavement, Sub-Pavement, Formation
Sheeted, Sub-Sheeted, Formation
Carparks2
Footpaths
Guard Rail fencing
Pram ramps
Signs
Walking Trails/Shared Use Paths
The Transport network has a total replacement value of $384,509,137.
1.3 What Does it Cost?
The key indicators of cost in providing levels of service used in this IAMP are lifecycle costs and maintenance and renewal expenditure.
Lifecycle Costs (Long Terms costs)
Lifecycle costs are the average costs that are required to sustain the service levels for the longest asset life. Lifecycle costs include maintenance and asset consumption (depreciation expense). Lifecycle expenditure is maintenance plus capital renewal expenditure.
1 In the previous iteration, cross drains, floodways, bridges and embankments were included under the Transport IAMP, they are now included within Chapter 8 – Stormwater.
2 In the previous iteration, carparks and access roads were included under the Reserve Furniture IAMP, they are now included within Chapter 9 - Transport

Table 1: Lifecycle Costs
Asset Category Average Annual
Lifecycle Cost
Average Lifecycle
Expenditure
Life Cycle Gap
Sustainability Index
Transport $4,656,254 $3,603,153 $1,053,101 77%
Planned Maintenance and Renewal Expenditure (Medium term costs)
The projected maintenance and capital renewal expenditure to deliver existing service levels for the period 2020 to 2029 versus Council’s planned maintenance and capital renewal expenditure is shown in the table below. Council currently receives $2,000,000 annually from DPTI for the renewal of high traffic volume unsealed roads. It is anticipated that this will continue until it is no longer required and as such this plan has been written assuming the funding will continue for the length of the plan. If this does not continue, the condition of the roads will deteriorate as funding from Council rates is not sufficient to maintain the entire network.
Table 2: Planned Maintenance and Renewal Expenditure
Asset Category
Total 10 Year Maintenance
& Capital Renewal
Expenditure
Average 10 Year
Maintenance & Capital Renewal
Planned Maintenance
& Capital Renewal
Expenditure (2018-19)
Average 10 Year Planned Maintenance
& Capital Renewal
Expenditure
Sustainability Index
Transport $36,031,526 $3,603,153 $3,512,362 $3,181,685 97%
For further information on financial indicators, refer to Section 6 of this Chapter of the Infrastructure and Asset Management Plan.
1.4 Plans for the Future
Refer Chapter 1 – General Statements.
In addition, Council plans to operate and maintain the CWMS network to achieve the following strategic outcome and objective from the Kangaroo Island Council Strategic Plan 2020-2024 (Kangaroo Island Council, 2020):
Infrastructure: A built environment focused on essential and community service o 1.1 Road and Assets: Develop and maintain our roads and physical assets to acceptable
standards
For further information on strategic actions, refer to section 3.2 of this Chapter of the Infrastructure Asset Management Plan.
1.5 Measuring our Performance
Refer Chapter 1 – General Statements.

1.5 The Next Steps
Refer Chapter 1 – General Statements.

2. INTRODUCTION
2.1 Background
This IAMP, Chapter 9, is to be read with IAMP Chapter 1 – General Statements.
This Chapter covers the assets involved with the Transport on Kangaroo Island and represents the asset base as at 30 June 2020.
2.1.1 Strategic Linkages
In addition to the documents listed in Chapter 1 – General Statements, this infrastructure and asset management plan has considered and is aligned with the following strategic and planning documents:-
2020 Transport Plan (Southern & Hills Local Government Association, 2015)
Inquiry Into the National Road Safety Strategy 2011-2020 (NRSS Inquiry Panel, 2018)
Kangaroo Island Council Roadside Vegetation Management Plan 2007 (Kangaroo Island Council, 2007)
Kangaroo Island Regional Transport Strategy (KI Regional Transport Strategy Steering Group, 2007)
Road Classification Guidelines In South Australia (Local Roads Advisory Committee for the Determination of Road Classification in South Australia, 2018)
Road Network Extension Policy (Kangaroo Island Council, 2014)
2.1.2 Infrastructure and Assets included in the plan
This infrastructure and asset management plan covers the following infrastructure assets:
Table 3: Assets Covered by the IAMP - Transport
Asset Category Dimension Unit Replacement
Value ($)
Roads 1341 km $375,536,326
Carparks 47 number $2,582,550
Footpaths 10439 metres $1,820,717
Guardrails 6445 metres $1,912,450
Walking Trails 18038 m2 $1,144,584
Pram Ramps 146 number $145,600
Signs 4538 number $1,366,910
TOTAL $384,509,137
2.2 Goals and Objectives of Asset Management
Refer Chapter 1 – General Statements.
2.3 Plan Framework
The key elements of this IAMP are:-

Levels of service specifies the services and levels of service to be provided by Council.
Future demand how this will impact on future service delivery and how this is to be met.
Life cycle management how Council will manage its existing and future assets to provide the required services.
Financial Summary what funds are required to provide the services.
Asset Management Practices what systems, standards and guidelines are utilised to maintain and further develop asset management practices.
Plan Improvement and Monitoring how the plan will be assessed to ensure it is meeting Council’s objectives.

3. LEVELS OF SERVICE
3.1 Customer Research and Expectations
Refer Chapter 1 – General Statements.
Of all Council’s assets, roads are considered the resident’s highest priority. This is reflected by the Residents Infrastructure priorities indicated through the resident surveys run by TOMM Kangaroo Island Committee and shown in Chapter 1 – General Statements.
The following figures show responses to the surveys run by TOMM Kangaroo Island Committee (TOMM Kangaroo Island Committee, 2019) that are specifically relevant to Transport.
Figure 1: Visitor satisfaction with quality of road signage
Figure 1 indicates a gradual improvement in visitor satisfaction with road signage, indicating that Council is doing well with road signage.
Figure 2: Visitor satisfaction with quality of roads
0%
10%
20%
30%
40%
50%
60%
70%
80%
90%
09/10 10/11 11/12 12/13 13/14 14/15 15/16 16/17 17/18 18/19% very satisfied %very satisfied/satisfied % very dissatisfied/dissatisfied
0%
10%
20%
30%
40%
50%
60%
70%
80%
09/10 10/11 11/12 12/13 13/14 14/15 15/16 16/17 17/18 18/19% very satisfied %very satisfied/satisfied % very dissatisfied/dissatisfied

Figure 2 shows that overall there has been an improvement with visitor satisfaction with the quality of roads, although there was a slight decrease in satisfaction in the latest survey. It demonstrates that Council is heading in the right direction with the work done over the past 10 years however this work needs to continue to ensure the ongoing improvement of our roads.
3.2 Strategic and Corporate Goals
Refer Chapter 1 – General Statements.
Council’s Strategic objectives and how these are addressed in this IAMP are summarised in Table 4.
Table 4: Strategic Goals and how they are addressed in this IAMP
Goal Objective How Goal and Objectives are addressed in this IAMP
A built environment focussed on essential
and Community services
Develop and maintain our roads and physical assets to acceptable standards
1.1.2 Secure at least $2M per annum Local Road Sustainability funding– included in the Improvement Plan.
1.1.3 Develop joint asset management plans with government agencies for roads and marine infrastructure.– included in the Improvement Plan.
1.1.4 Obtain funding to undertake a road safety audit and plan – to achieve national safety standards (including signage for all island roads).– included in the Improvement Plan.
Our environment is maintained, enhanced
and protected
Statutory requirements are met for animal, land and vegetation
management.
4.3.2 review and revise Council’s Roadside Vegetation Management Plan– included in the Improvement Plan.
In addition, Council’s Vision and Mission are addressed in this infrastructure and asset management plan by:
Road classifications and priority given to tourism and freight routes for capital renewal and programed maintenance.
Road upgrades to be done in line with Levels of Service and road classification criteria.
Undertake regular asset valuations, updates and annual review of depreciation rates. Annually review service levels of assets and condition ratings for each asset category.
3.3 Legislative Requirements
Refer Chapter 1 – General Statements.
3.4 Levels of Service
Refer Chapter 1 – General Statements.

3.4.1 Customer Values
Council’s Customer Values for Transport are set out in Table 5Table 6.
Table 5: Customer Values
Customer Values Customer
Satisfaction Measure Current Feedback
Expected Trend Based on Planned Budget
Roads – Safe and smooth driving
experience
Customer Complaints and TOMM survey
Significant number of complaints about road surfaces
Not anticipated to significantly change
Roads – Appropriate of sight
Customer Complaints Minimal number of complaints on
roadside vegetation Not anticipated to
significantly change
Roads – Clear and accurate signage
Customer Complaints Minimal number of complaints on
signs and line markings Not anticipated to
significantly change
Footpaths clear Customer Complaints Moderate number of complaints about hazards on footpaths and
walking trails
Not anticipated to significantly change
Sufficient pram/kerb ramps
Customer Complaints Minimal complaints relating to
pram/kerb ramps Not anticipated to
significantly change
Sufficient carparking Customer Complaints Minimal complaints relating to
quantity of carparks Not anticipated to
significantly change
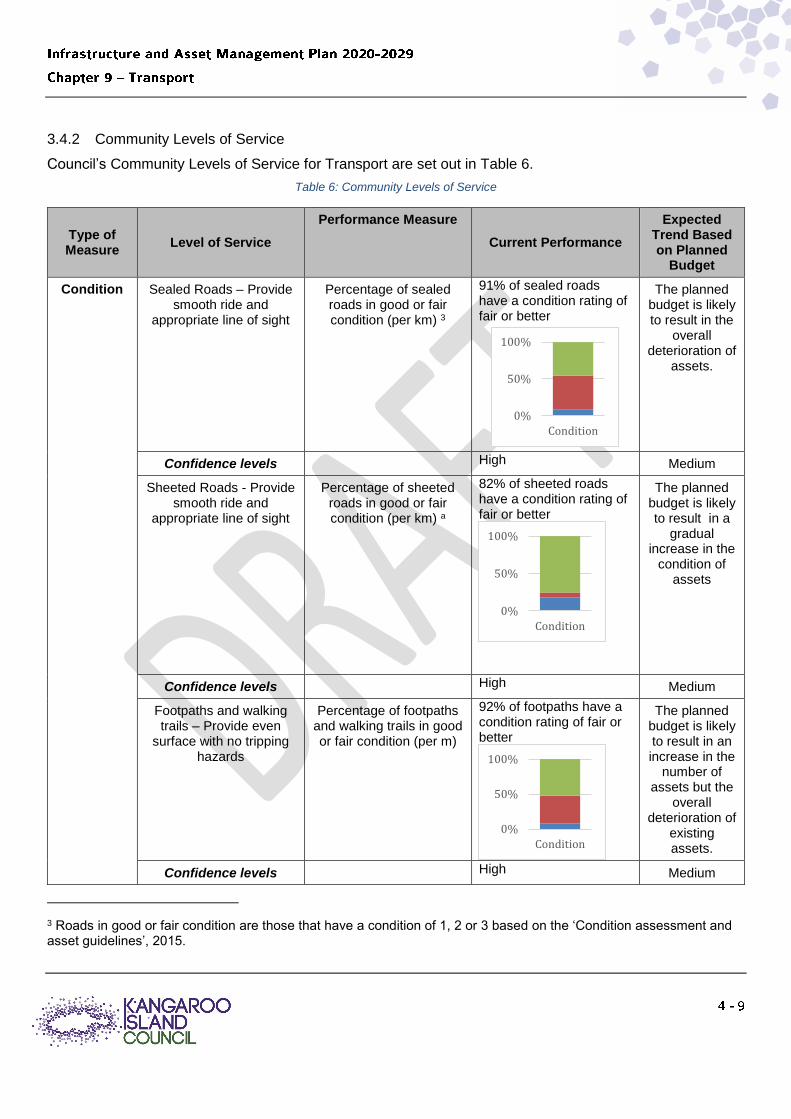
3.4.2 Community Levels of Service
Council’s Community Levels of Service for Transport are set out in Table 6.
Table 6: Community Levels of Service
Type of Measure
Level of Service
Performance Measure
Current Performance
Expected Trend Based on Planned
Budget
Condition Sealed Roads – Provide smooth ride and
appropriate line of sight
Percentage of sealed roads in good or fair condition (per km) 3
91% of sealed roads have a condition rating of fair or better
The planned budget is likely to result in the
overall deterioration of
assets.
Confidence levels High Medium
Sheeted Roads - Provide smooth ride and
appropriate line of sight
Percentage of sheeted roads in good or fair condition (per km) a
82% of sheeted roads have a condition rating of fair or better
The planned budget is likely to result in a
gradual increase in the
condition of assets
Confidence levels High Medium
Footpaths and walking trails – Provide even
surface with no tripping hazards
Percentage of footpaths and walking trails in good or fair condition (per m)
92% of footpaths have a condition rating of fair or better
The planned budget is likely to result in an increase in the
number of assets but the
overall deterioration of
existing assets.
Confidence levels High Medium
3 Roads in good or fair condition are those that have a condition of 1, 2 or 3 based on the ‘Condition assessment and asset guidelines’, 2015.
0%
50%
100%
Condition
0%
50%
100%
Condition
0%
50%
100%
Condition
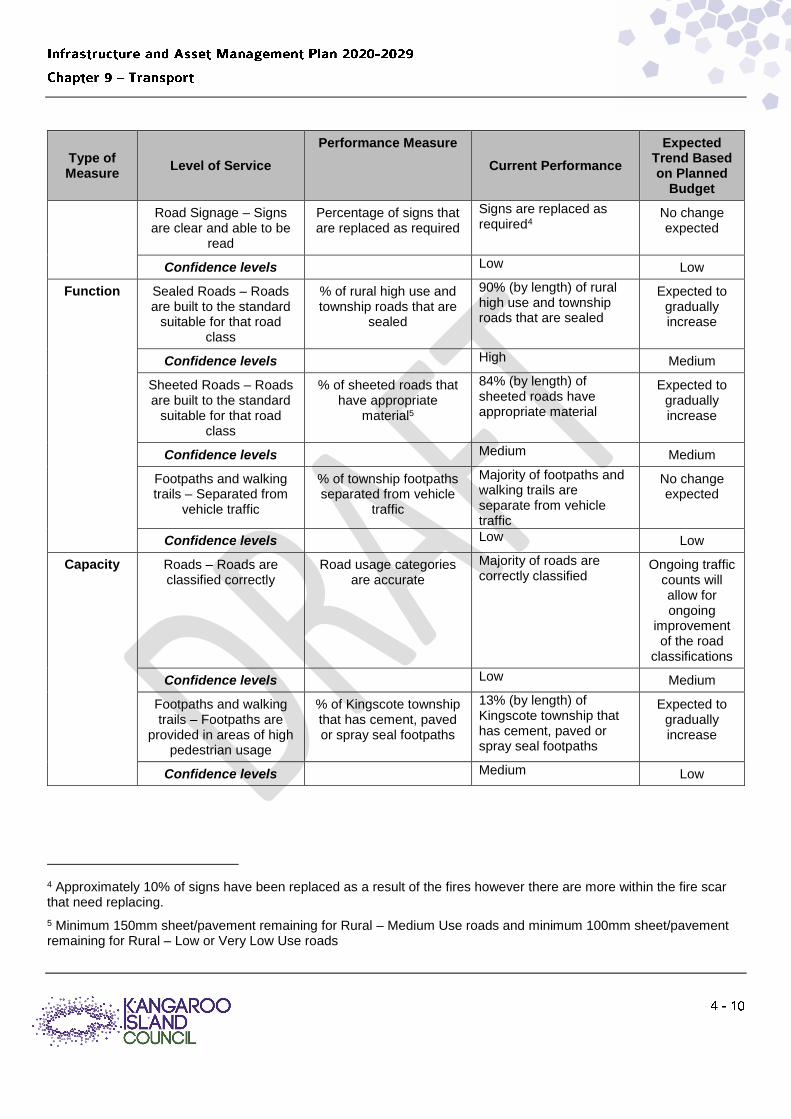
Type of Measure
Level of Service
Performance Measure
Current Performance
Expected Trend Based on Planned
Budget
Road Signage – Signs are clear and able to be
read
Percentage of signs that are replaced as required
Signs are replaced as required4
No change expected
Confidence levels Low Low
Function Sealed Roads – Roads are built to the standard
suitable for that road class
% of rural high use and township roads that are
sealed
90% (by length) of rural high use and township roads that are sealed
Expected to gradually increase
Confidence levels High Medium
Sheeted Roads – Roads are built to the standard
suitable for that road class
% of sheeted roads that have appropriate
material5
84% (by length) of sheeted roads have appropriate material
Expected to gradually increase
Confidence levels Medium Medium
Footpaths and walking trails – Separated from
vehicle traffic
% of township footpaths separated from vehicle
traffic
Majority of footpaths and walking trails are separate from vehicle traffic
No change expected
Confidence levels Low Low
Capacity Roads – Roads are classified correctly
Road usage categories are accurate
Majority of roads are correctly classified
Ongoing traffic counts will allow for ongoing
improvement of the road
classifications
Confidence levels Low Medium
Footpaths and walking trails – Footpaths are
provided in areas of high pedestrian usage
% of Kingscote township that has cement, paved or spray seal footpaths
13% (by length) of Kingscote township that has cement, paved or spray seal footpaths
Expected to gradually increase
Confidence levels Medium Low
4 Approximately 10% of signs have been replaced as a result of the fires however there are more within the fire scar that need replacing.
5 Minimum 150mm sheet/pavement remaining for Rural – Medium Use roads and minimum 100mm sheet/pavement remaining for Rural – Low or Very Low Use roads

3.4.3 Technical Levels of Service
Table 7: Technical Levels of Service
Lifecycle Activity Purpose of Activity Activity Measure Current
Performance6 Recommended Performance7
Acquisition Seal Township8 Roads
Budget allocation and forecast time
Budget allocation of $100,0009 per year means sealing of 100m of road per year will take 97
years
Ideally these roads should be sealed within 15 years –
resulting in $482,00010 per year however plan has
been set for $150,000 per year
Seal Rural High Use Roads
Budget allocation and forecast time
$1,200,000 for two years, no allocation
after that
No intention to seal remaining roads at
this point
Sheet existing roads that are unsheeted
Budget allocation and forecast time
No budget currently allocated
No budget unless Council position
changes.
Kingscote Town Centre to have
Concrete/Paved footpaths and remainder of
Kingscote to have bitumen sealed
footpaths
Budget allocation and forecast time
Budget allocation of $200,000 for one
year
$50,000 per year following means Kingscote Town
Centre completed in 11 years.
This to continue for the period to start on
the remainder of Kingscote
Budget $2,580,375 Total for the 10 years
$4,704,875 Total for the 10 years
Operation and maintenance
Streets are clean Street sweeping frequency
Ad hoc as required 4 times/year for Kingscote Town Centre
2 times a year for other township roads. Cost unknown thus will retain current budget
6 Current activities related to Planned Budget.
7 Forecast required performance related to forecast lifecycle costs.
8 Township roads covers existing made roads within Kingscote, Parndana, Penneshaw and American River.
9 $25,000 of this is allocated per year for kerbing. This needs to be moved to the Stormwater AMP in a future revision.
10 This cost does not include stormwater kerbing and pipes.

Lifecycle Activity Purpose of Activity Activity Measure Current
Performance6 Recommended Performance7
Vegetation clearance
Vegetation clearance maintained as per
Roadside Vegetation Management Plan
Budget is sufficient to cover current
vegetation clearing requirements but no data to ensure this
Develop vegetation condition assessment process to allow for better scheduling of vegetation clearance. Once off cost.
Sheeted roads maintained in suitable condition
Frequency of grading roads
Medium use roads – 4 times per year
Low use roads –3 times per year
Very Low use roads – once per year
Better schedule the grading schedule to suit the road material and condition. No change to budget at this stage.
Roads - Existing infrastructure maintained to suitable condition
Reactive service requests are
assessed and completed within
adopted timeframes
As no timeframes adopted, unable to accurately monitor current performance
Develop standard for responding to reactive service requests. No change to budget at this stage.
Footpaths and walking trails have clear access.
Frequency of routine maintenance (vegetation
clearance – 2.5m height clearance for
width of path, ant treatment, erosion, grass clearance)
Maintenance currently conducted in response to customer requests or staff observations
Quarterly inspections with scheduled maintenance.
Budget $21,711,552 Total for the 10 years
$24,217,032 Total for the 10 years
Renewal Sealed roads Sealed roads are renewed as due
Resealing 7km per year, results in 37 years between reseals
Resealing should occur when due (average 20 years between reseals)
Sealed Roads Pavement renewed as due
No budget currently allocated to this
Renewal of pavement should occur when due to avoid need for complete road reconstruction if left too long.
Sheeted Roads Sealed roads are renewed as due
Resheeting 25km of road annually, means over 40 years between resheets.
Renewal should occur when due (average 25 years between resheeting)

Lifecycle Activity Purpose of Activity Activity Measure Current
Performance6 Recommended Performance7
Low use roads not being renewed.
Footpaths Footpaths renewed as required
No budget currently allocated for renewal of footpaths
Renewal should occur when due
Guardrails Guardrails renewed as required
No budget currently allocated for renewal of footpaths
Renewal should occur when due
Budget $31,442,000 Total for the 10 years
$35,656,672 Total for the 10 years f
Disposal Disposal of assets no longer in use
Disposal of assets as per the IAMP
No disposals planned
No disposals planned
Budget $0 total for the 10 years
$0 total for the 10 years

4. FUTURE DEMAND
4.1 Demand Drivers and Forecast
Refer Chapter 1 – General Statements.
4.2 Climate Change
Refer Chapter 1 – General Statements.
The Climate Change Adaptation Plan (Resilient Hills and Coasts, 2016) also had a number of adaptation options that related specifically to transport.
Table 8: Climate Change Adaptation Plan Actions
Adaptation Options Timeframe Council comment/action
Management of the condition of sealed and unsealed roads in the face of altered climate change conditions such as increasing rainfall intensity and seal level rise, as well as increasing use
Identify points of vulnerability in the road network
Now – 2026 The mapping tool from the Coastal Hazards Mapping Project could be used to assist with this identification. Flood mapping has not been scheduled at this stage.
Investigate internal capacity building regarding the impacts of climate change on assets and procurement
Now – ongoing Council currently investigating this through a Climate Change Adaptation Governance Assessment.
Incorporate design allowances for increases in extreme events
2021 - ongoing When transport upgrades or renewals occur, designs will need to give consideration to factors such as increased rainfall and storm surges to determine if raised road levels, increased drainage or stormwater management are required. Any increase in costs to complete these works will result in less upgrades occurring for the allocated budget.
Seal currently unsealed roads to protect against stormwater damage
2021 - ongoing The extent to which this is done is limited by budget restraints. Refer to the Technical Levels of Service for more information.
More frequent bitumen resealing and use of alternate road sealing surfaces
2026 – ongoing The extent to which this is done is limited by budget restraints. Refer to the Technical Levels of Service for more information.
Develop strategic water and freight points across the Island
2026 – ongoing The prioritisation of rural road upgrades relates to the road classifications, traffic counts and knowledge of freight routes with the aim to create traffic corridors around the Island.
Develop alternate entry and exit points on farms
2026 – ongoing This would be led by farm owners however should be done in consultation with Council to ensure consideration is given to the road classifications.

4.3 Legislation change
There are no anticipated legislation changes that will impact on Transport at the present time.
4.4 Changes in Technology
Technology changes are forecast to have little impact on the delivery of services covered by this Transport Infrastructure and Asset Management Plan.
Some of the potential technology changes include:
Greater use of in-situ recycling of pavement materials
Greater use of recycled materials
Introduction of synthetic binders for road surfacing treatment, as a result of crude oil shortages and bitumen products
Council previously contracted Tonkins to complete a study on pavement material and stabilisations. At this stage, resheeting is the most cost effective method for maintaining roads.
4.5 Demand Management Plan
Demand for new services will be managed through a combination of managing existing assets, upgrading assets where required and providing new assets to meet demand. Demand management practices include non-asset solutions, insuring against risk and managing failures.
Demand impacts and opportunities identified to date for demand management are shown in Table 9.
Table 9: Demand Management Plan
Demand factor Projection Impact on services
Aging population
Increase in median age (currently 46)
Increase in need for good quality roads and footpaths in townships to allow for elderly mobility
Continue with staged upgrades of township roads and upgrade of footpaths within Kingscote that are controlled and not reactive in accordance with Council’s Levels of Service and Council’s road classification criteria and Council’s Pedestrian Generator Plan for Townships.
Develop Pedestrian Generator Plan for townships to assist with prioritisation of footpaths.
Population density
Increase in people wanting to live in remote areas
Increase in requests for unsealed roads to be upgraded and unmade road reserves to be opened up due to sale of land zoned for rural living/housing.
Monitor road usage and review use classifications and road prioritisation
Application of the Road Network Extension Policy

Demand factor Projection Impact on services
Agricultural practices
Growth in bulk production and potential for new sectors (ie timber, potatoes)
Potential for shift in the major routes used and increase in use of B-double configuration freight vehicles / request for upgrade of existing rural roads to meet increased traffic volumes and/or change in usage (ie Freight Route).
Monitor agricultural practises and road usage through ongoing traffic counts
Continue to review road use classifications and roads prioritised for upgrade
Application of the Road Network Extension Policy
Changes to tourism as a result of the 2019/20 bushfires
Increase in tourists visiting the Eastern End of island
Increase in requests to upgrade roads on Eastern End of the Island
Continue to review road use classifications and roads prioritised for upgrade
4.6 New Assets from Growth
The new assets required to meet growth and community expectations will be acquired from land developments and constructed by Council.
As per Council’s Road Network Extension Policy “Council will not develop and construct new road nor upgrade an existing road unless the associated construction or upgrade costs are fully borne by the Applicant/s – or – the construction or upgrade is undertaken with the assistance of a significant financial co-contribution provided by the Applicant/s, they having proven the construction or upgrade is warranted within the Kangaroo Island Strategic Management Plan and, subsequently, having any related costs included in the current budget.”
Based on the recommended technical levels of service the following new assets are considered in the forecast costs:
Seal of Township11 roads within 15 years
Seal Rural High Use roads within 10 years
Kingscote Town Centre to have Concrete/Paved footpaths within 10 years and remainder of Kingscote to have bitumen sealed footpaths
The costs associated with these projects and the comparison to the proposed budget are discussed in section 5.5.
11 Township roads covers existing made roads within Kingscote, Parndana, Penneshaw and American River.

5. LIFECYCLE MANAGEMENT PLAN
The lifecycle management plan details how Council plans to manage and operate the assets at the agreed service levels while optimising lifecycle costs.
5.1 Background Data
5.1.1 Physical Parameters
The assets covered by this infrastructure asset management plan are shown in Table 10 below:
Table 10: Physical Parameters, including age profile
Asset Category Quantity12 Unit Useful Life
(years) Average Age
(years)
Roads 1341 km
Formation Earthworks 1341 250 N/A
Sub-Pavement / Sub-Sheet 1259 250 N/A
Sheeted Surface 1080 km 15-30 Good
Sealed Surface 261 km
Pavement 261 km 18-40 Average
Seal 268 km 80-100 Good
Carparks
Formation Earthworks 47 No. 400 N/A
Sheeted Surface 35 No. 20 Average
Sealed Surface
Pavement 12 No. 30 Average
Seal 12 No. 100 Good
Footpaths 10439 metres
Concrete 4312 metres 50 Good
Paved 83 metres 50 Good
Spray Seal 2064 metres 25 Good
Mixed surface 11 metres 50 Average
Guard Rails 6444.5 metres 50
Box Beam 25 metres 50 N/A
12 Intersections are not counted separately. For T junctions, it is assumed that the main length of the secondary road starts at the edge of the main road, thus there is no double counting of length. For cross roads, there will be some double counting of length. There are approximately 45 rural cross roads and 25 township cross roads resulting in a double counting of 700m which is considered minor given the overall network length of over 1,300km.

Asset Category Quantity12 Unit Useful Life
(years) Average Age
(years)
Steel Tube 384 metres 50 N/A
W-Beam 6035.5 metres 50 N/A
Walking Trails 18038 m2
Base Course 18038 m2 100 Excellent
Spray Seal 12134 m2 30 Excellent
Pram Ramps 146 No.
Standard Design 72 No. 50 Excellent
Narrow design 74 No. 50 Good
Signs (regulatory) 4538 No. 20 N/A
5.1.1.1 Service level hierarchy
An initial road hierarchy was established in 2010 based on Managing Unsealed Roads in South Australia (TRB, 1993). Road reclassification projects were undertaken in 2015 and 2019.
According to the Road Classification Guidelines in South Australia, all roads on Kangaroo Island would be considered Rural Roads, with the potential for them being either Rural Arterial Roads or Rural Local Roads. Rural Arterial Roads are those roads
That have a main function of forming the principal avenue of connection for movements:
o Between Capital Cities, key towns and Important Centres or
o The National Land transport network, Major traffic routes or Freight Routes or Major Local
Freight Routes
o Currently classed as Class 1 and Class 2 Roads
o To major tourist locations
That facilitate A-Double, B-Double, Performance Based Standards (PBS) or General Access heavy
vehicle movements, with volumes in the order of 50 or more vehicles per day, not local in nature (ie
through traffic)
That carry in the order of 300 vehicles or more per day (Annual Average Daily Traffic) of which a
significant proportion are not local in nature (ie through traffic)
This means that the majority of roads on Kangaroo Island would be classed as Rural Local Roads. This does not sufficiently distinguish between the different types of roads on Kangaroo Island.
The table below outlines the road classifications, the criteria for determining the classification and the service level objective.
Service hierarchy for transport assets other that roads have not yet been developed.

Table 11: Transport Asset Service Hierarchy
Service Hierarchy Description Service Level Objective
Township Roads13
High use >800 vpd14 Sealed15 with kerbing16
Medium use 100-800 vpd Sealed with kerbing
Low use <100 vpd Sealed with kerbing
Rural Roads
High use >100vpd or >10
heavy vpd
Sealed17
Medium use 50-100 vpd or 5-10 heavy vpd
Sheeted18 - 100mm base course, 150mm sub-base, graded 4 times per year19
Low use 25-50 vpd Sheeted - 100mm base course, 100mm sub-base, graded 3 times per year
Very low use <25 vpd Sheeted - 150mm compacted quarry rubble, graded once per year
Footpaths, walking trails, guardrails, carparks and pram/kerb ramps
To be developed in future iterations of this IAMP
13 This only includes Kingscote, Penneshaw, Parndana and American River Roads – all others are counted as rural roads. Some roads that are outside the Kingscote Township boundary have been counted as Township roads.
14 The vehicle counts provide an indication of the appropriate usage category however seasonal change in traffic counts can make this difficult. Council will take other factors into consideration when determining final road usage categories. For example creating travel corridors.
15 Roads that have earthworks to form the sub grade, topped with pavement (preferably 2 layers of crushed /processed road making base material) and sealed with spray seal, ac hot mix seal or brick paving. Some older roads may only have 1 layer of pavement.
16 Aim is for all township roads to eventually be sealed with kerbing, however priority is given to higher use roads.
17 “As a rough guide, it may be difficult to economically justify sealing a road carrying less than 100 vpd, whereas if it is carrying over 250 vpd it will probably be justified. In between these values is the ‘grey area’ where an economic assessment ………….. should be carried out to help make the decision when to seal (McLean 1997). When social benefits are taken into account, such as reducing dust emissions, these threshold traffic levels could be much lower.” (ARRB (Australian Road Research Board), 2009).
18 Roads that have earthworks to form the sub grade, a pavement layer and are topped with a sheeted surface (same material as that used for a pavement in Sealed roads). Some older roads may not have a layer of pavement. Also referred to as Unsealed Roads.
19 The quality and thickness of the material used for the sheeting, pavement and sealing is determined based on a number of factors including predicted usage and the geotechnical qualities of the sub grade and proposed sheet/pavement.

In some circumstances, a road may have been built to a standard higher than the minimum standard. In these cases, maintenance of these roads will generally be reflective of is actual service level objective.
There may also be roads within a classification that currently do not meet the service level objective. These roads will be monitored for vehicle counts to confirm classification and if warranted, included on the plan for future upgrades.
The asset database reflects the actual construction of the road rather than the service level objective and includes roads that are formed only20, access roads or unmade/natural formation21 – accessible or inaccessible.
For more information refer to the Appendices:
• Appendix B for Transport Rules for Finance and AssetFinda • Appendix D for Maps showing the Road Classifications and the Road Surfaces • Appendix E for road classifications cross section standard drawings
5.1.1.2 Traffic Counters
Traffic counters are used to capture actual traffic count numbers, speed and vehicle class types (i.e. Class 1 standard short vehicles or cars through to Class 10 B-Double or heavy truck and trailer). They can be used to trigger a reclassification if the actual traffic count is higher or lower than previously thought.
5.1.2 Asset Capacity and Performance
Council’s services are generally provided to meet design standards where these are available.
Asset components where deficiencies in service performance are known are detailed in Table 12.
Table 12: Service Deficiencies
Asset component Service Deficiency Council Comment
Footpaths in Kingscote
Poor footpath surface conditions with old spray seals and crusher dust footpaths providing uneven surfaces with little traction.
This IAMP outlines an ongoing program for the upgrade of footpaths focussing on high use areas within townships.
The plan also includes a forecast of renewals due.
Road pavement Older township roads were built with minimum pavement, not consistent with current standards
With the current traffic volumes the roads are still operational. If the road were to fail or the road upgraded for another reason, it would be built to standard.
Road intersections
Intersections between Sheeted and Sealed roads, sheeted road spilling gravel onto sealed carriageway which may result in vehicles losing control.
Council has been sealing the 30m approach of sheeted roads when they intersect with sealed roads. This will continue as funding is available.
20 Roads that have earthworks to form the sub grade with no additional material on top but the road corridor may have been widened, vegetation cleared and the road formed to shape.
21 Existing natural land and vegetation

Asset component Service Deficiency Council Comment
Road surface Approaches to bridges and on gullies, the surfacing is potholing
Council will consider sealing over bridges as would also protect the bridge deck. The cost for this has not been included within this IAMP.
Road corridor Roadside vegetation encroaching on road carriageways limiting line of site and providing no visibility of wildlife and/or driveways
This is addressed through the ongoing vegetation management program.
The above service deficiencies have been identified through the data collection process, review of notifications and discussions with Council Staff.
5.1.3 Asset Condition
Refer to Chapter 1 – General Statements for Asset Condition Rating System.
Transport Assets are replaced based on condition rather than age. The condition of transport assets are currently monitored every five years based on the following criteria:
• Sealed Roads and carparks: overall visual seal condition score with consideration given to oxidation, stripping and flushing and overall visual pavement condition score with consideration given to rutting, crocodile cracking and shape.
• Sheeted roads and carparks: depth score and visual score with consideration given to corrugations, potholes and loss of material
• Footpaths and walking trails: overall visual condition score with consideration given to trip hazards, service development trenches and gaps
• Guardrails: overall visual condition score • Pram/kerb ramps and Signs: no condition assessment.
The following graphs show condition of transport assets inspected during the last revaluation.
Figure 3: Asset Condition - Sealed Roads
Figure 4: Asset Condition - Sheeted Roads
The average useful life for pavements is between 80 to 100 years with seals lasting between 18 to 40 years in depending on traffic volumes. As such
The condition of sheeted roads is generally very good due to the DPTI $2 million. Provided this
16%
35%41%
8%
0%
Very Good
Good
Average
Poor
Very Poor
63%12%
7%
6%
12%Very Good
Good
Average
Poor
Very Poor

roads would be re-sealed two to three times before the pavement needs to be renewed with a new seal.
As can be seen from the charts above, seals are generally in good condition however this is an area that will require work during this IAMP as many will be due for renewal at a similar time.
In addition, the renewal of pavements will be an upcoming significant cost however it falls outside the forecast for this infrastructure and asset management plan.
continues, sheeted roads will continue to maintain their standard.
Figure 5: Asset Condition - Carparks
Carparks are generally in good condition with reasonable maintenance required to ensure they meet their intended useful life.
Figure 6: Asset Condition - Footpaths
Footpaths are generally in good condition with reasonable maintenance required to ensure they meet their intended useful life.
Walking trails were not inspected as these are all relatively new and known to be in good to very good condition. Age of the guardrails is currently used for determining replacement as unless there is an accident, it is a good indication of condition.
5.1.4 Asset Valuation
The value of Transport assets as at 30 June 2020 covered by this infrastructure and asset management plan is summarised below in Table 13. Assets are valued at brownfield rates.
5%
59%
27%
9%
0%
Very Good
Good
Average
Poor
Very Poor
33%
19%
40%
8%
0%
Very Good
Good
Average
Poor
Very Poor

Table 13: Valuation Summary as at 30 June 2020
Asset Class Current Replacement Cost (CRC)
Depreciable Amount
Accumulated Depreciation
Carrying Amount (WDV)
Annual Depreciation
Roads
Formation Earthworks $280,893,073 $0 $0 $280,893,073 $0
Sub-Pavement / Sub-Sheet
$42,576,193 $0 $0 $42,576,193 $0
Pavement (under seal) $10,893,868 $10,893,868 $2,905,888 $7,987,979 $133,433
Sheeted Road $29,849,402 $29,849,402 $7,941,559 $21,907,842 $1,237,947
Brick Paved Road $9,671 $9,671 $0 $9,671 $484
Sealed Road $11,292,360 $11,292,360 $5,539,479 $5,752,881 $535,828
Linemarking $21,760 $21,760 $0 $21,760 $1,088
Roads Total $375,536,326 $52,067,060 $16,386,926 $359,149,400 $1,908,780
Carparks
Formation Earthworks $1,199,415 $0 $0 $1,199,415 $0
Pavement (under seal) $321,510 $321,510 $124,353 $197,157 $3,215
Sheeted Surface $877,905 $877,905 $442,567 $435,338 $43,895
Sealed Surface $183,720 $183,720 $92,009 $91,711 $6,124
Carparks Total $2,582,550 $1,383,135 $658,929 $1,923,621 $53,234
Footpaths
Concrete $694,680 $694,680 $281,167 $413,513 $13,894
Paved $36,643 $36,643 $14,291 $22,352 $733
Spray Seal $556,780 $556,780 $199,108 $357,672 $11,136
Mixed surface $532,615 $532,615 $325,004 $207,611 $21,305
Footpaths Total $1,820,717 $1,820,717 $819,569 $1,001,148 $47,067
Guardrails
Box Beam $25,000 $25,000 $42 $24,958 $500
Steel Tube $76,800 $76,800 $72,912 $3,888 $168
W-Beam $1,810,650 $1,810,650 $561,614 $1,249,037 $35,484
Guardrails Total $1,912,450 $1,912,450 $634,567 $1,277,883 $36,152
Walking Trails
Base Course $901,900 $901,900 $171,361 $730,539 $9,019
Spray Seal $242,684 $242,684 $46,514 $196,170 $8,089
Walking Trails Total $1,144,584 $1,144,584 $217,875 $926,709 $17,108
Pram Ramps Trails

Asset Class Current Replacement Cost (CRC)
Depreciable Amount
Accumulated Depreciation
Carrying Amount (WDV)
Annual Depreciation
Standard Design $86,400 $0 $0 $86,400 $0
Narrow Design $59,200 $0 $0 $59,200 $0
Pram Ramps Total $145,600 $0 $0 $145,600 $0
Signs $1,366,910 $0 $0 $1,366,910 $0
Transport Asset Total $384,509,137 $58,327,946 $18,717,867 $365,791,270 $2,062,342
5.1.5 Measures of asset consumption, renewal and upgrade
Asset Sustainability Ratio
Capital Renewal Expenditure 2020/215 = Depreciation Expense 2020/21 =
Therefore Asset Sustainability Ratio =
Including $2m DPTI funding
$ 3,475,000 $ 2,070,211
168%
Council’s target is that this ratio should be greater than 90% and less than 110% over a rolling 3 year period. The high ratio relates to the lower layers of roads not being depreciated and indicates that under the current budget, assets are being renewed appropriately.
Asset Consumption Ratio
Depreciated Replacement Cost 2020/21 = $ 365,193,934 Current Replacement Cost 2020/21 = $ 385,982,012
Therefore Asset Consumption Ratio = 95%
Council’s target is that this ratio should be greater than 40% and less than 80%. This ratio is indicative of the significant amount of lower layers not being depreciated.
Asset Renewal Funding Ratio
IAMP projected 10 year expenditure = LTFP projected 10 year expenditure =
Therefore Asset Renewal Funding Ratio =
Including $2m DPTI funding
$ 35,656,672 $ 31,442,000
88%
This indicates that there is general alignment with the total budgets of this IAMP and the LTFP however further work needs to be done to more accurately align the costs with the correct asset categories and take into account any restrictions on the use of grant funding.
5.2 Risk Management Plan
Refer Chapter 1 – General Statements.

Risk management assessments in previous plans identified a number of critical risks. Work has been undertaken to address some/all of these risks as summarised in Table 14.
Table 14: Risk Assessment Summary
Service or Asset at Risk
What can happen Risk Rating
Risk treatment Plan Residual risk
Treatment Costs
Road Funding Insufficient funding to maintain / renew / upgrade the existing road network (due to total kms of road vs number of ratepayers).
High Continue to lobby to get $2.5 million annual funding.
Develop more robust asset management plan for roads that clearly shows how road would need to be managed both with and without the $2.5 million annual funding.
Review road classifications and service levels (can they be lowered/reduced).
Medium
High22
High22
Existing salaries
Existing salaries
Existing salaries
Road infrastructure
Increase in frequency and intensity of climate change events - ie rainfall resulting in flooding of roads/washing roads away; storm surges damaging coastal roads, fire damaging roads.
High Identify areas at risk of flooding/storm surge and determine if levee banks or road design change required.
Construct levee banks and upgrade roads as identified through research.
Maintain stormwater cross drains/ensure suitable capacity.
High23
Medium
Medium
$15,000
Unknown
Included in Stormwater IAMP
Road Surface – Unsealed Roads
Surface degredation and decreased level of service (ie loose material and corrugations that can cause loss of traction and/or tyre blow outs) due to insufficient grading or poor quality material.
High Ensure regular patrol grading undertaken and review grading actually occurring and road surfaces to better plan/schedule future grading requirements.
Ensure new unsealed roads or renewal of roads constructed to our standards (including material used meets quality assurance standards and road cross section meets design criteria).
Prioritise and schedule renewals based on condition and road classification
Medium if all implemented
Within existing salaries
Unknown but incorporated into road costs
Within existing salaries
22 While these do not reduce the risk rating due to the amount of money involved, they are still important to action to assist with both Council understanding of the impacts and demonstrating the need for the funding to the Government.
23 Doesn't reduce risk but needs to be done prior to implementing the action which would reduce the risk.

Service or Asset at Risk
What can happen Risk Rating
Risk treatment Plan Residual risk
Treatment Costs
Road surface and signage
Accidents due to visitors not being familiar with local conditions, driving on wrong side of road, multiple signs with varying designs and drivers not being able to read English
High Continue working with the Road Safety Committee on signage around the island.
Continue working with Sealink on driver education for tourists not used to unsealed roads.
Ensure signage meeds Australian Standards - ongoing signage review.
High24 Within existing salaries
Within existing salaries
Within existing maintenance budget
Road signage Warning signage not meeting with Australian Standards due to age of infrastructure and not having been replaced/upgraded
High Rolling capital replacement program. Medium Within existing maintenance budget
Roads Complaints from residents and visitors as to the quality of the roads
High Ongoing communication with residents as to which roads upgraded, why not grading in summer, road use classifications, cost of upgrades. As above re: Road safety Committee and Sealink
Medium Within existing salaries and communication budget
Road Surface - Unsealed Roads
Accident due to newly constructed road has slippery surface due to weather, poor drainage and suitability of materials used in construction
High Ensure new unsealed roads or renewal of roads constructed to our standards (including material used meets quality assurance standards and road cross section meets design criteria).
High24 Unknown but incorporated into road costs
Roadside vegetation
Accident resulting from overgrowth of vegetation reduces width of transport corridor and decreases line of sight
High Manage roadside vegetation as per approved Roadside Vegetation Management Plan
High24 $290,000 annually (within existing maintenance budget)
Footpaths and Walking Trails
Tripping due to uneven surface, presence of weeds
High Implement maintenance plan including spraying.
Medium if all implemented
Within existing maintenance budget.
24 Risk will always be high due to potential for fatality in consequence however these actions will lower the likelihood.

Service or Asset at Risk
What can happen Risk Rating
Risk treatment Plan Residual risk
Treatment Costs
Respond to and action customer complaints re: hazards.
Undertake condition inspections on footpaths (every 5 years)
Within existing maintenance budget.
Within 5 yearly transport revaluation.
Guardrails Vehicles falling from road
High Undertake condition assessment on guardrails (every 5 years).
Prioritise and schedule guardrail renewal based on the condition assessment.
High24 Included in transport revaluation every 5 years.
To build into renewal and capital works based on outcome of assessment.
Roads - Sealed roads
Vehicle accidents due to road surface conditions
High Undertake condition assessments on roads (every 5 years).
Prepare and implement 5-10 year road renewal program.
Prioritise and schedule renewals based on condition and road classification
High24 Within 5 yearly transport revaluation.
Existing salaries
Existing salaries
Renewals Delay in renewals results in additional deterioration of sub layers (ie pavement under seal)
High Reassess condition of assets.
Investigate options for funding renewal of assets that this may impact on.
Medium Within existing budget
Existing salaries
5.3 Maintenance Plan
5.3.1 Maintenance Types
Refer Chapter 1 – General Statements.
Typical reactive road maintenance activities include pothole repair, repair of edge breaks, reinstatement and repair of large sealed pavement failure, crack sealing, repair of seal failure in pavement, removal of loose gravel, fixing faded or missing lines, vegetation maintenance, roadside furniture, repair of broken kerb and shoulder maintenance.
Typical programmed road maintenance include road grading and linemarking which are moth undertaken on a cycle basis.

5.3.2 Maintenance Arrangements
The following is a summary of maintenance arrangements:
Council uses its own workforce in conjunction with contractors to undertake the necessary works on the road and footpath network
Street cleaning will be completed by contractors.
5.3.3 Standards and Specifications
Maintenance work is undertaken in accordance with the following Standards and Specifications:
Training Certificate 3 in Civil Construction
Pipe Laying in accordance with Cement & Concrete Association Standards
Signage in accordance with AS1742
ARRB Sealed and Unsealed Local Roads Manuals
5.3.4 Maintenance Expenditure Patterns
Previous Maintenance expenditure is shown in Table 15.
Table 15: Historic Maintenance Expenditure
2015/16 2016/17 2017/18 2018/19 2019/20 2020/21 Budget
Car Parks $44,229 $19,234 $16,618 $24,486 $20,032 $37,362
Footpaths & Walking Trails $102,038 $49,237 $45,147 $51,561 $98,350 $120,967
Roads - sealed $433,876 $444,812 $503,237 $328,104 $346,492 $336,373
Roads - unsealed $675,095 $735,253 $613,935 $673,526 $769,834 $717,104
Roads - vegetation $420,514 $228,878 $289,797 $248,757 $230,488 $287,831
Roads - patrol grading $473,827 $545,789 $563,259 $639,342 $636,779 $577,126
Street Cleaning $13,040 $22,015 $15,690 $12,909 $11,525 $17,261
Traffic Control (signage) $121,053 $68,993 $78,801 $86,190 $97,132 $77,132
TOTAL $2,283,672 $2,114,211 $2,126,485 $2,064,875 $2,210,631 $2,171,155
The figures above exclude depreciation and finance costs (ie interest on loans).25
5.3.5 Future Maintenance Expenditure
Maintenance expenditure projections for the next ten years are detailed in Figure 7.
25 Note: In the previous iteration of this document, full cost allocation was also excluded. This has now been included.

Figure 7: Maintenance Expenditure Projections
5.4 Renewal Plan
Refer Chapter 1 – General Statements.
5.4.1 Renewal Priority
Refer Chapter 1 – General Statements.
The priority ranking criteria for Transport is detailed in Table 16.
$-
$500,000
$1,000,000
$1,500,000
$2,000,000
$2,500,000
Traffic Control (signage)
Street Cleaning
Roads - patrol grading
Roads - vegetation
Roads - unsealed
Roads - sealed
Footpaths and Walking Trails
Car Parks
Budget

Table 16: Renewal Priority Ranking Criteria
Criteria Weighting
Condition No weighting. Assets initially on renewal date which is based on
condition 26
Hierarchy Classification High use 5 Medium use 4 Low use 3 Very low use 2
50%
Function Classification27 Freight Regional Freight Route 5 Local Freight Route 3 Seasonal Freight Route 1
Tourism Regional Tourism Route 5 Local Tourism Route 3 Seasonal Tourism Route 1
Local Access Very high access (links townships) 5 High access (greater than 10 dwellings) 4 Medium access (between 5 – 10 dwellings) 3 Low access (less than 5 dwellings) 2
School Bus Route 3
20%
Risk Management & Safety Very High Risk 5 High Risk 4 Medium risk 2 Low risk 0
20%
Economic Development Priority Future development planned 5 Medium development potential 3 Low development potential 2 No development potential 0
10%
TOTAL 100%
5.4.2 Renewal Standards
Renewal work is carried out in accordance with the following Standards and Specifications:
Training Certificate III in Civil Construction
Pipe Laying in accordance with Cement & Concrete Association Standards
26 This approach is used due to the significant number of transport assets due for renewal that fall into this category.
27 Use the highest applicable number

Signage in accordance with AS1742
ARRB Sealed and Unsealed Local Roads Manuals
Footpath Development Policy
5.4.3 Summary of future renewal expenditure
Projected future renewal expenditure is summarised below in Figure 8.
Figure 8: Projected Renewal Expenditure
5.4.4 Renewal Back log
The revaluation process and associated condition inspections has recalculated renewal of transport assets going forward based on condition. As such there is no backlog as all assets have been programmed into future works.
5.4.5 Renewal Projection
A detailed listing of transport renewals is provided in Appendix F. Due to the significant peaks in expenses, an average cost of renewal of roads has been allocated per year - $1,000,000 for sealed roads and $2,500,000 for sheeted roads. Any other renewals due during the timeframe of this IAMP have then been included in the relevant year.
In setting the plan, the following things have been taken into consideration:
Road segments (approximately 2km in length) will be identified as requiring renewal in the asset data however it is not always practical and cost effective to only do segments across the island. Instead a whole of road of approach is preferred when looking at the road network strategically over the next 10 years.
2020/21
2021/22
2022/23
2023/24
2024/25
2025/26
2026/27
2027/28
2028/29
2029/30
Guardrails $- $104,850 $- $- $- $- $- $- $- $-
Footpaths $- $- $- $- $85,267 $- $- $- $- $-
Carparks $- $- $- $150,500 $- $- $- $- $- $251,055
Roads - DPTI Resheeting $2,800,0 $2,000,0 $2,000,0 $2,000,0 $2,000,0 $2,000,0 $2,000,0 $2,000,0 $2,000,0 $2,000,0
Roads - Resheeting $430,000 $500,000 $500,000 $500,000 $500,000 $500,000 $500,000 $500,000 $500,000 $500,000
Roads - Resealing $335,000 $1,000,0 $1,000,0 $1,000,0 $1,000,0 $1,000,0 $1,000,0 $1,000,0 $1,000,0 $1,000,0
Budget $3,475,0 $2,392,0 $4,496,0 $2,308,0 $3,920,0 $2,431,0 $3,105,0 $3,105,0 $3,105,0 $3,105,0
$- $500,000
$1,000,000 $1,500,000 $2,000,000 $2,500,000 $3,000,000 $3,500,000 $4,000,000 $4,500,000 $5,000,000

The DPTI $2 per annum program has prioritised roads based on their classification with higher use roads upgraded first.
5.5 New and Upgrade Plan
5.5.1 Selection Criteria
Refer Chapter 1 – General Statements.
The priority ranking criteria for New and upgrade of Transport assets is the same as for renewal and detailed in Table 16.
5.5.2 Standards and Specifications
Standards and specifications for new assets and for upgrade/expansion of existing assets are the same as those for renewal shown in Section 5.4.2.
5.5.3 Future upgrades/new assets expenditure
Projected new and upgrade expenditure is summaries in Figure 9. The aim to upgrade township roads to seal has been factored into the upgrades however based on current budget, this will take more than 50 years. Upgrade of township footpaths has also been included however this will again take more than 50 years at the current amount proposed.
Figure 9: New and Upgrade Forecast
2020/21 2021/22 2022/23 2023/24 2024/25 2025/26 2026/27 2027/28 2028/29 2029/30
Signs $- $- $- $- $- $- $- $- $- $-
Pram Ramps $- $- $- $- $- $- $- $- $- $-
Walking Trails $- $- $- $- $- $- $- $- $- $-
Guardrails $- $- $- $- $- $- $- $- $- $-
Roads - Sheeted $- $- $- $- $- $- $- $- $- $-
Roads - Sealed $1,272,8 $1,590,0 $150,000 $150,000 $150,000 $160,000 $160,000 $180,000 $125,000 $125,000
Footpaths $200,000 $50,000 $50,000 $50,000 $50,000 $42,000 $50,000 $50,000 $50,000 $50,000
CarParks $- $- $- $- $- $- $- $- $- $-
Budget $1,472,8 $97,500 $247,500 $102,500 $102,500 $102,500 $102,500 $117,500 $117,500 $117,500
$-
$200,000
$400,000
$600,000
$800,000
$1,000,000
$1,200,000
$1,400,000
$1,600,000
$1,800,000
Upgraded assets and services will be funded from Council’s capital works program and grants where available.
A detailed li A detailed listing of transport upgrades is provided in Appendix H. In addition Council has developed a Road Action Plan which details potential additional upgrades if additional grant funding becomes available. the action plan is based on major Freight, Tourism and Community usage as well as Strategic Fire Barriers and is available in Appendix I.
5.6 Disposal Plan
Disposal includes any activity associated with disposal of a decommissioned asset including sale, demolition or relocation.
At the time of writing this Infrastructure and Asset Management Plan, Council are considering the possible hand back of the rural sealed road network to be under State Government care and control. As this is only a consideration and there are no active discussions, this Infrastructure and Asset Management Plan has not identified any Transport assets to be disposed of.

6 FINANCIAL SUMMARY
This section contains the financial requirements resulting from all the information presented in the previous sections of this infrastructure and asset management plan.
6.1 Financial Statements and Projections
The financial projections shown in Figure 10 are for operating (reactive and planned maintenance), capital renewal expenditure and capital upgrade expenditure28. Appendix B shows the actual figures used to obtain this graph.
Figure 10: Financial Projections - Operating, Capital Upgrade and Capital Renewal
6.1.1 Sustainability of Service Delivery
Refer to Chapter 1 – General Statements for discussion on key indicators for financial sustainability.
There are two key indicators for financial sustainability that have been considered in the analysis of the services provided by this asset category, these being long term life cycle costs and medium term costs over the 10 year financial planning period.
Long Term – Life Cycle Cost
Table 17: Summary of life cycle costs
Asset Class
Average Annual
Lifecycle Cost
Average Annual
Lifecycle Expenditure
Lifecycle Gap
Life cycle Sustainability
Index
$4,656,254 $3,603,153 $1,053,101 77% $4,656,254
28 Note: due to the large scale of potential upgrades, the proposed capital upgrade expenditure has been rationalised.
$-
$1,000,000
$2,000,000
$3,000,000
$4,000,000
$5,000,000
$6,000,000
2020/21 2021/22 2022/23 2023/24 2024/25 2025/26 2026/27 2027/28 2028/29 2029/30
Capital Renewal
Capital Upgrade
Operating Costs

Medium term – 10 year financial planning period
The projected asset renewals versus the planned renewal expenditure in the capital works program in the 10 year planning period is shown in Figure 11 (including $2m DPTI funding)
Figure 11: Projected Asset Renewals – Including $2m DPTI funding
Table 18 shows the annual and cumulative funding gap between projected and planned renewals for Transport assets.
Table 18: Accumulative Renewal Funding Gap
Year
Planned Renewals (including $2m DPTI funding)
Projected Renewals
Renewal Funding Gap
Cumulative Gap
2020/21 $3,475,000 $3,565,000 -$90,000 -$90,000
2021/22 $2,392,000 $3,604,850 -$1,212,850 -$1,302,850
2022/23 $4,496,000 $3,500,000 $996,000 -$306,850
2023/24 $2,308,000 $3,650,500 -$1,342,500 -$1,649,350
2024/25 $3,920,000 $3,585,267 $334,733 -$1,314,617
2025/26 $2,431,000 $3,500,000 -$1,069,000 -$2,383,617
2026/27 $3,105,000 $3,500,000 -$395,000 -$2,778,617
2027/28 $3,105,000 $3,500,000 -$395,000 -$3,173,617
2028/29 $3,105,000 $3,500,000 -$395,000 -$3,568,617
2029/30 $3,105,000 $3,751,055 -$646,055 -$4,214,672
$-
$500,000
$1,000,000
$1,500,000
$2,000,000
$2,500,000
$3,000,000
$3,500,000
$4,000,000
$4,500,000
$5,000,000
2020/21 2021/22 2022/23 2023/24 2024/25 2025/26 2026/27 2027/28 2028/29 2029/30
Capital Renewal Planned Renewal Expenditure
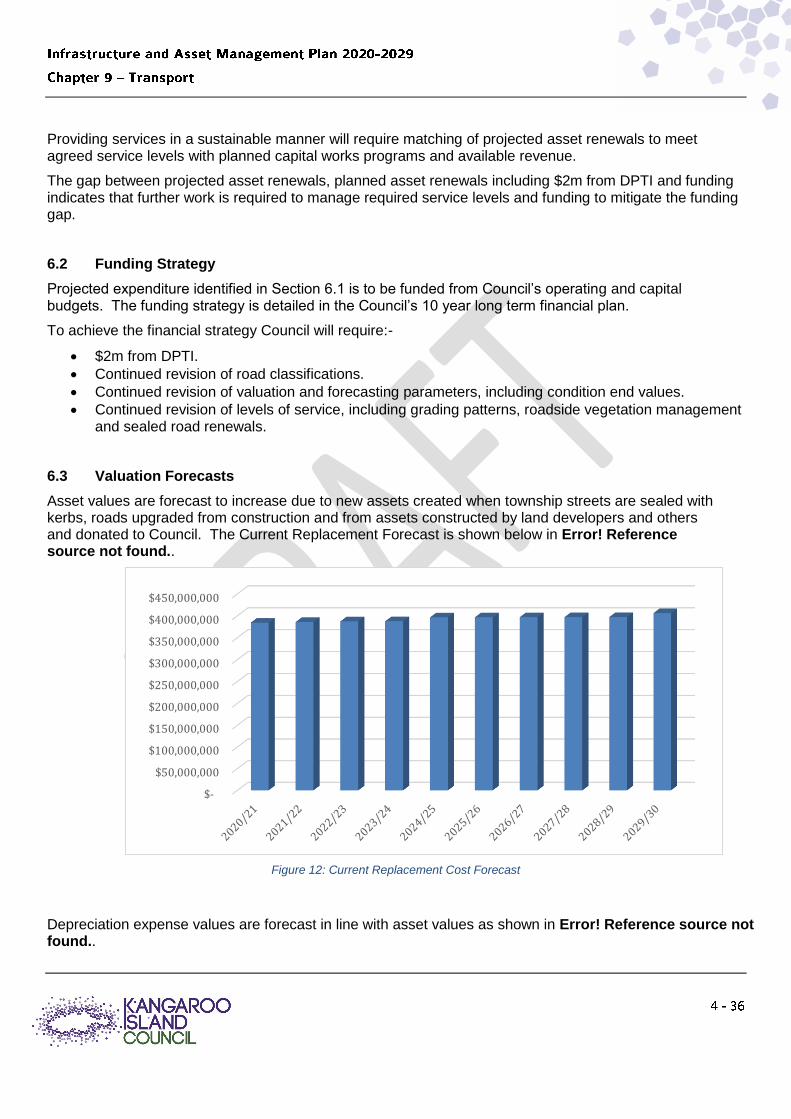
Providing services in a sustainable manner will require matching of projected asset renewals to meet agreed service levels with planned capital works programs and available revenue.
The gap between projected asset renewals, planned asset renewals including $2m from DPTI and funding indicates that further work is required to manage required service levels and funding to mitigate the funding gap.
6.2 Funding Strategy
Projected expenditure identified in Section 6.1 is to be funded from Council’s operating and capital budgets. The funding strategy is detailed in the Council’s 10 year long term financial plan.
To achieve the financial strategy Council will require:-
$2m from DPTI.
Continued revision of road classifications.
Continued revision of valuation and forecasting parameters, including condition end values.
Continued revision of levels of service, including grading patterns, roadside vegetation management and sealed road renewals.
6.3 Valuation Forecasts
Asset values are forecast to increase due to new assets created when township streets are sealed with kerbs, roads upgraded from construction and from assets constructed by land developers and others and donated to Council. The Current Replacement Forecast is shown below in Error! Reference source not found..
Figure 12: Current Replacement Cost Forecast
Depreciation expense values are forecast in line with asset values as shown in Error! Reference source not found..
$-
$50,000,000
$100,000,000
$150,000,000
$200,000,000
$250,000,000
$300,000,000
$350,000,000
$400,000,000
$450,000,000

Figure 13: Depreciation Forecast
The depreciated replacement cost (current replacement cost less accumulated depreciation) will vary over the forecast period depending on the rates of addition of new assets, disposal of old assets and consumption and renewal of existing assets as shown below in Error! Reference source not found..
Figure 14: Depreciated Replacement Cost Forecast
6.4 Key Assumptions made in Financial Forecasts
Refer section 1.
Key assumptions made specific to this infrastructure and asset management plan are:
$-
$500,000
$1,000,000
$1,500,000
$2,000,000
$2,500,000
$-
$50,000,000
$100,000,000
$150,000,000
$200,000,000
$250,000,000
$300,000,000
$350,000,000
$400,000,000

Asset data for Transport assets was collected by Kangaroo Island Council staff in 2019/20 and the information in this IAMP incorporates the latest data.
The useful life and replacement costs of the assets were determined by PPP (Public Private Property) in June 2020.
Purchase cost rather than replacement cost is used for assets acquired after this date

7 ASSET MANAGEMENT PRACTICES
7.1 Accounting/Financial Systems
Refer Chapter 1 – General Statements.
7.2 Asset Information System
Refer Chapter 1 – General Statements.
7.3 Information Flow Requirements and Processes
Refer Chapter 1 – General Statements.
7.4 Standards and Guidelines
Refer Chapter 1 – General Statements.

8 PLAN IMPROVEMENT AND MONITORING
8.1 Performance Measures
Refer Chapter 1 – General Statements.
8.2 Improvement Plan
Refer Chapter 1 – General Statements.
The asset management improvement plan generated from this infrastructure and asset management plan is shown in Table 19.
Table 19: Improvement Plan
Task No
Task Update Proposed
Timeline Estimated Cost
Area
1 Development of a disposal plan No longer a priority and no current intent to dispose of any transport assets
N/A - -
2 Monitoring and ongoing review of Levels of Service
Levels of service developed, review incorporated into the IAMP process
Complete - -
3 Review of Asset Accounting Policy Complete - -
4 Implement Asset Management Policy Delayed Dec 2023 Within current budget Within current budget
-
5 Borrow Pit Management Plan to be developed, including pit remediation to secure suitable road building materials for the long term.
Delayed Dec 2024 -
6 Finalisation of the Pedestrian Generator Plan for townships
Delayed Dec 2025 Within existing salaries
Maintenance
7 Consider reclassification of Car parks / Access Roads as a sub class of assets in the Transport Infrastructure Asset Management Plan
These are now both included in the IAMP
Complete - -
8 Transport Revaluation – 2019/2020 New Complete - -
9 Review and revise Council’s Roadside Vegetation Management Plan
New Dec 2021 Within current budget

12 Develop more detailed 3, 10 and 20 year forward plans for renewal, in particular for roads, specifying road renewal priorities
New Jun 2021 Within current budget
13 Determine costings for street sweeping recommended performance
New Dec 2021 Within current budget
14 Develop standard for responding to reactive service requests
New Jun 2023 Within current budget
15 Develop joint asset management plans with government agencies for road and marine infrastructure
New Dec 2023 Within current budget
16 Obtain funding to undertake a road safety audit and plan – to achieve national safety standards (including signage) for all Island roads
New Jun 2024 Within current budget
17 Develop a more sophisticated Asset Management Plan that more clearly shows the division of costs between asset types and how the transport network would be impacted without the external funding. Include consideration of sealing over bridges
New Jun 2024 Within current budget
18 Review existing data on grading schedules and road conditions to develop more sophisticated grading schedule.
New Jun 2024 $5,000 Maintenance
19 Transport Revaluation – 2024/2025 New Jun 2025 $20,000 Maintenance
20 Develop condition assessment process for vegetation to be completed during valuations to allow for better scheduling of vegetation clearance
New Jun 2025 $5,000 Maintenance
21 Transport Revaluation – 2029/2030 New Jun 2030 $20,000 Maintenance
8.3 Monitoring and Review Procedures
Refer Chapter 1 – General Statements.

9 REFERENCES
ARRB (Australian Road Research Board). (2009). Unsealed Roads Manual, Guidelines to good practice.
Kangaroo Island Council. (2007). Roadside Vegeation Management Plan. Retrieved from https://www.kangarooisland.sa.gov.au/council/plans/vegetation
Kangaroo Island Council. (2014). Road Network Extension Policy.
Kangaroo Island Council. (2020). Kangaroo Island Council Strategic Plan 2020-2024. Retrieved from https://www.kangarooisland.sa.gov.au/council/plans/strategic-management-plan-2020-24
KI Regional Transport Strategy Steering Group. (2007). Kangaroo Island Regional Transport Strategy.
Local Roads Advisory Committee for the Determination of Road Classification in South Australia. (2018). Road Classification Guidelines in South Australia.
NRSS Inquiry Panel. (2018). Inquiry into the National Road Safety Strategy 2011-2020.
Resilient Hills and Coasts. (2016). The Climate Change Adaptation Plan for the Adelaide Hills, Fleurieu Peninsula and Kangaroo Island. Retrieved from https://www.kangarooisland.sa.gov.au/community/rhc
Southern & Hills Local Government Association. (2015). 2020 Transport Plan, 2015 Update.
TOMM Kangaroo Island Committee. (2019). Visitor Exit Survey 2018/2019. Retrieved from https://www.tourkangarooisland.com.au/
TRB. (1993). Managing Unsealed Roads in South Australia.

APPENDIX A – Transport Planned operating, capital renewal and capital upgrade expenditure
2020/21 2021/22 2022/23 2023/24 2024/25 2025/26 2026/27 2027/28 2028/29 2029/30
Operating $37,362 $37,362 $37,362 $37,362 $37,979 $37,362 $37,362 $37,362 $37,362 $37,979
Capital Renewal $3,565,000 $3,604,850 $3,500,000 $3,650,500 $3,585,267 $3,500,000 $3,500,000 $3,500,000 $3,500,000 $3,751,055
Capital Upgrade $1,472,875 $1,640,000 $200,000 $200,000 $200,000 $202,000 $210,000 $230,000 $175,000 $175,000
TOTAL COSTS $5,075,237 $5,282,212 $3,737,362 $3,887,862 $3,823,246 $3,739,362 $3,747,362 $3,767,362 $3,712,362 $3,964,034

APPENDIX B – Transport Rules for Finance and Asset Finda
The following sub-department have been included in all finance calculations:
004 Car Parks
021 Kerbs and Paths (halve costs)
041 Roads – sealed
042 Roads – unsealed
043 Roads – vegn
045 Roads – patrol grading
049 Street Cleaning
052 Traffic control (linemarking)
053 Traffic Control (signage)
The following expenses have been excluded from all finance calculations:
Depreciation
Bank charges
General Interest Expenses
Capital Cost Allocation
Asset Finda:
The following rules have been applied when entering data into Asset Finda:
Communities Assets are allocated to the community based on their location and the Communities used are consistent with the Departments used in finance
o Township: American River Baudin Beach Emu Bay Island Beach Kingscote/Brownlow Nepean Bay Penneshaw Parndana Vivonne Bay
o Rural: Dudley MacGillivray Redbanks Stokes Vivonne Wisanger Western Districts
Asset Classes: Assets are divided into 7 asset classes (Roads, Carparks, Footpaths, Guardrails, Pram Ramps, Signs, Walking Trails) with the following asset Types and numbers (refer to table on next page)
Categories: Assets are allocated to the category based on which asset class they are in:
o Roads – Township Roads or Rural Roads (based on their location) o Carparks – Carparks o Footpaths – American River Footpaths, Emu Bay Footpaths, Kingscote Footpaths, Parndana
Footpaths, Penneshaw Footpaths

o Guardrails – Guardrails o Pram Ramps - American River Pram Ramps, Kingscote Pram Ramps, Parndana Pram
Ramps, Penneshaw Pram Ramps o Signs – Guide Sign, Hazard Sign, Regulatory Sign, Warning Sign, Other Sign o Walking Trails - American River Walking Trails, Kingscote Walking Trails, Penneshaw
Walking Trails
Notes: o Contract IDs are the finance GL code o Condition rating criteria as per 2020 Revaluation
Asset Class Asset Finda Template
Examples of Asset Types Asset Numbers
Roads Transport Formation, Sub Pavement, Pavement, Sheeted
Surface, Sealed Surface
Asset number – based on road ID, segment
number and layer
RRRRRSSS_X
Transport_Carparks Transport Formation, pavement, sheeted surface or sealed
surface
Asset number – based on the ID of the land the
carpark is located on.
AX_X.XX
Transport_Footpaths Transport Footpaths FPXXX
Transport_Guardrails Transport Guardrails GRXXXX
Transport_PramRamps Transport Narrow or Standard design BRXX
Transport_Signs Transport Road signs SNXXXXXX
Transport_WalkingTrails Transport Base Course and sealed surface
Asset number – based on the ID of the land the
walking trail is located on.
AX_X.XX

APPENDIX C – Strategic Document Recommendations
Strategic Document
Note/Recommendations Council Comments
Business Continuity Plan
Road access and serviceability (Arterial & Collector) - Max Acceptable Outage = 4 hours Council’s procedure is to inspect the road and either repair or install a detour until road is again accessible.
Consider developing map which highlights roads most critical in terms of impact if not available and alternate routes to be used in BC scenarios (Nov 2018)
There are too many potential scenarios to develop a map. Procedure above of adding detour signs specific to the location of the issue is considered sufficient..
Kangaroo Island Plan
Develop fit-for-purpose road and port facilities to support the export of woodchips and grain. Council would be involved in discussions with proponents on this.
Upgrade tourism roads on Kangaroo Island. This is ongoing. The priorisation criteria for the upgrade and renewal of roads includes a factor for tourism.
Paradise Girt By Sea
Either designate the sealed road loop a ‘state road’ or provide State funding assistance of equivalent value to Council.
Council are in discussions on the future maintenance of the state roads.
KIFA and KI Council to review local road network; define 3 categories for local road; KIFA and KI Council in conjunction with DTEI investigate options to reduce the maintenance costs of the unsealed road network on KI and improve road quality.
Road classifications process complete and the upgrade of Sheeted Roads to a better standard should result in lower maintenance costs in regards to grading frequency required.
Local government on Kangaroo Island
3) Council engage with State Government to express its concern over the particular impact on kangaroo Island of the vegetation management requirements of the native Vegetation Act 1991 as they apply to road reserves.
Council are currently in discussions with Native Vegetation Council about

Strategic Document
Note/Recommendations Council Comments
today and Tomorrow
updating the Roadside Vegetation Management Plan.
6) Council seek the support of its regional LGA (Southern and Hills LGA) to apply for funding assistance through the Special Local Roads Program to upgrade tourist roads on Kangaroo Island
Council currently has funding to upgrade Wedgewood Road and Hickmans Road. Once this project is finished, Council will consider other roads that could potentially be upgraded via this funding.
7) Council closely monitor usage and the destination of users of the South Coast Road and the West End Highway over time and its own expenses association with the ongoing necessary maintenance and upgrade of these key local roads. This will assist Council’s case in any future dialogue with the State about the classification of these roads.
This is not currently a priority for Council.
LGA – Risk Evaluation Guidance
2c) Council must develop and adopt an infrastructure and asset management plan for a period of at least 10 years that covers the management and maintenance of roads and footpaths. The plan should include identification of the assets, assessment and prioritisation o the assets for inspection, repair and maintenance (this should consider asset and infrastructure use, traffic or visitation levels, condition, safety, and other legislative requirements, etc) An issue log or register should be in place that tracks identified issues that arise over time with the specific piece of infrastructure or asset and this should link back to the asset plan in terms of whether an adjustment is required to the current assessment and prioritisation level.
This IAMP starts this process, the improvement plan allows for the development of a more sophisticated plan over time.
2d) The inspection and maintenance priorities and timeframes [for inspection of roads and footpaths] should be identified in the asset management plan and/or within the issue log as a corrective action. This should be supported by a process at workgroup level to guide them in relation to what is to be inspected, what timeframes are for this and who is responsible for doing this.
This IAMP starts this process, the improvement plan allows for the development of a more sophisticated plan over time.

Strategic Document
Note/Recommendations Council Comments
The workers responsible should have documentation and training to enable them to make a consistent assessment of the road or footpath, covering all the required criteria, including documenting any changes to the road (e.g. alteration or reinstatement of the road).
2e) The inspection and maintenance priorities and timeframes [for roads] should be identified in the asset management plan and/or within the issue log as a corrective action. A maintenance and repair schedule should be developed, which takes into consideration the inspection findings (as per previous question), reported issues or faults, the use of the road (including traffic volumes, proximity to public areas, use by vulnerable groups or those with special needs) and also any other identified issues with the road (e.g. original design issues, reported issues or incidents in the same location, etc.) This should be supported by a process at workgroup level to guide them in relation to what is to be maintained or repaired, what the timeframes are for this and who is responsible for doing this. The workers responsible should have documentation and training to enable them to conduct the appropriate maintenance and/or repair activities. There should be a process to update the asset management plan with any changes once the repair/maintenance has been completed.
This IAMP starts this process, the improvement plan allows for the development of a more sophisticated plan over time.
In addition, Council are in the process of rolling out the mobile version of AssetFinda which, once set up, will have the capability of documenting issues as found and potentially then scheduling future works.
2f) The inspection and maintenance priorities and timeframes [for footpaths] should be identified in the asset management plan and/or within the issue log as a corrective action. A maintenance and repair schedule should be developed, which takes into consideration the inspection findings (as per previous question), reported issues or faults, the use of the footpath (including traffic volumes, proximity to public areas, use by vulnerable groups or those with special needs) and also any other identified issues with the footpath (e.g. original design issues, numerous reported issues or incidents, etc.) This should be supported by a process at workgroup level to guide them in relation to what is to be maintained or repaired, what the timeframes are for this and who is responsible for doing this. The workers responsible should have documentation and training to enable them to conduct
This IAMP starts this process, the improvement plan allows for the development of a more sophisticated plan over time.
In addition, Council are in the process of rolling out the mobile version of AssetFinda which, once set up, will have the capability of documenting issues as found and potentially then scheduling future works.

Strategic Document
Note/Recommendations Council Comments
the appropriate maintenance and/or repair activities. There should be a process to update the asset management plan with any changes once the repair/maintenance has been completed.

APPENDIX D – Road Classification Maps

APPENDIX E – Road Cross Section Standard Drawings
RURAL SHEETED ROAD – TYPICAL CROSS SECTION – MEDIUM USE ROAD

RURAL SHEETED ROAD – TYPICAL CROSS SECTION –LOW USE ROAD

RURAL SHEETED ROAD – TYPICAL CROSS SECTION – VERY LOW USE ROAD

APPENDIX F – Renewal Priorities – Roads
Year Sealed Roads DPTI Program Sheeted Roads
2020/21 Township:
Murray St, Kingscote
Addison St, Kingscote (carparks)
Faile Ct, WaraweeRd & Nelcebe Ct, American River
Buick St & Hawthorn Ave, Emu Bay
Kingscote Tce & Commercial St, Kingscote
$20,000
$10,000
$35,000
$15,000
$10,000
North Coast Road
Redbanks Road (part)
Turkey Lane
$800,000
$1,000,000
$1,000,000
Township:
North West Tce, The Parade, High St, Second St, First St, Brownlow
$70,000
Rural:
Birchmore Rd (seg 30, 35,55)
Seal Bay Rd (seg 5,10)
South Coast Rd (seg 80-100)
Fire Damaged reseal
$85,000
$60,000
$110,000
$200,000
Rural:
Willson River Rd (seg 30)
Moores Rd (seg 10,15)
East West One (seg TBC)
Fire Damaged patch repairs
$100,000
$80,000
$80,000
$200,000
$545,000 $2,800,000 $530,000
2021/22 Township:
Cygnet Rd, Kingscote
Chapman Tce, Kingscote
Dauncey St, Kingscote
Third St, Brownlow
Esplanade, Kingscote
$10,000
$10,000
$15,000
$10,000
$15,000
Jetty Road (4km)
Cape Borda Rd (part to Shackle Rd) (12.5km)
Township:
Ocean View Drive, Nepean Bay
$30,000
Rural:
Acacia Dr, Lovers Lane and Tinsmith Rd
Rose Cottage Rd (seg 5)
Porter Rd and Keith Rd
Jews Hwy (seg 5)
Thomas Rd (seg 5)
Margaries Rd (seg 5)
Muston Rd (seg 5)
Hillview Rd (seg 10)
$120,000
$60,000
$30,000
$60,000
$50,000
$65,000
$40,000
$10,000
Rural:
Playford Highway (seg 270-310)
South Coast Road (seg 105-195)
North Coast Road (seg 5-15)
$350,000
$450,000
$125,000
$1,000,000 $2,000,000 $475,000
2022/23 Township:
Drew St, Kingscote
Franklin St, Kingscote
Tangara Drive, American River
Nepean Avenue, Kingscote
Jones St, Parndana
$10,000
$15,000
$30,000
$10,000
$15,000
South Coast Rd (20km) Township:
None scheduled
Rural:
Elsegood Rd (seg 5-15)
Birchmore Rd (seg 5-25)
Stokes Bay Rd (seg 5-15)
Playford Highway (seg 315-340)
South Coast Road (seg 200-240)
$85,000
$215,000
$170,000
$175,000
$275,000
Rural:
North Coast Road (seg 120-135)
Mount Stockdale Rd (seg 5,15)
Gosse Ritchie Rd (seg 10)
$260,000
$160,000
$80,000
$1,000,000 $2,000,000 $500,000

Year Sealed Roads DPTI Program Sheeted Roads
2023/24 Township:
To Be Confirmed
Gum Creek Rd (14km)
Miller Rd (10km)
Township:
To Be Confirmed
Rural:
To Be Confirmed
Rural:
To Be Confirmed
$1,000,000 $2,000,000 $500,000
2024/25 Township:
To Be Confirmed
Barretts Rd (8.2km)
Seagers Rd (part - 12km)
Township:
To Be Confirmed
Rural:
To Be Confirmed
Rural:
To Be Confirmed
$1,000,000 $2,000,000 $500,000
2025/26 Township:
To Be Confirmed
Seagers Rd (part - 7km)
Gap Rd, Ropers Rd (15km)
Township:
To Be Confirmed
Rural:
To Be Confirmed
Rural:
To Be Confirmed
$1,000,000 $2,000,000 $500,000
2026/27 Township:
To Be Confirmed
Moores Rd (11.7km)
Mount Taylor Rd (part – 10km)
Township:
To Be Confirmed
Rural:
To Be Confirmed
Rural:
To Be Confirmed
$1,000,000 $2,000,000 $500,000
2027/28 Township:
To Be Confirmed
Mount Taylor Rd (part – 12km)
Timber Creek Rd (13km)
Township:
To Be Confirmed
Rural:
To Be Confirmed
Rural:
To Be Confirmed
$1,000,000 $2,000,000 $500,000
2028/29 Township:
To Be Confirmed
Hanson Bay Rd (5km)
East West One (15km)
Township:
To Be Confirmed
Rural:
To Be Confirmed
Rural:
To Be Confirmed
$1,000,000 $2,000,000 $500,000
2029/30 Township:
To Be Confirmed
East West One (20km) Township:
To Be Confirmed
Rural:
To Be Confirmed
Rural:
To Be Confirmed
$1,000,000 $2,000,000 $500,000
The order of these may vary based on ongoing assessment of condition of the assets.

APPENDIX G – Renewal Priorities – Other Transport Assets
Year Amount Asset Category Details
2021/22 $ 104,850 Guardrails Replacement of 30 guardrails totalling 464m, Stokes bay, Wisanger, Newland, Macgilivray, Dudley, Penheshaw and Kingscote
2025/26 $ 150,500 Carparks Carparks at Kingscote Tidal Pool, Hanson bay, Kingscote Information Bay, Airport Corner and Parndana Town Hall
2026/27 $ 85,267 Footpaths Reseal of footpaths in Kingscote – Daucney St, Commercial St, Wheelton St, Franklin St and Murray St
2029/30 $ 251,055 Carparks Carparks at Kingscote Cemetery, Windmill Monument, Western River, Reeves Point, Point Ellen:
Note: Condition of these will be assessed closer to this date.
TOTAL $ 591,672

APPENDIX H – Upgrade Priorities
Asset Class New/Upgrades Cost Estimate
Scheduled Year
Roads - Sealed Wedgewood/Hickmans $1,212,875 2020/2021
American River - Bimberta / Moreanda $60,000 2020/2021
Wedgewood/Hickmans $1,440,000 2021/2022
Penneshaw - The Lane $150,000 2021/2022
Penneshaw - The Lane $150,000 2022/2023
Penneshaw - The Lane $150,000 2023/2024
Penneshaw - The Lane $150,000 2024/2025
Kingscote - Torrens Street, Stokes Court, KI Yacht Club Access
$160,000 2025/2026
Kingscote - Karatta Tce (Kohinoor to Campbell) $160,000 2026/2027
Parndana - Wheaton Street $180,000 2027/2028
Sealing of unsealed High Use Rural Roads - Elsegood Road, Dune Road and Jetty Road
$125,000 2028/2029
$125,000 2029/2030
Roads - Sheeted Sealing of unsealed High Use Rural Roads - Elsegood Road, Dune Road and Jetty Road
$2,000,000 Not yet
scheduled
CarParks No specific upgrades planned at this time - -
Footpaths Kingscote Footpaths - Murray Street $50,000 2020/2021
Parndana Footpaths $50,000 2020/2021
Penneshaw Footpaths $50,000 2020/2021
American River Footpaths $50,000 2020/2021
Kingscote Footpaths - Murray Street, Telegraph Road $50,000 2021/2022
Kingscote Footpaths - Telegraph Road $50,000 2022/2023
Kingscote Footpaths - Telegraph Road $50,000 2023/2024
Kingscote Footpaths - Telegraph Road $50,000 2024/2025
Kingscote Footpaths - Chapman Terrace, Cygnet Road $42,000 2025/2026
Kingscote Footpaths - Osmond Street $50,000 2026/2027
Kingscote Footpaths - Osmond Street $50,000 2027/2028
Kingscote Footpaths - Franklin Street $50,000 2028/2029
Kingscote Footpaths - Franklin Street $50,000 2029/2030

Asset Class New/Upgrades Cost Estimate
Scheduled Year
Guardrails Ongoing as part of road upgrades
Included in road
upgrade cost Ongoing
Walking Trails Parndana walking trail
To be determined
Not yet scheduled
Penneshaw Foreshore Walking Trail To be
determined
Not yet scheduled
Pram Ramps No specific upgrades planned at this time - -
Signs No specific upgrades planned at this time - -
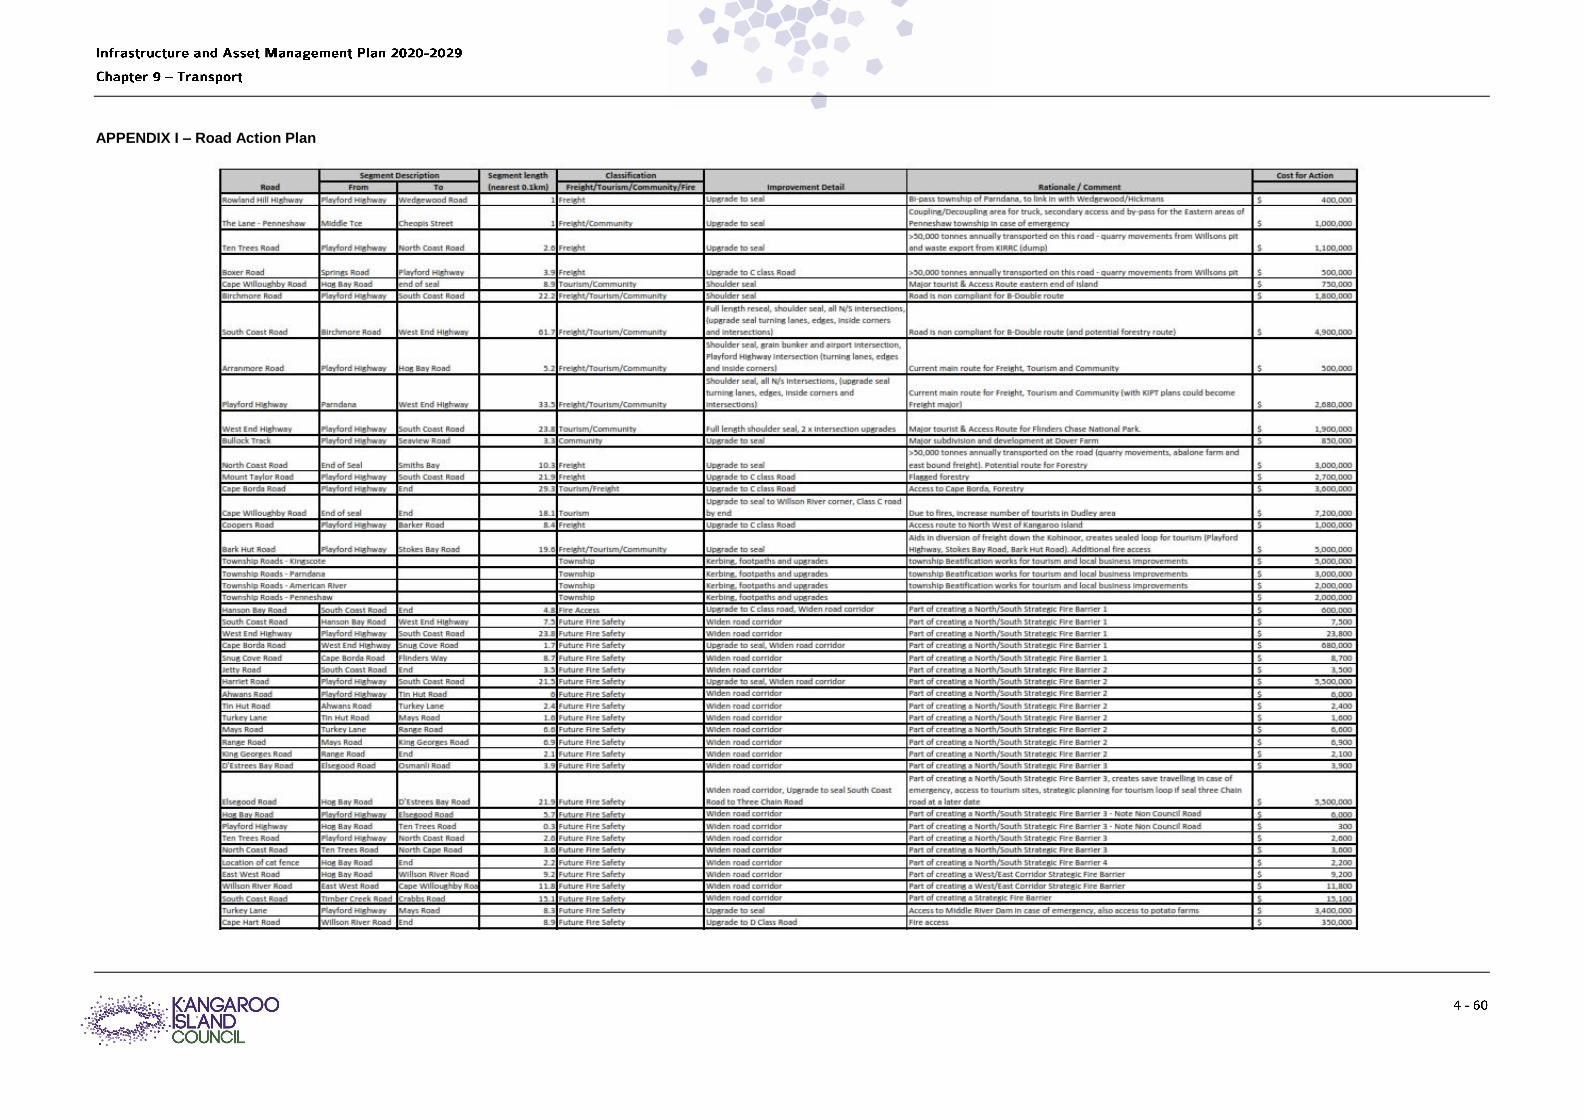
APPENDIX I – Road Action Plan


