Page 1
152
CHAPTER - 4
ANALYSIS OF PERFORMANCE OF SELECTED FMCG COMPANIES
The performance of the FMCG Companies can be evaluated in three ways, they are:
(1) Solvency:
This is the measure of the firm‘s ability to pay its debts as they come due and still be
financially capable of carrying on normal operations.
(2) Profitability:
This is the measure of the firm‘s ability to earn a net income. Generally historical
evidence is used as the criterion is used as the firm‘s success in this area.
(3) Future potential:
The evaluation of a firm‘s future potential required reference to several factors some of
this cannot measure quantitatively.
So the evaluation of a firm will collectively included above since they are mutually
interdependent and cannot be entirely separated for appraised purpose.
For the purpose of the study, financial performance analysis is made.
(1) Financial performance analysis:
The classification of financial analysis can be made either on the basis of material used
for the some or according to modus operation of the analysis.
(A) According to material used:
(1) External analysis:
―Analysis of financial statements conducted by those who do not have access to books of
accounts or carried out on the basis of published information is known as external
analysis‖(Sharma R. 2006, P-461).
This is affected by those who do not have access to the detailed accounting record of the
company. This group comprising investors, credit agencies, government and the public
Page 2
153
depends almost entirely on published financial statement. With the recent changes in the
government regulations required business concern to make available detailed information
to the public through audited concerns to make available detailed information to the
public through audited accounts, the position of the external analyst has been
considerably improved.
(2) Internal analysis:
―Analysis conducted by those who have access to book of accounts is known as internal
analysis‖ (Sharma R., 2006, p. 461). It is based on detailed information available within
enterprise, which is not available to the outsiders.
This is affected by those who have access to the books of accounts and other information
relating to the business concern. Any financial analysis is conducted with reference of a
whole unit. Executives and employees of the business units as well as government
agencies, which have statutory control and jurisdiction over such units, conduct this type
of analysis meant for managerial purpose.
Table 4.1 Difference between internal and external analysis
Point of
Difference
Internal Analysis External Analysis
By whom? It is conducted by the persons
within the business firms e.g.
accounting and finance department
It is conducted by the outsiders e.g.
financial analysts, share market
researchers
Base It is conducted on the basis of
books of accounts as access of
them is possible.
It is conducted on the basis of
published information as access of
the books of accounts is not possible.
Reliability As it is based on the books of
accounts, it is more reliable as
compares to external analysis.
As it is based on published
information, it is not conducted in
depth and hence it has less reliability.
Page 3
154
(B) According to modus operandi of analysis:
(A) Horizontal or Dynamic Analysis:
―Analysis which involves comparisons and establishing relationship among related items
based on financial statements of an enterprise for a number of years or financial statement
of various enterprises for the same year is known as horizontal analysis.‖(Sharma R.,
2006, P-461). As the data of more than one year are used in such a type of analysis, it is
possible to generate the trend of each item of financial statements. As the data of various
years are used in horizontal analysis, it is known as dynamic analysis. (Sehgal Ashok &
Deepak, Advanced Accounting- 2, Corporate Accounting, Taxmann‘s Taxmann Allied
Services (p) Ltd. P-407).When financial statement for a certain number of years is
analyzed the analysis is called a horizontal analysis. It is also known as ‗Dynamic
analyses. This is based on the data spread over a period of years rather than on one date
or period of time as a whole.
(B) Vertical Analysis:
―Analysis of financial data based on relationship among various items in a single period
of financial statements is called vertical analysis.‖ (Sharma R., 2006, P-461). Normally,
common-size statements may be considered as a tool of vertical analysis. As the facts and
figures of financial statements of given period of time are used in vertical analysis, it is
also known as static analysis. This refers to analysis of ratio developed for one date or for
one accounting period. This is also known as ‗static analyses. But vertical analysis does
not facilitate a proper analysis and interpretation of figures in perspective and also
comparison over a period of years. As such this type of analysis is not resorted to by the
financial analysis. In short, financial analysis done on the basis of only one year is known
as vertical analysis.
(C) Trend Analysis:
The financial statements for a series of years may be analyzed to determine the trend of
the data contained there in. The trend percentages are also referred to as „trend ratios‟.
This method of analysis is adopted to determine the direction upward or downward. This
Page 4
155
involves the computation of the percentage relationship that each item in the statement
bears to the corresponding items contained in that of the base year. For this purpose the
earliest year involved in comparison or any intervening year may be considered as the
base year. The trend percentages emphasize changes in the financial data from year to
year and facilitate horizontal comparison and study of the data. These trend ratios can be
considered as index number showing relative change in the financial data over a period of
years.
Table 4.2: Different between horizontal and vertical analysis
Point of
Difference
Horizontal Analysis Vertical Analysis
Requirement To conduct horizontal analysis,
financial statements of two or more
periods are required.
To conduct vertical analysis,
financial statements of one year
are needed.
Items Under such analysis, items of more
than one year are taken into account.
Under such analysis, items of one
year taken into account.
Reach It involves of comparison of items
given in the financial statements.
It creates a base for the purpose of
conducting comparison of the
items given in the financial
statements.
Utility It is a significant tool for inter-firm
comparison or series analysis.
It is a significant tool for intra-firm
comparison or cross-section
analysis.
Tool Comparative financial statements
analysis is an important tool of this
type.
Common-size statements may be
considered as a tool of horizontal
analysis.
Synonyms It is also known as dynamic
analysis.
It is also known as static analysis.
Page 5
156
RATIO ANALYSIS
4.1 INTRODUCTION
To evaluate the financial condition and performance of a firm, the financial analyst yields
certain yardstick frequently used as a ratio, or index, relating two pieces of financial data
to each other. Analysis and interpretation of various ratios should give experienced,
skilled analyst a better understanding of the financial conditions and performance of the
firm than they would obtain from analysis of financial data alone.
4.2 WHAT IS RATIO?
Ratio analysis is a powerful tool of financial analysis.
A Ratio is defined as—―The indicated quotient of two mathematical expressions and as
the relationship between two or more things‖. In financial analysis a ratio is used as
benchmark for evaluating the financial position and performance of a firm. Ratios help to
summarize large quantities of financial data and to make qualitative judgments about the
firm‘s financial performance.
The financial statements are prepared and presented annually are of little use for guidance
of prospective investors, creditors and even management. If relationships between
various related items in the financial statement are established, they can provide useful
clues to gauge accurately the financial health and ability of business to make profit.
This relationship between two related items of financial statement is known as ―Ratio‖.
Ratio can be expressed in three different ways such as-
Percentage- for example, the Return on Investment is 30%.
Rates- for example, Price Earning Ratio is 5 times.
Proportion- for example, Debt-Equity Ratio is 1:2
Page 6
157
Standards of Comparison
The ratio analysis involves comparison for a useful interpretation of the financial
statement. A single ratio itself does not indicate favourable condition. It should be
compared with some standards. The standards may consist of:
Past ratio: Ratios calculated from the past financial statement of the same firm
Competitors‟ ratio: Ratio of some selected firms especially the most successful
competitor, at the same point in time.
Industry ratios: Ratios of the industry to which the firm belongs.
Projected ratios: Ratios developed using the projected financial statement of the
same firm.
4.3 TYPES OF RATIO ANALYSIS
The ratio analysis involves comparison for useful interpretations of the financial
statements a single ratio in itself does not indicate favorable or unfavorable condition. It
should be compared with some standard. Standards of comparison may consist of:
4.3.1 Time Series Analysis
The easiest way to evaluate the performance of a firm is to compare its current ratios with
the past ratios. Such analysis is known as the time series (or trend) analysis. It gives an
indication of the direction of change and reflects whether the firm‘s financial
performance has improved, deteriorated or remained constant over time. The analyst
should not simply determine change, but more importantly, he should understand why
ratios have changed. The change, for example, may be affected by changes in the
accounting policies without a material change in the firm‘s performance.
4.3.2 Pro-forma Analysis
Sometimes future ratios are used as the standard of comparison. Future ratios can be
developed from the projected financial statements. The comparison of current or past
Page 7
158
ratios with future ratios shows the firm‘s relative strengths and weaknesses in the past
and future. If the future ratios indicate weak financial position, corrective actions should
be initiated.
4.3.3 Cross-Sectional Analysis
Another way of comparison is to compare ratios of one firm with some selected firms in
the same industry at the same point in time. This kind of comparison is known as the
cross-sectional analysis. In most cases, it is more useful to compare the firm‘s ratio with
ratio of few carefully selected competitors, who have similar operations. This kind of a
comparison indicates the relative financial position and performance of the firm. A firm
can easily resort to such a comparison, as it is not difficult to get the published financial
statements of the similar firms.
4.3.4 Industry Analysis
To determine the financial condition and performance of a firm, its ratios may be
compared with average ratios of the industry analysis, helps to ascertain the financial
standing and capability of the some point of time to determine the position of company in
the industry.
4.4 TYPES OF RATIOS:
Several ratios, calculate from the accounting data can be grouped into various classes
according to financial activity or function to be evaluated. The ratios can be classified for
the purpose of exposition. Into four broad groups, viz,
Liquidity Ratio: Measure the firms ability to meet current obligations;
Leverage ratios: Show the proportions of debt and equity in financing the firm‘s
acts;
Profitability Ratio: Measure overall performance and effectiveness of the firm;
Activity Ratios; Reflect the firm‘s efficiency in utilizing its assets.
Page 8
159
The present study is based on the profitability ratios which would give a clear idea how
ratios are interrelated with the designing of the firm‘s impact of the industrial policy.
However, the other ratios also directly or indirectly affect to the financial performance of
the FMCG companies.
Accounting ratios are relationship expressed in mathematical terms between figures
which are connected with each other in some manner. Obviously, no purpose will be
served by comparing two sets of figures which are not at all connected with each other.
Moreover, absolute figure are also unfit for comparison.
4.5 CLASSIFICATION OF RATIOS
Ratio can be classified into different categories depending upon the basis of
classification.
The traditional classification has been on the basis of the financial statement to which the
determinants of a ratio belong. On this basis the ratios could be classified as:
1. Profitability ratios,
2. Turnover ratio, and
3. Financial ratio.
4.6 MEANING OF PROFITABILITY RATIOS
Profitability is an indication of the efficiency with which the operations of the business
are carried on. Poor operational performance may indicate poor sales and hence poor
profits. A lower profitability may arise due to the lack of control over the expenses.
Bankers, financial institutions and other creditors look at the profitability ratios as an
indicator whether or not the firm earns sub stability more than it pays interest for the use
of borrowed funds and whether the ultimate repayment of their debts appears reasonably
certain. Owners are interested to know the profitability as it indicates the return which
they can get on their investments.
Page 9
160
Profit is the difference between revenues and expanses over a period of time. Profit is the
ultimate output of a company and it will have no future if it fails to make sufficient
profits. Therefore, the financial manager should continuously evaluate the efficiency of
the company in terms of profit. The Profitability Ratios are calculated to measure the
operating efficiency of the company.
Generally, two major types of profitability ratios calculated
Profitability in relation to sales
Profitability in relation to the investment
The profit is commonly measured by Profit after Tax (PAT) which is the result of the
impact of all factors on the firm‘s earnings. Taxes are not controllable by management.
To separate the influence of taxes Profit before Tax (PBT) may be computed. If the
firm‘s profit has to be examined from the point of view of all the investors the
appropriate measure of profit is operating profit. Operating profit is Earnings before
Interest and Tax (EBIT). This measure of earnings shows earnings arising directly from
the commercial operations of the business without the effect of financing.
Comparative study of Ratios of the selected companies
The study includes the following companies of the FMCG Industry, they are:
1. Britannia, Mumbai.
2. Nirma Limited., Ahmedabad.
3. Dabur India Limited, New Delhi.
4. Colgate- Palmolive (India) Limited, Mumbai
5. Godrej Consumer Product Limited, Mumbai.
6. Procter & Gamble Hygine and Health care Limited, Mumbai.
7. Hindustan Lever/ Unilever Ltd, Mumbai.
Page 10
161
For the Analysis of performance of selected FMCG companies the following ratios
are used:
1. Net Profit Ratio 9. Stock Turnover Ratio
2. Return on Investment Ratio 10. Debtors Turnover Ratio
3. Return on Capital Employed Ratio 11. Working Capital Turnover Ratio
4. Return on Shareholders Fund 12.Inventory to Working Capital Rat
5. Operating Profit Ratio 13. Sales to Fixed Assets Ratio
6. Debt-Equity Ratio 14. Total Assets Turnover Ratio
7. Current Ratio 15. Fixed Assets to Long term Funds Ratio
8. Quick Ratio
These ratios and their trends are used to evaluate performance of selected FMCG
companies. So, these ratios are serving the purpose.
1. NET PROFIT RATIO
The profit margin measures the relationship between profit and sales. The Net Profit
Ratio determines this relationship. This ratio is also known as ―Net Margin‖. It is arrived
at by dividing the Earning after Tax with Sales.
Net Profit Ratio = EAT x 100
Sales
It is indicative of ―Management‘s ability to operate the business with sufficient success
not only to recover from revenues of the period, the cost of merchandises or services, the
expenses of operating the business (including depreciation) and the cost of borrowed
funds, but also to leave a margin of reasonable compensation to the owners for providing
their capital at risk.
Page 11
162
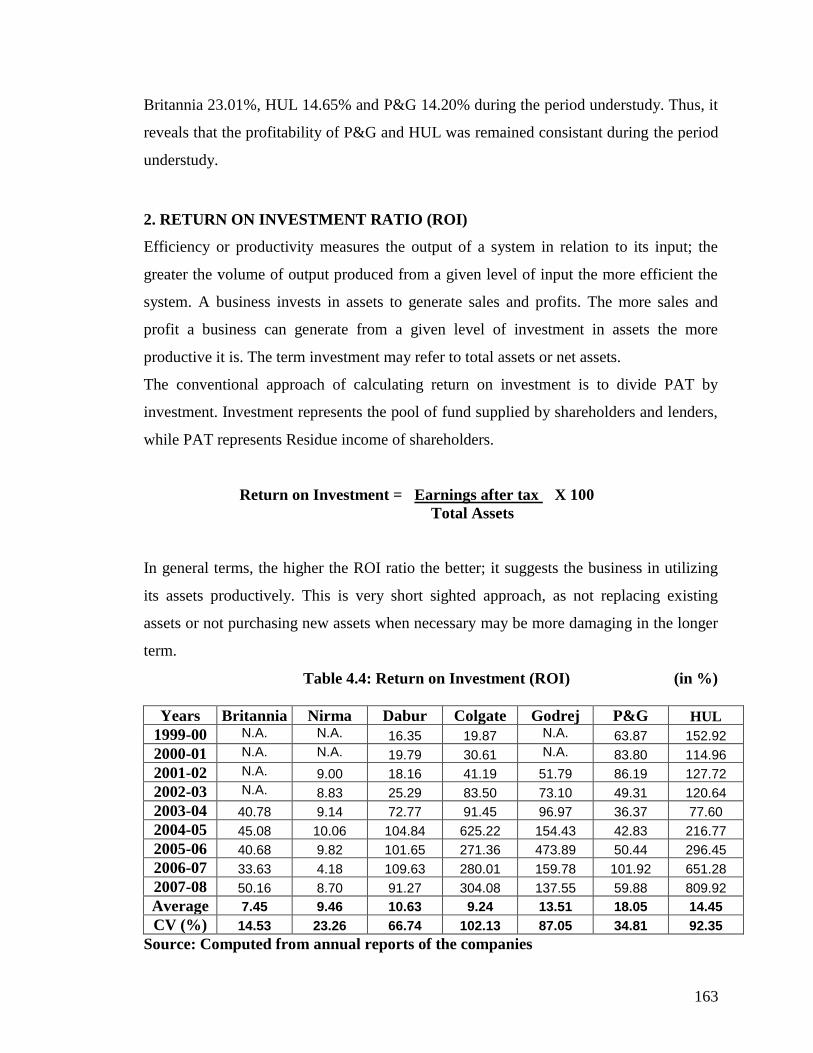
Table 4.3: Net profit Ratio (in %)
Years Britannia Nirma Dabur Colgate Godrej P&G HUL
1999-00 N.A. N.A. 7.80 4.75 N.A. 15.79 12.35
2000-01 N.A. N.A. 7.30 5.31 N.A. 18.45 14.96
2001-02 N.A. 8.14 6.49 6.01 8.16 18.81 17.78
2002-03 N.A. 9.02 7.75 8.39 10.16 15.53 17.48
2003-04 8.08 12.12 9.88 10.36 11.86 15.97 12.06
2004-05 9.21 13.24 11.67 10.56 14.26 18.19 12.73
2005-06 8.05 10.76 13.80 11.30 17.44 23.38 15.33
2006-07 4.64 4.30 15.75 11.56 16.59 16.24 14.04
2007-08 7.30 8.67 15.20 14.92 16.13 20.14 13.31
Average 7.45 9.46 10.62 9.24 13.51 18.05 14.44
CV (%) 23.01 31.18 33.82 36.63 26.15 14.20 14.65
Source: Computed from the annual reports of the companies.
Graph 4.1: Net Profit Ratio (in %)
7.46
9.4710.63
9.24
13.52
18.06
14.45
0.00
2.00
4.00
6.00
8.00
10.00
12.00
14.00
16.00
18.00
20.00
Britannia Nirma Dabur Colgate Godrej P&G HLL/HUL
FMCGs
Table 4.3 represents the NP ratios, average ratios and CV value of selected companies for
the period understudy. The NP ratio highest was 23.38 per cent for P&G in 2005-06 and
lowest was 4.3 per cent for Nirma in 2006-07 among the selected units during the period
of the study. The average NP ratio highest was 18.05 per cent for P&G and lowest was
7.45 per cent for Britannia during the study period. The CV value of the NP ratios highest
was 36.63% for Colgate followed by Dabur 33.82%, Nirma 31.18%, Godrej 26.15%,
Page 12
163
Britannia 23.01%, HUL 14.65% and P&G 14.20% during the period understudy. Thus, it
reveals that the profitability of P&G and HUL was remained consistant during the period
understudy.
2. RETURN ON INVESTMENT RATIO (ROI)
Efficiency or productivity measures the output of a system in relation to its input; the
greater the volume of output produced from a given level of input the more efficient the
system. A business invests in assets to generate sales and profits. The more sales and
profit a business can generate from a given level of investment in assets the more
productive it is. The term investment may refer to total assets or net assets.
The conventional approach of calculating return on investment is to divide PAT by
investment. Investment represents the pool of fund supplied by shareholders and lenders,
while PAT represents Residue income of shareholders.
Return on Investment = Earnings after tax X 100
Total Assets
In general terms, the higher the ROI ratio the better; it suggests the business in utilizing
its assets productively. This is very short sighted approach, as not replacing existing
assets or not purchasing new assets when necessary may be more damaging in the longer
term.
Table 4.4: Return on Investment (ROI) (in %)
Years Britannia Nirma Dabur Colgate Godrej P&G HUL
1999-00 N.A. N.A. 16.35 19.87 N.A. 63.87 152.92
2000-01 N.A. N.A. 19.79 30.61 N.A. 83.80 114.96
2001-02 N.A. 9.00 18.16 41.19 51.79 86.19 127.72
2002-03 N.A. 8.83 25.29 83.50 73.10 49.31 120.64
2003-04 40.78 9.14 72.77 91.45 96.97 36.37 77.60
2004-05 45.08 10.06 104.84 625.22 154.43 42.83 216.77
2005-06 40.68 9.82 101.65 271.36 473.89 50.44 296.45
2006-07 33.63 4.18 109.63 280.01 159.78 101.92 651.28
2007-08 50.16 8.70 91.27 304.08 137.55 59.88 809.92
Average 7.45 9.46 10.63 9.24 13.51 18.05 14.45
CV (%) 14.53 23.26 66.74 102.13 87.05 34.81 92.35
Source: Computed from annual reports of the companies
Page 13
164
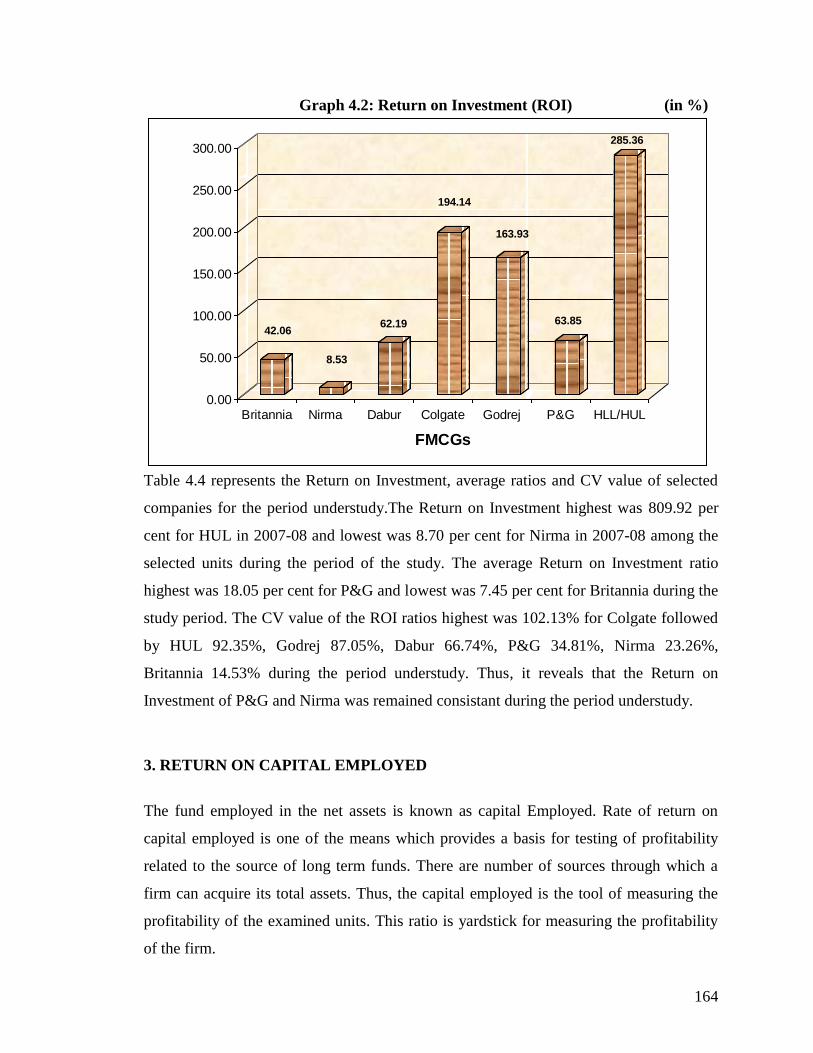
Graph 4.2: Return on Investment (ROI) (in %)
42.06
8.53
62.19
194.14
163.93
63.85
285.36
0.00
50.00
100.00
150.00
200.00
250.00
300.00
Britannia Nirma Dabur Colgate Godrej P&G HLL/HUL
FMCGs
Table 4.4 represents the Return on Investment, average ratios and CV value of selected
companies for the period understudy.The Return on Investment highest was 809.92 per
cent for HUL in 2007-08 and lowest was 8.70 per cent for Nirma in 2007-08 among the
selected units during the period of the study. The average Return on Investment ratio
highest was 18.05 per cent for P&G and lowest was 7.45 per cent for Britannia during the
study period. The CV value of the ROI ratios highest was 102.13% for Colgate followed
by HUL 92.35%, Godrej 87.05%, Dabur 66.74%, P&G 34.81%, Nirma 23.26%,
Britannia 14.53% during the period understudy. Thus, it reveals that the Return on
Investment of P&G and Nirma was remained consistant during the period understudy.
3. RETURN ON CAPITAL EMPLOYED
The fund employed in the net assets is known as capital Employed. Rate of return on
capital employed is one of the means which provides a basis for testing of profitability
related to the source of long term funds. There are number of sources through which a
firm can acquire its total assets. Thus, the capital employed is the tool of measuring the
profitability of the examined units. This ratio is yardstick for measuring the profitability
of the firm.
Page 14
165
Return on Capital Employed = Earning After Tax X 100
Capital Employed
Capital Employed = Owner‟s fund + Secured Loan + Unsecured Loan.
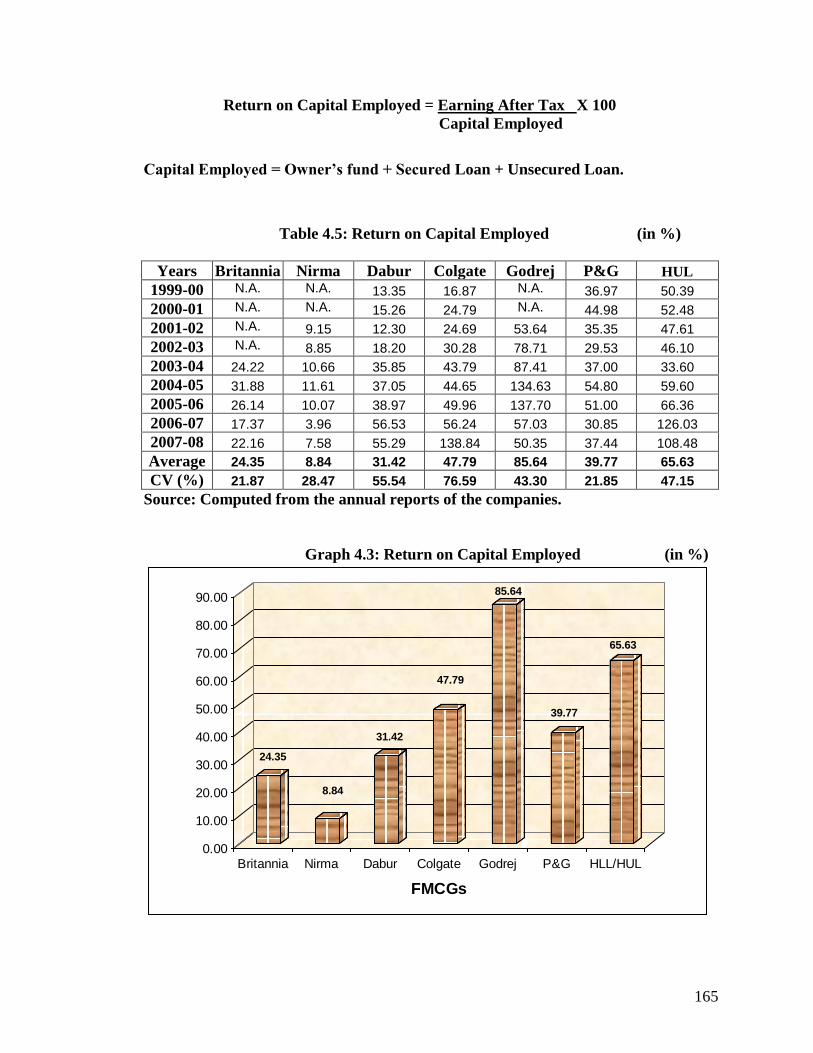
Table 4.5: Return on Capital Employed (in %)
Years Britannia Nirma Dabur Colgate Godrej P&G HUL
1999-00 N.A. N.A. 13.35 16.87 N.A. 36.97 50.39
2000-01 N.A. N.A. 15.26 24.79 N.A. 44.98 52.48
2001-02 N.A. 9.15 12.30 24.69 53.64 35.35 47.61
2002-03 N.A. 8.85 18.20 30.28 78.71 29.53 46.10
2003-04 24.22 10.66 35.85 43.79 87.41 37.00 33.60
2004-05 31.88 11.61 37.05 44.65 134.63 54.80 59.60
2005-06 26.14 10.07 38.97 49.96 137.70 51.00 66.36
2006-07 17.37 3.96 56.53 56.24 57.03 30.85 126.03
2007-08 22.16 7.58 55.29 138.84 50.35 37.44 108.48
Average 24.35 8.84 31.42 47.79 85.64 39.77 65.63
CV (%) 21.87 28.47 55.54 76.59 43.30 21.85 47.15
Source: Computed from the annual reports of the companies.
Graph 4.3: Return on Capital Employed (in %)
24.35
8.84
31.42
47.79
85.64
39.77
65.63
0.00
10.00
20.00
30.00
40.00
50.00
60.00
70.00
80.00
90.00
Britannia Nirma Dabur Colgate Godrej P&G HLL/HUL
FMCGs
Page 15
166
Table 4.5 represents the Return on Capital Employed, average ratios and CV value of
selected companies for the period understudy.The Return on Capital Employed highest
was 138.84 per cent for Colgate in 2007-08 and lowest was 3.96 per cent for Nirma in
2006-07 among the selected units during the period of the study. The average Return on
Capital Employed ratio highest was 85.64 per cent for Godrej and lowest was 8.84 per
cent for Nirma during the study period. The CV value of the Return on Capital Employed
ratios highest was 76.59% for Colgate followed by Dabur 55.54%, HUL 47.15%, Godrej
43.30%, Nirma 28.47%, Britannia 21.87% and P&G 21.85% during the period
understudy. Thus, it reveals that the Return on Capital Employed of P&G and Dabur was
remained consistant during the period understudy.
4. RETURN ON SHAREHOLDER‟S FUNDS
This Ratio expresses the net profit in terms of the equity shareholders funds. This ratio is
an important yardstick of performance for equity shareholders since it indicates the return
on the funds employed by them. However, this measure is based on the historical net
worth and will be high for old plants and for new plants.
The factor which motivates shareholders to invest in a company is the expectation of an
adequate rate of return on their funds and periodically, they will want to assess the rate of
return earned in order to continue with their investment. There are various factors of
measuring the return including the earning yield and dividend yield which are examined
at later stage. This ratio is useful in measuring the rate of return as a percentage of the
book value of shareholders equity.
Return on Shareholder‟s Fund = Net Profit after Interest and Tax X 100
Shareholders Funds
Page 16
167
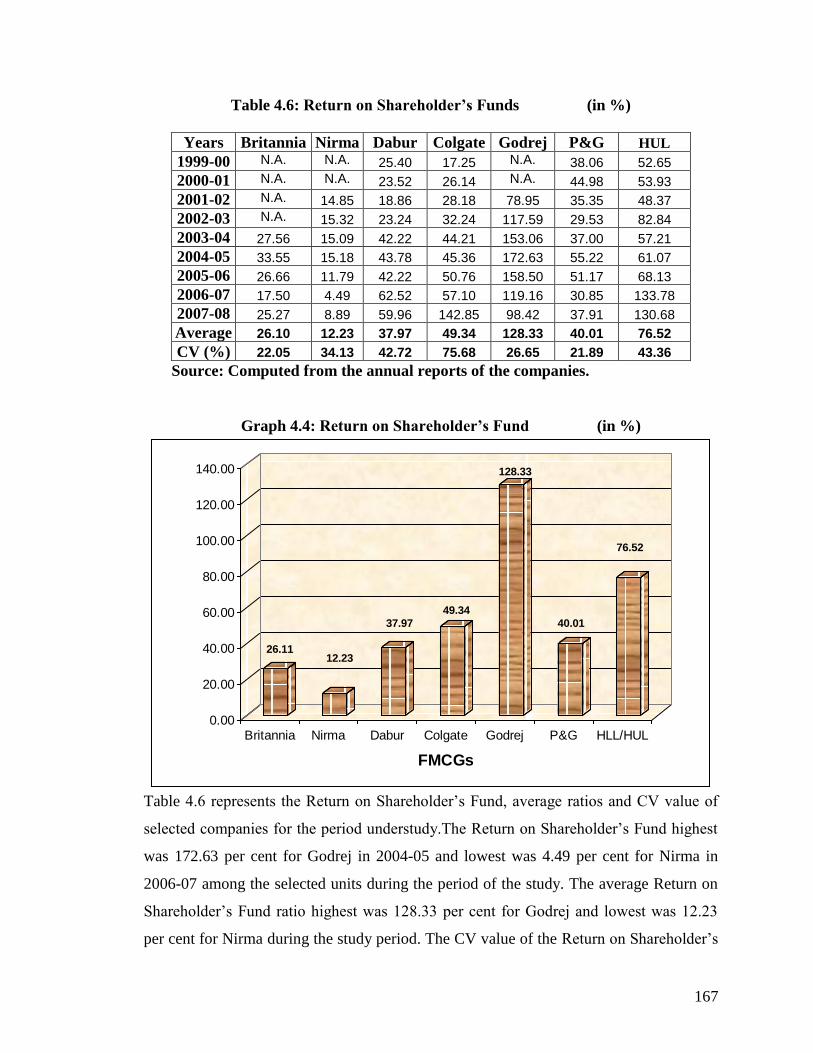
Table 4.6: Return on Shareholder‟s Funds (in %)
Years Britannia Nirma Dabur Colgate Godrej P&G HUL
1999-00 N.A. N.A. 25.40 17.25 N.A. 38.06 52.65
2000-01 N.A. N.A. 23.52 26.14 N.A. 44.98 53.93
2001-02 N.A. 14.85 18.86 28.18 78.95 35.35 48.37
2002-03 N.A. 15.32 23.24 32.24 117.59 29.53 82.84
2003-04 27.56 15.09 42.22 44.21 153.06 37.00 57.21
2004-05 33.55 15.18 43.78 45.36 172.63 55.22 61.07
2005-06 26.66 11.79 42.22 50.76 158.50 51.17 68.13
2006-07 17.50 4.49 62.52 57.10 119.16 30.85 133.78
2007-08 25.27 8.89 59.96 142.85 98.42 37.91 130.68
Average 26.10 12.23 37.97 49.34 128.33 40.01 76.52
CV (%) 22.05 34.13 42.72 75.68 26.65 21.89 43.36
Source: Computed from the annual reports of the companies.
Graph 4.4: Return on Shareholder‟s Fund (in %)
26.1112.23
37.97
49.34
128.33
40.01
76.52
0.00
20.00
40.00
60.00
80.00
100.00
120.00
140.00
Britannia Nirma Dabur Colgate Godrej P&G HLL/HUL
FMCGs
Table 4.6 represents the Return on Shareholder‘s Fund, average ratios and CV value of
selected companies for the period understudy.The Return on Shareholder‘s Fund highest
was 172.63 per cent for Godrej in 2004-05 and lowest was 4.49 per cent for Nirma in
2006-07 among the selected units during the period of the study. The average Return on
Shareholder‘s Fund ratio highest was 128.33 per cent for Godrej and lowest was 12.23
per cent for Nirma during the study period. The CV value of the Return on Shareholder‘s
Page 17
168
Fund ratios highest was 75.68% for Colgate followed by HUL 43.36%, Dabur 42.72%,
Nirma 34.13%, Godrej 26.65%, Britannia 22.05% and P&G 21.89% during the period
understudy. Thus, it reveals that the Return on Investment of P&G and Dabur was
remained consistant during the period understudy.
5. OPERATING PROFIT RATIO
Operating profit ratio is the ratio between operating profit and sales.
Operating profit is the net profit earned from the business for which the concern is
started. It is the excess of net sales over the operating cost. It is the net profit plus non-
operating expenses minus non-operating incomes.
Operating Profit Ratio = Operating profit X 100
Net sales
The operating profit ratio also indicates the operating efficiency or inefficiency of a
business.
The standard operation profit ratio is 10%, so, on operating profit ratio of 10% or more is
an indication of the operating efficiency of the business. An operating profit ratio of less
than 10% is an indication of the operating inefficiency of the business.
Table 4.7: Operating profit ratio (Operating profit margin ratio) (in %)
Years Britannia Nirma Dabur Colgate Godrej P&G HUL
1999-00 N.A. N.A. 7.78 8.25 N.A. 17.18 15.70
2000-01 N.A. N.A. 7.30 8.99 N.A. 21.70 17.71
2001-02 N.A. 18.06 6.49 9.88 12.30 24.81 22.07
2002-03 N.A. 18.84 7.75 13.29 13.29 21.14 22.14
2003-04 13.64 26.17 9.88 14.54 14.01 22.03 15.16
2004-05 15.25 23.71 13.01 76.48 15.54 24.47 14.51
2005-06 11.43 22.30 15.65 15.43 18.97 31.17 15.38
2006-07 5.63 15.20 17.76 14.55 16.87 26.31 15.92
2007-08 9.41 14.42 17.53 81.52 18.43 27.67 14.95
Average 11.07 19.81 11.46 26.99 15.63 24.05 17.06
CV (%) 33.96 22.21 40.02 109.76 16.46 17.07 17.57
Source: Computed from the annual reports of the companies.
Page 18
169
Graph 4.5: Operating Profit Ratio (in %)
10.75
19.81
11.46
26.99
15.63
24.05
17.06
0.00
5.00
10.00
15.00
20.00
25.00
30.00
Britannia Nirma Dabur Colgate Godrej P&G HLL/HUL
FMCGs
Table 4.7 represents the Operating Profit Ratio, average ratios and CV value of selected
companies for the period understudy.The Operating Profit Ratio highest was 81.52 per
cent for Colgate in 2007-08 and lowest was 5.63 per cent for Britannia in 2006-07 among
the selected units during the period of the study. The average Operating Profit Ratio
highest was 26.99 per cent for Colgate and lowest was 11.07 per cent for Britannia during
the study period. The CV value of the Operating Profit Ratio highest was 109.76 for
Colgate followed by Dabur 40.02%, Britannia 33.96%, Nirma 22.21%, HUL 17.57%,
P&G 17.57% and Godrej 17.07% during the period understudy. Thus, it reveals that the
Operating Profit Ratio of Godrej and HUL was remained consistant during the period
understudy.
Page 19
170
6. DEBT- EQUITY RATIO
Debt-equity ratio is the ratio which expresses the relationship between debt and equity.
Debt, generally, refers to long-term liabilities.
Debt / Shareholders‟ Equity
Equity, for the purpose of this ratio, means owners, or proprietors, funds. Owners, fund
comprises capital, all accumulated reserves and profits. Of course, if there are losses and
fictitious assets, they should be adjusted in, i.e., deducted from, the owners, funds.
The standard or ideal debt equity ratio is 2:1. As such, if the debt is less than two times
the equity, the logical conclusion is that the financial structure of the concern is sound,
and so, the stake or risk of the long-term creditors is relatively less. On the other hand, if
the debt is more than two times the equity, the conclusion is that the financial structure of
the undertaking is weak, and so, the stake of the long-term creditors is relatively more.
Table 4.8: Debt- Equity Ratio
Years Britannia Nirma Dabur Colgate Godrej P&G HUL
1999-00 N.A. N.A. 0.90 0.02 N.A. N.A. 0.04
2000-01 N.A. N.A. 0.54 0.05 N.A. N.A. 0.03
2001-02 N.A. 0.62 0.53 0.14 0.47 N.A. 0.02
2002-03 N.A. 0.73 0.28 0.06 0.49 N.A. 0.80
2003-04 0.14 0.42 0.18 0.01 0.75 N.A. 0.70
2004-05 0.05 0.31 0.18 0.02 0.28 N.A. 0.02
2005-06 0.02 0.17 0.08 0.02 0.15 N.A. 0.03
2006-07 0.01 0.13 0.11 0.02 1.09 N.A. 0.06
2007-08 0.14 0.17 0.08 0.03 0.95 N.A. 0.20
Average 0.07 0.36 0.32 0.04 0.59 N.A 0.21
CV (%) 88.61 64.92 87.63 98.39 57.98 N.A 147.61
Source: Computed from the annual reports of the companies.
Note: Here we can‟t get long term liabilities of P&G. Hence we have not obtained
this ratio for said FMCG.
Page 20
171
Graph 4.6: Debt- Equity Ratios
0.07
0.36
0.32
0.04
0.60
0.01
0.21
0
0.1
0.2
0.3
0.4
0.5
0.6
Britania Nirma Dabur Colget Godrej P&G HLL
FMCGs
Table 4.8 represents the Debt-Equity Ratios, average ratios and CV value of selected
companies for the period understudy.The Debt-Equity Ratios highest was 1.09 per cent
for Godrej in 2006-07 and lowest was 0.01 per cent for Britannia in 2006-07 among the
selected units during the period of the study. The average Debt-Equity Ratios highest was
0.59 per cent for Godrej and lowest was 0.04 per cent for Colgate during the study
period. The CV value of the Debt-Equity Ratios highest was 147.61% for HUL followed
by Colgate 98.39%, Britannia 88.61%, Dabur 87.63%, Nirma 64.92% and Godrej
57.98% during the period understudy. Thus, it reveals that the Debt-Equity Ratios of
Colgate and HUL was remained consistant during the period understudy.
Page 21
172
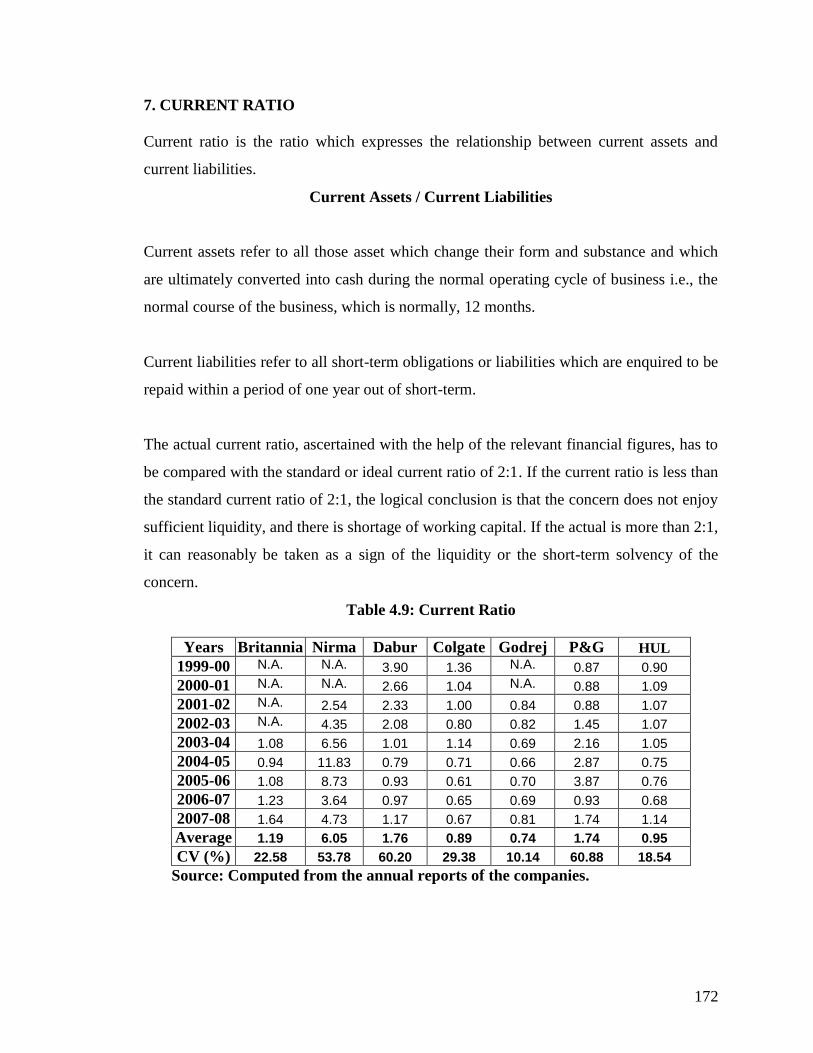
7. CURRENT RATIO
Current ratio is the ratio which expresses the relationship between current assets and
current liabilities.
Current Assets / Current Liabilities
Current assets refer to all those asset which change their form and substance and which
are ultimately converted into cash during the normal operating cycle of business i.e., the
normal course of the business, which is normally, 12 months.
Current liabilities refer to all short-term obligations or liabilities which are enquired to be
repaid within a period of one year out of short-term.
The actual current ratio, ascertained with the help of the relevant financial figures, has to
be compared with the standard or ideal current ratio of 2:1. If the current ratio is less than
the standard current ratio of 2:1, the logical conclusion is that the concern does not enjoy
sufficient liquidity, and there is shortage of working capital. If the actual is more than 2:1,
it can reasonably be taken as a sign of the liquidity or the short-term solvency of the
concern.
Table 4.9: Current Ratio
Years Britannia Nirma Dabur Colgate Godrej P&G HUL
1999-00 N.A. N.A. 3.90 1.36 N.A. 0.87 0.90
2000-01 N.A. N.A. 2.66 1.04 N.A. 0.88 1.09
2001-02 N.A. 2.54 2.33 1.00 0.84 0.88 1.07
2002-03 N.A. 4.35 2.08 0.80 0.82 1.45 1.07
2003-04 1.08 6.56 1.01 1.14 0.69 2.16 1.05
2004-05 0.94 11.83 0.79 0.71 0.66 2.87 0.75
2005-06 1.08 8.73 0.93 0.61 0.70 3.87 0.76
2006-07 1.23 3.64 0.97 0.65 0.69 0.93 0.68
2007-08 1.64 4.73 1.17 0.67 0.81 1.74 1.14
Average 1.19 6.05 1.76 0.89 0.74 1.74 0.95
CV (%) 22.58 53.78 60.20 29.38 10.14 60.88 18.54
Source: Computed from the annual reports of the companies.
Page 22
173
Graph 4.7: Current Ratio
1.19
6.05
1.76
0.89
0.74
1.74
0.95
0.00
1.00
2.00
3.00
4.00
5.00
6.00
7.00
Britannia Nirma Dabur Colgate Godrej P&G HLL/HUL
FMCGs
Table 4.9 represents the Current Ratio, average ratios and CV value of selected
companies for the period understudy.The Current Ratio highest was 11.83 per cent for
Nirma in 2004-05 and lowest was 0.61 per cent for Colgate in 2005-06 among the
selected units during the period of the study. The average Current Ratio highest was 6.05
per cent for Nirma and lowest was 0.74 per cent for Godrej during the study period. The
CV value of the Current Ratio highest was 60.88% for P&G followed by Dabur 60.20%,
Nirma 53.78%, Colgate 29.38%, Britannia (22.58%, HUL 18.54%, and Godrej 10.14%
during the period understudy. Thus, it reveals that the Current Ratio of Godrej and HUL
was remained consistant during the period understudy.
Page 23
174
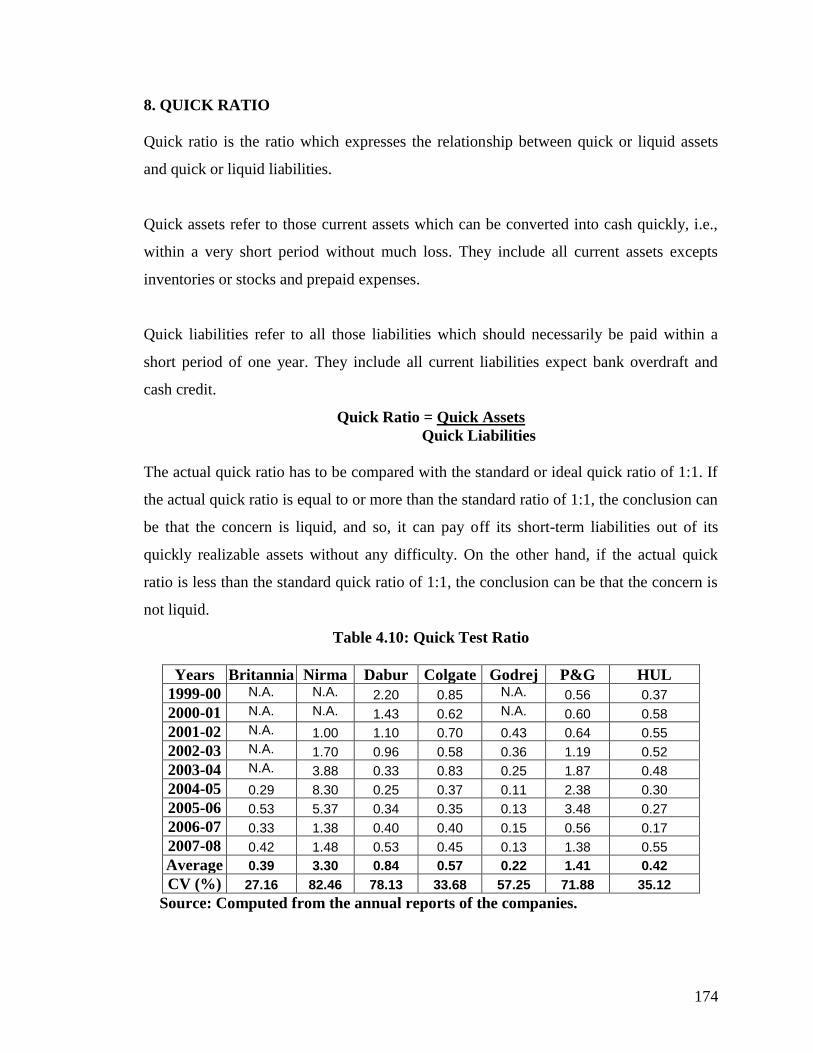
8. QUICK RATIO
Quick ratio is the ratio which expresses the relationship between quick or liquid assets
and quick or liquid liabilities.
Quick assets refer to those current assets which can be converted into cash quickly, i.e.,
within a very short period without much loss. They include all current assets excepts
inventories or stocks and prepaid expenses.
Quick liabilities refer to all those liabilities which should necessarily be paid within a
short period of one year. They include all current liabilities expect bank overdraft and
cash credit.
Quick Ratio = Quick Assets
Quick Liabilities
The actual quick ratio has to be compared with the standard or ideal quick ratio of 1:1. If
the actual quick ratio is equal to or more than the standard ratio of 1:1, the conclusion can
be that the concern is liquid, and so, it can pay off its short-term liabilities out of its
quickly realizable assets without any difficulty. On the other hand, if the actual quick
ratio is less than the standard quick ratio of 1:1, the conclusion can be that the concern is
not liquid.
Table 4.10: Quick Test Ratio
Years Britannia Nirma Dabur Colgate Godrej P&G HUL
1999-00 N.A. N.A. 2.20 0.85 N.A. 0.56 0.37
2000-01 N.A. N.A. 1.43 0.62 N.A. 0.60 0.58
2001-02 N.A. 1.00 1.10 0.70 0.43 0.64 0.55
2002-03 N.A. 1.70 0.96 0.58 0.36 1.19 0.52
2003-04 N.A. 3.88 0.33 0.83 0.25 1.87 0.48
2004-05 0.29 8.30 0.25 0.37 0.11 2.38 0.30
2005-06 0.53 5.37 0.34 0.35 0.13 3.48 0.27
2006-07 0.33 1.38 0.40 0.40 0.15 0.56 0.17
2007-08 0.42 1.48 0.53 0.45 0.13 1.38 0.55
Average 0.39 3.30 0.84 0.57 0.22 1.41 0.42
CV (%) 27.16 82.46 78.13 33.68 57.25 71.88 35.12
Source: Computed from the annual reports of the companies.
Page 24
175
Graph 4.8: Quick Test Ratio
0.39
3.30
0.84
0.57
0.22
1.41
0.42
0.00
0.50
1.00
1.50
2.00
2.50
3.00
3.50
Britannia Nirma Dabur Colgate Godrej P&G HLL/HUL
FMCGs
Table 4.10 represents the Quick Ratio, average ratios and CV value of selected
companies for the period understudy.The Quick Ratio highest was 8.30 per cent for
Nirma in 2004-05 and lowest was 0.11 per cent for Godrej in 2004-05 among the selected
units during the period of the study. The average Quick Ratio highest was 3.30 per cent
for Nirma and lowest was 0.22 per cent for Godrej during the study period. The CV value
of the Quick Ratio highest was 82.46% for Nirma followed by Dabur 78.13%, P&G
71.88%, Godrej 57.25%, HUL 35.12%, Colgate 33.68% and Britannia 27.16% during the
period understudy. Thus, it reveals that the Quick Ratio of Colgate and Dabur was
remained consistant during the period understudy.
Page 25
176
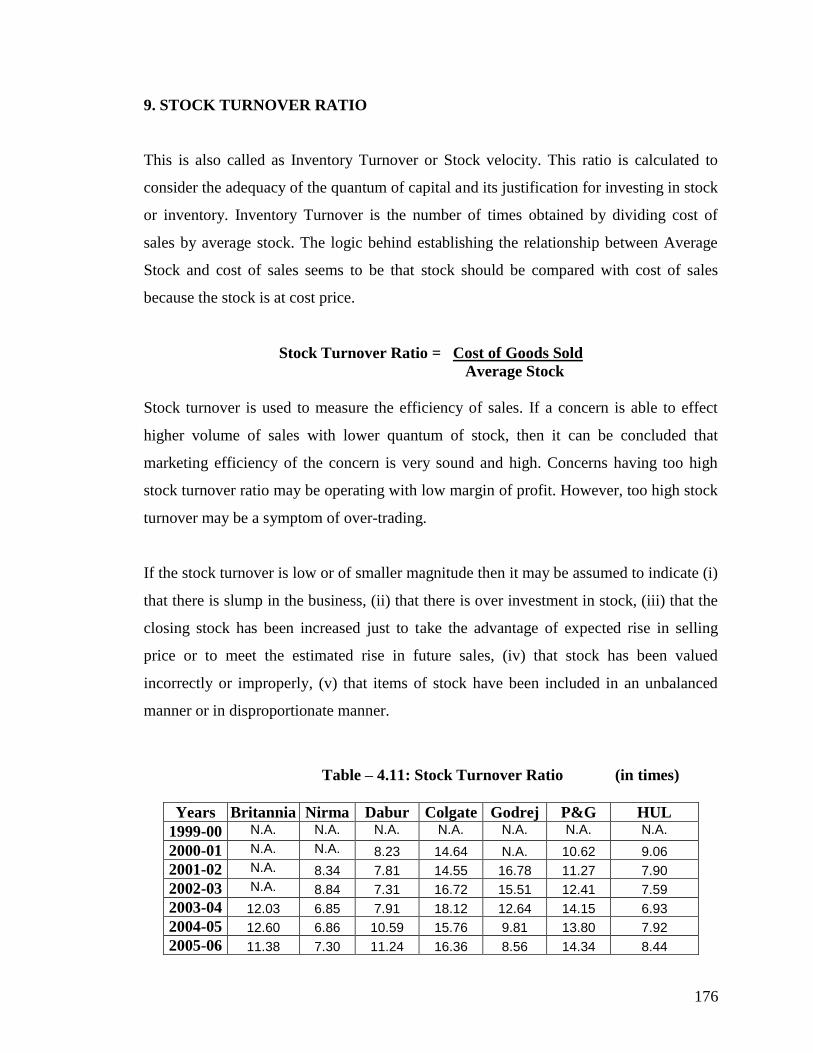
9. STOCK TURNOVER RATIO
This is also called as Inventory Turnover or Stock velocity. This ratio is calculated to
consider the adequacy of the quantum of capital and its justification for investing in stock
or inventory. Inventory Turnover is the number of times obtained by dividing cost of
sales by average stock. The logic behind establishing the relationship between Average
Stock and cost of sales seems to be that stock should be compared with cost of sales
because the stock is at cost price.
Stock Turnover Ratio = Cost of Goods Sold
Average Stock
Stock turnover is used to measure the efficiency of sales. If a concern is able to effect
higher volume of sales with lower quantum of stock, then it can be concluded that
marketing efficiency of the concern is very sound and high. Concerns having too high
stock turnover ratio may be operating with low margin of profit. However, too high stock
turnover may be a symptom of over-trading.
If the stock turnover is low or of smaller magnitude then it may be assumed to indicate (i)
that there is slump in the business, (ii) that there is over investment in stock, (iii) that the
closing stock has been increased just to take the advantage of expected rise in selling
price or to meet the estimated rise in future sales, (iv) that stock has been valued
incorrectly or improperly, (v) that items of stock have been included in an unbalanced
manner or in disproportionate manner.
Table – 4.11: Stock Turnover Ratio (in times)
Years Britannia Nirma Dabur Colgate Godrej P&G HUL
1999-00 N.A. N.A. N.A. N.A. N.A. N.A. N.A.
2000-01 N.A. N.A. 8.23 14.64 N.A. 10.62 9.06
2001-02 N.A. 8.34 7.81 14.55 16.78 11.27 7.90
2002-03 N.A. 8.84 7.31 16.72 15.51 12.41 7.59
2003-04 12.03 6.85 7.91 18.12 12.64 14.15 6.93
2004-05 12.60 6.86 10.59 15.76 9.81 13.80 7.92
2005-06 11.38 7.30 11.24 16.36 8.56 14.34 8.44
Page 26
177
2006-07 11.58 6.39 11.73 17.91 7.77 18.53 7.84
2007-08 10.14 4.73 11.62 19.92 6.51 16.76 9.03
Average 11.55 7.04 9.55 16.75 11.08 13.98 8.09
CV (%) 7.93 19.07 19.96 10.99 35.78 19.06 8.95
Source: Computed from the annual reports of the companies.
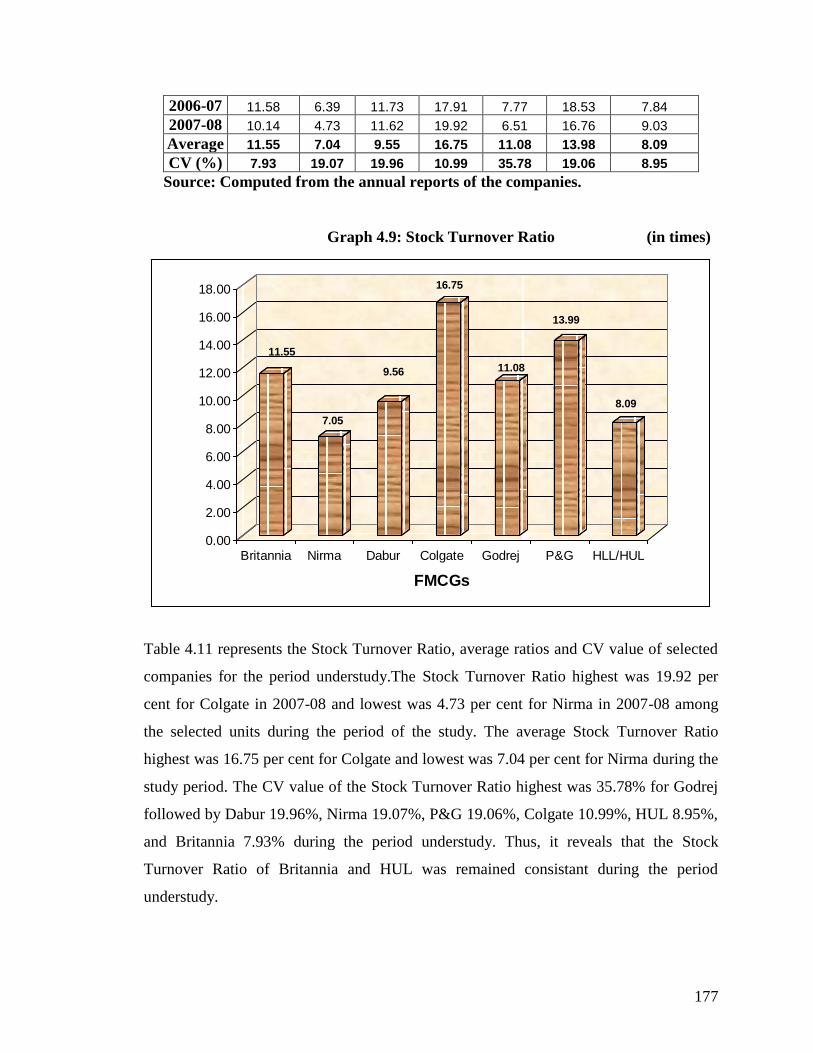
Graph 4.9: Stock Turnover Ratio (in times)
11.55
7.05
9.56
16.75
11.08
13.99
8.09
0.00
2.00
4.00
6.00
8.00
10.00
12.00
14.00
16.00
18.00
Britannia Nirma Dabur Colgate Godrej P&G HLL/HUL
FMCGs
Table 4.11 represents the Stock Turnover Ratio, average ratios and CV value of selected
companies for the period understudy.The Stock Turnover Ratio highest was 19.92 per
cent for Colgate in 2007-08 and lowest was 4.73 per cent for Nirma in 2007-08 among
the selected units during the period of the study. The average Stock Turnover Ratio
highest was 16.75 per cent for Colgate and lowest was 7.04 per cent for Nirma during the
study period. The CV value of the Stock Turnover Ratio highest was 35.78% for Godrej
followed by Dabur 19.96%, Nirma 19.07%, P&G 19.06%, Colgate 10.99%, HUL 8.95%,
and Britannia 7.93% during the period understudy. Thus, it reveals that the Stock
Turnover Ratio of Britannia and HUL was remained consistant during the period
understudy.
Page 27
178
10. DEBTORS‟ TURNOVER RATIO
Receivables or debtors constitute an important item of current assets. That means the
quality of debtors determines the liquidity of the firm to a great extent. To judge the
quality of the debtors‘ the receivables turnover ratio, debtors‘ turnover ratio or debtors‘
velocity is used.
Debtors‘ turnover ratios are the ratio which indicates the relationship between debtors
and sales. It is the ratio which indicates the number of times the debts are collected in a
year.
Debtors‟ Turnover Ratio= Net annual credit sales
Average debtors (i.e., average debtors and
bills receivables)
Or
Debt Collection Period Ratio = Number of days in a year, (i.e., 365days or 360 days)
Debtor‟ Turnover
The collection period, as calculate above, is compared with the credit period allowed, and
conclusions are drawn. If the actual period of credit allowed is more than the normal
period of credit or the ideal period of credit, viz., 30 days, the indication is that credit
collection is not efficient. On the other hand, if the actual period of credit allowed is less
than the normal period of credit or the ideal period of credit, the indication is that credit
collection is efficient.
Table – 4.12: Debtor‟s turnover ratio (in times)
Years Britannia Nirma Dabur Colgate Godrej P&G HUL
1999-00 N.A. N.A. 8.82 24.96 N.A. 22.93 40.09
2000-01 N.A. N.A. 9.05 19.90 N.A. 15.16 27.68
2001-02 N.A. 14.05 9.83 20.36 23.55 12.45 23.74
2002-03 N.A. 15.00 15.53 28.69 30.03 9.62 21.12
2003-04 73.90 11.46 25.13 41.71 59.33 12.45 19.62
2004-05 35.80 10.37 33.29 90.03 103.17 26.22 22.97
2005-06 87.20 9.87 31.16 154.09 84.81 50.98 27.39
2006-07 81.00 11.29 19.83 149.68 72.44 39.52 27.99
2007-08 56.50 12.25 19.06 58.79 75.26 38.32 50.51
Average 66.88 12.04 19.08 65.36 64.08 25.29 29.01
CV (%) 31.14 15.63 48.65 82.51 44.94 57.91 34.58
Source: Computed from the annual reports of the companies.
Page 28
179
Graph 4.10: Debtor‟s Turnover Ratio (in times)
66.88
12.04
19.08
65.3664.08
25.30
29.01
0.00
10.00
20.00
30.00
40.00
50.00
60.00
70.00
Britannia Nirma Dabur Colgate Godrej P&G HLL/HUL
FMCGs
Table 4.12 represents the Debtor‘s Turnover Ratio, average ratios and CV value of
selected companies for the period understudy.The Debtor‘s Turnover Ratio highest was
154.09 per cent for Colgate in 2005-06 and lowest was 8.82 per cent for Dabur in 1999-
00 among the selected units during the period of the study. The average Debtor‘s
Turnover Ratio highest was 66.88 per cent for Britannia and lowest was 12.04 per cent
for Nirma during the study period. The CV value of the Debtor‘s Turnover Ratio highest
was 82.51% for Colgate followed by P&G 57.91%, Dabur 48.65%, Godrej 44.94%, HUL
34.58%, Britannia 31.14%)and Nirma 15.63% during the period understudy. Thus, it
reveals that the Debtor‘s Turnover Ratio of Colgate and HUL was remained consistant
during the period understudy.
Page 29
180
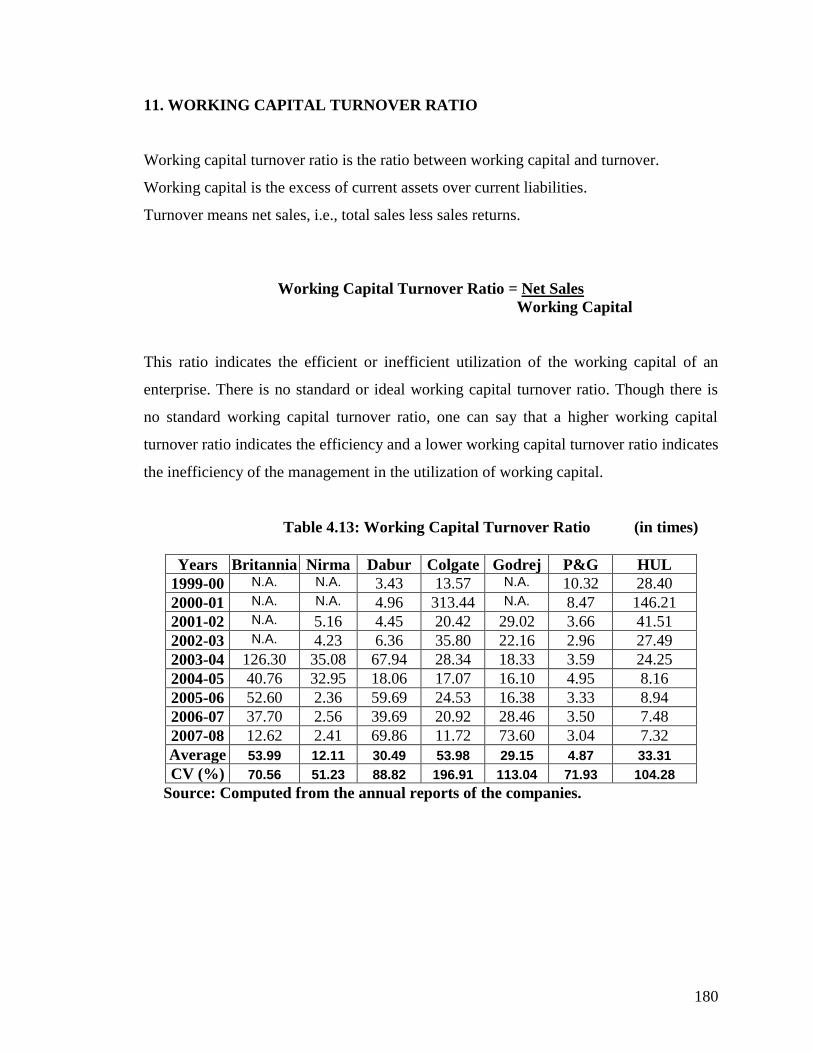
11. WORKING CAPITAL TURNOVER RATIO
Working capital turnover ratio is the ratio between working capital and turnover.
Working capital is the excess of current assets over current liabilities.
Turnover means net sales, i.e., total sales less sales returns.
Working Capital Turnover Ratio = Net Sales
Working Capital
This ratio indicates the efficient or inefficient utilization of the working capital of an
enterprise. There is no standard or ideal working capital turnover ratio. Though there is
no standard working capital turnover ratio, one can say that a higher working capital
turnover ratio indicates the efficiency and a lower working capital turnover ratio indicates
the inefficiency of the management in the utilization of working capital.
Table 4.13: Working Capital Turnover Ratio (in times)
Years Britannia Nirma Dabur Colgate Godrej P&G HUL
1999-00 N.A. N.A. 3.43 13.57 N.A. 10.32 28.40
2000-01 N.A. N.A. 4.96 313.44 N.A. 8.47 146.21
2001-02 N.A. 5.16 4.45 20.42 29.02 3.66 41.51
2002-03 N.A. 4.23 6.36 35.80 22.16 2.96 27.49
2003-04 126.30 35.08 67.94 28.34 18.33 3.59 24.25
2004-05 40.76 32.95 18.06 17.07 16.10 4.95 8.16
2005-06 52.60 2.36 59.69 24.53 16.38 3.33 8.94
2006-07 37.70 2.56 39.69 20.92 28.46 3.50 7.48
2007-08 12.62 2.41 69.86 11.72 73.60 3.04 7.32
Average 53.99 12.11 30.49 53.98 29.15 4.87 33.31
CV (%) 70.56 51.23 88.82 196.91 113.04 71.93 104.28
Source: Computed from the annual reports of the companies.
Page 30
181
Graph 4.11: Working Capital Turnover Ratio (in times)
54.00
3.34
30.49
53.98
29.15
4.87
36.56
0
10
20
30
40
50
60
Britania Nirma Dabur Colget Godrej P&G HLL
FMCGs
Table 4.13 represents the Working Capital Turnover Ratio, average ratios and CV value
of selected companies for the period understudy.The Working Capital Turnover Ratio
highest was 313.44 per cent for Colgate in 2000-01 and lowest was 2.36 per cent for
Nirma in 2005-06 among the selected units during the period of the study. The average
Working Capital Turnover Ratio highest was 53.99 per cent for Britannia and lowest was
4.87 per cent for P&G during the study period. The CV value of the Working Capital
Turnover Ratio highest was 196.91% for Colgate followed by Godrej 113.04%, HUL
104.28%, Dabur 88.82%, P&G 71.93%, Britannia 70.56% and Nirma 51.23% during the
period understudy. Thus, it reveals that the Working Capital Turnover Ratio of P&G and
Nirma was remained consistant during the period understudy.
Page 31
182
12. INVENTORY TO WORKING CAPITAL RATIO
Inventory to working capital ratio is the ratio of inventory to working capital.
Inventory or stock refers to closing stocks of raw materials, work-in-progress and
finished goods.
Working capital is the excess of current assets over current liabilities.
Inventory to working capital ratio= Inventory x100
Working capital
As per the standard or ideal inventory to working capital ratio, the inventories should not
absorb more than 75% of the working capital. As such a low inventory to working capital
ratio( i.e., a ratio of less than 75%) indicates under stocking, and so, a high liquid
position, while a high inventory to working capital ratio(i.e., a ratio over 75%) indicates
overstocking, and so, a low liquid position.
Table 4.14: Inventory to Working Capital Ratio (in %)
Years Britannia Nirma Dabur Colgate Godrej P&G HUL
1999-00 N.A. N.A. 47.46 92.54 N.A. 97.86 316.60
2000-01 N.A. N.A. 59.18 2302.21 N.A. 74.32 1652.45
2001-02 N.A. 61.88 60.68 128.59 172.89 29.84 533.19
2002-03 N.A. 48.05 92.15 180.59 156.98 25.20 377.60
2003-04 1072.50 13.81 659.88 167.76 164.90 27.59 359.26
2004-05 344.59 12.50 182.22 118.53 196.91 39.68 97.53
2005-06 568.42 32.37 503.79 149.79 208.07 15.82 114.36
2006-07 368.43 48.95 390.23 121.28 418.77 19.84 106.55
2007-08 147.24 57.75 674.50 57.08 1322.16 21.63 1383.04
Average 500.24 39.33 296.67 368.71 377.24 39.08 548.95
CV (%) 18.75 10.45 19.53 32.48 23.34 34.97 18.16
Source: Computed from the annual reports of the companies.
Page 32
183
Graph 4.12: Inventory to Working Capital Ratio (in %)
500.23
39.33
296.68
368.71 377.24
39.09
548.95
0.00
100.00
200.00
300.00
400.00
500.00
600.00
Britannia Nirma Dabur Colgate Godrej P&G HLL/HUL
FMCGs
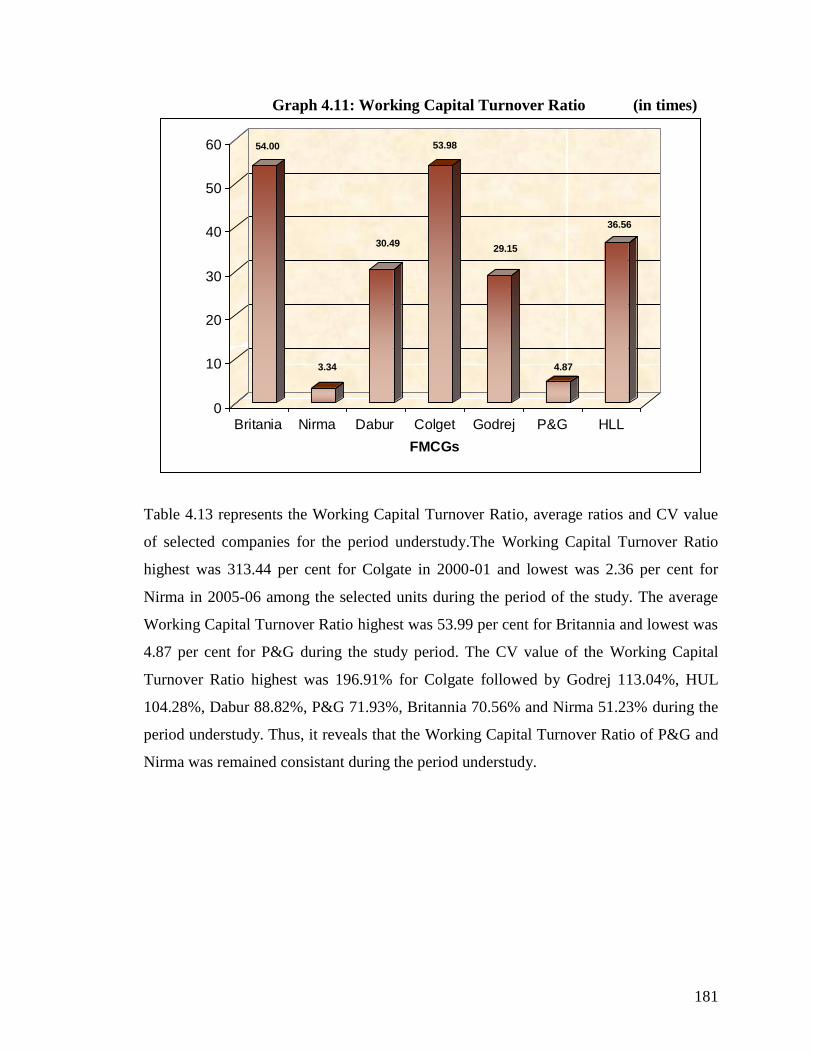
Table 4.14 represents the Inventory to Working Capital Ratio, average ratios and CV
value of selected companies for the period understudy.The Inventory to Working Capital
Ratio highest was 2302.21 per cent for Colgate in 2000-01 and lowest was 12.50 per cent
for Nirma in 2004-05 among the selected units during the period of the study. The
average Inventory to Working Capital Ratio highest was 548.95 per cent for HUL and
lowest was 39.08 per cent for P&G during the study period. The CV value of the
Inventory to Working Capital Ratio highest was 34.97% for P&G followed by Colgate
32.48%, Godrej 23.34%, Dabur 19.53%, Britannia 18.75%, HUL 18.16%, and Nirma
10.45% during the period understudy. Thus, it reveals that the Inventory to Working
Capital Ratio of P&G and Nirma was remained consistant during the period understudy.
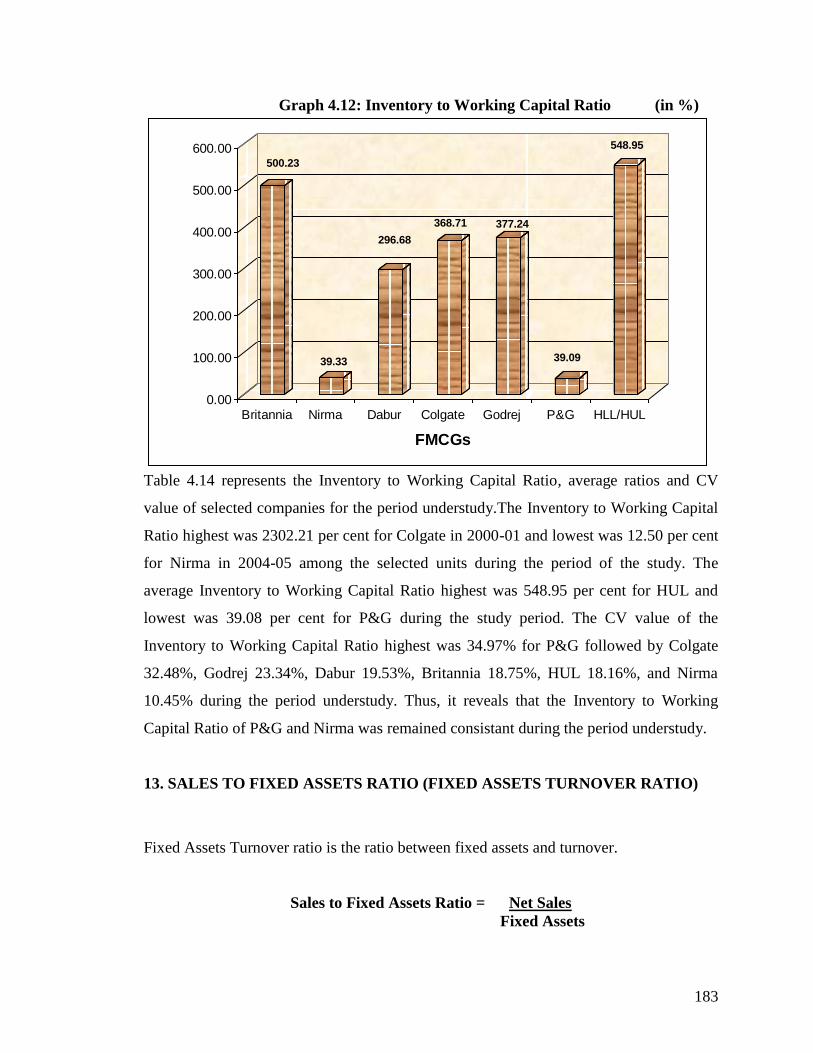
13. SALES TO FIXED ASSETS RATIO (FIXED ASSETS TURNOVER RATIO)
Fixed Assets Turnover ratio is the ratio between fixed assets and turnover.
Sales to Fixed Assets Ratio = Net Sales
Fixed Assets
Page 33
184
This ratio indicates as to what extent the fixed assets of a concern have contributed to
sales. In other words, it indicates as to what extent the fixed assets have been utilized.
The standard fixed assets turnover ratio is 5 times. So, fixed assets turnover ratio of 5
times or more indicates better utilization of fixed assets.
In this context, it may be noted that a very high fixed assets turnover ratio means under-
trading, which is not good for the business.
Table 4.15: Sales to Fixed Assets Ratio
(In times)
Years Britannia Nirma Dabur Colgate Godrej P&G HUL
1999-00 N.A. N.A. 4.16 5.24 N.A. 3.48 9.88
2000-01 N.A. N.A. 4.80 6.03 N.A. 3.88 9.07
2001-02 N.A. 1.27 4.76 6.84 5.52 3.84 8.19
2002-03 N.A. 1.14 6.02 6.77 6.00 5.90 7.83
2003-04 11.54 1.00 7.41 11.61 5.42 7.20 6.98
2004-05 16.84 1.14 6.62 13.45 5.99 8.66 7.98
2005-06 12.93 1.28 6.89 7.61 9.50 9.13 8.64
2006-07 11.68 1.24 6.70 8.26 5.38 5.88 9.01
2007-08 10.86 1.39 7.08 8.11 5.94 5.30 12.60
Average 12.77 1.21 6.05 8.21 6.25 5.92 8.91
CV (%) 9.34 9.20 28.22 36.71 36.39 17.18 50.51
Source: Computed from the annual reports of the companies.
Graph 4.13: Sales to Fixed Assets Ratio (in times)
12.77
1.21
6.05
8.21
6.25 5.92
8.91
0.00
2.00
4.00
6.00
8.00
10.00
12.00
14.00
Britannia Nirma Dabur Colgate Godrej P&G HLL/HUL
FMCGs
Page 34
185
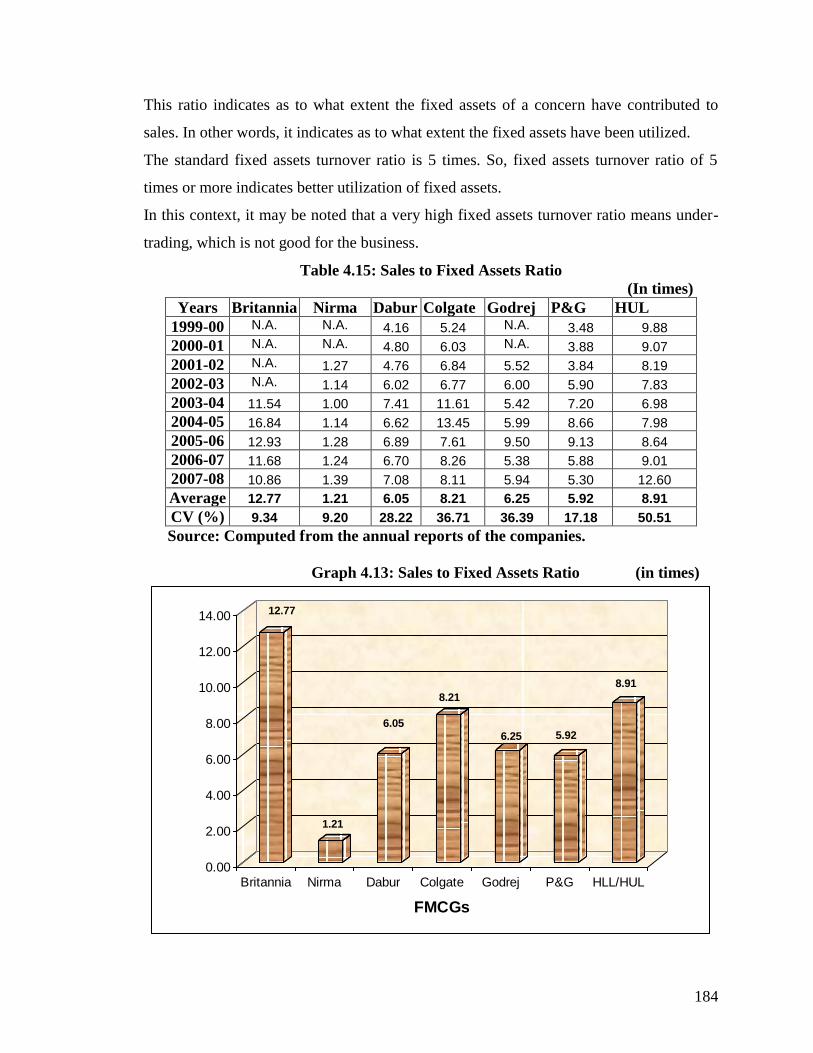
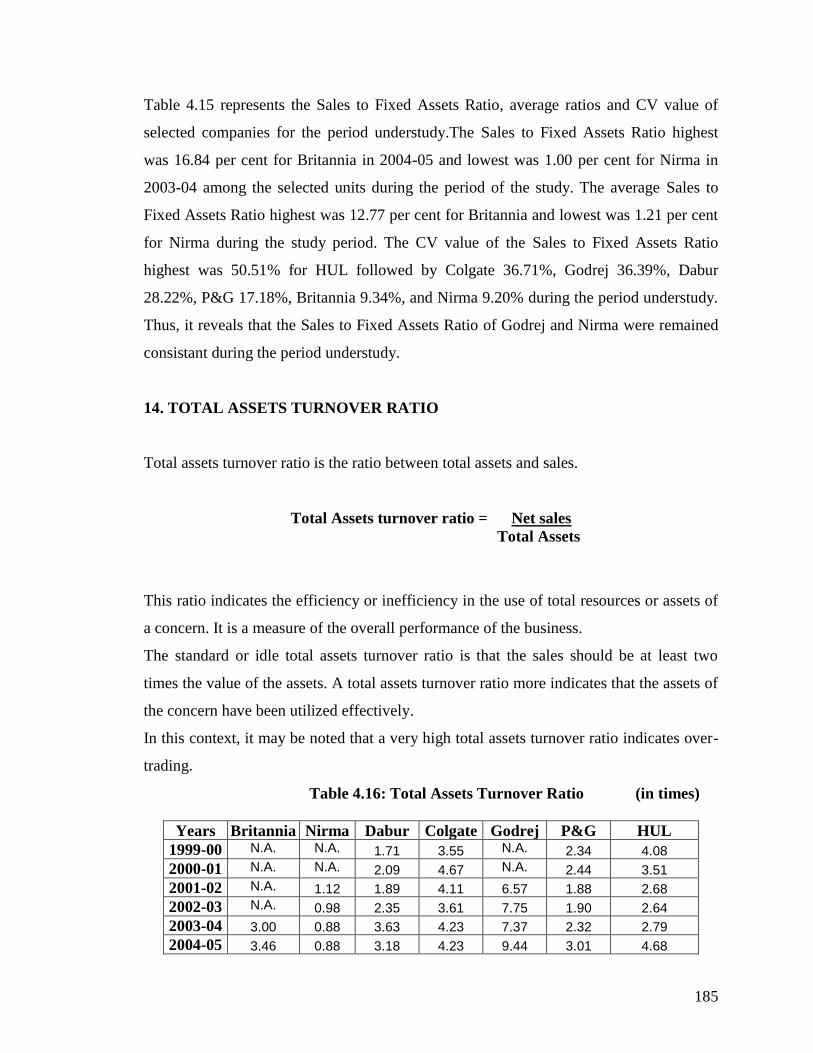
Table 4.15 represents the Sales to Fixed Assets Ratio, average ratios and CV value of
selected companies for the period understudy.The Sales to Fixed Assets Ratio highest
was 16.84 per cent for Britannia in 2004-05 and lowest was 1.00 per cent for Nirma in
2003-04 among the selected units during the period of the study. The average Sales to
Fixed Assets Ratio highest was 12.77 per cent for Britannia and lowest was 1.21 per cent
for Nirma during the study period. The CV value of the Sales to Fixed Assets Ratio
highest was 50.51% for HUL followed by Colgate 36.71%, Godrej 36.39%, Dabur
28.22%, P&G 17.18%, Britannia 9.34%, and Nirma 9.20% during the period understudy.
Thus, it reveals that the Sales to Fixed Assets Ratio of Godrej and Nirma were remained
consistant during the period understudy.
14. TOTAL ASSETS TURNOVER RATIO
Total assets turnover ratio is the ratio between total assets and sales.
Total Assets turnover ratio = Net sales
Total Assets
This ratio indicates the efficiency or inefficiency in the use of total resources or assets of
a concern. It is a measure of the overall performance of the business.
The standard or idle total assets turnover ratio is that the sales should be at least two
times the value of the assets. A total assets turnover ratio more indicates that the assets of
the concern have been utilized effectively.
In this context, it may be noted that a very high total assets turnover ratio indicates over-
trading.
Table 4.16: Total Assets Turnover Ratio (in times)
Years Britannia Nirma Dabur Colgate Godrej P&G HUL
1999-00 N.A. N.A. 1.71 3.55 N.A. 2.34 4.08
2000-01 N.A. N.A. 2.09 4.67 N.A. 2.44 3.51
2001-02 N.A. 1.12 1.89 4.11 6.57 1.88 2.68
2002-03 N.A. 0.98 2.35 3.61 7.75 1.90 2.64
2003-04 3.00 0.88 3.63 4.23 7.37 2.32 2.79
2004-05 3.46 0.88 3.18 4.23 9.44 3.01 4.68
Page 35
186
2005-06 3.25 0.94 2.82 4.42 7.89 2.18 4.33
2006-07 3.74 0.92 3.59 4.86 3.44 1.90 8.98
2007-08 3.04 0.88 3.64 9.31 3.12 1.86 8.15
Average 3.29 0.94 2.76 4.77 6.51 2.20 4.65
CV (%) 16.42 26.24 16.12 30.27 28.84 44.89 45.15
Source: Computed from annual reports of the companies
Graph 4.14: Total Assets Turnover Ratio (in times)
3.30
0.94
2.77
4.78
6.51
2.20
4.65
0.00
1.00
2.00
3.00
4.00
5.00
6.00
7.00
Britannia Nirma Dabur Colgate Godrej P&G HLL/HUL
FMCGs
Table 4.16 represents the Total Assets Turnover Ratio, average ratios and CV value of
selected companies for the period understudy.The Total Assets Turnover Ratio highest
was 9.44 per cent for Godrej in 2005-06 and lowest was 0.88 per cent for Nirma in 2007-
08 among the selected units during the period of the study. The average Total Assets
Turnover Ratio highest was 6.51 per cent for Godrej and lowest was 0.94 per cent for
Nirma during the study period. The CV value of the Total Assets Turnover Ratio highest
was 45.15% for HUL followed by P&G 44.89%, Colgate 30.27%, Godrej 28.84%, Nirma
26.24%, Britannia 16.42% and Dabur 16.12% during the period understudy. Thus, it
reveals that the Total Assets Turnover Ratio Britannia and Nirma were remained
consistant during the period understudy.
Page 36
187
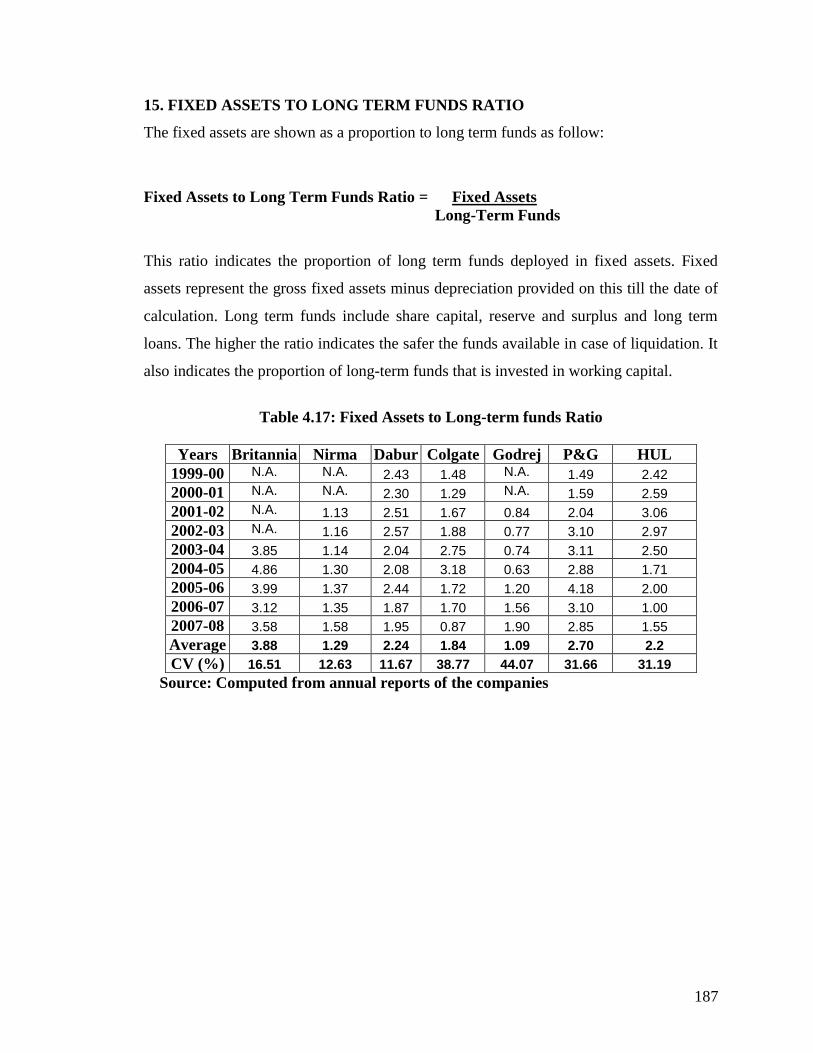
15. FIXED ASSETS TO LONG TERM FUNDS RATIO
The fixed assets are shown as a proportion to long term funds as follow:
Fixed Assets to Long Term Funds Ratio = Fixed Assets
Long-Term Funds
This ratio indicates the proportion of long term funds deployed in fixed assets. Fixed
assets represent the gross fixed assets minus depreciation provided on this till the date of
calculation. Long term funds include share capital, reserve and surplus and long term
loans. The higher the ratio indicates the safer the funds available in case of liquidation. It
also indicates the proportion of long-term funds that is invested in working capital.
Table 4.17: Fixed Assets to Long-term funds Ratio
Years Britannia Nirma Dabur Colgate Godrej P&G HUL
1999-00 N.A. N.A. 2.43 1.48 N.A. 1.49 2.42
2000-01 N.A. N.A. 2.30 1.29 N.A. 1.59 2.59
2001-02 N.A. 1.13 2.51 1.67 0.84 2.04 3.06
2002-03 N.A. 1.16 2.57 1.88 0.77 3.10 2.97
2003-04 3.85 1.14 2.04 2.75 0.74 3.11 2.50
2004-05 4.86 1.30 2.08 3.18 0.63 2.88 1.71
2005-06 3.99 1.37 2.44 1.72 1.20 4.18 2.00
2006-07 3.12 1.35 1.87 1.70 1.56 3.10 1.00
2007-08 3.58 1.58 1.95 0.87 1.90 2.85 1.55
Average 3.88 1.29 2.24 1.84 1.09 2.70 2.2
CV (%) 16.51 12.63 11.67 38.77 44.07 31.66 31.19
Source: Computed from annual reports of the companies
Page 37
188
Graph 4.15: Fixed Assets to Long-term funds Ratio
3.88
1.10
2.24
1.84
1.09
2.70
2.28
0
0.5
1
1.5
2
2.5
3
3.5
4
Britania Nirma Dabur Colget Godrej P&G HLL
FMCGs
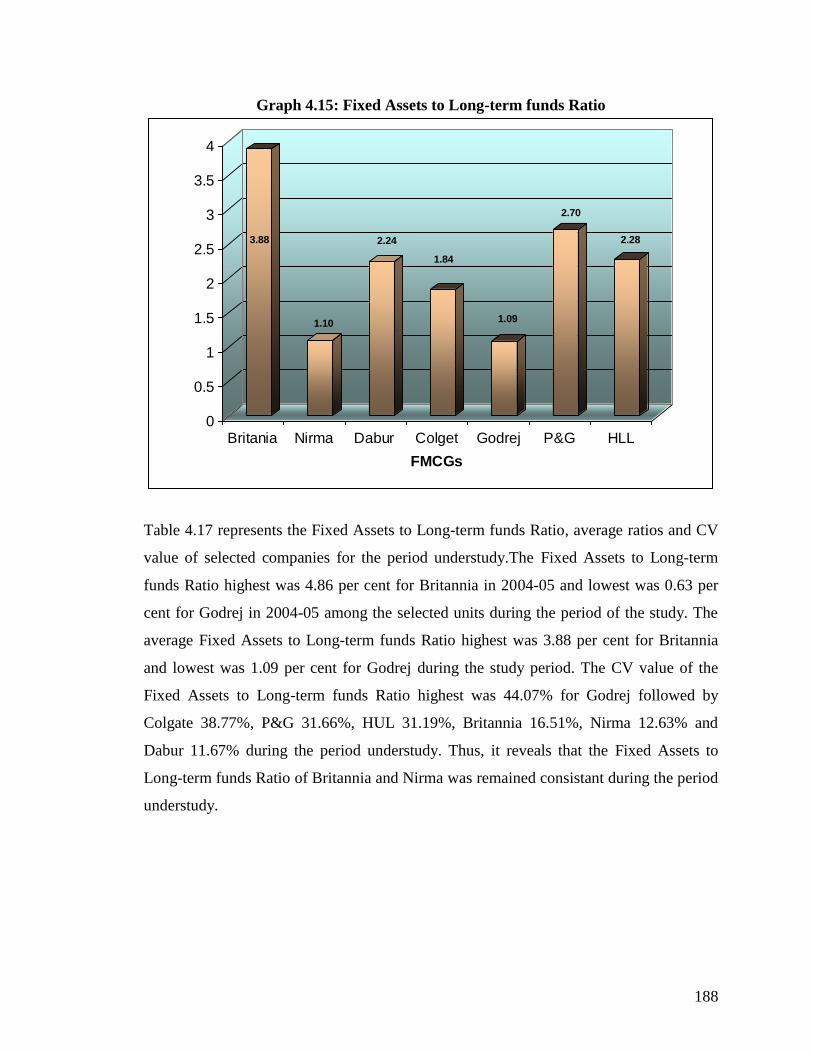
Table 4.17 represents the Fixed Assets to Long-term funds Ratio, average ratios and CV
value of selected companies for the period understudy.The Fixed Assets to Long-term
funds Ratio highest was 4.86 per cent for Britannia in 2004-05 and lowest was 0.63 per
cent for Godrej in 2004-05 among the selected units during the period of the study. The
average Fixed Assets to Long-term funds Ratio highest was 3.88 per cent for Britannia
and lowest was 1.09 per cent for Godrej during the study period. The CV value of the
Fixed Assets to Long-term funds Ratio highest was 44.07% for Godrej followed by
Colgate 38.77%, P&G 31.66%, HUL 31.19%, Britannia 16.51%, Nirma 12.63% and
Dabur 11.67% during the period understudy. Thus, it reveals that the Fixed Assets to
Long-term funds Ratio of Britannia and Nirma was remained consistant during the period
understudy.