Chapter D Coal Resource Availability, Recoverability, and Economic Evaluations in the United States—A Summary By James A. Luppens, 1 Timothy J. Rohrbacher, 2 Lee M. Osmonson, 2 and M. Devereux Carter 1 U.S. Geological Survey Professional Paper 1625–F U.S. Department of the Interior U.S. Geological Survey Chapter D of The National Coal Resource Assessment Overview Edited by Brenda S. Pierce and Kristin O. Dennen 1 U.S. Geological Survey, 12201 Sunrise Valley Drive, National Center, MS 956, Reston, Virginia 20192 2 U.S. Geological Survey, P.O. Box 25046, MS 939, Denver Federal Center, Denver, Colorado 80225 This report, although in the USGS Professional Paper series, is available only on CD–ROM The National Coal Resource Assessment Overview Click here to return to Volume Table of Contents
Transcript
Chapter D
Coal Resource Availability, Recoverability, and Economic Evaluations in the United States—A Summary
By James A. Luppens,1 Timothy J. Rohrbacher,2 Lee M. Osmonson,2 and M. Devereux Carter1
U.S. Geological Survey Professional Paper 1625–F
U.S. Department of the Interior U.S. Geological Survey
Chapter D ofThe National Coal Resource Assessment OverviewEdited by Brenda S. Pierce and Kristin O. Dennen
1U.S. Geological Survey, 12201 Sunrise Valley Drive, National Center, MS 956, Reston, Virginia 20192
2U.S. Geological Survey, P.O. Box 25046, MS 939, Denver Federal Center, Denver, Colorado 80225
This report, although in the USGS Professional Paper series, is available only on CD–ROM
U.S. Department of the InteriorKEN SALAZAR, Secretary
U.S. Geological SurveySuzette M. Kimball, Acting Director
U.S. Geological Survey, Reston, Virginia: 2009
For more information on the USGS—the Federal source for science about the Earth, its natural and living resources, natural hazards, and the environment, visit http://www.usgs.gov or call 1-888-ASK-USGS
For an overview of USGS information products, including maps, imagery, and publications, visit http://www.usgs.gov/pubprod
To order this and other USGS information products, visit http://store.usgs.gov
Any use of trade, product, or firm names is for descriptive purposes only and does not imply endorsement by the U.S. Government.
Although this report is in the public domain, permission must be secured from the individual copyright owners to reproduce any copyrighted materials contained within this report.
Suggested citation:Luppens, J.A., Rohrbacher, T.J., Osmonson, L.M., and Carter, M.D., 2009, Coal resource availability, recoverability, and economic evaluations in the United States—A Summary, in Pierce, B.S., and Dennen, K.O., eds., The National Coal Resource Assessment Overview: U.S. Geological Survey Professional Paper 1625–F, Chapter D, 17 p.
Contents
Introduction.....................................................................................................................................................1Methodology ..........................................................................................................................................2Complexities of Coal Resource Assessments ..................................................................................4
United States Production Trends and Mining Methods ..........................................................................8Coal Availability and Recoverability Studies Results ......................................................................8
1. McKelvey-type diagram illustrating the relationship of coal resources and reserves. ...................................................................................................................................................... 1
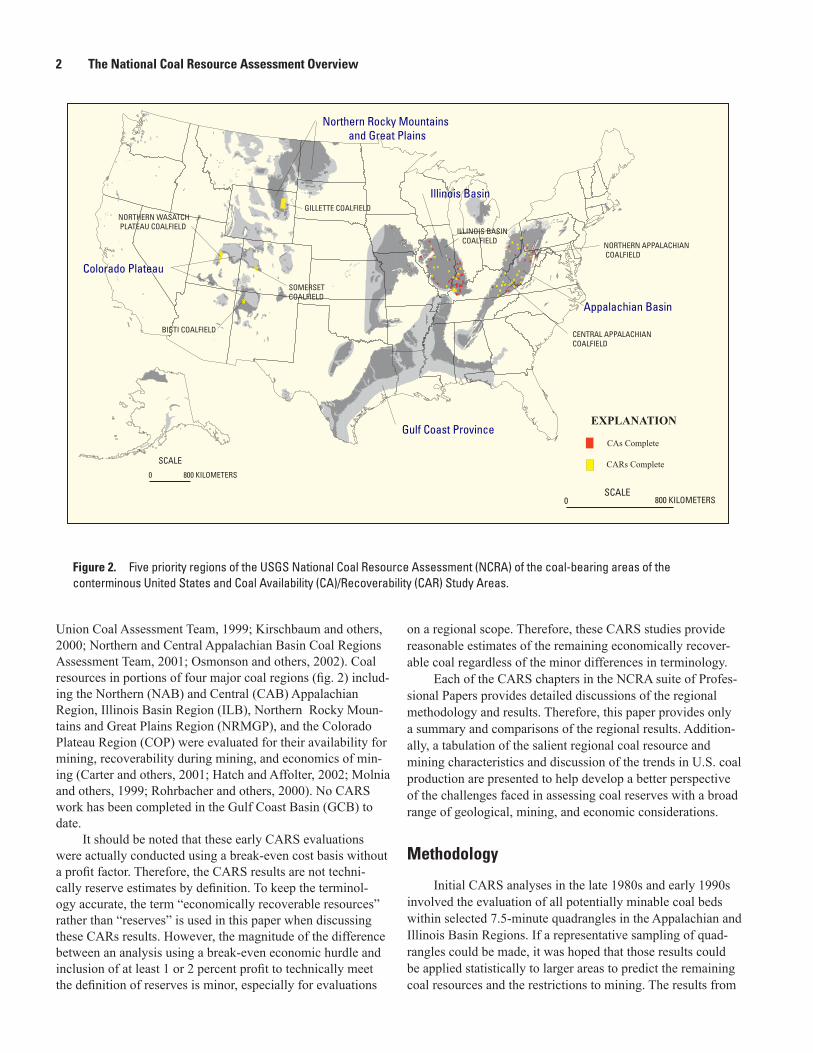
2. Map showing five priority regions of the USGS National Coal Resource Assessment (NCRA) of the coal-bearing areas of the conterminous United States and Coal Availability (CA)/Recoverability (CAR) study areas. ........................................................... 2
3. Chart showing coal availability/recoverability methodology flow diagram. .........................3 4. Charts showing A, B, and C. Eastern and Western United States regional
coal production trends by mining method and summary of regional and total United States production trends from 1990 through 2003 ...................................................10
5. Chart showing coal availability/recoverability summary of coal basins resource evaluations from USGS Professional Papers 1625 A, B, C, and D. .......................12
6. Chart listing possible environmental (env), societal (soc) and technological restrictions to mining ............................................................................................14
Tables
1. Regional coal resource and mining characteristics...............................................................5 2. U.S. Coal production comparisons by region, by mine type and by mining
method for the years 1990, 1995, 2000, and 2003 .....................................................................9 3. CARs Summary of Coal Basins Resource Evaluations from Professional Papers
1625 A, B, C, and D ......................................................................................................................11
Intentionally left blank.
Introduction
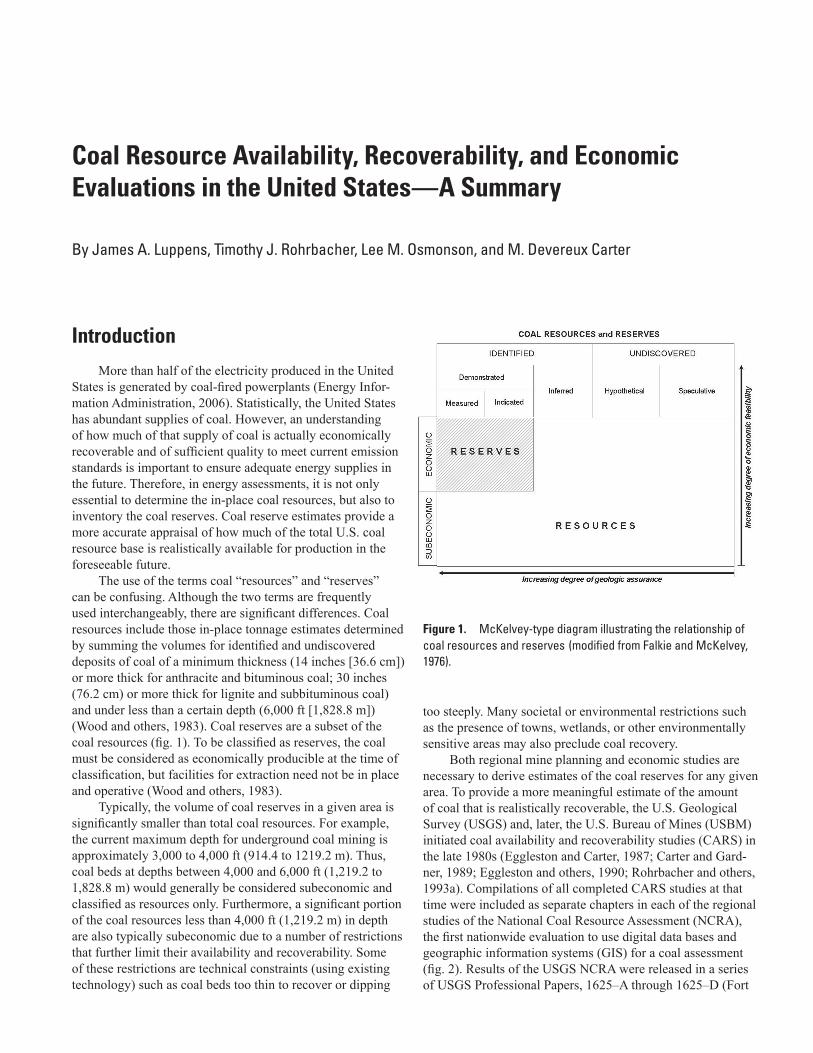
More than half of the electricity produced in the United States is generated by coal-fired powerplants (Energy Infor-mation Administration, 2006). Statistically, the United States has abundant supplies of coal. However, an understanding of how much of that supply of coal is actually economically recoverable and of sufficient quality to meet current emission standards is important to ensure adequate energy supplies in the future. Therefore, in energy assessments, it is not only essential to determine the in-place coal resources, but also to inventory the coal reserves. Coal reserve estimates provide a more accurate appraisal of how much of the total U.S. coal resource base is realistically available for production in the foreseeable future.
The use of the terms coal “resources” and “reserves” can be confusing. Although the two terms are frequently used interchangeably, there are significant differences. Coal resources include those in-place tonnage estimates determined by summing the volumes for identified and undiscovered deposits of coal of a minimum thickness (14 inches [36.6 cm]) or more thick for anthracite and bituminous coal; 30 inches (76.2 cm) or more thick for lignite and subbituminous coal) and under less than a certain depth (6,000 ft [1,828.8 m]) (Wood and others, 1983). Coal reserves are a subset of the coal resources (fig. 1). To be classified as reserves, the coal must be considered as economically producible at the time of classification, but facilities for extraction need not be in place and operative (Wood and others, 1983).
Typically, the volume of coal reserves in a given area is significantly smaller than total coal resources. For example, the current maximum depth for underground coal mining is approximately 3,000 to 4,000 ft (914.4 to 1219.2 m). Thus, coal beds at depths between 4,000 and 6,000 ft (1,219.2 to 1,828.8 m) would generally be considered subeconomic and classified as resources only. Furthermore, a significant portion of the coal resources less than 4,000 ft (1,219.2 m) in depth are also typically subeconomic due to a number of restrictions that further limit their availability and recoverability. Some of these restrictions are technical constraints (using existing technology) such as coal beds too thin to recover or dipping
Coal Resource Availability, Recoverability, and Economic Evaluations in the United States—A Summary
By James A. Luppens, Timothy J. Rohrbacher, Lee M. Osmonson, and M. Devereux Carter
too steeply. Many societal or environmental restrictions such as the presence of towns, wetlands, or other environmentally sensitive areas may also preclude coal recovery.
Both regional mine planning and economic studies are necessary to derive estimates of the coal reserves for any given area. To provide a more meaningful estimate of the amount of coal that is realistically recoverable, the U.S. Geological Survey (USGS) and, later, the U.S. Bureau of Mines (USBM) initiated coal availability and recoverability studies (CARS) in the late 1980s (Eggleston and Carter, 1987; Carter and Gard-ner, 1989; Eggleston and others, 1990; Rohrbacher and others, 1993a). Compilations of all completed CARS studies at that time were included as separate chapters in each of the regional studies of the National Coal Resource Assessment (NCRA), the first nationwide evaluation to use digital data bases and geographic information systems (GIS) for a coal assessment (fig. 2). Results of the USGS NCRA were released in a series of USGS Professional Papers, 1625–A through 1625–D (Fort
Figure 1. McKelvey-type diagram illustrating the relationship of coal resources and reserves (modified from Falkie and McKelvey, 1976).
2 The National Coal Resource Assessment Overview
Union Coal Assessment Team, 1999; Kirschbaum and others, 2000; Northern and Central Appalachian Basin Coal Regions Assessment Team, 2001; Osmonson and others, 2002). Coal resources in portions of four major coal regions (fig. 2) includ-ing the Northern (NAB) and Central (CAB) Appalachian Region, Illinois Basin Region (ILB), Northern Rocky Moun-tains and Great Plains Region (NRMGP), and the Colorado Plateau Region (COP) were evaluated for their availability for mining, recoverability during mining, and economics of min-ing (Carter and others, 2001; Hatch and Affolter, 2002; Molnia and others, 1999; Rohrbacher and others, 2000). No CARS work has been completed in the Gulf Coast Basin (GCB) to date.
It should be noted that these early CARS evaluations were actually conducted using a break-even cost basis without a profit factor. Therefore, the CARS results are not techni-cally reserve estimates by definition. To keep the terminol-ogy accurate, the term “economically recoverable resources” rather than “reserves” is used in this paper when discussing these CARs results. However, the magnitude of the difference between an analysis using a break-even economic hurdle and inclusion of at least 1 or 2 percent profit to technically meet the definition of reserves is minor, especially for evaluations
on a regional scope. Therefore, these CARS studies provide reasonable estimates of the remaining economically recover-able coal regardless of the minor differences in terminology.
Each of the CARS chapters in the NCRA suite of Profes-sional Papers provides detailed discussions of the regional methodology and results. Therefore, this paper provides only a summary and comparisons of the regional results. Addition-ally, a tabulation of the salient regional coal resource and mining characteristics and discussion of the trends in U.S. coal production are presented to help develop a better perspective of the challenges faced in assessing coal reserves with a broad range of geological, mining, and economic considerations.
Methodology
Initial CARS analyses in the late 1980s and early 1990s involved the evaluation of all potentially minable coal beds within selected 7.5-minute quadrangles in the Appalachian and Illinois Basin Regions. If a representative sampling of quad-rangles could be made, it was hoped that those results could be applied statistically to larger areas to predict the remaining coal resources and the restrictions to mining. The results from
Figure 2. Five priority regions of the USGS National Coal Resource Assessment (NCRA) of the coal-bearing areas of the conterminous United States and Coal Availability (CA)/Recoverability (CAR) Study Areas.
Coal Resource Availability, Recoverability, and Economic Evaluations in the United States—A Summary 3
more than 30 quadrangles in these two basins demonstrated that, in most cases, the percentage of resources available for mining and recovery did not change greatly from the average of all the study areas. However, the amount of economically recoverable resources varied widely, and realistic projections of the detailed quadrangle studies to regional scales were not possible (Weisenfluh and others, 1997). It was clear that CARS studies needed to be conducted on areas larger than individual 7.5-minute quadrangles to be useful. After 1996, nearly all coal resource evaluations were conducted on single or multiple coal beds for entire coal fields, such as the North-ern Wasatch Plateau coal field. These larger area evaluations provided significantly improved estimates of recoverable resources. The evolution in methodology from single 7.5-min-ute quadrangles containing about 56 mi2 (145.0 km2) of area to entire coal fields containing up to several thousands of square miles (5,180+ km2) became feasible due largely to advances in computer hardware and software and the availability of digital information regarding geology, geography, and societal data and infrastructure.
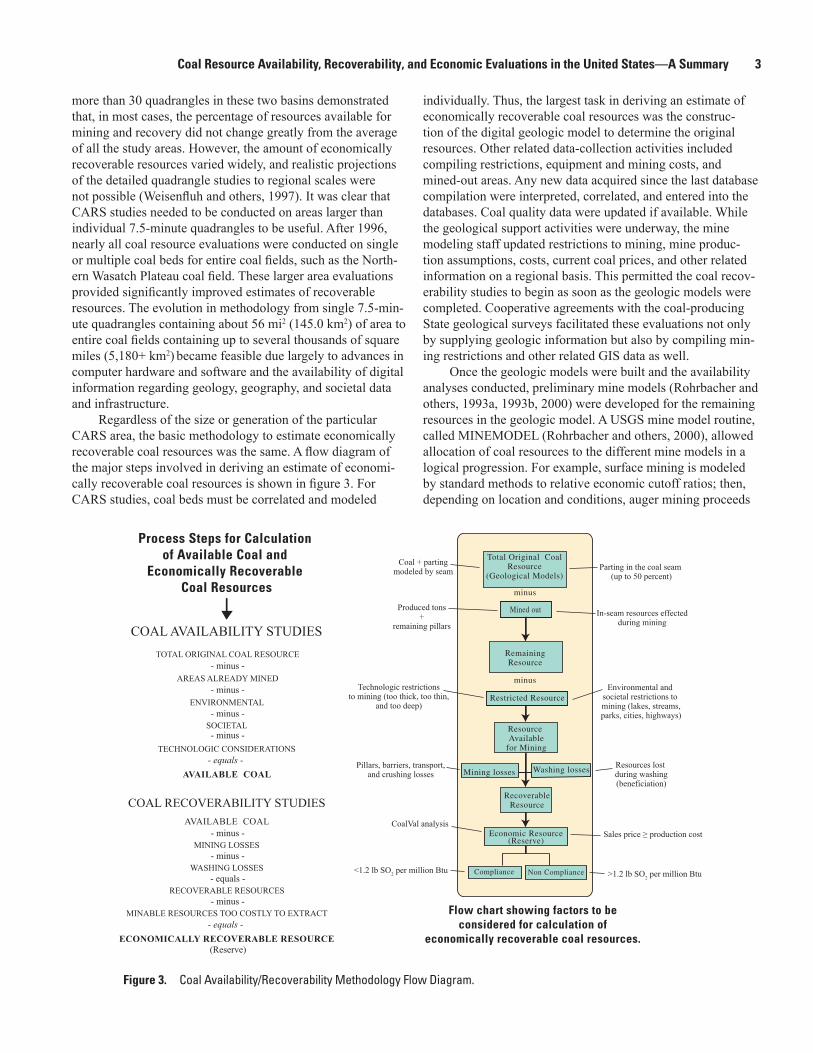
Regardless of the size or generation of the particular CARS area, the basic methodology to estimate economically recoverable coal resources was the same. A flow diagram of the major steps involved in deriving an estimate of economi-cally recoverable coal resources is shown in figure 3. For CARS studies, coal beds must be correlated and modeled
individually. Thus, the largest task in deriving an estimate of economically recoverable coal resources was the construc-tion of the digital geologic model to determine the original resources. Other related data-collection activities included compiling restrictions, equipment and mining costs, and mined-out areas. Any new data acquired since the last database compilation were interpreted, correlated, and entered into the databases. Coal quality data were updated if available. While the geological support activities were underway, the mine modeling staff updated restrictions to mining, mine produc-tion assumptions, costs, current coal prices, and other related information on a regional basis. This permitted the coal recov-erability studies to begin as soon as the geologic models were completed. Cooperative agreements with the coal-producing State geological surveys facilitated these evaluations not only by supplying geologic information but also by compiling min-ing restrictions and other related GIS data as well.
Once the geologic models were built and the availability analyses conducted, preliminary mine models (Rohrbacher and others, 1993a, 1993b, 2000) were developed for the remaining resources in the geologic model. A USGS mine model routine, called MINEMODEL (Rohrbacher and others, 2000), allowed allocation of coal resources to the different mine models in a logical progression. For example, surface mining is modeled by standard methods to relative economic cutoff ratios; then, depending on location and conditions, auger mining proceeds
COAL AVAILABILITY STUDIESTOTAL ORIGINAL COAL RESOURCE
- minus - AREAS ALREADY MINED
- minus -ENVIRONMENTAL
- minus -
TECHNOLOGIC CONSIDERATIONS
AVAILABLE COAL
COAL RECOVERABILITY STUDIES
- minus -MINING LOSSES
- minus -WASHING LOSSES
- equals -RECOVERABLE RESOURCES
- minus -MINABLE RESOURCES TOO COSTLY TO EXTRACT
- equals -ECONOMICALLY RECOVERABLE RESOURCE
(Reserve)
- equals -
SOCIETAL- minus -
AVAILABLE COAL
Total Original CoalResource
(Geological Models)
RemainingResource
Resource Available
for Mining
RecoverableResource
Restricted Resource
Economic Resource
Compliance Non Compliance
Mined out
Washing lossesMining losses
(Reserve)
Process Steps for Calculation of Available Coal and
Economically Recoverable Coal Resources
Flow chart showing factors to beconsidered for calculation of
economically recoverable coal resources.
minus
minus
Produced tons+
remaining pillars
Technologic restrictionsto mining (too thick, too thin,
and too deep)
Pillars, barriers, transport,and crushing losses
CoalVal analysis
<1.2 lb SO2 per million Btu
Coal + partingmodeled by seam Parting in the coal seam
(up to 50 percent)
In-seam resources effectedduring mining
Environmental and societal restrictions to mining (lakes, streams,parks, cities, highways)
Resources lost during washing(beneficiation)
Sales price ≥ production cost
>1.2 lb SO2 per million Btu
4 The National Coal Resource Assessment Overview
until a practical physical auger mining depth limit is reached. From that limit down to a maximum mining depth cutoff, underground methods are utilized. The remaining available coal underground is subdivided into either room-and-pillar or longwall models. Because longwall mining is more cost effec-tive than room-and-pillar mining, the program preferentially maximizes the amount of remaining underground resources assigned to longwall models. Once all the available resources have been assigned to the various mine models, those data along with estimated coal haulage distances and quality are exported to a program called CoalVal that performs the coal-resource recoverability analyses.
The CoalVal program is a regional mine-planning and resource-recoverability analysis software package originally developed by the USBM (Suffredini, and others, 1994) and currently being updated by the USGS. This program produces a prefeasibility level evaluation to determine what portion of the recoverable coal resources can be currently produced economically, and what portion is considered subeconomic. A prefeasibility economic study should have error limits of ± 25 percent (United Nations, 1996). If the quality of the raw produced coal is suitable for market, CoalVal assumes that beneficiation (washing) is not necessary. If the coal quality needs be improved to meet the minimum marketable quality, it is assumed that the coal needs to be washed. The program cal-culated the amount of coal and waste (dilution) produced from the mine operation and estimates the volume and quality of the market-ready coal from the wash plant. Once the delivered coal quality has been estimated, CoalVal determines a revised production cost, capital costs, and taxation for all the recover-able resources. The sum of the blocks of coal resources that can be produced at or less than the current sales price (at the time of the analysis) is considered economically recoverable resources. A discounted cash-flow rate of return module has been added to the CoalVal program, which will provide true reserve evaluations in the future.
It should be noted that a coal-reserves assessment is not a one-time evaluation or static procedure. The volume of reserves calculated is dependent on the information/data and assumptions used at the time of the study. Significant changes in parameters such as transportation, changes in technology, mining economics, and demand for coal and market pric-ing will affect the estimates of reserves through time. As production continues and demand remains strong and (or) technological advances in mining positively affect economics, resources once considered to be subeconomic may be elevated to the status of reserves. If demand for coal wanes and (or) coal sales prices decline, the opposite may occur. Therefore, reserve studies should be considered a dynamic process and models should be reanalyzed periodically with the most recent data and reassessed utilizing current recovery technology and economics.
Complexities of Coal Resource Assessments
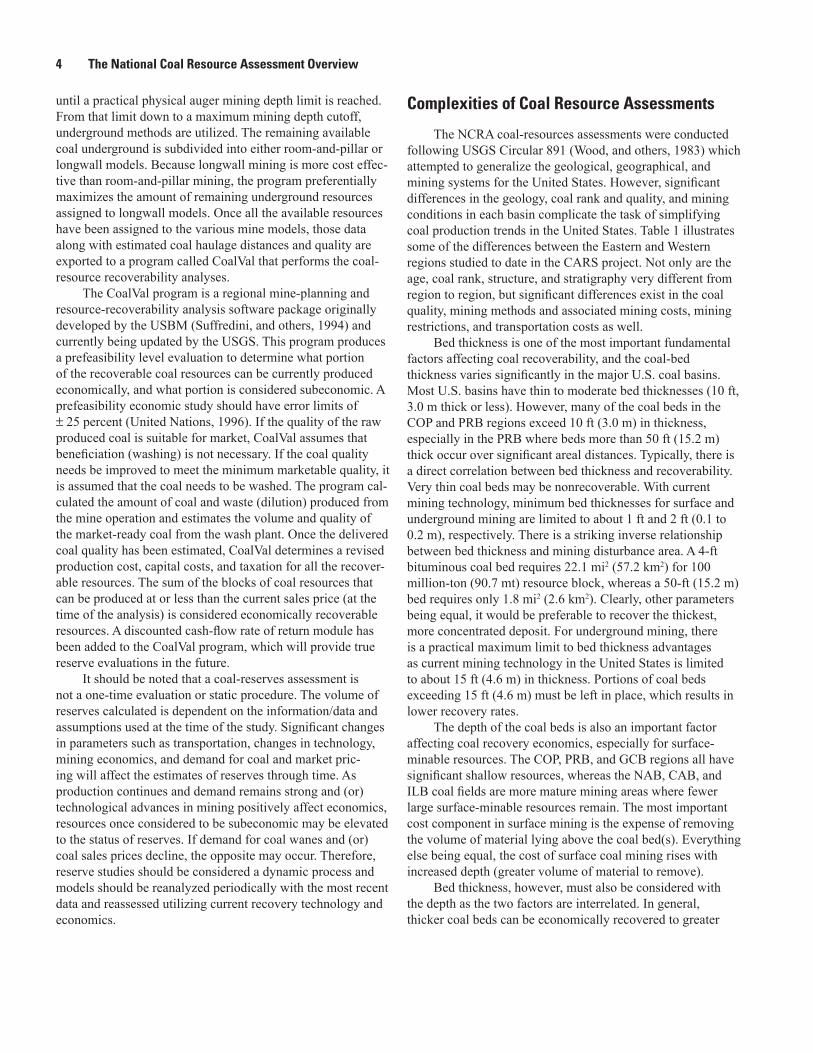
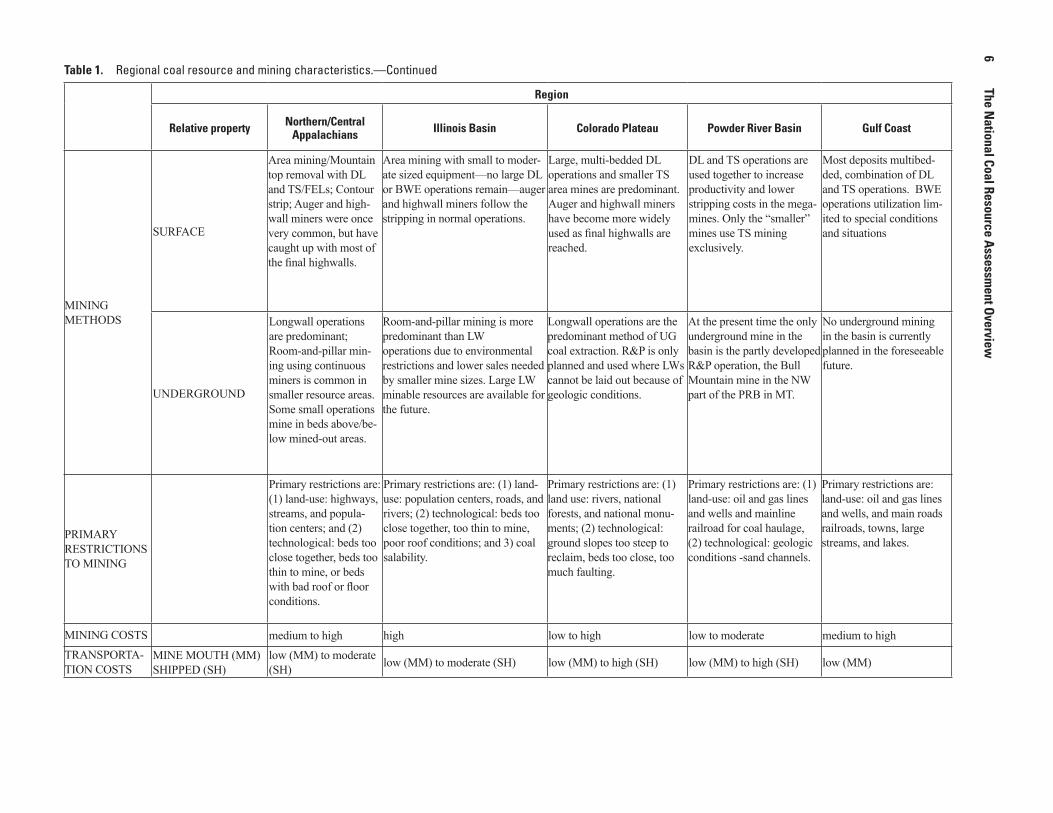
The NCRA coal-resources assessments were conducted following USGS Circular 891 (Wood, and others, 1983) which attempted to generalize the geological, geographical, and mining systems for the United States. However, significant differences in the geology, coal rank and quality, and mining conditions in each basin complicate the task of simplifying coal production trends in the United States. Table 1 illustrates some of the differences between the Eastern and Western regions studied to date in the CARS project. Not only are the age, coal rank, structure, and stratigraphy very different from region to region, but significant differences exist in the coal quality, mining methods and associated mining costs, mining restrictions, and transportation costs as well.
Bed thickness is one of the most important fundamental factors affecting coal recoverability, and the coal-bed thickness varies significantly in the major U.S. coal basins. Most U.S. basins have thin to moderate bed thicknesses (10 ft, 3.0 m thick or less). However, many of the coal beds in the COP and PRB regions exceed 10 ft (3.0 m) in thickness, especially in the PRB where beds more than 50 ft (15.2 m) thick occur over significant areal distances. Typically, there is a direct correlation between bed thickness and recoverability. Very thin coal beds may be nonrecoverable. With current mining technology, minimum bed thicknesses for surface and underground mining are limited to about 1 ft and 2 ft (0.1 to 0.2 m), respectively. There is a striking inverse relationship between bed thickness and mining disturbance area. A 4-ft bituminous coal bed requires 22.1 mi2 (57.2 km2) for 100 million-ton (90.7 mt) resource block, whereas a 50-ft (15.2 m) bed requires only 1.8 mi2 (2.6 km2). Clearly, other parameters being equal, it would be preferable to recover the thickest, more concentrated deposit. For underground mining, there is a practical maximum limit to bed thickness advantages as current mining technology in the United States is limited to about 15 ft (4.6 m) in thickness. Portions of coal beds exceeding 15 ft (4.6 m) must be left in place, which results in lower recovery rates.
The depth of the coal beds is also an important factor affecting coal recovery economics, especially for surface-minable resources. The COP, PRB, and GCB regions all have significant shallow resources, whereas the NAB, CAB, and ILB coal fields are more mature mining areas where fewer large surface-minable resources remain. The most important cost component in surface mining is the expense of removing the volume of material lying above the coal bed(s). Everything else being equal, the cost of surface coal mining rises with increased depth (greater volume of material to remove).
Bed thickness, however, must also be considered with the depth as the two factors are interrelated. In general, thicker coal beds can be economically recovered to greater
Coal Resource Availability, Recoverability, and Economic Evaluations in the U
nited States—A
Summ
ary
5Table 1. Regional coal resource and mining characteristics.
Abbreviations: TS = Truck-shovel stripping; DL = Dragline stripping; FEL = Front-end loader stripping; BWE = Bucket wheel excavator stripping; R&P = Room-and- pillar; LW = Longwall; UG = Underground; bit = bituminous; subbit = subbituminous; Vol = Volatile; S= sulfur; MM = mine mouth; SH = haulage by truck or rail.
Heating value (Btu/lb) 11,100–13,900 / 11,500–14,200 9,700–12,800 9,200–12,800 7,800–9,700 5,200–7,200
SULFUR (percent)
1–5 / 0.5–4 (significant compliance coal in CAB)
1–6 (some compliance coal)0.2–1.4 (significant compliance coal with mod to high Btu)
0.2–0.8 (significant compliance coal)
0.6–1.5 (some near compliance coal)
COAL RANK High Vol C Bit–Anthracite High Vol C Bit–High Vol B Bit Subbit A–Low Vol A Bit Lignite A–Subbit B Lignite B–Lignite A
FUTURE MINING
REMAINING COAL RESOURCES
Mature mining area—most thick, low to med. S, high Btu coal has been mined. Medium to thin, high S, high Btu resources remain for UG mining; few large surface-minable resources remain.
Mature mining—most DL resources and med. S, deep resources have been mined. High to med. S, med.-high Btu, resources remain for UG & thin surface mining. Small amounts of low S, UG resources remain.
Large amounts of low to med S, low Btu, and high ash, DL, and TS strip resources are available in the San Juan Basin. LW operations will be used for most of the deep, thicker, low S, high Btu resources.
The largest operations will continue to use a com-bination of DL and TS operations. BWE operations failed in the past, but may prove to be the best way to continue stripping in the future.
Most deposits multibed-ded, combination of DL and TS operations. BWE operations utilization lim-ited to special conditions and situations
6
The National Coal Resource A
ssessment O
verviewTable 1. Regional coal resource and mining characteristics.—Continued
Area mining/Mountain top removal with DL and TS/FELs; Contour strip; Auger and high-wall miners were once very common, but have caught up with most of the final highwalls.
Area mining with small to moder-ate sized equipment—no large DL or BWE operations remain—auger and highwall miners follow the stripping in normal operations.
Large, multi-bedded DL operations and smaller TS area mines are predominant. Auger and highwall miners have become more widely used as final highwalls are reached.
DL and TS operations are used together to increase productivity and lower stripping costs in the mega-mines. Only the “smaller” mines use TS mining exclusively.
Most deposits multibed-ded, combination of DL and TS operations. BWE operations utilization lim-ited to special conditions and situations
UNDERGROUND
Longwall operations are predominant; Room-and-pillar min-ing using continuous miners is common in smaller resource areas. Some small operations mine in beds above/be-low mined-out areas.
Room-and-pillar mining is more predominant than LW operations due to environmental restrictions and lower sales needed by smaller mine sizes. Large LW minable resources are available for the future.
Longwall operations are the predominant method of UG coal extraction. R&P is only planned and used where LWs cannot be laid out because of geologic conditions.
At the present time the only underground mine in the basin is the partly developed R&P operation, the Bull Mountain mine in the NW part of the PRB in MT.
No underground mining in the basin is currently planned in the foreseeable future.
PRIMARY RESTRICTIONS TO MINING
Primary restrictions are: (1) land-use: highways, streams, and popula-tion centers; and (2) technological: beds too close together, beds too thin to mine, or beds with bad roof or floor conditions.
Primary restrictions are: (1) land-use: population centers, roads, and rivers; (2) technological: beds too close together, too thin to mine, poor roof conditions; and 3) coal salability.
Primary restrictions are: (1) land use: rivers, national forests, and national monu-ments; (2) technological: ground slopes too steep to reclaim, beds too close, too much faulting.
Primary restrictions are: (1) land-use: oil and gas lines and wells and mainline railroad for coal haulage, (2) technological: geologic conditions -sand channels.
Primary restrictions are: land-use: oil and gas lines and wells, and main roads railroads, towns, large streams, and lakes.
MINING COSTS medium to high high low to high low to moderate medium to highTRANSPORTA-TION COSTS
MINE MOUTH (MM) SHIPPED (SH)
low (MM) to moderate (SH) low (MM) to moderate (SH) low (MM) to high (SH) low (MM) to high (SH) low (MM)
Coal Resource Availability, Recoverability, and Economic Evaluations in the United States—A Summary 7
depths. The relationship between coal-bed depth and thickness is called the “stripping ratio” and is the most influential economic factor in the evaluation of surface mining potential. This ratio represents the volume of rock both above and within (partings) coal beds expressed in the number of cubic yards (0.76 m3) that must be mined to obtain 1 t (0.9 mt) of coal. While not an exact conversion, the stripping ratio can be roughly estimated by simply dividing the thickness of the rock above the coal bed by the coal thickness. For example, given one area with a 10 ft (3.0 m) coal bed and another area with a 50 ft (15.2 m) bed, with both beds at 100 ft (30.5 m) in depth, the approximate stripping ratios would be 10:1 and 2:1, respectively. This means that, for the 2:1 ratio area, only 2 yd3 (1.53 m3) of rock would have to be removed per ton (0.9 mt) of coal produced compared to 10 yd3 (7.65 m3) for the 10:1 area. Obviously, the 2:1 ratio area would have a significant production cost advantage. It is the combination of extensive, very thick, low stripping ratio resources in the PRB that has stimulated the rapid development in this region over the past 35 years.
At some point, it becomes impractical to continue surface mining, and the deeper coal resources must be exploited by using underground mining methods. That cross-over depth for mining methods is regionally dependent. Depth significantly affects both coal recoverability and underground mining economics. With increasing depth, a number of logistical and geotechnical concerns including access and haul distances, roof and floor stability (increased rock pressures), temperature, and groundwater issues become increasingly problematic, leading to substantial productivity declines and economic penalties. The current depth limit to underground coal mining is usually considered to be between 3,000 to 4,000 ft (914.4 to 1,219.2 m) (Fettweis, 1979).
Coal rank is another significant parameter that is highly variable. Rank is a function of the degree of coalification (metamorphism). Rank is largely dependent on the amount of heat and pressure due to burial and time (age) that a coal deposit has sustained. The rank of the coal basins listed in table 1 increases from right to left, corresponding to increased age and burial history (tectonics). The GCB coals are lignite in rank and represent some of the geologically youngest U.S. coal resources. Coal in this region has been buried to relatively shallow depths. The NAB and CAB coals are both the oldest geologically and have been subjected to more intense tectonic activity, with some of the coal resources reaching the rank of anthracite. Additionally, the induration (strength) of the rock strata containing the coal beds can often be correlated with increasing coal rank. This may result in better roof and floor conditions for underground mining, leading to higher recover-ies. Conversely, increased tectonic activity may also result in more bed deformation and faulting locally, which may inhibit coal recoverability. However, the most important relationship to rank is coal quality.
Coal quality is one of the other key factors related to coal recoverability. The single most important quality parameter is the heating value of coal. The heating value is a measure of the
energy contained in a unit of coal, expressed as British thermal units per pound (Btu/lb). In fact, coal is typically priced on a cost per million Btu basis. One of the most important effects of increasing rank is the loss of water content in the coal with a corresponding increase of the heating value. The rank-related relationship of water to heating value can be readily observed in table 1. The lower ranked lignite from the GCB has relatively high moisture and low heating values, while the high-ranked bituminous NAB and CAB regions exhibit the lowest moisture and highest heating values. The ramifications of this relationship upon coal quality are substantial. It takes 2 tons (1.8 mt) of 6,500-Btu/lb (15.1 MJ/kg) lignite to match the energy equivalent of 1 ton (0.9 mt) of 13,000 Btu/lb (30.2 MJ/kg) bituminous coal, which translates into a substan-tial competitive advantage for higher ranked coals.
The sulfur content of the coals is another significant coal quality parameter. When coal is burned, some sulfur dioxide (SO2) is released, which contributes to degradation of air quality. Current clean air standards limit SO2 emissions. Coals, when burned, that met clean standards without the use of emission-reducing technology are termed “compliance” coals. Thus, there is a price premium for compliance coal, those coals that contain equal to or less than 1.2 lb (0.54 kg) of SO2 per million Btu (2,326 MJ/kg). The CAB, PRB, and COP all have significant resources that are considered compliance coal in terms of sulfur content. On the other hand, most coal from the NAB and ILB regions have relatively high sulfur contents, which requires coal cleaning and(or) higher operational and maintenance costs for SO2 removal at the powerplants are incurred and have a negative effect on coal sales prices. In general, the higher the sulfur content, the greater the price penalty, which affects the overall economics of a resource. For example, as of January 2, 2006, the current price for Pittsburgh bed coal at 13,000 Btu/lb (30.2 MJ/kg) was $45.00/ton (0.9 mt) at less than 3.0 lb of SO2 per million Btu (1.36 kg SO2 per 2,326 MJ/kg) (1.95 percent sulfur) and $38.00/ton (0.9 mt) at 4.0 lb of SO2 per million Btu (1.81 kg SO2 per 2,326 MJ/kg) (2.6 percent sulfur) (Platts, 2006). A difference of less than 1 percent sulfur resulted in a $7.00/ton (0.9 mt) price differential.
From the previous discussion, it can to be seen that many factors significantly affect the economics of coal recovery, with no single key parameter being most critical. Therefore, an understanding of some of the interrelationships of these factors can help explain situations that might seem anomalous at first glance. A good example is the PRB region. There, those coal resources have been able to compete with higher heating-value, bituminous coals east of the Mississippi River even when faced with a much higher transportation cost disadvantage. The thick, shallow coal beds can be surface mined at very low cost compared to many remaining Eastern coal reserves that must be produced utilizing more expensive underground mining methods. Furthermore, much of the PRB coal is compliant in terms of sulfur content, which yields an additional sales price premium. These economic advantages allow PRB coal to adsorb significant penalties in terms of
8 The National Coal Resource Assessment Overview
transportation costs and still remain competitive for great distances from the region. On the other hand, the GCB has much higher mining costs (thinner beds, higher stripping ratio, and lower coal quality) than other potential coal sources such as the PRB. However, the GCB lignite resources commonly remain competitive as they are used almost exclusively in mine-mouth powerplant situations where no transportation costs are incurred. In summary, each coal basin possesses a unique set of complex geological, mining, and transportation characteristics. This means that economic evaluations for estimating resource recovery must be customized for each individual coal basin.
United States Production Trends and Mining Methods
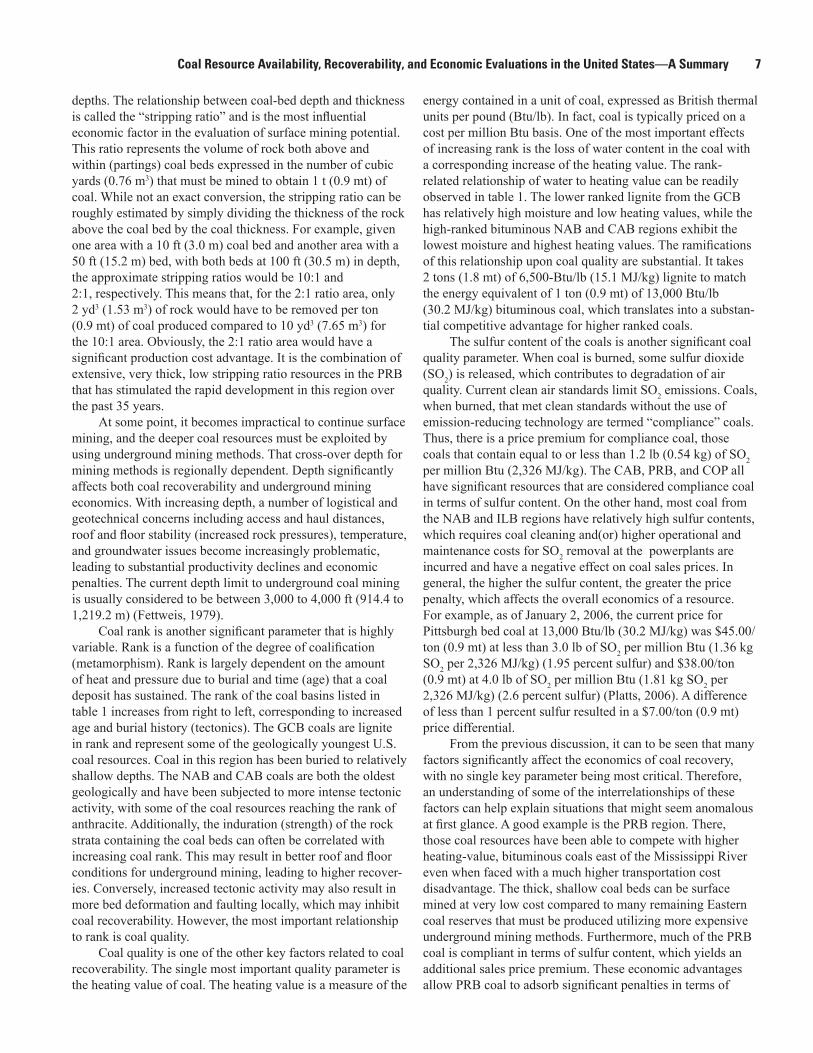
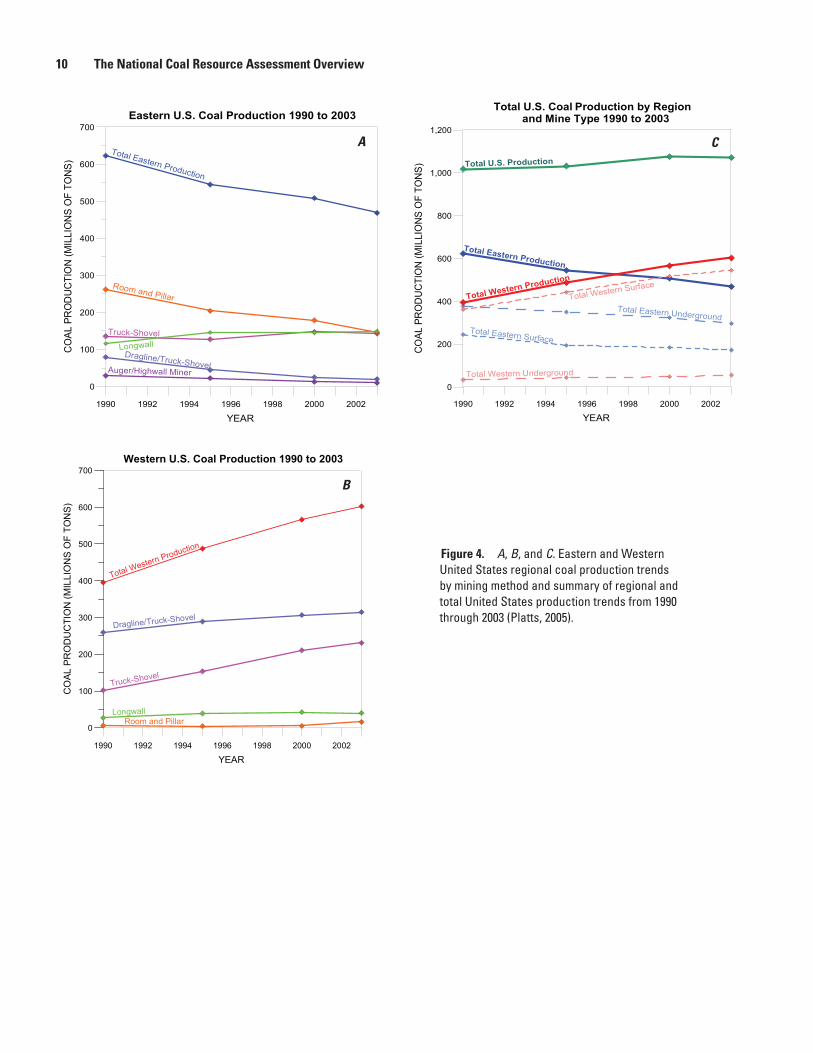
Historically, the thicker, shallower, and better quality coal beds have been preferentially exploited, especially in the Eastern United States. Deeper mining of thinner beds has become the norm in the Eastern coal fields. Furthermore, underground recovery of coal beds above or below previously mined coal beds has increased as well. Table 2 and figures 4 A,B, and C compare U.S. coal production by mining method and geography in States east (including NAB, CAB, and ILB) compared to west (including PRB and COP) of the Mississippi River from the years 1990 through 2003.
One observation that is readily apparent from table 2 and figures. 4A and B is the significant difference between the pre-dominant mining method in the Eastern and Western regions. In the East, production is dominated by underground mining methods, while surface mining is prevalent in the West. Much of the surface-minable coal (lower cost) in the East has already been recovered, forcing increased exploitation of deeper reserves. Furthermore, with much higher average population densities in the East, more conflicts regarding competing sur-face uses make surface mining more challenging. In general, western coal fields are relatively young in terms of mining, and abundant, relatively thick coal beds at shallow depths remain unmined.
One of the most striking trends apparent when reviewing figure 4C is the regional shift in U.S. coal production. Figure 4C shows an overall gradual increase in total U.S. coal production from 1990 through 2003. However, the total production curve alone masks a striking increase in Western coal production with a corresponding decline in Eastern production over that period. The period between 1997 and 1998 is the historically significant crossover point where Western coal production surpassed that of the Eastern States. The reasons for this crossover were elaborated previously herein. Figure 4C also emphasizes the regional differences in mining methods. In the East, underground mining is dominant, whereas surface mining is overwhelmingly dominant in the West.
Total Eastern coal production decreased from 623 million tons per year (mtpy) in 1990 to 469 mtpy (389 mt) in 2003 (table 2). Both surface and underground production decreased. Conversely, longwall production increased significantly (from 116 mtpy [105 mt] to 149 mtpy [135 mt] ) as the longwall operations became the preferred method of underground mining because of significant economic advantages in terms of recovery rates, productivity, and total output. Consequently, room-and-pillar mine production decreased significantly (from 262 mtpy [238 mt] tons to 146 mtpy [132 mt]). Many smaller underground mines with a production disadvantage, combined with a relatively stagnant coal market and an overall depletion of reserves, were no longer being able to compete against the more efficient longwall operations. Dragline production dropped from 80 mtpy (73 mt) in 1990 to 20 mtpy (18 mt) in 2003 and auger and highwall mining in combination with contour or area stripping decreased from 29 mtpy (26 mt) to 10 mtpy (9 mt). Several factors contributed to this decline in dragline production. Demand for high sulfur Illinois Basin coal waned as stricter sulfur emissions standards were implemented in the 1990s and much of the shallower, less costly coal had already been produced.
In the Western coal fields total production increased from 395 mtpy (358 mt) in 1990 to 603 mtpy (547 mt) in 2003 with most of that growth realized in the dragline/truck shovel (DL/TS) combination and TS operations in the Gillette, Wyoming, coal field (PRB). Some mines in the Gillette coal field were consolidated to improve efficiency. Ironically, draglines were moved from the ILB and Hanna Basin in Wyoming to the Gillette coal field to reduce stripping costs as surface production waned in the Midwestern region. A new DL/TS mine was also opened in the southern area of the Gillette coal field. The demand for low-sulfur, high-Btu coal from the Colorado Plateau mines also stimulated an increase in longwall mining production from 21 mtpy (19 mt) in 1990 to 40 mtpy (36 mt) tons in 2003 along with similar increases in room-and pillar-mine production (from 6 mtpy (5 mt) to 16 mtpy (15 mt).
Coal Availability and Recoverability Studies Results
The results of the CARS studies presented in USGS Professional Papers, 1625–A through 1625–D (Carter and others 2001; Hatch and Affolter, 2002; Molnia and others, 1999, Rohrbacher and others, 2000) are summarized in table 3 and fig. 5. A comparison of the results from the CARS work is somewhat complicated by the evolution of the methodology through time. Early CARS studies were conducted on individual 7.5-minute quadrangles (NAB, CAP, and ILB) for all minable coal resources on a bed-by-bed basis. More recent studies in the COP and PRB used geological models based on single or multiple coal beds from multiple 7.5-minute quadrangles up to entire coal fields. The advances in the methodology have improved the quality of the
Coal Resource Availability, Recoverability, and Economic Evaluations in the U
nited States—A
Summ
ary
9
Table 2. U.S. Coal production comparisons by region, by mine type, and by mining method for the years 1990, 1995, 2000, and 2003. Production listed in thousands of short tons. Eastern and Western regions1 are separated by the Mississippi River. Mine types are either underground (UG) or surface (Surf). Underground mine methods are either room and pillar (R and P) or longwall. Surface mining methods are either dragline with truck shovel (DL/TS), truck-shovel and other (TS and other), or auger and highwall (auger and HW) (Platts, 2005).
Regional subtotal 395,410 39% 487,265 47% 565,983 53% 602,591 56%Total U.S. coal production 1,018,303 1,032,334 1,075,635 1,071,167
1Eastern coal States: Alabama, Indiana, Illinois, Kentucky, Maryland, Mississippi, Ohio, Pennsylvania, Tennessee, Virginia, West Virginia. Western coal States: Alaska, Arizona, Colorado, Iowa, Kansas, Louisiana, Missouri, Montana, New Mexico, North Dakota, Oklahoma, Texas, Utah, Wyoming.
1. Percentage of regional production by mining method.
2. Percentage of regional production by mine type.
3. Percentage of total U.S. coal production by region.
10 The National Coal Resource Assessment Overview
1990 1992 1994 1996 1998 2000 2002
YEAR
0
100
200
300
400
500
600
700
CO
AL P
RO
DU
CTI
ON
(MIL
LIO
NS
OF
TON
S)
Eastern U.S. Coal Production 1990 to 2003
Room and Pillar
Total Eastern Production
Truck-ShovelLongwall
Auger/Highwall Miner
Dragline/Truck-Shovel
A
1990 1992 1994 1996 1998 2000 2002
YEAR
0
100
200
300
400
500
600
700
CO
AL P
RO
DU
CTI
ON
(MIL
LIO
NS
OF
TON
S)
Western U.S. Coal Production 1990 to 2003
Total Western Production
Dragline/Truck-Shovel
Truck-Shovel
Room and PillarLongwall
B
1990 1992 1994 1996 1998 2000 2002
YEAR
0
400
800
1,200
200
600
1,000
CO
AL P
RO
DU
CTI
ON
(MIL
LIO
NS
OF
TON
S)
Total U.S. Coal Production by Region and Mine Type 1990 to 2003
Total Western Production
Total Eastern Production
Total U.S. Production
Total Western Underground
Total Western Surface
Total Eastern UndergroundTotal Eastern Surface
C
Figure 4. A, B, and C. Eastern and Western United States regional coal production trends by mining method and summary of regional and total United States production trends from 1990 through 2003 (Platts, 2005).
Coal Resource Availability, Recoverability, and Economic Evaluations in the U
nited States—A
Summ
ary
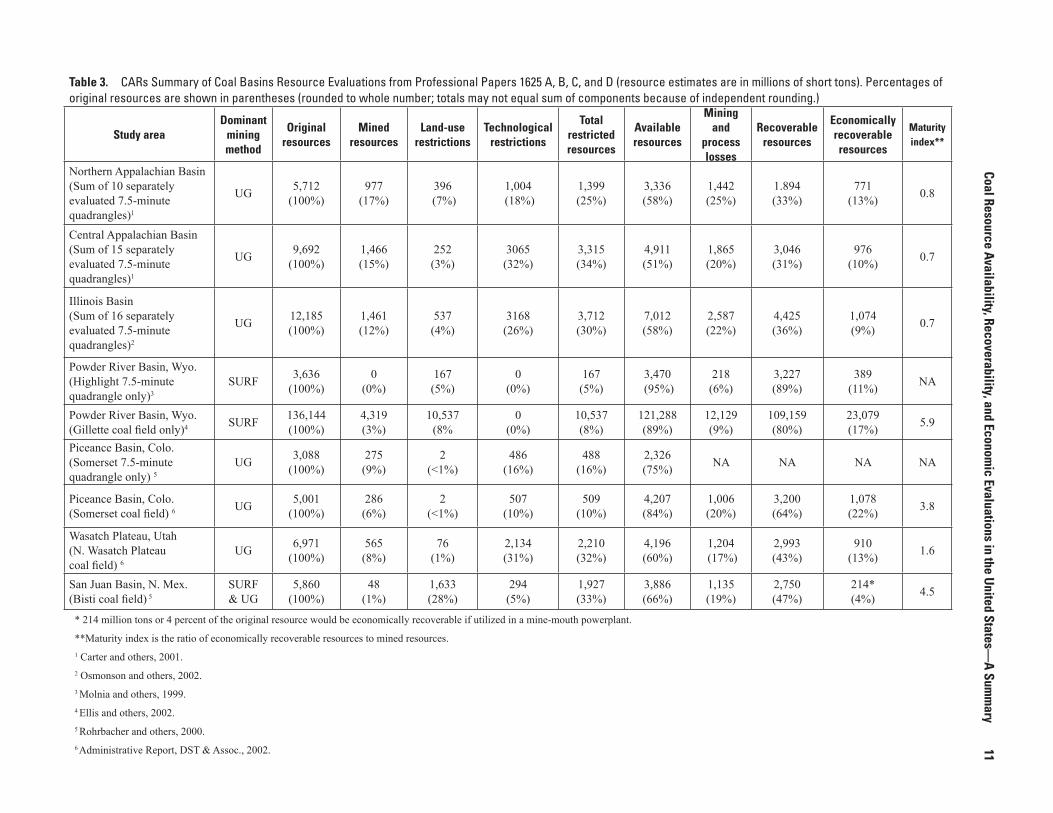
11Table 3. CARs Summary of Coal Basins Resource Evaluations from Professional Papers 1625 A, B, C, and D (resource estimates are in millions of short tons). Percentages of original resources are shown in parentheses (rounded to whole number; totals may not equal sum of components because of independent rounding.)
Study area Dominant
mining method
Original resources
Mined resources
Land-use restrictions
Technological restrictions
Total restrictedresources
Availableresources
Mining and
process losses
Recoverableresources
Economically recoverableresources
Maturity index**
Northern Appalachian Basin(Sum of 10 separately evaluated 7.5-minute quadrangles)1
UG 5,712(100%)
977(17%)
396 (7%)
1,004 (18%)
1,399(25%)
3,336(58%)
1,442(25%)
1.894(33%)
771(13%) 0.8
Central Appalachian Basin(Sum of 15 separately evaluated 7.5-minute quadrangles)1
UG 9,692(100%)
1,466(15%)
252(3%)
3065(32%)
3,315(34%)
4,911(51%)
1,865(20%)
3,046(31%)
976(10%) 0.7
Illinois Basin(Sum of 16 separately evaluated 7.5-minute quadrangles)2
UG 12,185(100%)
1,461(12%)
537(4%)
3168(26%)
3,712(30%)
7,012(58%)
2,587(22%)
4,425(36%)
1,074(9%) 0.7
Powder River Basin, Wyo.(Highlight 7.5-minute quadrangle only)3
SURF 3,636(100%)
0(0%)
167(5%)
0(0%)
167(5%)
3,470 (95%)
218(6%)
3,227(89%)
389(11%) NA
Powder River Basin, Wyo. (Gillette coal field only)4 SURF 136,144
* 214 million tons or 4 percent of the original resource would be economically recoverable if utilized in a mine-mouth powerplant.
**Maturity index is the ratio of economically recoverable resources to mined resources.1 Carter and others, 2001.2 Osmonson and others, 2002.3 Molnia and others, 1999.4 Ellis and others, 2002.5 Rohrbacher and others, 2000.6 Administrative Report, DST & Assoc., 2002.
NORTHERN APPALACHIAN BASIN STUDY AREAS SOMERSET COAL FIELD STUDY AREA
CENTRAL APPALACHIAN BASIN STUDY AREASNORTHERN WASATCH PLATEAUCOAL FIELD STUDY AREA
Original
Remaining
Available
Recoverable
Economic
Resource (color) Exclusions (gray)
None
Mined and lost in mining
Restricted
Future mining and cleaning loss
Uneconomic
0 50 100 %
ILLINOIS BASIN STUDY AREAS BISTI COAL FIELD STUDY AREA
0 50 100 %0 50 100 %
Assumes mine-mouth powerplant
GILLETTE COAL FIELD STUDY AREA
100
97
89
80
17
3
8
9
63
100
83
58
33
13
17
25
25
20
100
85
51
31
10
100
88
58
36
9
100
99
66
47
4
100
92
60
43
13
100
94
84
64
22(Sum of 10 separately
evaluated 7.5-minute quadrangles)
15
34
20(Sum of 15 separately
evaluated 7.5-minute quadrangles)
(Sum of 16 separatelyevaluated 7.5-minute quadrangles)
21
12
30
22
25
6
10
20
42
8
32
17
30
1
33
19
43
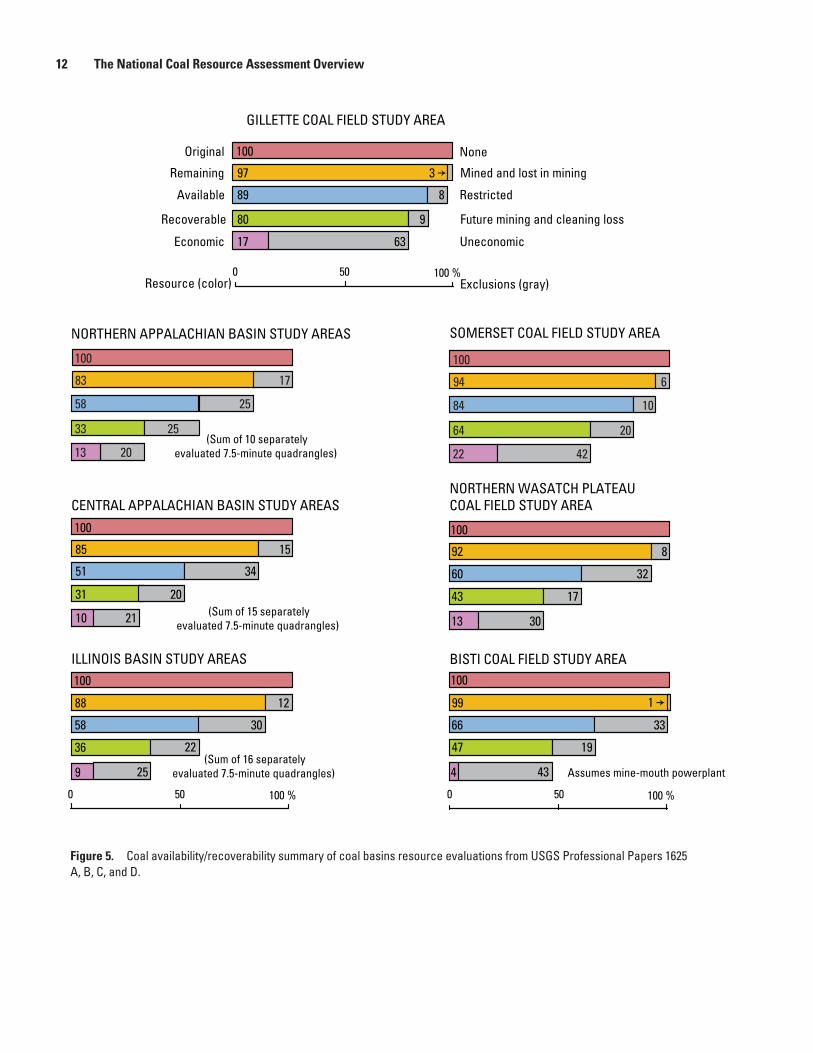
Figure 5. Coal availability/recoverability summary of coal basins resource evaluations from USGS Professional Papers 1625 A, B, C, and D.
Coal Resource Availability, Recoverability, and Economic Evaluations in the United States—A Summary 13
reserve estimates but have resulted in different generations of results. Because of these differences, comparison of available, recoverable, and economically recoverable resources for coal fields using an evolving evaluation methodology is more complicated. Therefore, we felt that expressing the various coal-resource categories for each coal field as percentages of the original resources would provide more meaningful assessment than simply a comparison of tonnages.
Two studies, the Gillette coal field in the PRB and the Somerset coal field in the Piceance Basin, Colorado, were still in progress when the Professional Papers for their respective coal regions were published. However, the results for these two additional studies are included in table 3 because the studies of entire coal fields provide a more comprehensive estimate of economically recoverable resources than quadran-gle studies. While the results of individual CARS quadrangle studies were not successful for forecasting basinwide coal-resource projections, averages of multiple studies do provide some insight into regional trends.
The relative maturity of the various regions can be seen from the results in table 3 and figure 5. The summary results of the early CARS studies for the NAB, CAB, and ILB, where 7.5-minute quadrangles were evaluated, show that these coal fields are relatively mature. All three areas have the high-est percentage of mined-out coal (12 to 17 percent of their original coal resources) compared to mined-out percentages of 0 percent to 8 percent for Western U.S. coal fields. Because coal has been mined in the Appalachian region for several hundred years, this is not surprising. However, just comparing the amount of mined-out resources as percentages of in-place original resources does not tell the whole story. Even with the higher percentages of mined-out resources, the percent-age of economic resources remaining for all the areas in table 3 and figure 5 are similar. Except for the Somerset coal field (22 percent), the percentage original resources estimated to be economically recoverable for all areas is only 17 percent or less.
Perhaps a more meaningful indicator of regional maturity is the maturity index presented in table 3. The maturity index is the ratio of the amount of remaining economically recoverable resources to the previously mined tonnages. A lower index indicates greater maturity in terms of total coal production for a given area. When the ratio is less than 1.0, the amount of economically recoverable resources remaining in place is less than the total reserves previously mined. The NAB, CAB, and ILB regions all have indices less than 1.0 indicating far greater development than the Western regions. This lower maturity index helps explain the U.S. trends (fig. 4C) where Eastern coal production has shown a steady decline over the past 13 years. As the maturity of a resource area increases, the effects of high grading are increasingly obvious, and this may accelerate production declines. The results of the maturation process is a tendency to see a shift in the characteristics of the remaining resources to deeper, thinner, and often lower quality coal, which all tend to make maintaining competitive advantages increasingly difficult.
These maturity effects correlate with the overall production decline for Eastern coal shown in figures 4A and 4C and table 2. A relatively mature situation exists for much of the Appalachian and Illinois coal regions and is strikingly illustrated by comparing the map of areas of known mining of the Pittsburgh bed (Maryland, Ohio, Pennsylvania, and West Virginia) over the coal and overburden depth isopach maps (Tewalt and others, 2001). Most of the remaining recoverable resources in both regions will be mined by underground methods because the less costly surface-minable and thicker, shallower underground coal reserves have been preferentially exploited.
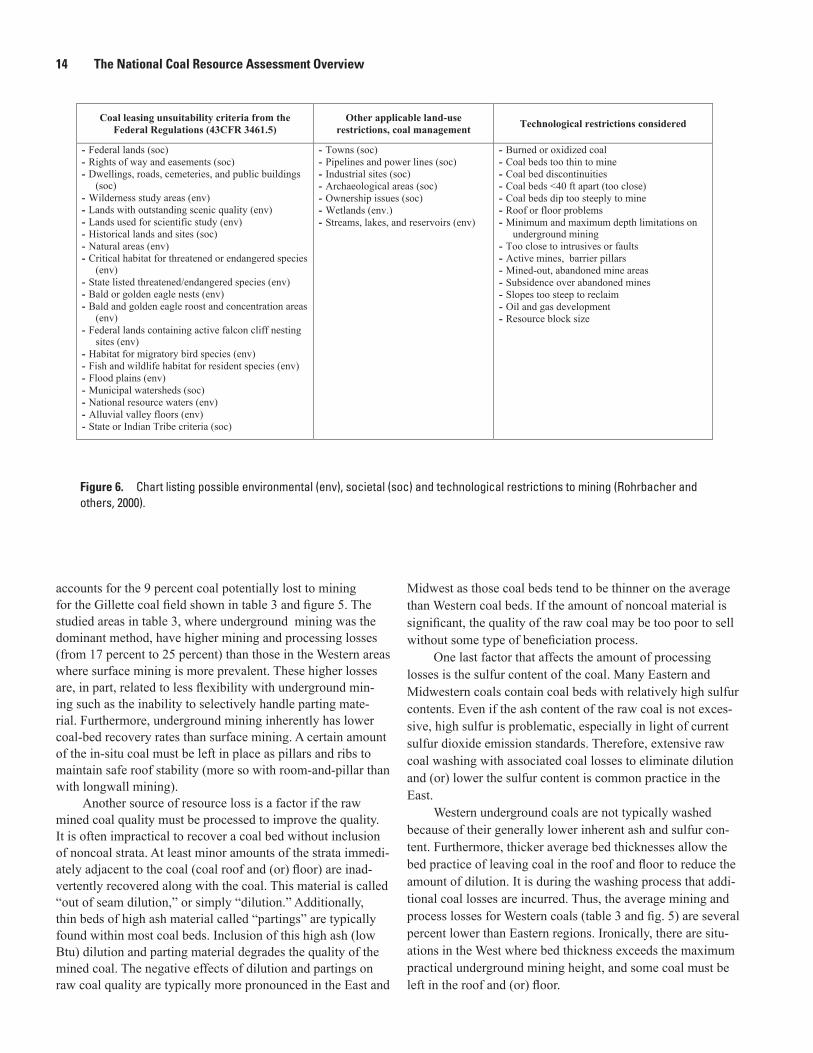
One of the most important concepts emphasized by these studies shown in table 3 is the amount of coal resources potentially unavailable due to restrictions on mining. Figure 6 lists most of the significant restrictions to mining. In general, land-use restrictions have a greater effect on surface than underground mining operations, as expected. For example, in the Bisti coal field in the San Juan Basin of New Mexico, 28 percent of the resources are restricted from mining by the De-Na-Zin Wilderness Area, eliminating access to much of the coal outcrop and surface-minable coal, which underlies the wilderness area, from mining (Rohrbacher and others, 2000). Most of the land-use restrictions associated with underground mining are related to population centers, large streams and reservoirs, and other surface features that might be adversely affected by subsidence.
Technological restrictions have a much greater effect on underground minable-resource recovery than on surface-minable resources. Total restrictions from regions with primarily underground mining ranged from 10 percent to 34 percent of the original resources with a weighted average of about 27 percent. Several factors contribute to this sizable resource loss. One of the most important reasons for this resource loss is the sensitivity of underground mining to coal-bed thickness. The minimum mining equipment height interval is about 27 inches (68.6 cm) for room-and-pillar and 42 inches (106.7 cm) for longwall mining. Most State regulations prohibit recovery of other coal beds less than approximately 40 ft (12.2 m) apart stratigraphically from previously mined beds. Once a coal bed is mined by underground methods, other coal beds within 40 ft (12.2 m) above and below it are, in effect, sterilized due to geotechnical considerations. On the other hand, surface mining affords much greater flexibility with regard to both coal-bed thickness and multiple bed recovery, which translates to fewer resource losses due to technical restrictions. Once the coal resources previously produced and those unavailable due to restrictions are identified, the unavailable resources are then subtracted from the original resources to derive available resources (table 3 and fig. 5).
Unfortunately, it is virtually impossible to recover every ton of the available resources. A certain amount of coal is lost due to mining and processing, and these losses can be signifi-cant, depending on the type of mining. Typical coal recov-ery in surface mining operations is about 90 percent, which
14 The National Coal Resource Assessment Overview
Figure 6. Chart listing possible environmental (env), societal (soc) and technological restrictions to mining (Rohrbacher and others, 2000).
accounts for the 9 percent coal potentially lost to mining for the Gillette coal field shown in table 3 and figure 5. The studied areas in table 3, where underground mining was the dominant method, have higher mining and processing losses (from 17 percent to 25 percent) than those in the Western areas where surface mining is more prevalent. These higher losses are, in part, related to less flexibility with underground min-ing such as the inability to selectively handle parting mate-rial. Furthermore, underground mining inherently has lower coal-bed recovery rates than surface mining. A certain amount of the in-situ coal must be left in place as pillars and ribs to maintain safe roof stability (more so with room-and-pillar than with longwall mining).
Another source of resource loss is a factor if the raw mined coal quality must be processed to improve the quality. It is often impractical to recover a coal bed without inclusion of noncoal strata. At least minor amounts of the strata immedi-ately adjacent to the coal (coal roof and (or) floor) are inad-vertently recovered along with the coal. This material is called “out of seam dilution,” or simply “dilution.” Additionally, thin beds of high ash material called “partings” are typically found within most coal beds. Inclusion of this high ash (low Btu) dilution and parting material degrades the quality of the mined coal. The negative effects of dilution and partings on raw coal quality are typically more pronounced in the East and
Midwest as those coal beds tend to be thinner on the average than Western coal beds. If the amount of noncoal material is significant, the quality of the raw coal may be too poor to sell without some type of beneficiation process.
One last factor that affects the amount of processing losses is the sulfur content of the coal. Many Eastern and Midwestern coals contain coal beds with relatively high sulfur contents. Even if the ash content of the raw coal is not exces-sive, high sulfur is problematic, especially in light of current sulfur dioxide emission standards. Therefore, extensive raw coal washing with associated coal losses to eliminate dilution and (or) lower the sulfur content is common practice in the East.
Western underground coals are not typically washed because of their generally lower inherent ash and sulfur con-tent. Furthermore, thicker average bed thicknesses allow the bed practice of leaving coal in the roof and floor to reduce the amount of dilution. It is during the washing process that addi-tional coal losses are incurred. Thus, the average mining and process losses for Western coals (table 3 and fig. 5) are several percent lower than Eastern regions. Ironically, there are situ-ations in the West where bed thickness exceeds the maximum practical underground mining height, and some coal must be left in the roof and (or) floor.
Coal leasing unsuitability criteria from the Federal Regulations (43CFR 3461.5)
Other applicable land-use restrictions, coal management Technological restrictions considered
- Federal lands (soc) - Rights of way and easements (soc) - Dwellings, roads, cemeteries, and public buildings
(soc) - Wilderness study areas (env) - Lands with outstanding scenic quality (env) - Lands used for scientific study (env) - Historical lands and sites (soc) - Natural areas (env) - Critical habitat for threatened or endangered species
(env) - State listed threatened/endangered species (env) - Bald or golden eagle nests (env) - Bald and golden eagle roost and concentration areas
(env) - Federal lands containing active falcon cliff nesting
sites (env) - Habitat for migratory bird species (env) - Fish and wildlife habitat for resident species (env) - Flood plains (env) - Municipal watersheds (soc) - National resource waters (env) - Alluvial valley floors (env) - State or Indian Tribe criteria (soc)
- Towns (soc) - Pipelines and power lines (soc) - Industrial sites (soc) - Archaeological areas (soc) - Ownership issues (soc) - Wetlands (env.) - Streams, lakes, and reservoirs (env)
- Burned or oxidized coal - Coal beds too thin to mine - Coal bed discontinuities - Coal beds <40 ft apart (too close) - Coal beds dip too steeply to mine - Roof or floor problems - Minimum and maximum depth limitations on
underground mining - Too close to intrusives or faults - Active mines, barrier pillars - Mined-out, abandoned mine areas - Subsidence over abandoned mines - Slopes too steep to reclaim - Oil and gas development - Resource block size
Coal Resource Availability, Recoverability, and Economic Evaluations in the United States—A Summary 15
As with the case of thin coal beds, surfacing mining also affords much more flexibility when dealing with partings. The coal and parting(s) can be recovered in successive operations with the parting material left discarded in the mine pits. Specialized mining equipment such as the easi-miner (an adaptation of the underground continuous miner) are especially adept at selectively recovering coal from thin beds containing a parting or thicker beds with multiple partings. Finally, mining equipment is typically customized for each operation to maximize coal recovery and minimize dilution. The additional flexibility of surface mining operations to deal with partings and reduce dilution helps maintain acceptable raw coal quality and negates the need for washing, which also helps to minimize processing losses.
Subtraction of the resources lost during mining and processing from the available resources (the amount of origi-nal resources minus mined-out resources and the restricted resources) yields the recoverable resources (table 3 and fig. 5). The portions of the recoverable resources that can be mined at, or less than, the break-even price are considered to be eco-nomically recoverable coal resources. In the Eastern evalu-ations, an average of 33 and 31 percent of the original NAB and the CAB resources were recoverable respectively. Beds in the ILB have a slightly larger recoverability percentage than the CAB or NAB because most of the major mining activ-ity has occurred in the shallower, peripheral portions of the basin. About 36 percent of the remaining resources in the ILB quadrangles evaluated are recoverable using current mining methods.
The percentage of recoverable resources in the Western coal fields ranged from 43 percent in the Uinta Basin to 80 percent in the Gillette coal field of the PRB (table 3 and fig. 5). This range in percentage of recoverable resource for Western coal fields is considerably larger than the range for the Eastern coal fields due in large part to the maturity of the Eastern fields. In addition, total restrictions and mining and process losses in Eastern coal regions are all greater than those in the West, leading to lower recoverable resources in the East than Western coal fields.
The single most important result to note from all the CARS evaluations is the fact that the amount of economically recoverable resources for all the areas evaluated represents only a relatively small fraction (4 percent to 22 percent) of the original resources. This result stresses the need to use coal resource terminology carefully, avoiding the use of the terms “resources” and “economically recoverable resources” interchangeably.
The Western areas generally have higher ratios of eco-nomically recoverable resources to original resources than the Eastern regions. The maturity index in table 3, the ratio of remaining economically recoverable resources to previously mined tonnages, was developed to help explain this trend. It seems intuitive that, as the maturity of a coal field increases, continued production and increasing restrictions should nega-tively affect the amount of economically recoverable resources remaining, and the results from the CARS evaluations confirm this. The maturity index simply provides a quick visual rela-tive ranking of the magnitude of regional development. The percentage of economically recoverable resources for the relatively young Gillette coal field and the Piceance Basin are the highest of the areas evaluated (19 percent and 22 percent) and also have high maturity indices (5.9 and 3.8, respectively). Conversely, the older areas with the lowest economically recoverable resources percentages (13 percent, 10 percent, and 9 percent), the NAB, CAB, and ILB, also have the low maturity indices (0.8, 0.7, and 0.7, respectively).
Summary
The early, areally limited CARS evaluations confirmed the fact that the amount of economically recoverable resources is substantially less than the total original coal resources. To provide decisionmakers and policymakers with the necessary information, a more comprehensive assessment of the Nation’s coal reserves is required, not just another coal resource study. To address this essential need, it is planned that the next phase of U.S. coal assessments will include a systematic inventory of coal reserves of all significant minable coal beds in the major coal basins. It must be stressed again that coal reserve estimations are a dynamic process. The costs of mining and coal sales prices are not static, and both tend to increase over time. If the rate of increase of market prices exceeds the rate of mining cost increases, the reserve base will grow (and the converse). Furthermore, technological advances may also have significant effects on recovery economics and coal reserve estimates. Therefore, coal reserve assessments are not a one-time exercise; the assessments need to be redone periodically as conditions such as new data (geologic, restrictions, and so forth) or significant changes in mining economics warrant.
16 The National Coal Resource Assessment Overview
References
Carter, M.D., and Gardner, N.K, 1989, An assessment of coal resources available for development—Central Appalachian region, first year summary: U.S. Geological Survey Open-File Report 89–362, 52 p.
Carter, M.D., Rohrbacher., T.J., Teeters, D.D., Scott, D.C., Osmonson, L.M., Weisenfluh, G.A., Loud, E.I, Sites, R.S., Axon, A.G., Wolfe, M.E., and Lentz, L.J., 2001, Coal availability, recoverability, and economic evaluations of coal resources in the Northern and Central Appalachian Basin coal regions, Chapter J: U.S. Geological Survey Professional Paper 1625–C, p. J1–J43.
Eggleston, J.R., and Carter, M.D., 1987, A new approach to determining how much coal is available for mining: U.S. Geological Survey Yearbook, p. 57–61.
Eggleston, J.R., Carter, M.D., and Cobb, J.C., 1990, Coal resources available for development—A methodology and pilot study: U.S. Geological Survey Circular 1055, 15 p.
Ellis, M.S., Molnia, C.L., Osmonson, L.M., Ochs, A.M., Rohrbacher, T. J., Mercier, T., and Roberts, L.N.R., 2002, Evaluation of economically extractable coal resources in the Gillette coal field, Powder River Basin, Wyoming: U.S. Geological Survey Open-File Report 2002–180, 48 p., http://geology.cr.usgs.gov/energy/OF02-180/.
Energy Information Administration, 2006, Market trends—Electricity supply, in Annual energy outlook 2006: Energy Information Administration Report DOE/EIA–0383(2006), p. 78–80. (Accessed on the Web on 01/31/07 at http://www.eia.doe.gov/oiaf/aeo/pdf/trend_5.pdf)
Falkie, T.V., and McKelvey, V.E., 1976, Coal resource clas-sification of the U.S. Bureau of Mines and U.S. Geological Survey: U.S. Geological Survey Bulletin 1450–B, 7 p.
Fettweis, G.B., 1979, World Coal Resources: New York, Elsevier Scientific Publishing, 415 p.
Fort Union Coal Assessment Team, 1999, 1999 Resource assessment of selected Tertiary coal seams and zones in the northern Rocky Mountains and Great Plains Region: U.S. Geological survey Professional Paper 1625–A, 2 discs.
Hatch, J.R., and Affolter, R.H., eds., 2002, Resource assess-ment of the Springfield, Herrin, Danville, and Baker coals in the Illinois Basin: U.S. Geological Survey Professional Paper 1625–D, 2 discs.
Kirschbaum, M.A., Roberts, L.N.R., and Biewick, L.R.H., eds., 2000, Geologic assessment of coal in the Colorado Plateau—Arizona, Colorado, New Mexico, and Utah: U.S. Geological Survey Professional Paper 1625–B, 2 discs.
Molnia, C.L., Osmonson, L.M., Wilde, E.M., Biewick, L.R.H., Rohrbacher, T.J., and Carter, M.D., 1999, Coal availability and recoverability studies in the Powder River basin, Wyo-ming and Montana: Chapter PAR in U.S. Geological Survey Professional Paper 1625–A, 119 p.
Northern and Central Appalachian Basin Coal Regions Assessment Team, 2001, 2000 Resource assessment of selected coal seams and zones in the northern and central Appalachian Basin coal regions: U.S. Geological Survey Professional Paper 1625–C, 2 discs.
Osmonson, L.M., Treworgy, C.G., Connolly, C.L., Andrews, W.A., Weisenfluh, G.A., Carter, M.D., and Hatch, J.R., 2002, Availability and recoverability of Illinois Basin Coals: U.S. Geological Survey, Professional Paper 1625–D, Chapter D, p. D1–D45.
Platts, 2006, Coal outlook: McGraw Hill, v. 30, no. 1, p. 2.
Rohrbacher, T.J., Teeters, D.D., Sullivan, G.L., and Osmonson, L.M., 1993a, Coal reserves of the Matewan quadrangle, Kentucky—A coal recoverability study: U.S. Bureau of Mines Information Circular 9355, 36 p.
Rohrbacher, T.J., Molnia, C.L., Osmonson, L.M., Carter, M.D., Eakins, W., Hoffman, G.K., Tabet, D.E., Schultz, J.E., Scott, D.C., Teeters, D.D., Jones, G.E., Quick, J.C., Hock, B., and Hanson, J.A., 2000, Coal availability, recoverability, and economic evaluations of coal resources in the Colorado Plateau, Chapter F, in Colorado, New Mexico, and Utah: U.S. Geological Survey, Professional Paper 1625–B, p. F1–F64.
Rohrbacher, T.J., Teeters, D.D., Sullivan, G.L., and Osmonson, L.M., 1993b, Coal resource recoverability—A methodology: U.S. Bureau of Mines Information Circular 9368, 48 p.
Suffredini, C.D., Plis, M.N., Rohrbacher, T.J., and Teeters, D.D., 1994, COALVAL 2.0, A prefeasibility software package for evaluating coal properties using Lotus 1-2-3, Release 3.1—Documentation and user’s guide: U.S. Bureau of Mines Open-File Report 35–94, 198 p.
Tewalt, S.J., Ruppert, L.F., Bragg, L.J., Carlton , R.W., Brezinski, D.K., Wallack, R.N., and Butler, D.T., 2001, Chapter C, A digital resource model of the upper Pennsylvanian Pittsburgh coal seam, Monongahela Group, Northern Appalachian Basin Coal Region: U.S. Geological Survey Professional Paper 1625–C, 102 p.
Coal Resource Availability, Recoverability, and Economic Evaluations in the United States—A Summary 17
United Nations, 1996, United Nations international frame-work classification for reserves/resources—Solid fuels and mineral commodities: United Nations Economic and Social Council, Economic Commission for Europe, Committee on Sustainable Energy, 174 p.
Weisenfluh, Gerald A., Cobb, James C., Firm, John C., and Ruthven, Carol L., 1997, Kentucky’s coal industry—Historical trends and future opportunities: Kentucky Geological Survey, 9 p.
Wood, G.H., Jr., Kehn, T.M., Carter, M.D., and Culbertson, W.C., 1983, Coal resource classification system of the U.S. Geological Survey: U.S. Geological Survey Circular 891, 65 p.