137 CHAPTER 5 DATA ANALYSIS & INTERPRETATION 5.0 Introduction Data analysis is considered to be important step and heart of the research in research work. Data analysis entails that the analyst break down data into constituent parts to obtain answers to research questions and to test hypotheses. After collection of data with the help of relevant tools and techniques, the next logical step, is to analyze and interpret data with a view to arriving at empirical solution to the problem. This chapter focuses on the analysis and interpretation of data collected for this study and the presentation of data is systematically linked to the format of the questionnaire attached (Annexure - A). The research results are presented and discussed in the following sections - Section-A refers to identification of the mobile subscribers/respondents. It explains the characteristics of the mobile subscribers/respondents - name, place, gender, age, profession monthly income, name of the service provider, duration of services, monthly expenses on services etc. Section-B refers to various problems faced by mobile subscribers/respondents. It is divided into three parts. Section-B Part 1 is based on the various issues related to effectiveness of the network/connectivity.
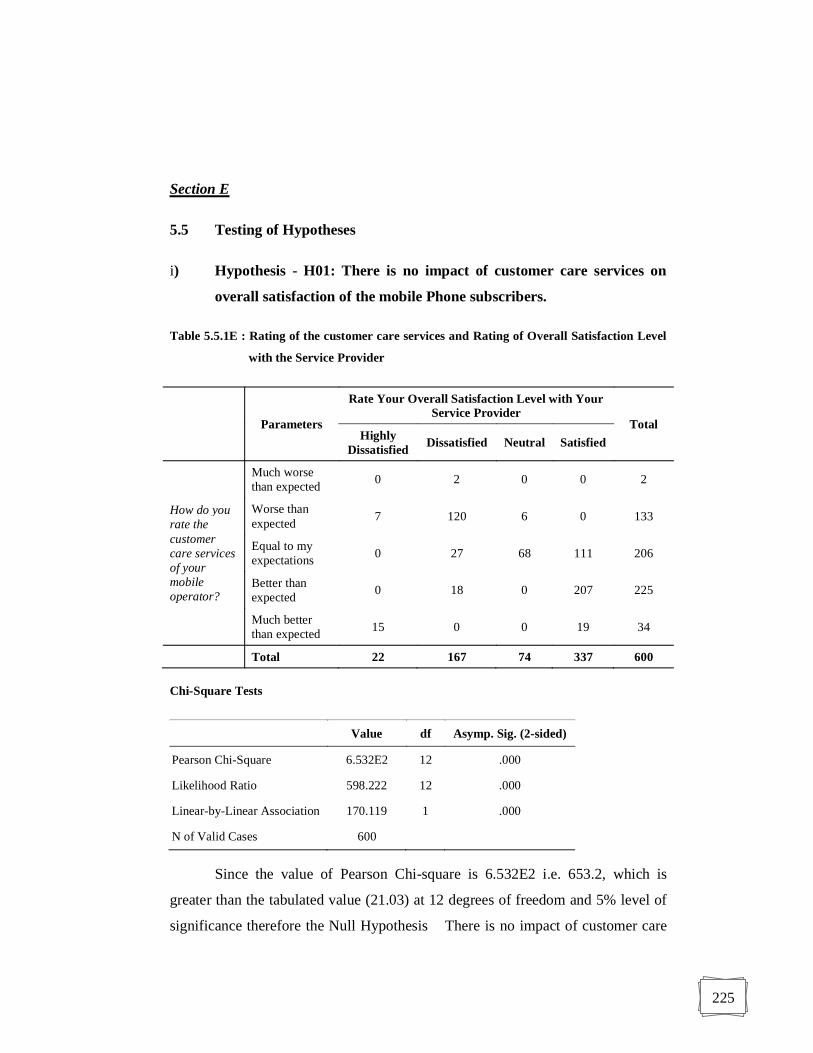
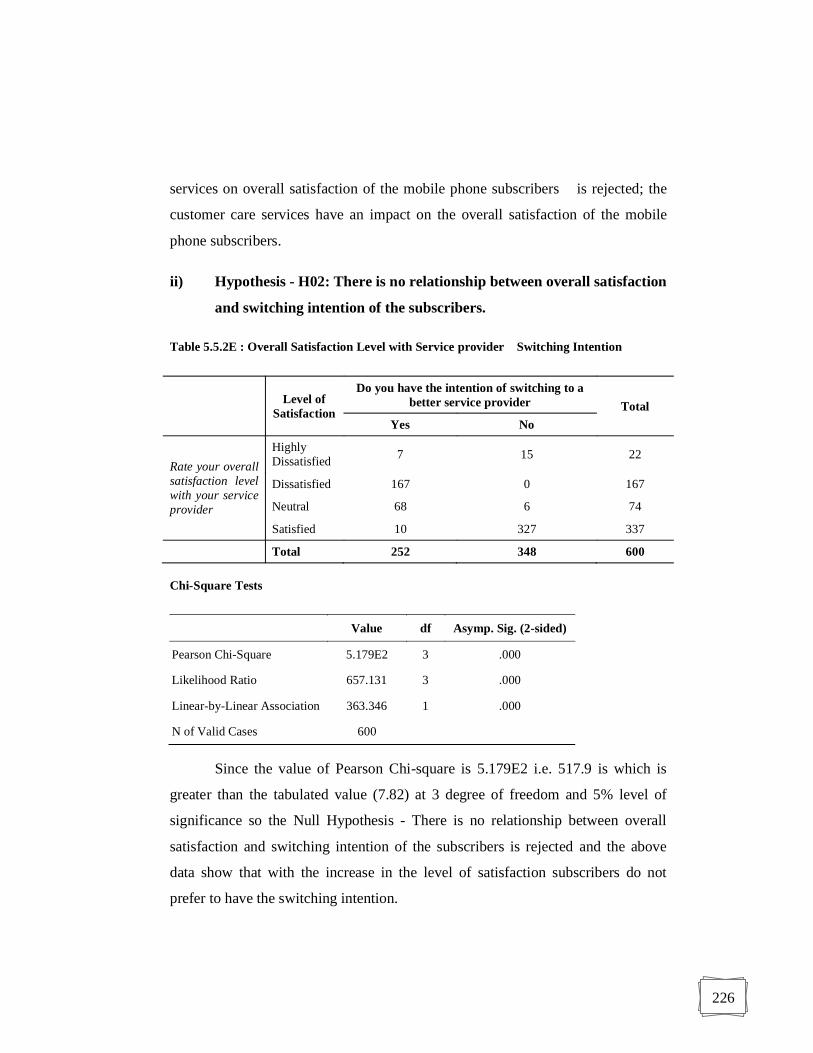
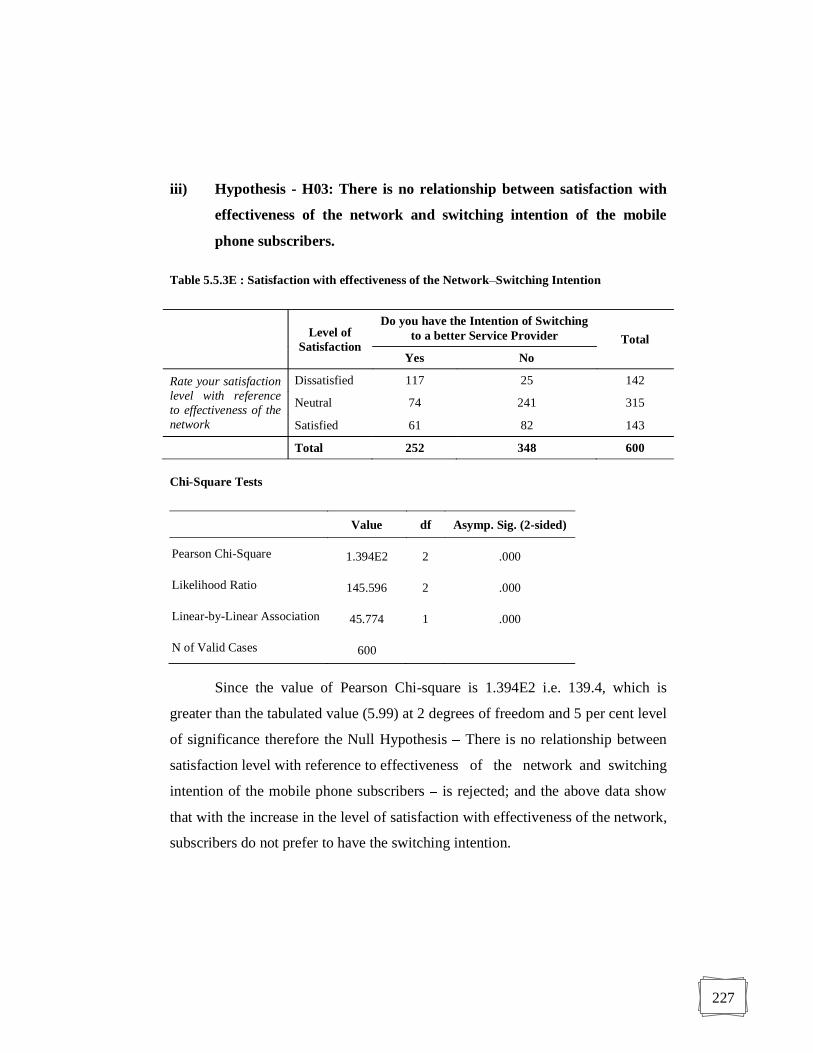
Transcript
137
CHAPTER 5
DATA ANALYSIS & INTERPRETATION
5.0 Introduction
Data analysis is considered to be important step and heart of the research in
research work. Data analysis entails that the analyst break down data into
constituent parts to obtain answers to research questions and to test hypotheses.
After collection of data with the help of relevant tools and techniques, the next
logical step, is to analyze and interpret data with a view to arriving at empirical
solution to the problem. This chapter focuses on the analysis and interpretation of
data collected for this study and the presentation of data is systematically linked to
the format of the questionnaire attached (Annexure - A).
The research results are presented and discussed in the following sections -
Section-A refers to identification of the mobile subscribers/respondents. It
explains the characteristics of the mobile subscribers/respondents - name, place,
gender, age, profession monthly income, name of the service provider, duration of
services, monthly expenses on services etc.
Section-B refers to various problems faced by mobile
subscribers/respondents. It is divided into three parts.
Section-B Part 1 is based on the various issues related to effectiveness of
the network/connectivity.
138
Section-B Part 2 refers to various issues related to satisfaction level of
mobile subscribers with special reference to call charges, tariff plans/billing etc.
Section-B Part 3 discusses various issues related to satisfaction level of
mobile subscribers with special reference to multimedia/value added services.
Section-C is designed to study the satisfaction level of mobile subscribers
with reference to the customer care and the quality dimensions and its overall
impact on rating of their respective service providers.
Section-D is designed to study the level of overall satisfaction of the
mobile phone subscribers with their service providers, their awareness about
MNP, their switching intension and reason(s) for their switching intention and
name of the new service provider in case of switching intention.
Section-E considering the research objectives and the review of literature,
five null hypotheses was set and Chi-Square test is used to study the relationship
between the variables and to perform the hypotheses testing.
Section-F in order to reduce the number of variables being studied and to
understand how many factors may be extracted from the data, the factor analysis
was done with special reference to customer care services and quality dimensions.
139
Section A
5.1 Mobile Subscriber Identification
i) Profile of the Respondents
There are 600 mobile phone subscribers/respondents and the researcher collected
the data from the four major cities of the U.P. (East) circle i.e., 25% mobile phone
subscribers from each city - Varanasi, Kanpur, Lucknow and Allahabad
participated in this study which are given in the table 5.1.1A and figure 5.1.1A.
Table 5.1.1A : City of Respondent(s)
City of Respondents Frequency Percentages
Varanasi 150 25.0
Kanpur 150 25.0
Lucknow 150 25.0
Allahabad 150 25.0
Total 600 100.0
Figure 5.1.1A : City of Respondents
140
ii) Gender of Respondent(s)
This study includes both the genders i.e 63% respondents are male and 37%
respondents are female, indicated in table 5.1.2A and figure 5.1.2A.
Table 5.1.2A : Gender of Respondents
Gender of Respondent Frequency Percentages
Male 378 63.0
Female 222 37.0
Total 600 100.0
Figure 5.1.2A : Gender of Respondents
iii) Age Group
As shown in table 5.1.3A and graph 5.1.3A, it is observed that maximum
respondents (32%) are from the age group 25-35, followed by 24.5% from the age
group 45 +, 17.5% from both the age-groups i.e., 20-25 and 35-45 and only 8.5%
from the below 20 years age group.
141
Table 5.1.3A : Age Group
Age Group Frequency Percentages
Below 20 51 8.5
20-25 105 17.5
25-35 192 32.0
35-45 105 17.5
45 + 147 24.5
Total 600 100.0
Figure 5.1.3A : Age Group
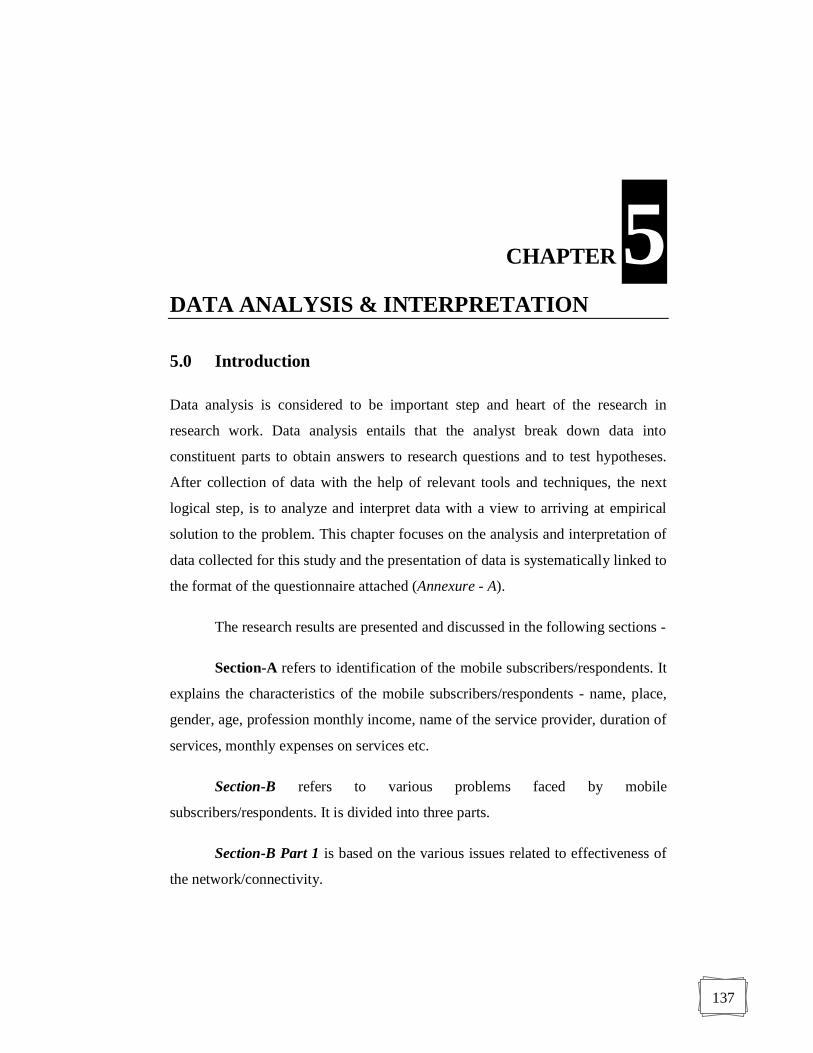
iv) Profession of Respondent(s)
In this study the respondents are from various sections of mobile subscribers. The
table 5.1.4A and figure 5.1.4A describe that 33.5% respondents are in the any
other category which includes basically students and housewives followed by
142
26.5% from Government Services and 26% from Private Service while 14% are
from Self employed/Business category.
Table 5.1.4A : Profession of Respondent(s)
Profession Frequency Percentages
Government Service 159 26.5
Private Service 156 26.0
Self employed/Business 84 14.0
Any other (student/housewives) 201 33.5
Total 600 100.0
Figure 5.1.4A : Profession of Respondent(s)
Profession of Respondents
26%14%
33.5%26.5% Government Service
Private Service
Self employed/BusinessAny other (student/housewives)
v) Monthly Income of Respondent(s)
The table 5.1.5A and figure 5.1.5A explain that in this study maximum mobile
users (40.5%) have the monthly income >Rs.30,000 followed by 34.5% users
have the monthly income <Rs.5,000 while 13.5% respondents have the monthly
income in the range of Rs.15,001-30,000 and only 11.5% mobile users have the
monthly income in the range of Rs. 5,001-15,000.
143
Table 5.1.5A : Monthly Income of Respondent(s)
Monthly Income (in Rs.) Frequency Percentages
<5000 207 34.5
5001 15,000 69 11.5
15001 - 30,000 81 13.5
>30,000 243 40.5
Total 600 100.0
Figure 5.1.5A : Monthly Income of Respondent(s)
vi) Telecommunication Service Provider
The table 5.1.6A and figure 5.1.6A describe that in this study, the researcher has
collected the data from the mobile phone subscribers of all the 9 service providers
in the U.P (East) Circle.22.8% respondents are the users of Airtel followed by
16.7% users of Vodafone, 14.7% of Reliance and 14%, 8%, 10.7%, 5%, 4.3%,
3.8% subscribers are the users of BSNL, Tata, Idea Aircel, Uninor and MTS
respectively.
144
Table 5.1.6A : Telecommunication Service Provider
Name of the Service Provider Frequency Percentages
Airtel 137 22.8
Vodafone 100 16.7
Reliance 88 14.7
BSNL 84 14.0
Tata 48 8.0
Idea 64 10.7
Aircel 30 5.0
Uninor 26 4.3
MTS 23 3.8
Total 600 100.0
Figure 5.1.6A : Telecommunication Service Provider
Name of the Service Providers
22.8%
16.7%
14.7%14%
8%
10.7%5% 4.3% 3.8%
AirtelVodafoneRelianceBSNLTataIdeaAircelUninorMTS
145
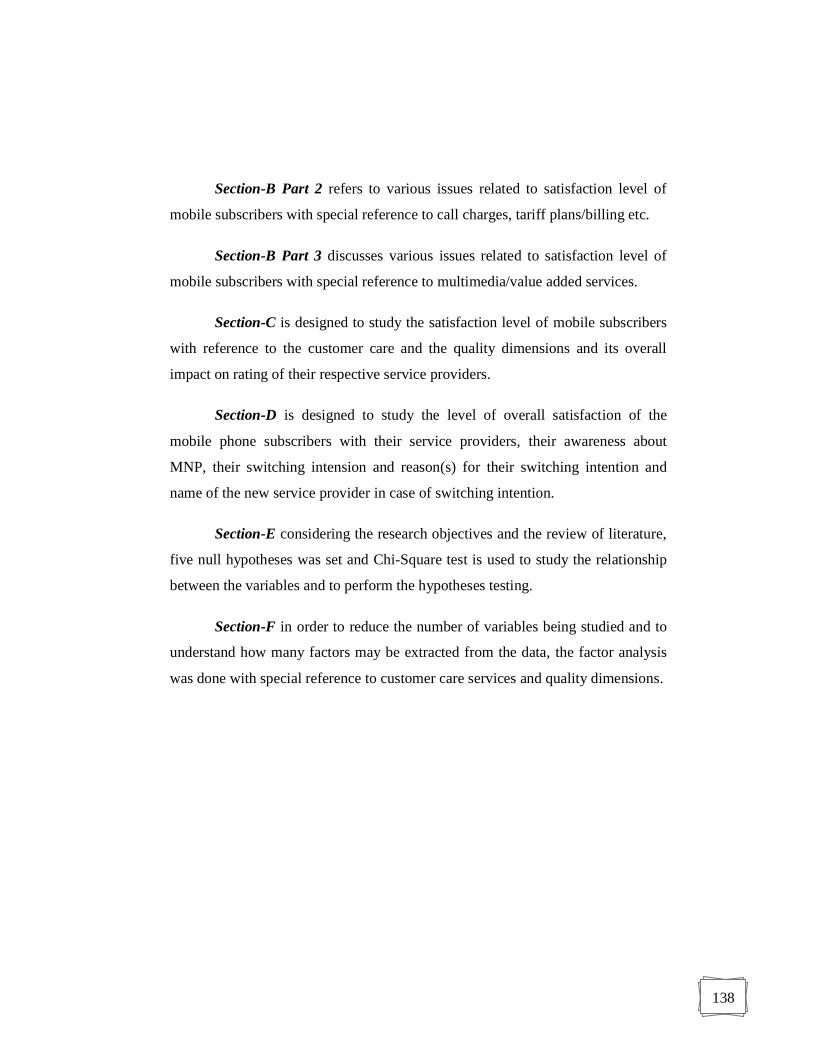
vii) Type of Mobile Communication
In U.P. (East) circle, 73.7% mobile phone subscribers are using the prepaid
mobile services while 26.3% are using the postpaid services as shown in table
5.1.7A and figure 5.1.7A.
Table 5.1.7A : Type of Mobile Communication
Type of Mobile Communication Frequency Percentages
Prepaid 442 73.7
Postpaid 158 26.3
Total 600 100.0
Figure 5.1.7A : Type of Mobile Communication
146
viii) Duration of using this connection
The table 5.1.8A and figure 5.1.8A describe that most of the subscribers (34.2%)
are using the services of their service provider for the last 1 to 2 years followed by
24.7% are the new users i.e., using the services for less than 1 year while 23% and
18.2% are using the services for more than 3 years and for the last 2 to 3 years
respectively.
Table 5.1.8A : How long have you been using this connection?
How long have you been using this connection? Frequency Percentages
Less than 1 year 148 24.7
1 to 2 years 205 34.2
2 to 3 years 109 18.2
More than 3 years 138 23.0
Total 600 100.0
Figure 5.1.8A : How long have you been using this connection?
147
ix) Monthly Expenses on Mobile Phone
It is observed from the table 5.1.9A and figure 5.1.9A, that the monthly expenses
of maximum subscribers (46.5%) are in the range of Rs.300-500 followed by
31.7% mobile users whose monthly expenses are less than Rs.300 while in case of
11.8% and 10% users it is in the range of Rs.501-1000 and more than Rs.1000
respectively.
Table 5.1.9A : Monthly Expenses on Mobile Phone
Monthly Expenses on mobile phone Frequency Percentages
Less than or equal to Rs. 300 190 31.7
Rs 301-500 279 46.5
Rs 501-1000 71 11.8
More than Rs. 1000 60 10.0
Total 600 100.0
Figure 5.1.9A : Monthly Expenses on Mobile Phone
Monthly Expenses on Mobile Phone
10%
46.5%
11.8% 31.7%
Less than or equal to Rs. 300
Rs 301-500
Rs 501-1000
More than Rs. 1000
148
Section B
5.2 A study of customer satisfaction with reference to effectiveness of the
network, billing/call charges and multimedia/value added services.
5.2.1 Part I - Effectiveness of the Network
i) Main Connectivity Problem - Service Provider Wise
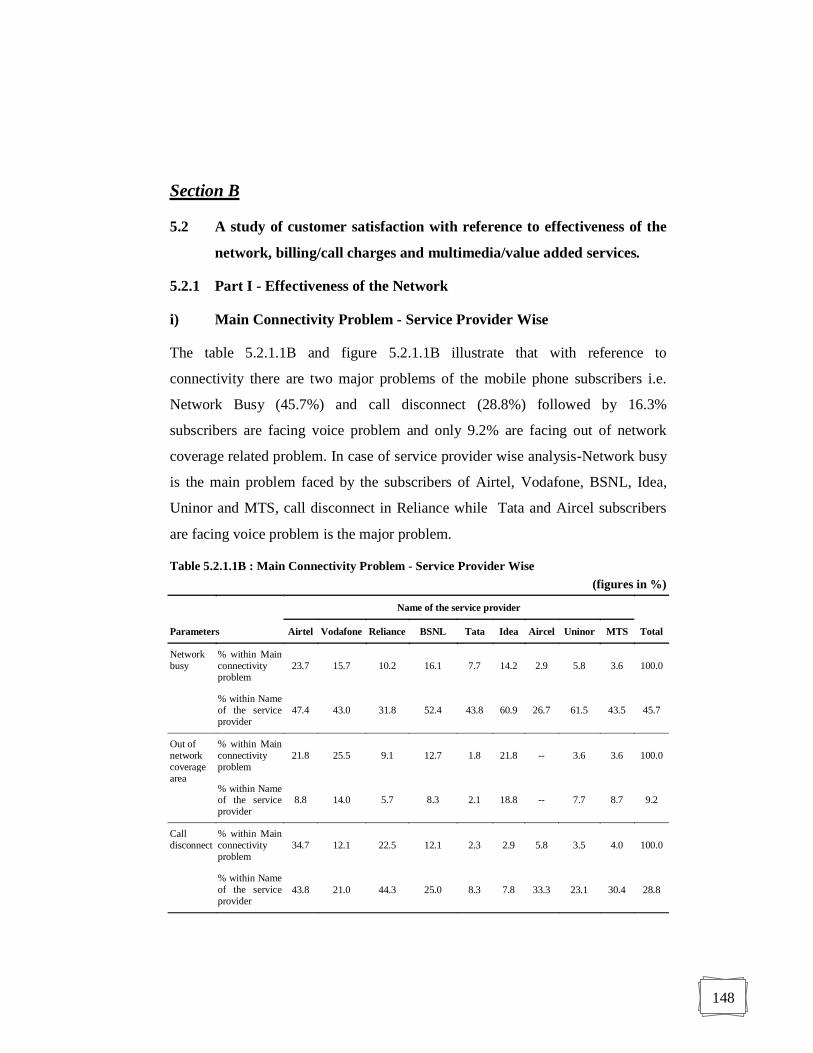
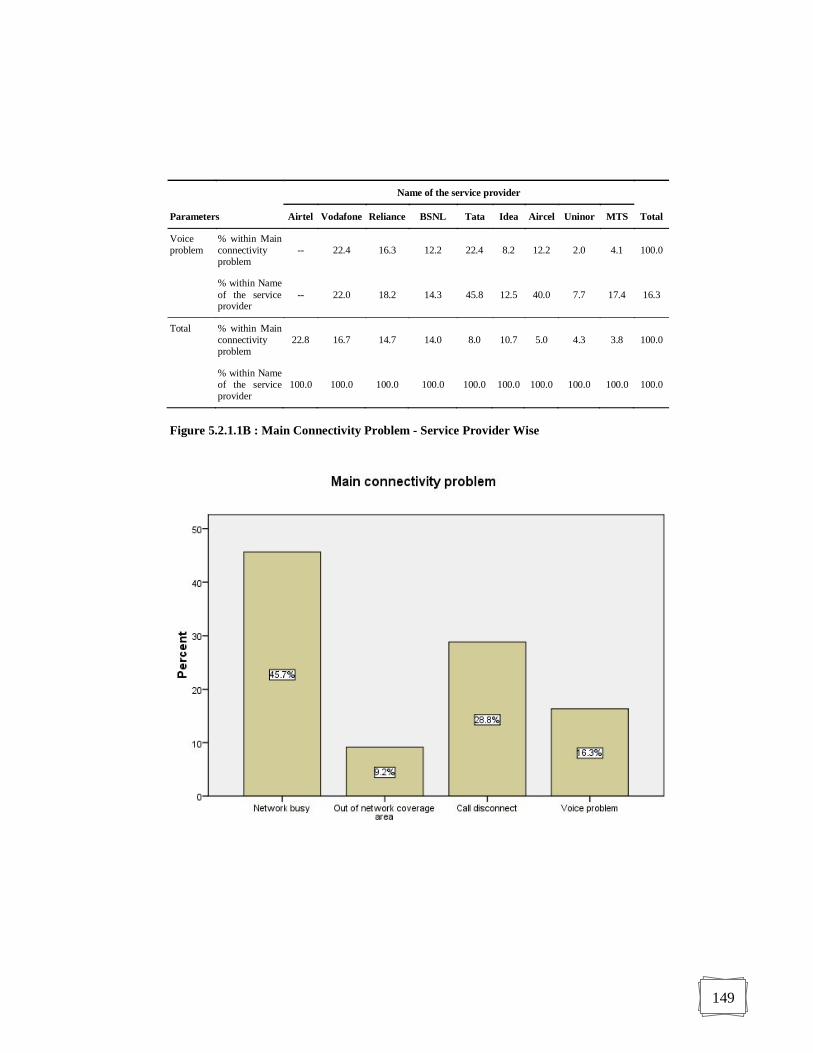
The table 5.2.1.1B and figure 5.2.1.1B illustrate that with reference to
connectivity there are two major problems of the mobile phone subscribers i.e.
Network Busy (45.7%) and call disconnect (28.8%) followed by 16.3%
subscribers are facing voice problem and only 9.2% are facing out of network
coverage related problem. In case of service provider wise analysis-Network busy
is the main problem faced by the subscribers of Airtel, Vodafone, BSNL, Idea,
Uninor and MTS, call disconnect in Reliance while Tata and Aircel subscribers
are facing voice problem is the major problem.
Table 5.2.1.1B : Main Connectivity Problem - Service Provider Wise (figures in %)
Name of the service provider
Total Parameters Airtel Vodafone Reliance BSNL Tata Idea Aircel Uninor MTS
Network busy
% within Main connectivity problem
23.7 15.7 10.2 16.1 7.7 14.2 2.9 5.8 3.6 100.0
% within Name of the service provider
47.4 43.0 31.8 52.4 43.8 60.9 26.7 61.5 43.5 45.7
Out of network coverage area
% within Main connectivity problem
21.8 25.5 9.1 12.7 1.8 21.8 -- 3.6 3.6 100.0
% within Name of the service provider
8.8 14.0 5.7 8.3 2.1 18.8 -- 7.7 8.7 9.2
Call disconnect
% within Main connectivity problem
34.7 12.1 22.5 12.1 2.3 2.9 5.8 3.5 4.0 100.0
% within Name of the service provider
43.8 21.0 44.3 25.0 8.3 7.8 33.3 23.1 30.4 28.8
149
Name of the service provider
Total Parameters Airtel Vodafone Reliance BSNL Tata Idea Aircel Uninor MTS
Figure 5.2.1.1B : Main Connectivity Problem - Service Provider Wise
150
ii) Connectivity Problem Area Service Provider Wise
The table 5.2.1.2B and figure 5.2.1.2B explain that 43.2% subscribers are facing
the connectivity problem within the circle i.e. U.P.(East) circle followed by 32.3%
facing the same problem while traveling and only 24.5% subscribers are facing
the same outside the circle but in case of service provider wise analysis-
maximum subscribers of Tata, Reliance, BSNL and MTS are facing the
connectivity problem within the circle so it is the area of concern for such service
providers.
Table 5.2.1.2B : Service Provider Wise Connectivity Problem Area
(figures in %)
Name of the Service Provider
Total Parameters Airtel Vodafone Reliance BSNL Tata Idea Aircel Uninor MTS
Inside the Circle
% within When did you face network connection problems?
13.9 12.7 21.6 16.2 13.9 9.3 4.6 2.7 5.0 100.0
% within Name of the service provider 26.3 33.0 63.6 50.0 75.0 37.5 40.0 26.9 56.5 43.2
While Traveling
% within When did you face network connection problems?
25.3 21.1 6.2 13.4 5.7 17.5 4.6 4.6 1.5 100.0
% within Name of the service provider 35.8 41.0 13.6 31.0 22.9 53.1 30.0 34.6 13.0 32.3
Outside the Circle
% within When did you face network connection problems?
35.4 17.7 13.6 10.9 0.7 4.1 6.1 6.8 4.8 100.0
% within Name of the service provider 38.0 26.0 22.7 19.0 2.1 9.4 30.0 38.5 30.4 24.5
Total % within When did you face network connection problems?
22.8 16.7 14.7 14.0 8.0 10.7 5.0 4.3 3.8 100.0
% within Name of the service provider 100.0 100.0 100.0 100.0 100.0 100.0 100.0 100.0 100.0 100.0
151
Figure 5.2.1.2B : Service Provider Wise Main Connectivity Problem Area
iii) Specific Hours of the day-when you faced the problem
The table 5.2.1.3B and figure 5.2.1.3B explain that 65.8% subscribers are facing
the connectivity problem during the specific hours of the day i.e. 6 to 9 PM
followed by 30.3% subscribers who are facing the same during 3 to 6 PM. In case
of service provider wise analysis- During 6 to 9 PM maximum subscribers of all
the service providers except Uninor are facing the problem while maximum users
of Uninor are facing it during 3 to 6 PM.
152
Table 5.2.1.3B : Service Provider Wise Specific hours of the day-when you faced the problem
(figures in %)
Name of the Service Provider
Total Parameters Airtel Vodafone Reliance BSNL Tata Idea Aircel Uninor MTS
09:00AM 12:00 Noon
% within Specific hours of the day-when you faced the problem
-- -- 66.7 33.3 -- -- -- -- -- 100.0
% within Name of the service provider -- -- 2.3 1.2 -- -- -- -- -- 0.5
12:00 03:00 PM
% within Specific hours of the day-when you faced the problem
20.0 60.0 -- -- -- 15.0 5.0 -- -- 100.0
% within Name of the service provider 2.9 12.0 -- -- -- 4.7 3.3 -- -- 3.3
03:00 06:00 PM
% within Specific hours of the day-when you faced the problem
23.1 18.7 9.3 16.5 3.3 10.4 7.1 8.2 3.3 100.0
% within Name of the service provider 30.7 34.0 19.3 35.7 12.5 29.7 43.3 57.7 26.1 30.3
06:00 -09:00 PM
% within Specific hours of the day-when you faced the problem
23.0 13.7 17.5 13.4 10.6 10.6 4.1 2.8 4.3 100.0
% within Name of the service provider 66.4 54.0 78.4 63.1 87.5 65.6 53.3 42.3 73.9 65.8
Total % within Specific hours of the day-when you faced the problem
22.8 16.7 14.7 14.0 8.0 10.7 5.0 4.3 3.8 100.0
% within Name of the service provider 100.0 100.0 100.0 100.0 100.0 100.0 100.0 100.0 100.0 100.0
153
Figure 5.2.1.3B : Specific hours of the day-when you faced the problem
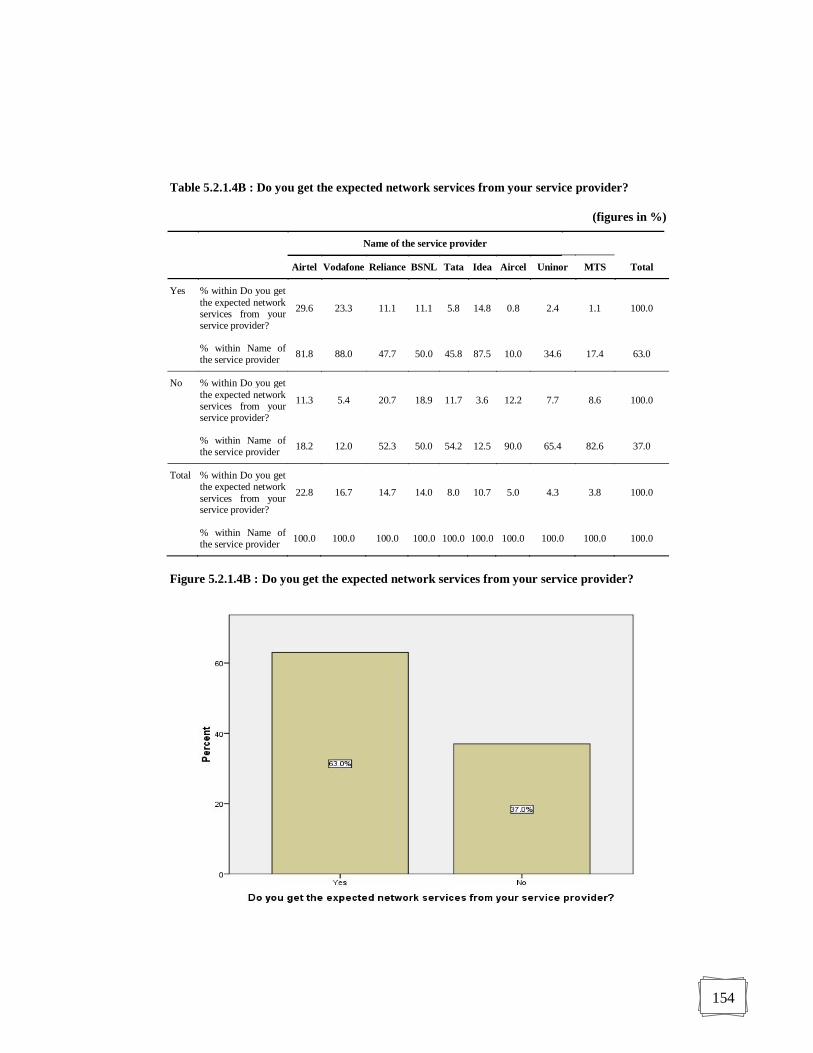
iv) Do you get the expected network services from your service provider?
It is observed from the table 5.2.1.4B and figure 5.2.1.4B that 63% mobile
subscribers are getting the expected services and 37% are not getting the same.
Most of the subscribers of Airtel, Vodafone and Idea are getting the expected
services but it is the area of concern for the service providers-Reliance, Tata,
Aircel, Uninor and MTS.
154
Table 5.2.1.4B : Do you get the expected network services from your service provider?
(figures in %)
Name of the service provider
Airtel Vodafone Reliance BSNL Tata Idea Aircel Uninor MTS Total
Yes % within Do you get the expected network services from your service provider?
29.6 23.3 11.1 11.1 5.8 14.8 0.8 2.4 1.1 100.0
% within Name of the service provider 81.8 88.0 47.7 50.0 45.8 87.5 10.0 34.6 17.4 63.0
No % within Do you get the expected network services from your service provider?
11.3 5.4 20.7 18.9 11.7 3.6 12.2 7.7 8.6 100.0
% within Name of the service provider 18.2 12.0 52.3 50.0 54.2 12.5 90.0 65.4 82.6 37.0
Total % within Do you get the expected network services from your service provider?
22.8 16.7 14.7 14.0 8.0 10.7 5.0 4.3 3.8 100.0
% within Name of the service provider 100.0 100.0 100.0 100.0 100.0 100.0 100.0 100.0 100.0 100.0
Figure 5.2.1.4B : Do you get the expected network services from your service provider?
155
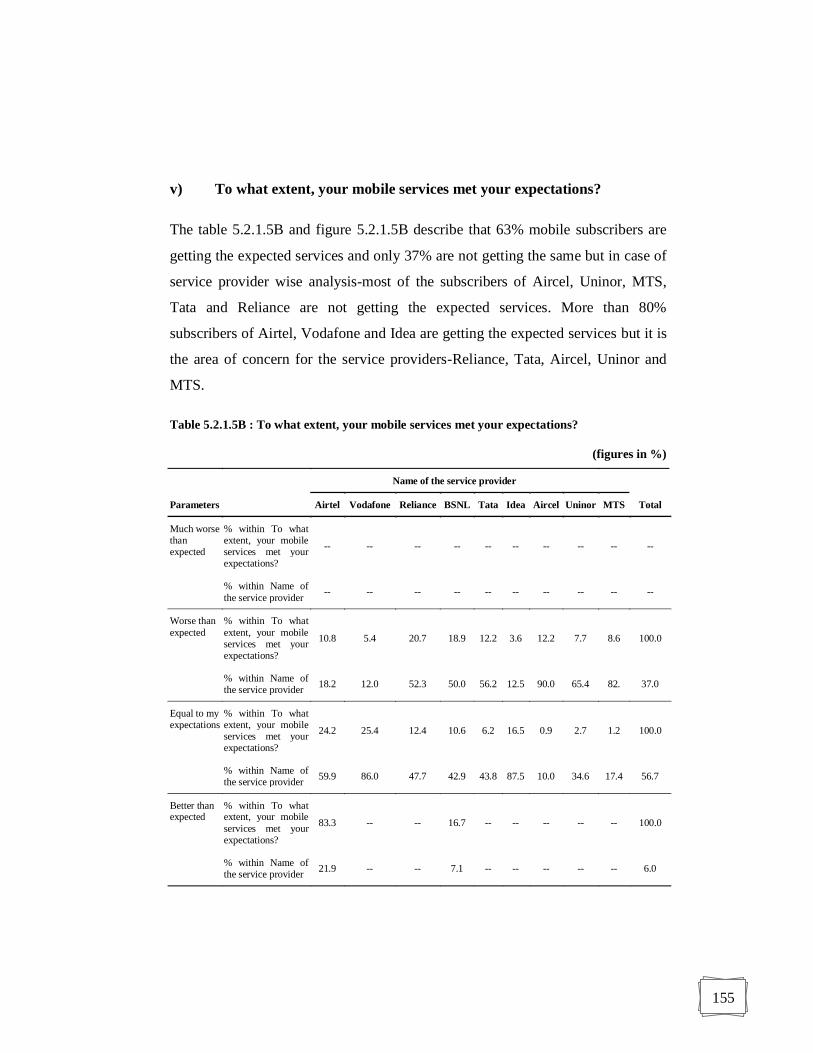
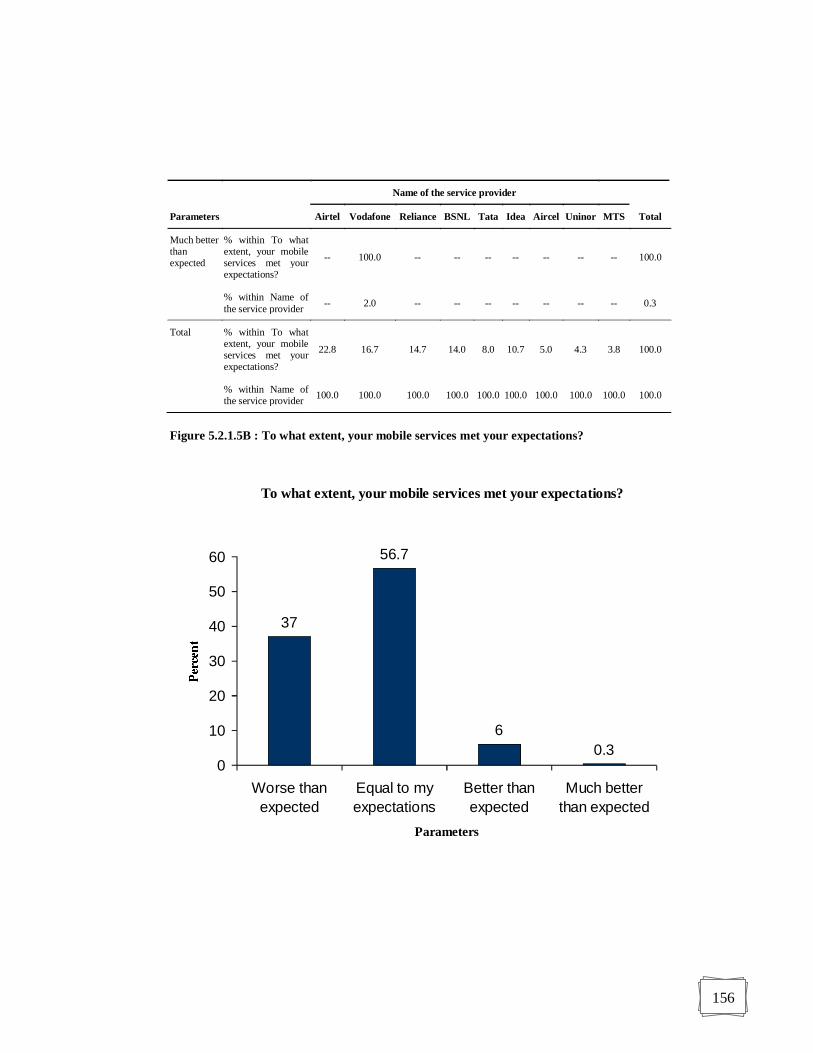
v) To what extent, your mobile services met your expectations?
The table 5.2.1.5B and figure 5.2.1.5B describe that 63% mobile subscribers are
getting the expected services and only 37% are not getting the same but in case of
service provider wise analysis-most of the subscribers of Aircel, Uninor, MTS,
Tata and Reliance are not getting the expected services. More than 80%
subscribers of Airtel, Vodafone and Idea are getting the expected services but it is
the area of concern for the service providers-Reliance, Tata, Aircel, Uninor and
MTS.
Table 5.2.1.5B : To what extent, your mobile services met your expectations?
(figures in %)
Name of the service provider
Parameters Airtel Vodafone Reliance BSNL Tata Idea Aircel Uninor MTS Total
Much worse than expected
% within To what extent, your mobile services met your expectations?
-- -- -- -- -- -- -- -- -- --
% within Name of the service provider -- -- -- -- -- -- -- -- -- --
Worse than expected
% within To what extent, your mobile services met your expectations?
10.8 5.4 20.7 18.9 12.2 3.6 12.2 7.7 8.6 100.0
% within Name of the service provider 18.2 12.0 52.3 50.0 56.2 12.5 90.0 65.4 82. 37.0
Equal to my expectations
% within To what extent, your mobile services met your expectations?
24.2 25.4 12.4 10.6 6.2 16.5 0.9 2.7 1.2 100.0
% within Name of the service provider 59.9 86.0 47.7 42.9 43.8 87.5 10.0 34.6 17.4 56.7
Better than expected
% within To what extent, your mobile services met your expectations?
83.3 -- -- 16.7 -- -- -- -- -- 100.0
% within Name of the service provider 21.9 -- -- 7.1 -- -- -- -- -- 6.0
156
Name of the service provider
Parameters Airtel Vodafone Reliance BSNL Tata Idea Aircel Uninor MTS Total
Much better than expected
% within To what extent, your mobile services met your expectations?
-- 100.0 -- -- -- -- -- -- -- 100.0
% within Name of the service provider -- 2.0 -- -- -- -- -- -- -- 0.3
Total % within To what extent, your mobile services met your expectations?
22.8 16.7 14.7 14.0 8.0 10.7 5.0 4.3 3.8 100.0
% within Name of the service provider 100.0 100.0 100.0 100.0 100.0 100.0 100.0 100.0 100.0 100.0
Figure 5.2.1.5B : To what extent, your mobile services met your expectations?
To what extent, your mobile services met your expectations?
37
56.7
60.3
0
10
20
30
40
50
60
Worse thanexpected
Equal to myexpectations
Better thanexpected
Much betterthan expected
Parameters
157
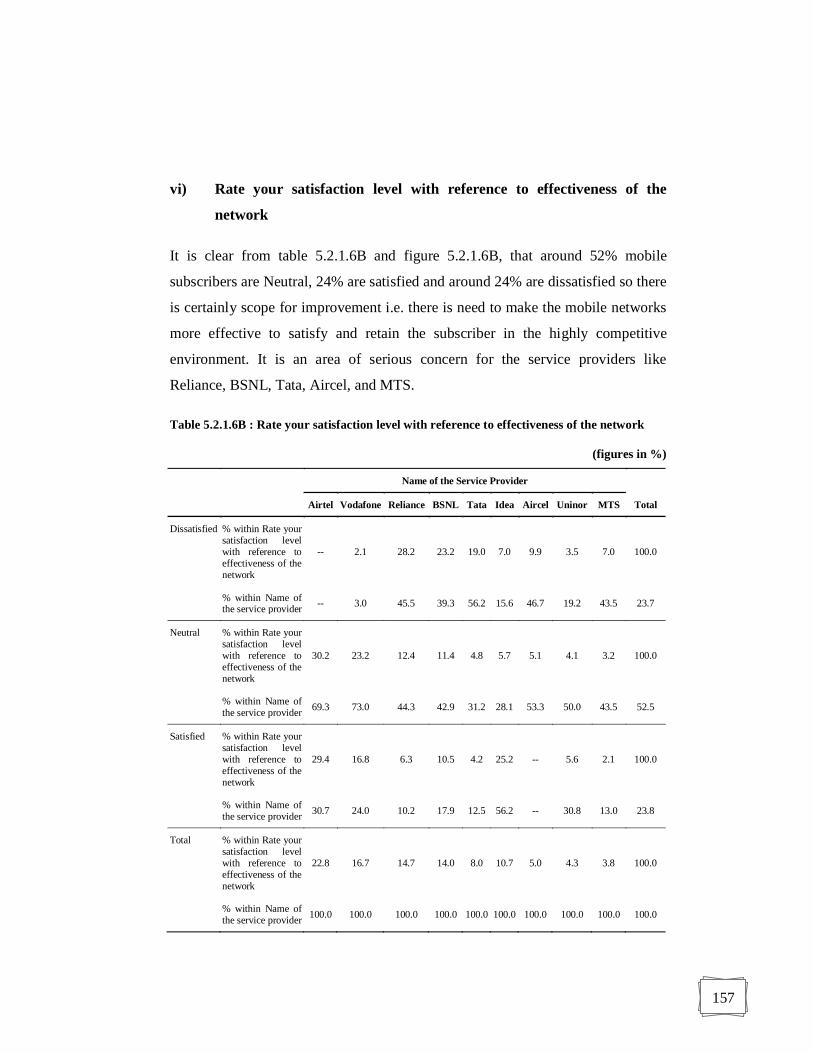
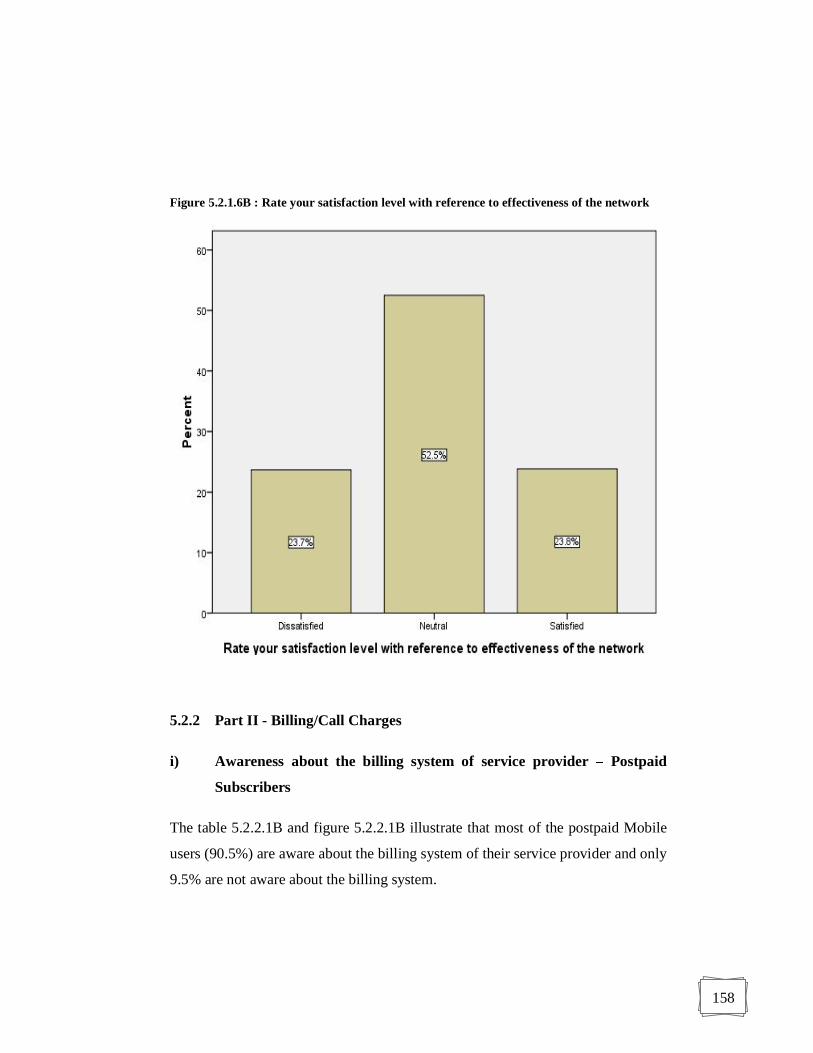
vi) Rate your satisfaction level with reference to effectiveness of the
network
It is clear from table 5.2.1.6B and figure 5.2.1.6B, that around 52% mobile
subscribers are Neutral, 24% are satisfied and around 24% are dissatisfied so there
is certainly scope for improvement i.e. there is need to make the mobile networks
more effective to satisfy and retain the subscriber in the highly competitive
environment. It is an area of serious concern for the service providers like
Reliance, BSNL, Tata, Aircel, and MTS.
Table 5.2.1.6B : Rate your satisfaction level with reference to effectiveness of the network
(figures in %)
Name of the Service Provider
Total Airtel Vodafone Reliance BSNL Tata Idea Aircel Uninor MTS
Dissatisfied % within Rate your satisfaction level with reference to effectiveness of the network
-- 2.1 28.2 23.2 19.0 7.0 9.9 3.5 7.0 100.0
% within Name of the service provider -- 3.0 45.5 39.3 56.2 15.6 46.7 19.2 43.5 23.7
Neutral % within Rate your satisfaction level with reference to effectiveness of the network
30.2 23.2 12.4 11.4 4.8 5.7 5.1 4.1 3.2 100.0
% within Name of the service provider 69.3 73.0 44.3 42.9 31.2 28.1 53.3 50.0 43.5 52.5
Satisfied % within Rate your satisfaction level with reference to effectiveness of the network
29.4 16.8 6.3 10.5 4.2 25.2 -- 5.6 2.1 100.0
% within Name of the service provider 30.7 24.0 10.2 17.9 12.5 56.2 -- 30.8 13.0 23.8
Total % within Rate your satisfaction level with reference to effectiveness of the network
22.8 16.7 14.7 14.0 8.0 10.7 5.0 4.3 3.8 100.0
% within Name of the service provider 100.0 100.0 100.0 100.0 100.0 100.0 100.0 100.0 100.0 100.0
158
Figure 5.2.1.6B : Rate your satisfaction level with reference to effectiveness of the network
5.2.2 Part II - Billing/Call Charges
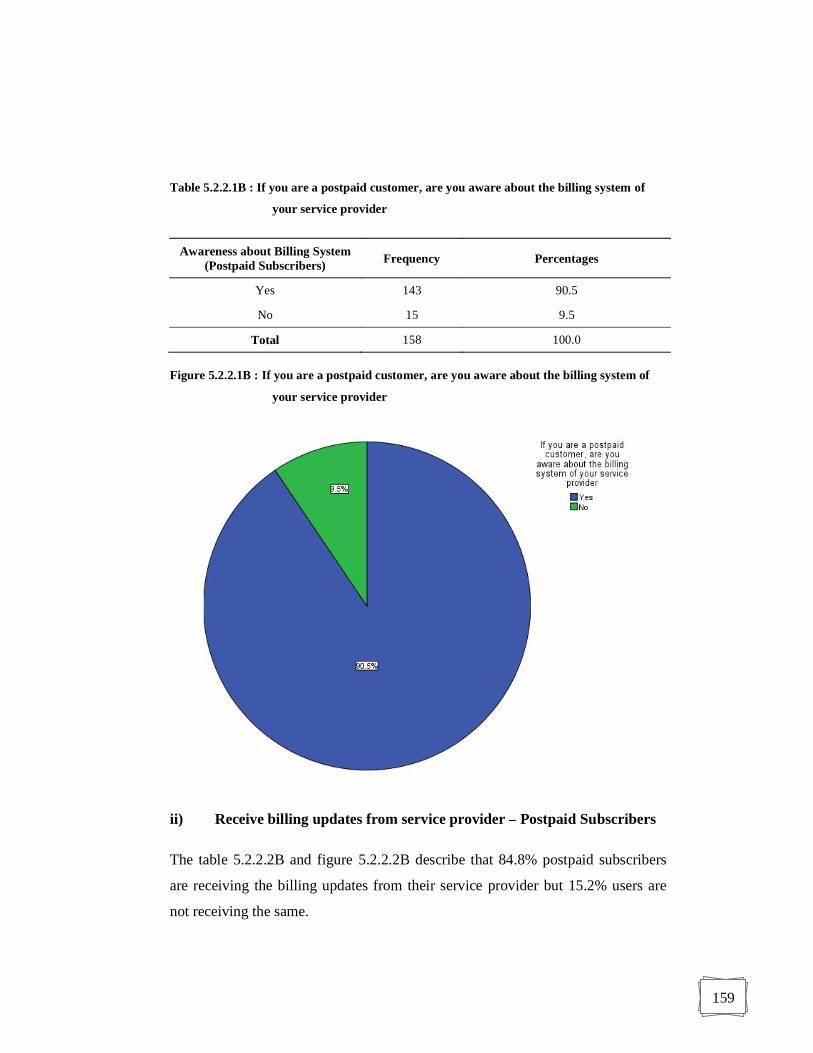
i) Awareness about the billing system of service provider Postpaid
Subscribers
The table 5.2.2.1B and figure 5.2.2.1B illustrate that most of the postpaid Mobile
users (90.5%) are aware about the billing system of their service provider and only
9.5% are not aware about the billing system.
159
Table 5.2.2.1B : If you are a postpaid customer, are you aware about the billing system of
your service provider
Awareness about Billing System (Postpaid Subscribers) Frequency Percentages
Yes 143 90.5
No 15 9.5
Total 158 100.0
Figure 5.2.2.1B : If you are a postpaid customer, are you aware about the billing system of
your service provider
ii) Receive billing updates from service provider Postpaid Subscribers
The table 5.2.2.2B and figure 5.2.2.2B describe that 84.8% postpaid subscribers
are receiving the billing updates from their service provider but 15.2% users are
not receiving the same.
160
Table 5.2.2.2B : If you are a postpaid customer, do you receive billing updates from your
service provider
Received Billing Updates from Service Provider (Postpaid
Subscriber) Frequency Percentages
Yes 134 84.8
No 24 15.2
Total 158 100.0
Figure 5.2.2.2B : If you are a postpaid customer, do you receive billing updates from your
service provider
161
iii) Level of Satisfaction with the Billing Service of service provider
Postpaid Subscribers
It is depicted in table 5.2.2.3B and figure 5.2.2.3B that around 78% postpaid
service users are satisfied with the billing services of their service providers, 12%
are somewhat satisfied and only 10% are dissatisfied and it is area for concern for
the Airtel and Aircel.
Table 5.2.2.3B : If you are a postpaid customer, are you satisfied with the billing services of
your service provider?
(figures in %)
Name of the Service Provider
Total Parameters Airtel Vodafone Reliance BSNL Tata Idea Aircel
Dissatisfied % within If you are a postpaid customer, are you satisfied with the billing services of your service provider?
93.8 -- -- -- -- -- 6.2 100.0
% within Name of the service provider 23.1 -- -- -- -- -- 8.3 10.1
Somewhat Satisfied
% within If you are a postpaid customer, are you satisfied with the billing services of your service provider?
21.1 -- 42.1 -- 5.3 26.3 5.3 100.0
% within Name of the service provider 6.2 -- 30.8 -- 50.0 22.7 8.3 12.0
Satisfied % within If you are a postpaid customer, are you satisfied with the billing services of your service provider?
37.4 15.4 14.6 9.8 0.8 13.8 8.1 100.0
% within Name of the service provider 70.8 100.0 69.2 100.0 50.0 77.3 83.3 77.8
Total % within If you are a postpaid customer, are you satisfied with the billing services of your service provider?
41.1 12.0 16.5 7.6 1.3 13.9 7.6 100.0
% within Name of the service provider 100.0 100.0 100.0 100.0 100.0 100.0 100.0 100.0
162
Figure 5.2.2.3B : If you are a postpaid customer, are you satisfied with the billing services of
your service provider?
iv) Awareness about Tariff Plans of Service Provider Prepaid
Subscribers
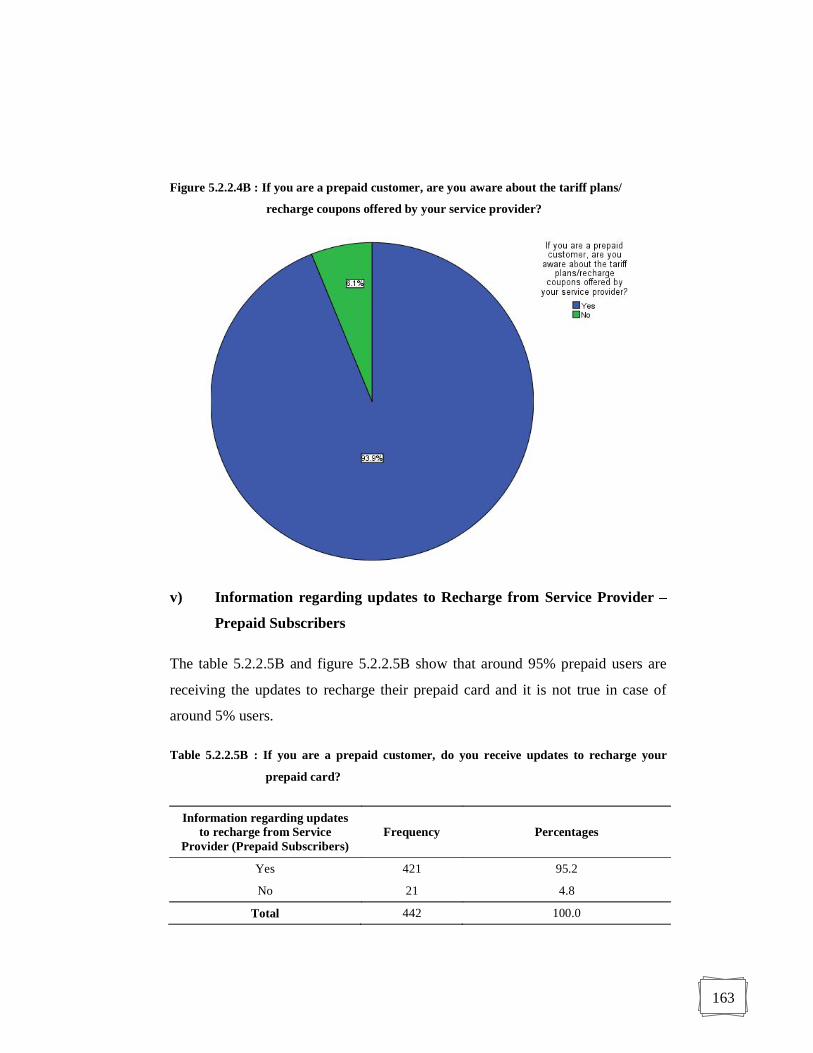
The table 5.2.2.4B and figure 5.2.2.4B describe that around 94% prepaid users are
aware about the tariff plans/recharge coupons offered by their service providers
but around 6% respondents are not aware about the same.
Table 5.2.2.4B : If you are a prepaid customer, are you aware about the tariff plans/recharge
coupons offered by your service provider?
Awareness about Tariff Plans of Service Provider (Prepaid
Subscribers) Frequency Percentages
Yes 415 93.9
No 27 6.1
Total 442 100.0
163
Figure 5.2.2.4B : If you are a prepaid customer, are you aware about the tariff plans/
recharge coupons offered by your service provider?
v) Information regarding updates to Recharge from Service Provider
Prepaid Subscribers
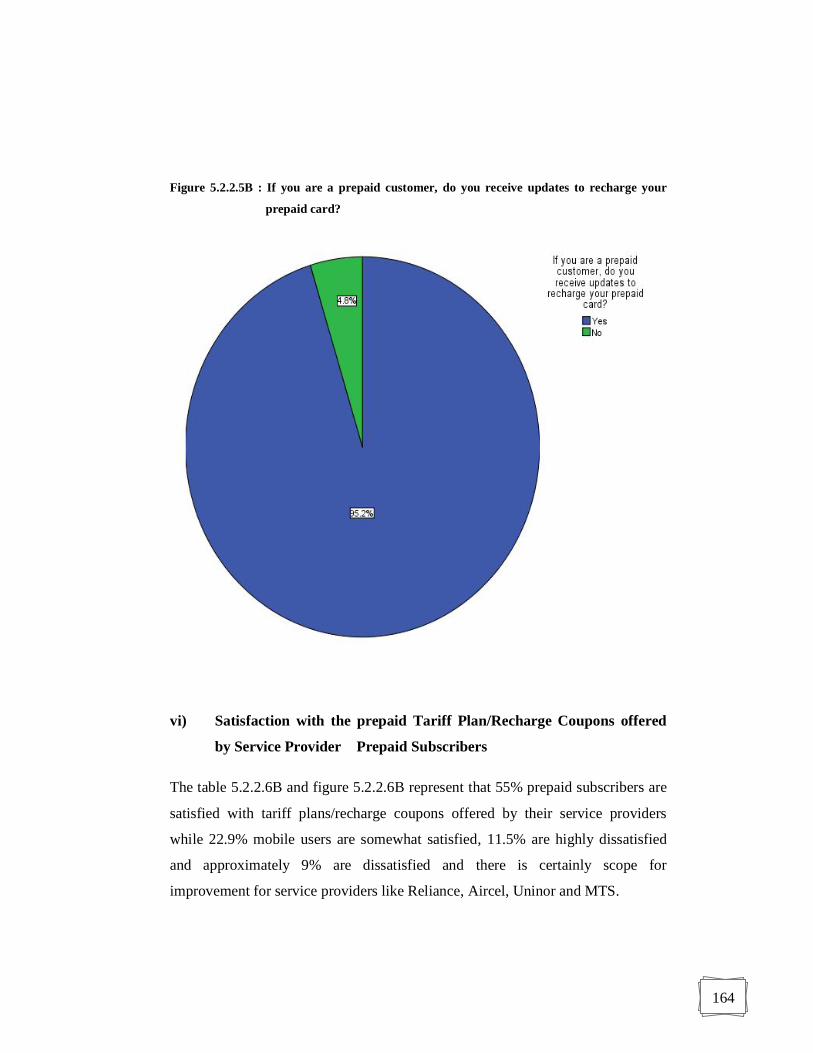
The table 5.2.2.5B and figure 5.2.2.5B show that around 95% prepaid users are
receiving the updates to recharge their prepaid card and it is not true in case of
around 5% users.
Table 5.2.2.5B : If you are a prepaid customer, do you receive updates to recharge your
prepaid card?
Information regarding updates to recharge from Service
Provider (Prepaid Subscribers) Frequency Percentages
Yes 421 95.2
No 21 4.8
Total 442 100.0
164
Figure 5.2.2.5B : If you are a prepaid customer, do you receive updates to recharge your
prepaid card?
vi) Satisfaction with the prepaid Tariff Plan/Recharge Coupons offered
by Service Provider Prepaid Subscribers
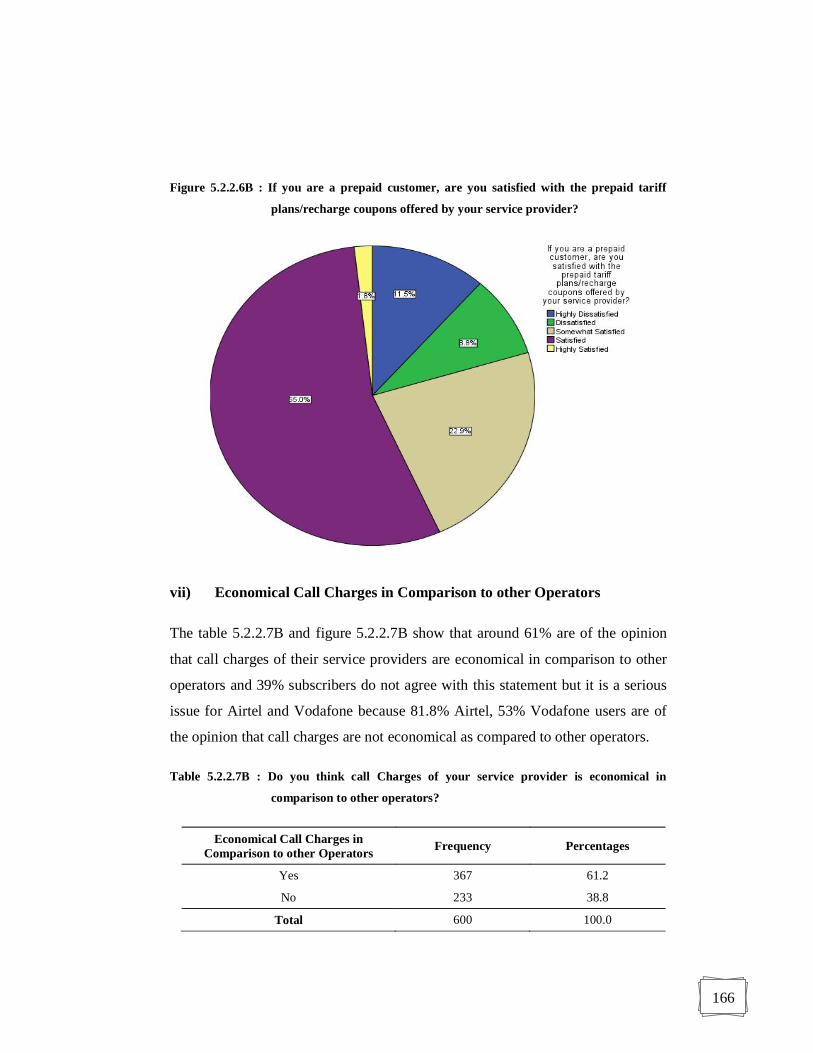
The table 5.2.2.6B and figure 5.2.2.6B represent that 55% prepaid subscribers are
satisfied with tariff plans/recharge coupons offered by their service providers
while 22.9% mobile users are somewhat satisfied, 11.5% are highly dissatisfied
and approximately 9% are dissatisfied and there is certainly scope for
improvement for service providers like Reliance, Aircel, Uninor and MTS.
165
Table 5.2.2.6B : If you are a prepaid customer, are you satisfied with the prepaid tariff
plans/recharge coupons offered by your service provider?
(figures in %)
Name of the Service Provider
Parameters Airtel Vodafone Reliance BSNL Tata Idea Aircel Uninor MTS Total
Highly Dissatisfied
% within If you are a prepaid customer, are you satisfied with the prepaid tariff plans/ recharge coupons offered by your service provider?
5.9 5.9 41.2 35.3 -- -- -- 11.8 -- 100.0
% within Name of the service provider 4.2 3.7 33.9 25.0 -- -- -- 23.1 -- 11.5
Dissatisfied % within If you are a prepaid customer, are you satisfied with the prepaid tariff plans/recharge coupons offered by your service provider?
23.1 -- 10.3 -- -- -- 12.8 23.1 30.8 100.0
% within Name of the service provider 12.5 -- 6.5 -- -- -- 27.8 34.6 52.2 8.8
Somewhat Satisfied
% within If you are a prepaid customer, are you satisfied with the prepaid tariff plans/recharge coupons offered by your service provider?
23.8 15.8 9.9 9.9 24.8 10.9 1.0 2.0 2.0 100.0
% within Name of the service provider 33.3 19.8 16.1 13.9 54.3 26.2 5.6 7.7 8.7 22.9
Satisfied % within If you are a prepaid customer, are you satisfied with the prepaid tariff plans/recharge coupons offered by your service provider?
14.8 25.5 10.3 16.9 8.6 12.8 4.5 3.3 3.3 100.0
% within Name of the service provider 50.0 76.5 40.3 56.9 45.7 73.8 61.1 30.8 34.8 55.0
Highly Satisfied
% within If you are a prepaid customer, are you satisfied with the prepaid tariff plans/recharge coupons offered by your service provider?
-- -- 25.0 37.5 -- -- 12.5 12.5 12.5 100.0
% within Name of the service provider -- -- 3.2 4.2 -- -- 5.6 3.8 4.3 1.8
Total % within If you are a prepaid customer, are you satisfied with the prepaid tariff plans/recharge coupons offered by your service provider?
16.3 18.3 14.0 16.3 10.4 9.5 4.1 5.9 5.2 100.0
% within Name of the service provider 100.0 100.0 100.0 100.0 100.0 100.0 100.0 100.0 100.0 100.0
166
Figure 5.2.2.6B : If you are a prepaid customer, are you satisfied with the prepaid tariff
plans/recharge coupons offered by your service provider?
vii) Economical Call Charges in Comparison to other Operators
The table 5.2.2.7B and figure 5.2.2.7B show that around 61% are of the opinion
that call charges of their service providers are economical in comparison to other
operators and 39% subscribers do not agree with this statement but it is a serious
issue for Airtel and Vodafone because 81.8% Airtel, 53% Vodafone users are of
the opinion that call charges are not economical as compared to other operators.
Table 5.2.2.7B : Do you think call Charges of your service provider is economical in
comparison to other operators?
Economical Call Charges in Comparison to other Operators Frequency Percentages
Yes 367 61.2
No 233 38.8
Total 600 100.0
167
Figure 5.2.2.7B : Do you think call Charges of your service provider is economical in
comparison to other operators? (Service Provider Wise)
viii) Satisfaction Level with Reference to Call Charges
As far as Rating of satisfaction level with reference to call charges is concerned
only10.2% subscribers are highly satisfied followed by 48% satisfied, 12.7% are
neutral, 27.7% are dissatisfied and only 1.5% are highly dissatisfied but the above
table shows that it is the area of concern for the service providers like Airtel,
Vodafone and Idea. New players like Aircel, Uninor and MTS are offering their
services at economical rates. It is described in table 5.2.2.8B and figure 5.2.2.8B.
168
Table 5.2.2.8B : Rate your satisfaction level with reference to call charges. (Service Provider wise)
(figures in %) Name of the Service Provider
Total Parameters Airtel Vodafone Reliance BSNL Tata Idea Aircel Uninor MTS
Highly Dissatisfied
% within Rate your satisfaction level with reference to call charges
33.3 33.3 -- -- -- 33.3 -- -- -- 100.0
% within Name of the service provider 2.2 3.0 -- -- -- 4.7 -- -- -- 1.5
Dissatisfied % within Rate your satisfaction level with reference to call charges
55.4 16.9 5.4 5.4 4.8 10.8 0.6 0.6 -- 100.0
% within Name of the service provider 67.2 28.0 10.2 10.7 16.7 28.1 3.3 3.8 -- 27.7
Neutral % within Rate your satisfaction level with reference to call charges
5.3 25.0 23.7 11.8 14.5 11.8 3.9 -- 3.9 100.0
% within Name of the service provider 2.9 19.0 20.5 10.7 22.9 14.1 10.0 -- 13.0 12.7
Satisfied % within Rate your satisfaction level with reference to call charges
12.2 13.5 13.5 17.4 9.7 11.8 8.3 8.0 5.6 100.0
% within Name of the service provider 25.5 39.0 44.3 59.5 58.3 53.1 80.0 88.5 69.6 48.0
Highly Satisfied % within Rate your satisfaction level with reference to call charges
4.9 18.0 36.1 26.2 1.6 -- 3.3 3.3 6.6 100.0
% within Name of the service provider 2.2 11.0 25.0 19.0 2.1 -- 6.7 7.7 17.4 10.2
Total % within Rate your satisfaction level with reference to call charges
22.8 16.7 14.7 14.0 8.0 10.7 5.0 4.3 3.8 100.0
% within Name of the service provider 100.0 100.0 100.0 100.0 100.0 100.0 100.0 100.0 100.0 100.0
Figure 5.2.2.8B : Rate your satisfaction level with reference to call charges. (Service Provider wise)
169
5.2.3 Part III - Multimedia/Value added Services
i) Awareness about 3G (3rd generation) Technology
The table 5.2.3.1B and figure 5.2.3.1B illustrate that around 84% mobile phone
subscribers are aware about the new-3G technology and around 16% are not
aware about it.
Table 5.2.3.1B : Are you aware about 3G (3rd generation) technology?
Awareness about 3G Technology Frequency Percentages
Yes 506 84.3
No 94 15.7
Total 600 100.0
Figure 5.2.3.1B : Are you aware about 3G (3rd generation) technology?
170
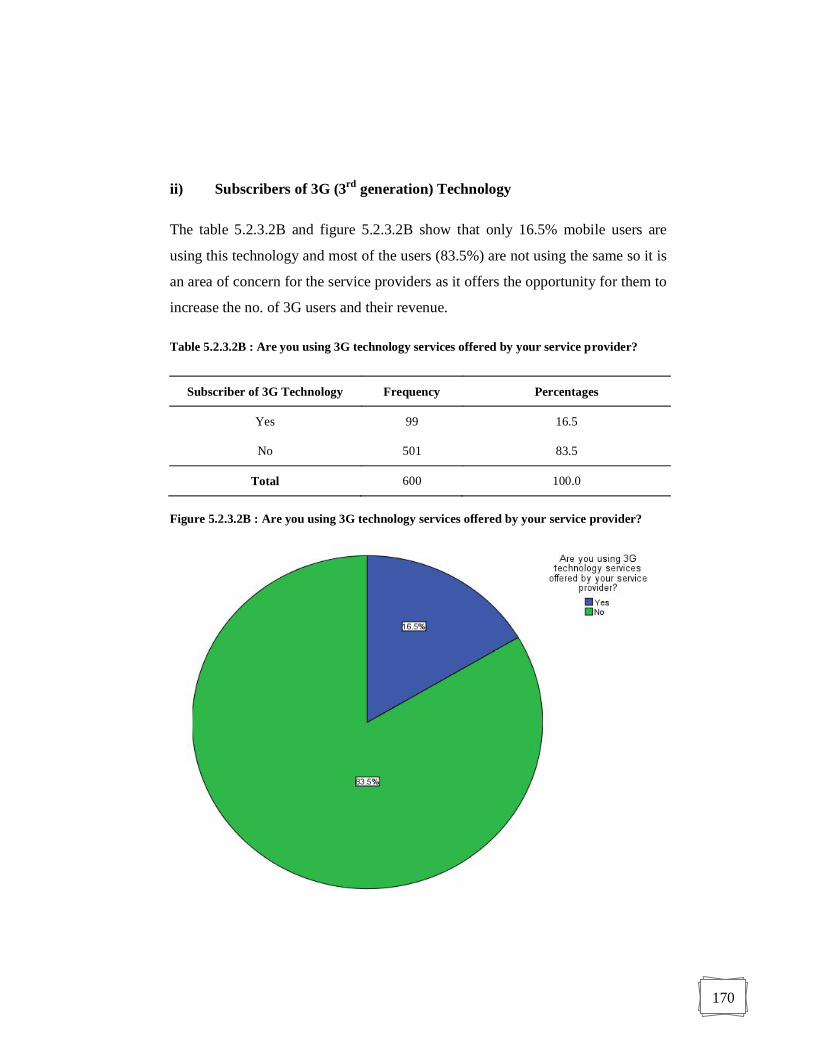
ii) Subscribers of 3G (3rd generation) Technology
The table 5.2.3.2B and figure 5.2.3.2B show that only 16.5% mobile users are
using this technology and most of the users (83.5%) are not using the same so it is
an area of concern for the service providers as it offers the opportunity for them to
increase the no. of 3G users and their revenue.
Table 5.2.3.2B : Are you using 3G technology services offered by your service provider?
Subscriber of 3G Technology Frequency Percentages
Yes 99 16.5
No 501 83.5
Total 600 100.0
Figure 5.2.3.2B : Are you using 3G technology services offered by your service provider?
171
iii) Accessibility to Internet Facilities Offered by Service Provider
It is depicted in table 5.2.3.3B and figure 5.2.3.3B that around 58% mobile users
are using Internet/Broadband/E-mail facilities offered by your service provider
and around 42% are not using the same.
Table 5.2.3.3B : Are you using Internet/Broadband/E-mail facilities offered by your service
provider through mobile phone?
Accessibility to Internet Facilities Frequency Percentages
Yes 350 58.3
No 250 41.7
Total 600 100.0
Figure 5.2.3.3B : Are you using Internet/Broadband/E-mail facilities offered by your service
provider through mobile phone?
172
iv) Regular Updates regarding Various Value Added Services offered by
Service Provider
Table 5.2.3.4B and figure 5.2.3.4B explain that all the subscribers (100%) are
getting regular updates for various value added services offered by their service
provider. It means that service providers are already working on it to maximize
their revenue.
Table 5.2.3.4B : Are you getting regular updates regarding various value added services
offered by your service provider?
Regular Updates regarding Value Added Services Frequency Percentages
Yes 600 100
No -- --
Total 600 100.0
Figure 5.2.3.4B : Are you getting regular updates regarding various value added services
offered by your service provider?
173
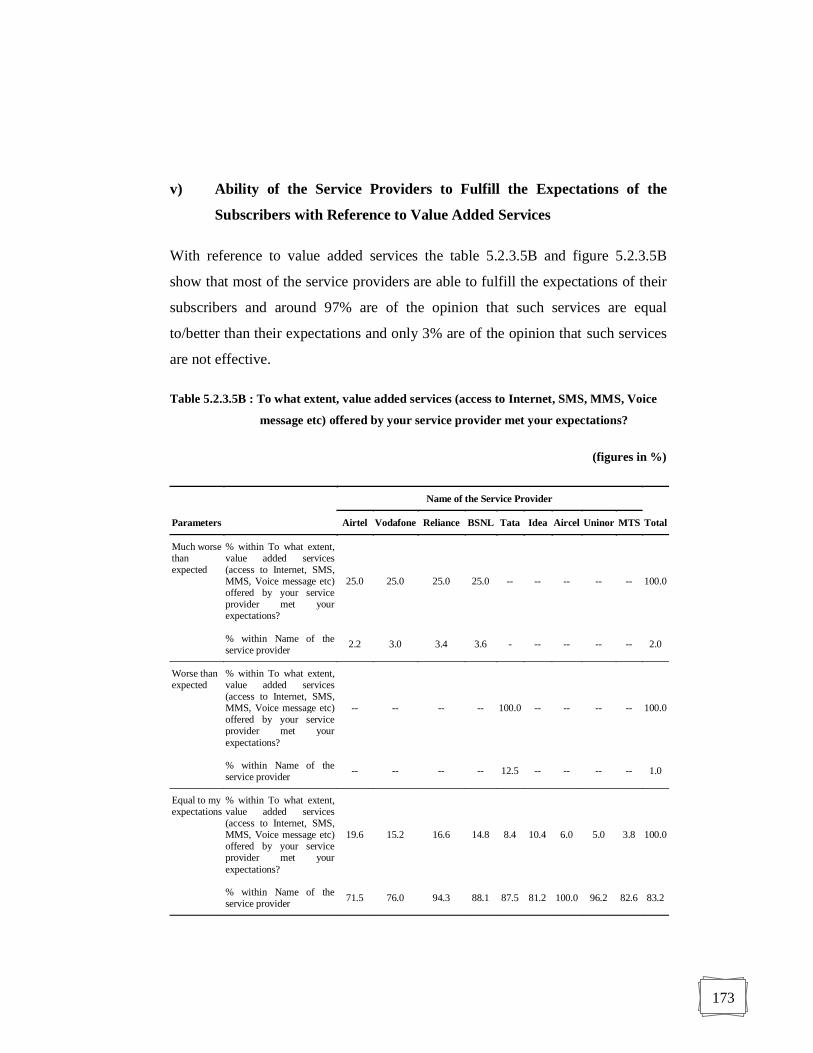
v) Ability of the Service Providers to Fulfill the Expectations of the
Subscribers with Reference to Value Added Services
With reference to value added services the table 5.2.3.5B and figure 5.2.3.5B
show that most of the service providers are able to fulfill the expectations of their
subscribers and around 97% are of the opinion that such services are equal
to/better than their expectations and only 3% are of the opinion that such services
are not effective.
Table 5.2.3.5B : To what extent, value added services (access to Internet, SMS, MMS, Voice
message etc) offered by your service provider met your expectations?
(figures in %)
Name of the Service Provider
Total Parameters Airtel Vodafone Reliance BSNL Tata Idea Aircel Uninor MTS
Much worse than expected
% within To what extent, value added services (access to Internet, SMS, MMS, Voice message etc) offered by your service provider met your expectations?
25.0 25.0 25.0 25.0 -- -- -- -- -- 100.0
% within Name of the service provider 2.2 3.0 3.4 3.6 - -- -- -- -- 2.0
Worse than expected
% within To what extent, value added services (access to Internet, SMS, MMS, Voice message etc) offered by your service provider met your expectations?
-- -- -- -- 100.0 -- -- -- -- 100.0
% within Name of the service provider -- -- -- -- 12.5 -- -- -- -- 1.0
Equal to my expectations
% within To what extent, value added services (access to Internet, SMS, MMS, Voice message etc) offered by your service provider met your expectations?
19.6 15.2 16.6 14.8 8.4 10.4 6.0 5.0 3.8 100.0
% within Name of the service provider 71.5 76.0 94.3 88.1 87.5 81.2 100.0 96.2 82.6 83.2
174
Name of the Service Provider
Total Parameters Airtel Vodafone Reliance BSNL Tata Idea Aircel Uninor MTS
Better than expected
% within To what extent, value added services (access to Internet, SMS, MMS, Voice message etc) offered by your service provider met your expectations?
43.4 25.3 2.4 8.4 -- 14.5 -- 1.2 4.8 100.0
% within Name of the service provider 26.3 21.0 2.3 8.3 -- 18.8 -- 3.8 17.4 13.8
Total % within To what extent, value added services (access to Internet, SMS, MMS, Voice message etc) offered by your service provider met your expectations?
22.8 16.7 14.7 14.0 8.0 10.7 5.0 4.3 3.8 100.0
% within Name of the service provider 100.0 100.0 100.0 100.0 100.0 100.0 100.0 100.0 100.0 100.0
Figure 5.2.3.5B: To what extent, value added services (access to Internet, SMS, MMS, Voice
message etc) offered by your service provider met your expectations?
175
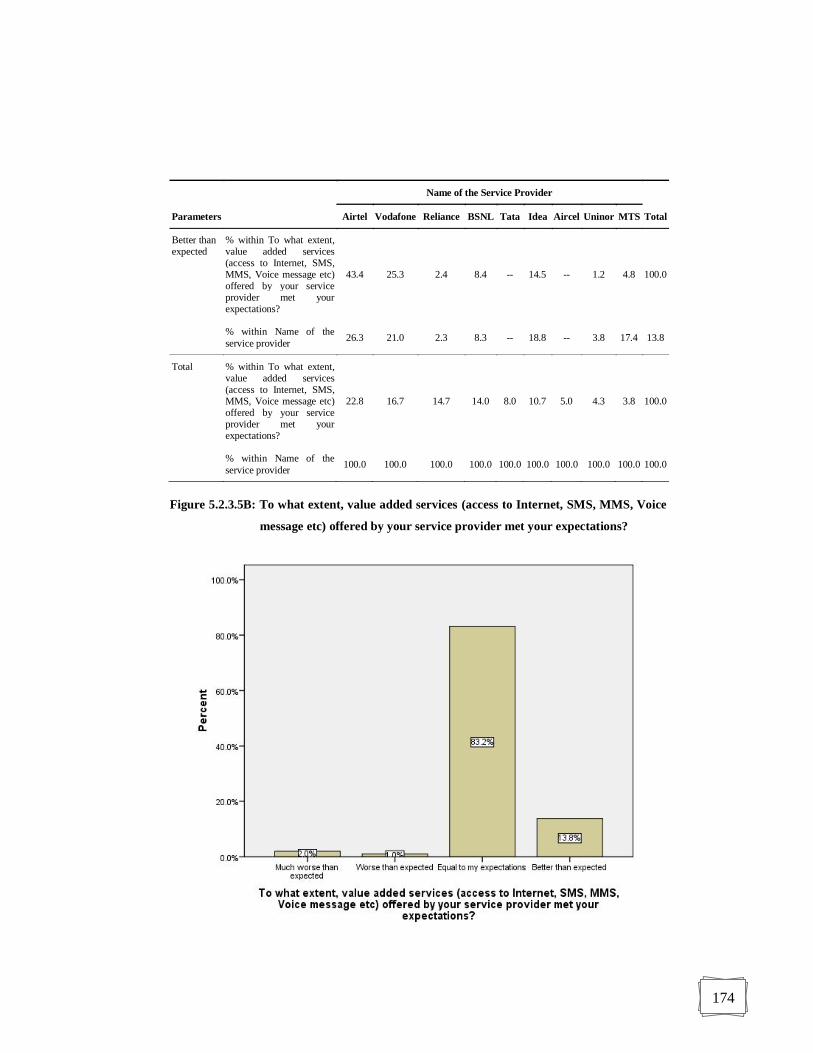
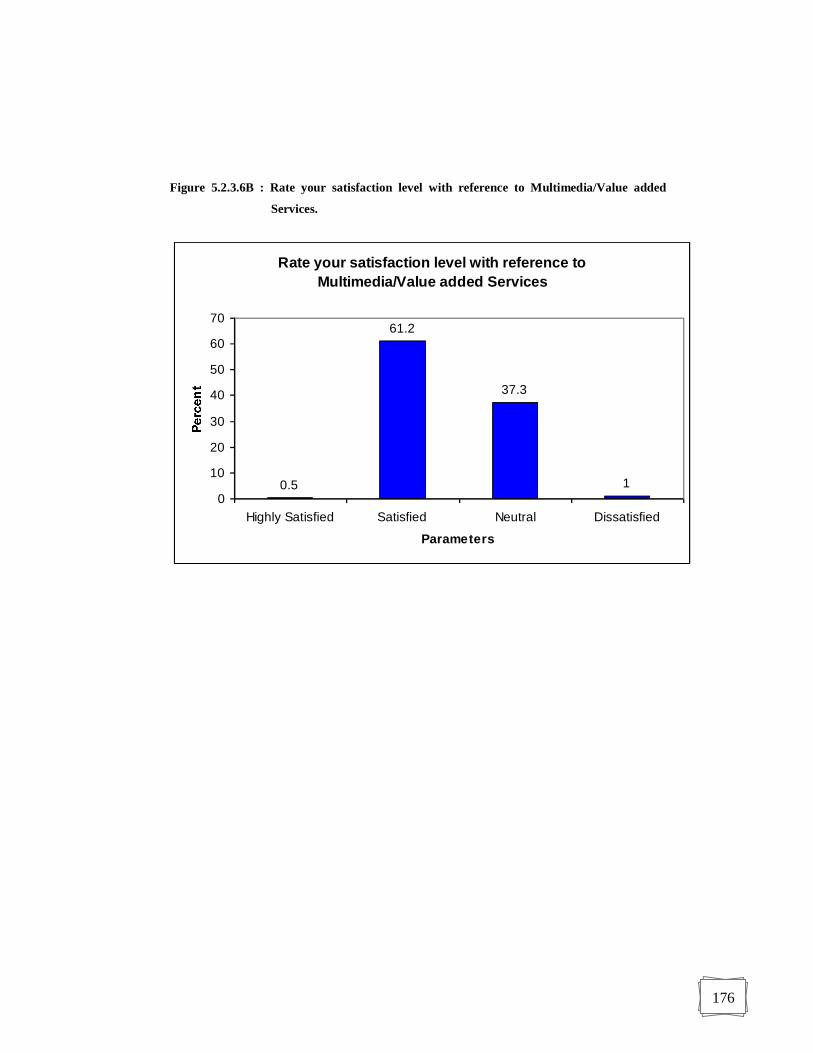
vi) Satisfaction Level with Reference to Multimedia/Value Added
Services offered by Service Provider
When the subscribers were asked to rate their satisfaction level on the 5 point
scale i.e from highly dissatisfied to highly satisfied, most of the subscribers
(61.2%) are satisfied, 37.3% subscribers are neutral and only 1% are dissatisfied
and it is certainly an area of serious concern for Tata Teleservices. It is illustrated
in table 5.2.3.6B and figure 5.2.3.6B.
Table 5.2.3.6B : Rate your satisfaction level with reference to Multimedia/Value added
Services.
(figures in %)
Name of the Service Provider
Total Parameters Airtel Vodafone Reliance BSNL Tata Idea Aircel Uninor MTS
Dissatisfied % within Rate your satisfaction level with reference to Multimedia/ Value added Services
-- -- -- -- 100.0 -- -- -- -- 100.0
% within Name of the service provider -- -- -- -- 12.5 -- -- -- -- 1.0
Neutral % within Rate your satisfaction level with reference to Multimedia/ Value added Services
18.3 16.1 17.4 9.8 13.8 12.5 8.0 0.9 3.1 100.0
% within Name of the service provider 29.9 36.0 44.3 26.2 64.6 43.8 60.0 7.7 30.4 37.3
Satisfied % within Rate your satisfaction level with reference to Multimedia/ Value added Services
25.3 17.4 13.4 16.9 3.0 9.8 3.3 6.5 4.4 100.0
% within Name of the service provider 67.9 64.0 55.7 73.8 22.9 56.2 40.0 92.3 69.6 61.2
Highly Satisfied
% within Rate your satisfaction level with reference to Multimedia/ Value added Services
100.0 -- -- -- -- -- -- -- -- 100.0
% within Name of the service provider 2.2 -- -- -- -- -- -- -- -- 0.5
Total % within Rate your satisfaction level with reference to Multimedia/ Value added Services
22.8 16.7 14.7 14.0 8.0 10.7 5.0 4.3 3.8 100.0
% within Name of the service provider 100.0 100.0 100.0 100.0 100.0 100.0 100.0 100.0 100.0 100.0
176
Figure 5.2.3.6B : Rate your satisfaction level with reference to Multimedia/Value added
Services.
Rate your satisfaction level with reference to Multimedia/Value added Services
0.5
61.2
37.3
10
10
20
30
40
50
60
70
Highly Satisfied Satisfied Neutral Dissatisfied
Parameters
177
Section C
5.3 A study of Customer Satisfaction with reference to Customer Care
Services and Quality Dimensions.
5.3.1 Part I - Customer Satisfaction with various dimensions of Customer
Care Services
i) Promptness in Handling of Customer Complaints
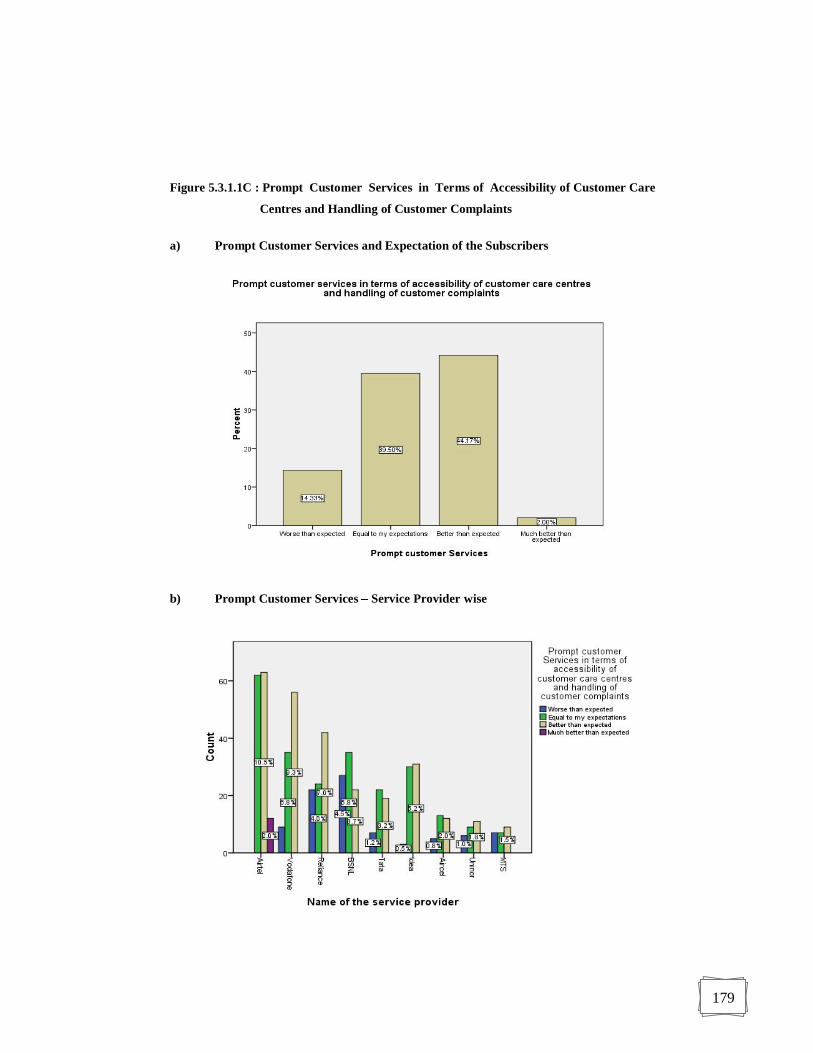
The table 5.3.1.1C and figure 5.3.1.1C describe that the service providers are
focusing on customer care services and most of the service providers are capable
of offering prompt services and so only 14.33% of the mobile subscribers are not
getting the services up to their expectations. From service provider wise analysis,
it is clear that service providers like Reliance, BSNL, Uninor and MTS should
work on this area to retain their customers while Airtel and Vodafone are rated as
the number 1 and 2 service providers in this circle.
Table 5.3.1.1C : Prompt Customer Services in Terms of Accessibility of Customer Care
Centres and Handling of Customer Complaints
(figures in %)
Prompt Customer Services
Total Service Provider
Promptness in Customer Services
Worse than expected
Equal to my expectations
Better than expected
Much better than expected
Airtel % within Name of the service provider -- 45.3 46.0 8.8 100.0
% within Prompt customer Services -- 26.2 23.8 100.0 22.8
Vodafone % within Name of the service provider 9.0 35.0 56.0 -- 100.0
% within Prompt customer Services 10.5 14.8 21.1 -- 16.7
178
Prompt Customer Services
Total Service Provider
Promptness in Customer Services
Worse than expected
Equal to my expectations
Better than expected
Much better than expected
Reliance % within Name of the service provider 25.0 27.3 47.7 -- 100.0
% within Prompt customer Services 25.6 10.1 15.8 -- 14.7
BSNL % within Name of the service provider 32.1 41.7 26.2 -- 100.0
% within Prompt customer Services 31.4 14.8 8.3 -- 14.0
Tata % within Name of the service provider 14.6 45.8 39.6 -- 100.0
% within Prompt customer Services 8.1 9.3 7.2 -- 8.0
Idea % within Name of the service provider 4.7 46.9 48.4 -- 100.0
% within Prompt customer Services 3.5 12.7 11.7 -- 10.7
Aircel % within Name of the service provider 16.7 43.3 40.0 -- 100.0
% within Prompt customer Services 5.8 5.5 4.5 -- 5.0
Uninor % within Name of the service provider 23.1 34.6 42.3 -- 100.0
% within Prompt customer Services 7.0 3.8 4.2 -- 4.3
MTS % within Name of the service provider 30.4 30.4 39.1 -- 100.0
% within Prompt customer Services 8.1 3.0 3.4 -- 3.8
Total % within Name of the service provider 14.3 39.5 44.2 2.0 100.0
% within Prompt customer Services 100.0 100.0 100.0 100.0 100.0
179
Figure 5.3.1.1C : Prompt Customer Services in Terms of Accessibility of Customer Care
Centres and Handling of Customer Complaints
a) Prompt Customer Services and Expectation of the Subscribers
b) Prompt Customer Services Service Provider wise
180
ii) Ability to Understand the Needs of Customers
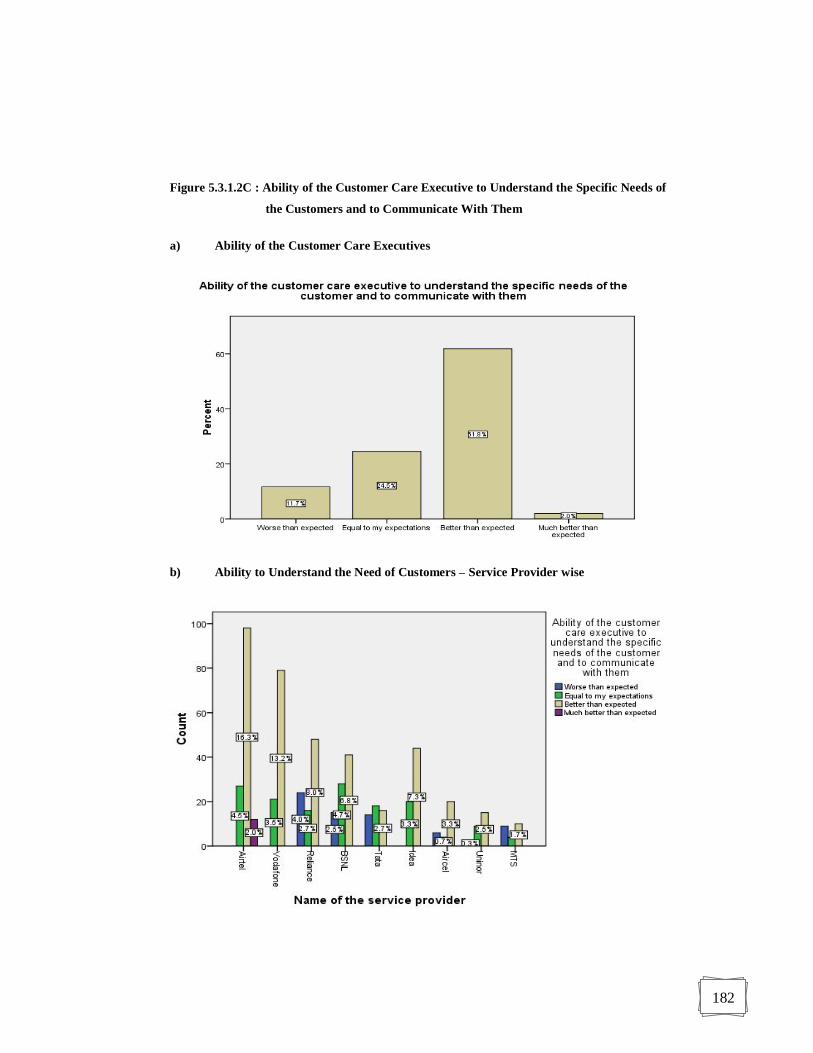
The table 5.3.1.2C and figure 5.3.1.2C describe that as far as the ability of the
customer care executives to understand the specific needs of the customers and to
communicate with them is concerned, service providers are already focusing on
this aspect but in case of service provider wise analysis, it is clear that service
providers like Reliance, Tata, Aircel and MTS should focus on this area to satisfy
their customers while Airtel and Vodafone are rated as the best two service
providers in this circle.
Table 5.3.1.2C : Ability of the Customer Care Executive to Understand the Specific Needs of
the Customers and to Communicate with them
(figures in %)
Ability of the customer care executives to understand the specific needs of the customers and to communicate with
them
Total Service Provider
Worse than expected
Equal to my expectations
Better than expected
Much better than expected
Airtel % within Name of the service provider -- 19.7 71.5 8.8 100.0
% within Ability of the customer care executive to understand the specific needs of the customer and to communicate with them
-- 18.4 26.4 100.0 22.8
Vodafone % within Name of the service provider -- 21.0 79.0 -- 100.0
% within Ability of the customer care executive to understand the specific needs of the customer and to communicate with them
-- 14.3 21.3 -- 16.7
Reliance % within Name of the service provider 27.3 18.2 54.5 -- 100.0
% within Ability of the customer care executive to understand the specific needs of the customer and to communicate with them
34.3 10.9 12.9 -- 14.7
181
Ability of the customer care executives to understand the specific needs of the customers and to communicate with
them
Total Service Provider
Worse than expected
Equal to my expectations
Better than expected
Much better than expected
BSNL % within Name of the service provider 17.9 33.3 48.8 -- 100.0
% within Ability of the customer care executive to understand the specific needs of the customer and to communicate with them
21.4 19.0 11.1 -- 14.0
Tata % within Name of the service provider 29.2 37.5 33.3 -- 100.0
% within Ability of the customer care executive to understand the specific needs of the customer and to communicate with them
20.0 12.2 4.3 -- 8.0
Idea % within Name of the service provider -- 31.2 68.8 -- 100.0
% within Ability of the customer care executive to understand the specific needs of the customer and to communicate with them
-- 13.6 11.9 -- 10.7
Aircel % within Name of the service provider 20.0 13.3 66.7 -- 100.0
% within Ability of the customer care executive to understand the specific needs of the customer and to communicate with them
8.6 2.7 5.4 -- 5.0
Uninor % within Name of the service provider 7.7 34.6 57.7 -- 100.0
% within Ability of the customer care executive to understand the specific needs of the customer and to communicate with them
2.9 6.1 4.0 -- 4.3
MTS % within Name of the service provider 39.1 17.4 43.5 -- 100.0
% within Ability of the customer care executive to understand the specific needs of the customer and to communicate with them
12.9 2.7 2.7 -- 3.8
Total % within Name of the service provider 11.7 24.5 61.8 2.0 100.0
% within Ability of the customer care executive to understand the specific needs of the customer and to communicate with them
100.0 100.0 100.0 100.0 100.0
182
Figure 5.3.1.2C : Ability of the Customer Care Executive to Understand the Specific Needs of
the Customers and to Communicate With Them
a) Ability of the Customer Care Executives
b) Ability to Understand the Need of Customers Service Provider wise
183
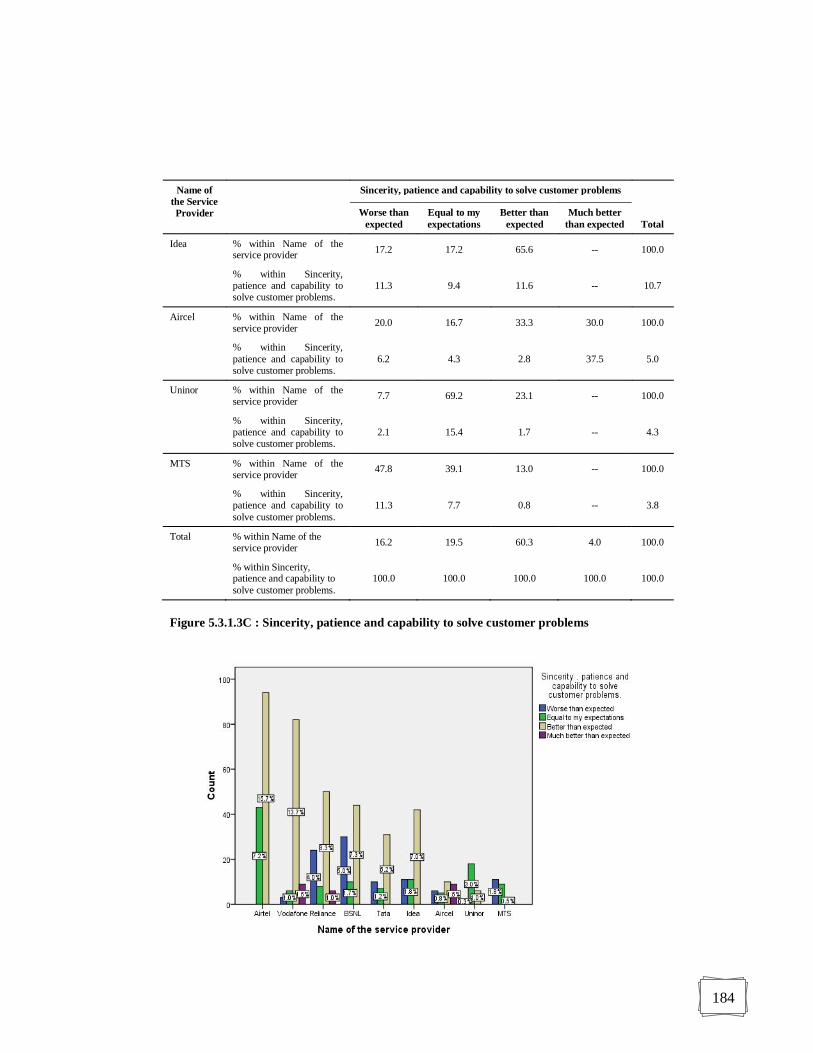
iii) Sincerity, Patience and Capability to Solve Customer Problems
It is observed from table 5.3.1.3C and figure 5.3.1.3C that with reference to
sincerity, patience and capability of the customer care executives to solve
customer problems, executives are working hard to fulfill the expectations of the
customers and only 16.2% subscribers are not satisfied with their service
providers but in case of service provider wise analysis, it is clear that service
providers like Reliance, BSNL, Aircel and MTS should work on this aspect to
satisfy their customers while Airtel and Vodafone are rated as the number 1 and 2
service providers in this area.
Table 5.3.1.3C : Sincerity, patience and capability to solve customer problems
(figures in %)
Name of the Service Provider
Sincerity, patience and capability to solve customer problems
Worse than expected
Equal to my expectations
Better than expected
Much better than expected Total
Airtel % within Name of the service provider -- 31.4 68.6 -- 100.0
% within Sincerity, patience and capability to solve customer problems.
-- 36.8 26.0 -- 22.8
Vodafone % within Name of the service provider 3.0 6.0 82.0 9.0 100.0
% within Sincerity, patience and capability to solve customer problems.
3.1 5.1 22.7 37.5 16.7
Reliance % within Name of the service provider 27.3 9.1 56.8 6.8 100.0
% within Sincerity, patience and capability to solve customer problems.
24.7 6.8 13.8 25.0 14.7
BSNL % within Name of the service provider 35.7 11.9 52.4 -- 100.0
% within Sincerity. patience and capability to solve customer problems.
30.9 8.5 12.2 -- 14.0
Tata % within Name of the service provider 20.8 14.6 64.6 -- 100.0
% within Sincerity, patience and capability to solve customer problems.
10.3 6.0 8.6 -- 8.0
184
Name of the Service Provider
Sincerity, patience and capability to solve customer problems
Worse than expected
Equal to my expectations
Better than expected
Much better than expected Total
Idea % within Name of the service provider 17.2 17.2 65.6 -- 100.0
% within Sincerity, patience and capability to solve customer problems.
11.3 9.4 11.6 -- 10.7
Aircel % within Name of the service provider 20.0 16.7 33.3 30.0 100.0
% within Sincerity, patience and capability to solve customer problems.
6.2 4.3 2.8 37.5 5.0
Uninor % within Name of the service provider 7.7 69.2 23.1 -- 100.0
% within Sincerity, patience and capability to solve customer problems.
2.1 15.4 1.7 -- 4.3
MTS % within Name of the service provider 47.8 39.1 13.0 -- 100.0
% within Sincerity, patience and capability to solve customer problems.
11.3 7.7 0.8 -- 3.8
Total % within Name of the service provider 16.2 19.5 60.3 4.0 100.0
% within Sincerity, patience and capability to solve customer problems.
100.0 100.0 100.0 100.0 100.0
Figure 5.3.1.3C : Sincerity, patience and capability to solve customer problems
185
iv) Satisfaction with the Response of Customer Care Executive(s)
The table 5.3.1.4C and figure 5.3.1.4C describe that as far as the satisfaction with
the response of customer care executives is concerned, executives are working
hard to fulfill the expectations of the customers but 18.5% subscribers are not
satisfied with their response and the service provider wise analysis shows that
service providers like Reliance, BSNL, Tata and MTS should work hard on this
aspect while Airtel and Vodafone are rated as the number 1 and 2 service
providers in this area.
Table 5.3.1.4C : Satisfaction with the Response of Customer Care Executive(s)
(figures in %)
Name of the Service
Provider
Satisfaction with the response of Customer Care Executive(s)
Total
Much worse than
expected Worse than
expected Equal to my expectations
Better than expected
Much better than
expected
Airtel % within Name of the service provider -- -- 28.5 62.8 8.8 100.0
% within Satisfaction with the response of customer care executive
-- -- 26.7 26.7 57.1 22.8
Vodafone % within Name of the service provider -- 3.0 9.0 79.0 9.0 100.0
% within Satisfaction with the response of customer care executive
-- 2.8 6.2 24.5 42.9 16.7
Reliance % within Name of the service provider -- 29.5 12.5 58.0 -- 100.0
% within Satisfaction with the response of customer care executive
-- 24.3 7.5 15.8 -- 14.7
BSNL % within Name of the service provider -- 40.5 32.1 27.4 -- 100.0
% within Satisfaction with the response of customer care executive
-- 31.8 18.5 7.1 -- 14.0
186
Name of the Service
Provider
Satisfaction with the response of Customer Care Executive(s)
Total
Much worse than
expected Worse than
expected Equal to my expectations
Better than expected
Much better than
expected
Tata % within Name of the service provider -- 33.3 10.4 56.2 -- 100.0
% within Satisfaction with the response of customer care executive
-- 15.0 3.4 8.4 -- 8.0
Idea % within Name of the service provider -- 21.9 29.7 48.4 -- 100.0
% within Satisfaction with the response of customer care executive
-- 13.1 13.0 9.6 -- 10.7
Aircel % within Name of the service provider -- 23.3 40.0 36.7 -- 100.0
% within Satisfaction with the response of customer care executive
-- 6.5 8.2 3.4 -- 5.0
Uninor % within Name of the service provider 3.8 3.8 46.2 46.2 -- 100.0
% within Satisfaction with the response of customer care executive
25.0 0.9 8.2 3.7 -- 4.3
MTS % within Name of the service provider 13.0 26.1 52.2 8.7 -- 100.0
% within Satisfaction with the response of customer care executive
75.0 5.6 8.2 0.6 -- 3.8
Total % within Name of the service provider 0.7 17.8 24.3 53.7 3.5 100.0
% within Satisfaction with the response of customer care executive
100.0 100.0 100.0 100.0 100.0 100.0
187
Figure 5.3.1.4C : Satisfaction with the Response of Customer Care Executive(s)
a) Response of Customer Care Executive(s) Expectation Level wise
b) Response of Customer Care Executive(s) Service Provider wise
188
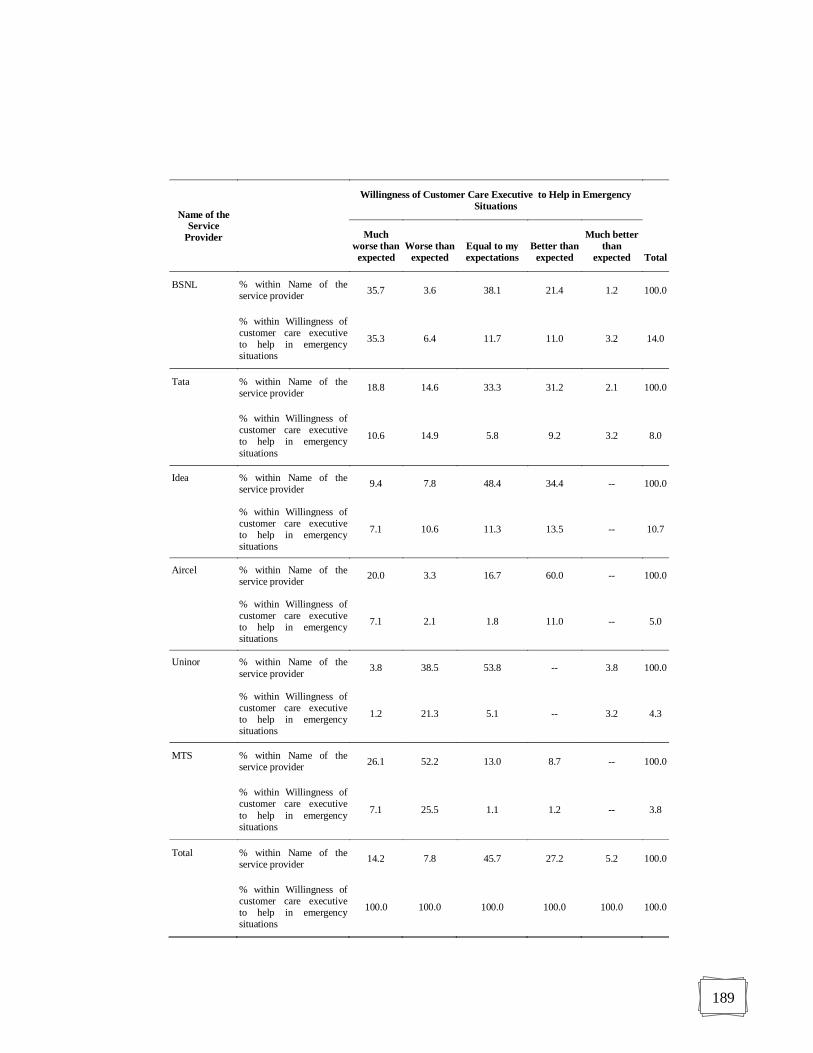
v) Willingness of Customer Care Executive(s) to Help in Emergency
Situations
It is observed from the table 5.3.1.5C and figure 5.3.1.5C that as far as the
willingness of customer care executive(s) to help in emergency situations is
concerned, around 22% are not satisfied and the service provider wise analysis
shows that service providers like Reliance, Tata, BSNL, and MTS and Uninor
should work hard to retain and fulfill customer expectations while Airtel and
Vodafone are among the top two service providers on this aspect.
Table 5.3.1.5C : Willingness of Customer Care Executive(s) to Help in Emergency Situations
(figures in %)
Name of the Service
Provider
Willingness of Customer Care Executive to Help in Emergency Situations
Total
Much worse than expected
Worse than expected
Equal to my expectations
Better than expected
Much better than
expected
Airtel % within Name of the service provider -- -- 56.2 32.8 10.9 100.0
% within Willingness of customer care executive to help in emergency situations
-- -- 28.1 27.6 48.4 22.8
Vodafone % within Name of the service provider 3.0 9.0 65.0 12.0 11.0 100.0
% within Willingness of customer care executive to help in emergency situations
3.5 19.1 23.7 7.4 35.5 16.7
Reliance % within Name of the service provider 27.3 -- 35.2 35.2 2.3 100.0
% within Willingness of customer care executive to help in emergency situations
28.2 -- 11.3 19.0 6.5 14.7
189
Name of the Service
Provider
Willingness of Customer Care Executive to Help in Emergency Situations
Total
Much worse than expected
Worse than expected
Equal to my expectations
Better than expected
Much better than
expected
BSNL % within Name of the service provider 35.7 3.6 38.1 21.4 1.2 100.0
% within Willingness of customer care executive to help in emergency situations
35.3 6.4 11.7 11.0 3.2 14.0
Tata % within Name of the service provider 18.8 14.6 33.3 31.2 2.1 100.0
% within Willingness of customer care executive to help in emergency situations
10.6 14.9 5.8 9.2 3.2 8.0
Idea % within Name of the service provider 9.4 7.8 48.4 34.4 -- 100.0
% within Willingness of customer care executive to help in emergency situations
7.1 10.6 11.3 13.5 -- 10.7
Aircel % within Name of the service provider 20.0 3.3 16.7 60.0 -- 100.0
% within Willingness of customer care executive to help in emergency situations
7.1 2.1 1.8 11.0 -- 5.0
Uninor % within Name of the service provider 3.8 38.5 53.8 -- 3.8 100.0
% within Willingness of customer care executive to help in emergency situations
1.2 21.3 5.1 -- 3.2 4.3
MTS % within Name of the service provider 26.1 52.2 13.0 8.7 -- 100.0
% within Willingness of customer care executive to help in emergency situations
7.1 25.5 1.1 1.2 -- 3.8
Total % within Name of the service provider 14.2 7.8 45.7 27.2 5.2 100.0
% within Willingness of customer care executive to help in emergency situations
100.0 100.0 100.0 100.0 100.0 100.0
190
Figure 5.3.1.5C : Willingness of Customer Care Executives to Help in Emergency Situations
a) Willingness of Customer Care Executive(s)
b) Willingness of Customer Care Executive(s) Service Provider wise
191
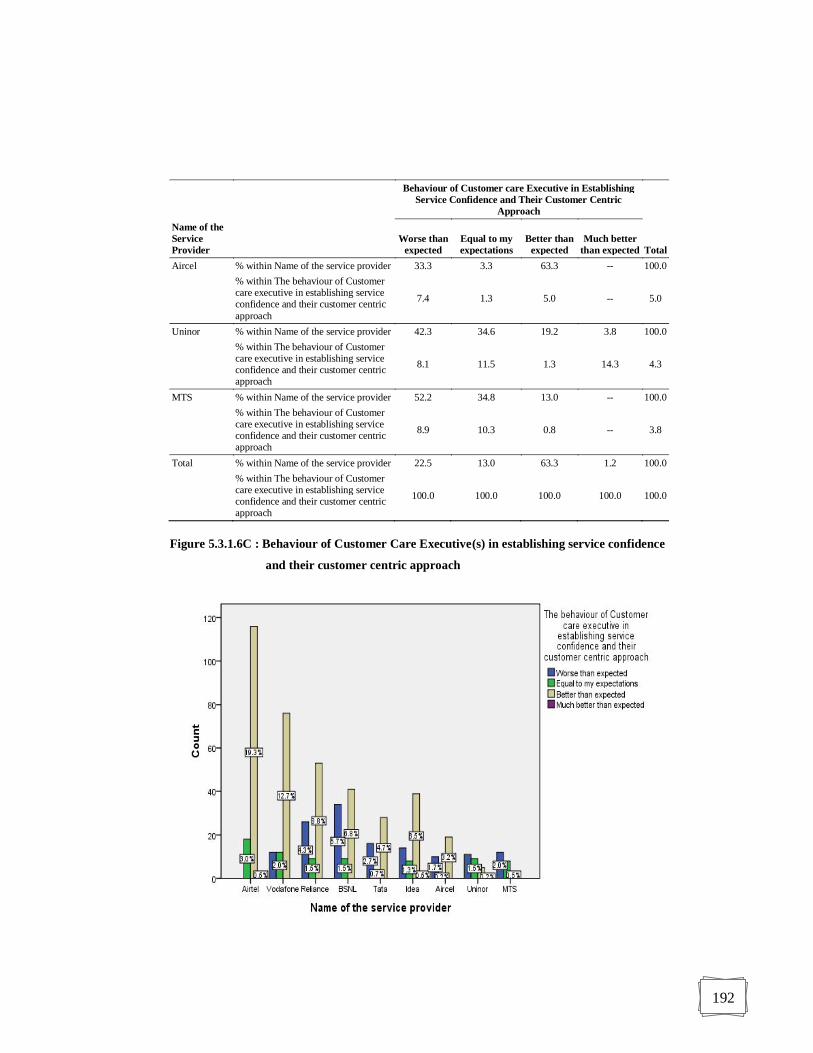
vi) Behaviour of Customer Care Executive(s)
It is illustrated in table 5.3.1.6C and figure 5.3.1.6C that as far as the behaviour of
Customer care executives in establishing service confidence and their customer
centric approach is concerned, most of subscribers are satisfied and only 22.5%
are not satisfied. The service provider wise analysis shows that it is area of
concern for service providers like BSNL, Reliance, Uninor and MTS while Airtel
and Vodafone are rated as the number 1 and 2 service providers on this aspect.
Table 5.3.1.6C : Behaviour of Customer Care Executive(s) in establishing service confidence
and their customer centric approach
(figures in %)
Behaviour of Customer care Executive in Establishing Service Confidence and Their Customer Centric
Approach
Total
Name of the Service Provider
Worse than
expected Equal to my expectations
Better than expected
Much better than expected
Airtel % within Name of the service provider -- 13.1 84.7 2.2 100.0 % within The behaviour of Customer care executive in establishing service confidence and their customer centric approach
-- 23.1 30.5 42.9 22.8
Vodafone % within Name of the service provider 12.0 12.0 76.0 -- 100.0 % within The behaviour of Customer care executive in establishing service confidence and their customer centric approach
8.9 15.4 20.0 -- 16.7
Reliance % within Name of the service provider 29.5 10.2 60.2 -- 100.0 % within The behaviour of Customer care executive in establishing service confidence and their customer centric approach
19.3 11.5 13.9 -- 14.7
BSNL % within Name of the service provider 40.5 10.7 48.8 -- 100.0 % within The behaviour of Customer care executive in establishing service confidence and their customer centric approach
25.2 11.5 10.8 -- 14.0
Tata % within Name of the service provider 33.3 8.3 58.3 -- 100.0 % within The behaviour of Customer care executive in establishing service confidence and their customer centric approach
11.9 5.1 7.4 -- 8.0
Idea % within Name of the service provider 21.9 12.5 60.9 4.7 100.0 % within The behaviour of Customer care executive in establishing service confidence and their customer centric approach
10.4 10.3 10.3 42.9 10.7
192
Behaviour of Customer care Executive in Establishing Service Confidence and Their Customer Centric
Approach
Total
Name of the Service Provider
Worse than
expected Equal to my expectations
Better than expected
Much better than expected
Aircel % within Name of the service provider 33.3 3.3 63.3 -- 100.0 % within The behaviour of Customer care executive in establishing service confidence and their customer centric approach
7.4 1.3 5.0 -- 5.0
Uninor % within Name of the service provider 42.3 34.6 19.2 3.8 100.0 % within The behaviour of Customer care executive in establishing service confidence and their customer centric approach
8.1 11.5 1.3 14.3 4.3
MTS % within Name of the service provider 52.2 34.8 13.0 -- 100.0 % within The behaviour of Customer care executive in establishing service confidence and their customer centric approach
8.9 10.3 0.8 -- 3.8
Total % within Name of the service provider 22.5 13.0 63.3 1.2 100.0 % within The behaviour of Customer
care executive in establishing service confidence and their customer centric approach
100.0 100.0 100.0 100.0 100.0
Figure 5.3.1.6C : Behaviour of Customer Care Executive(s) in establishing service confidence
and their customer centric approach
193
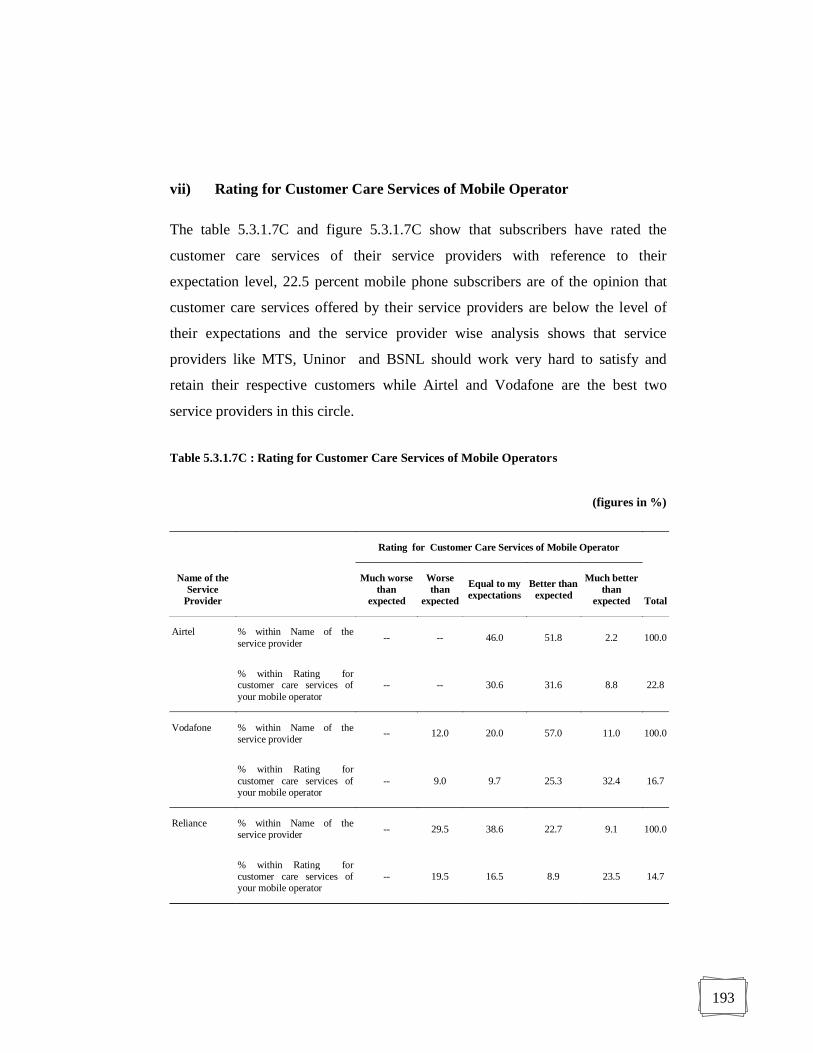
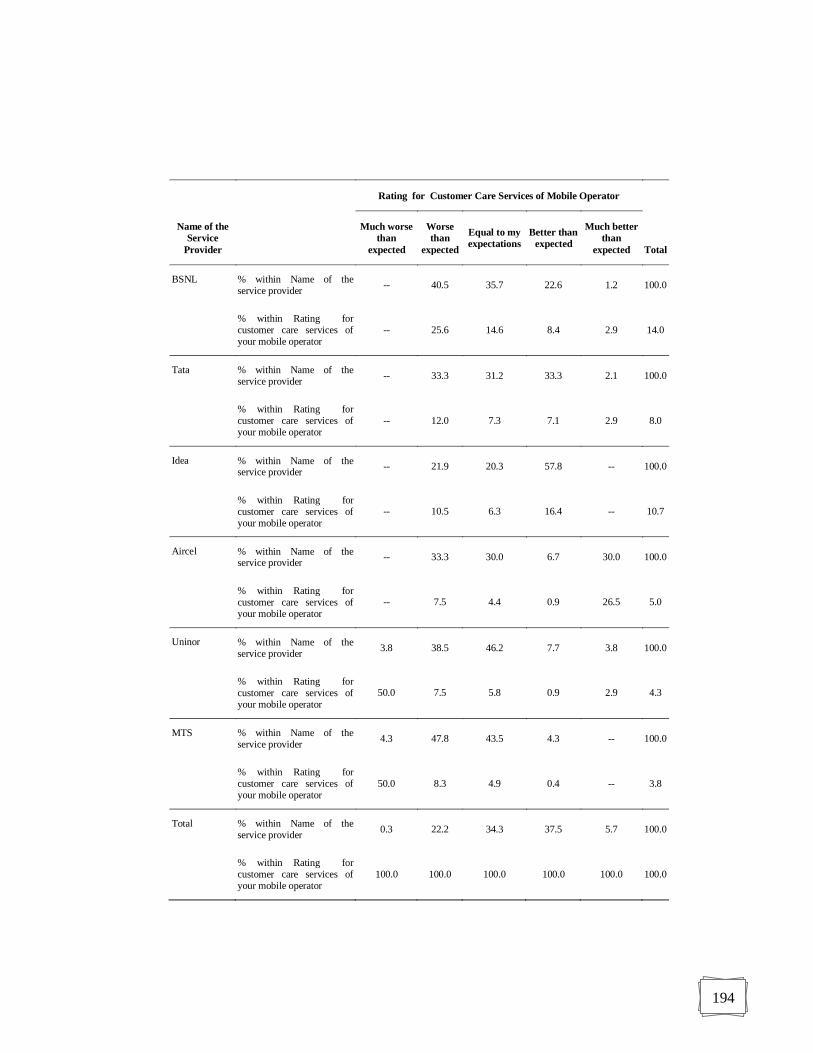
vii) Rating for Customer Care Services of Mobile Operator
The table 5.3.1.7C and figure 5.3.1.7C show that subscribers have rated the
customer care services of their service providers with reference to their
expectation level, 22.5 percent mobile phone subscribers are of the opinion that
customer care services offered by their service providers are below the level of
their expectations and the service provider wise analysis shows that service
providers like MTS, Uninor and BSNL should work very hard to satisfy and
retain their respective customers while Airtel and Vodafone are the best two
service providers in this circle.
Table 5.3.1.7C : Rating for Customer Care Services of Mobile Operators
(figures in %)
Rating for Customer Care Services of Mobile Operator
Total
Name of the Service
Provider
Much worse than
expected
Worse than
expected
Equal to my expectations
Better than expected
Much better than
expected
Airtel % within Name of the service provider -- -- 46.0 51.8 2.2 100.0
% within Rating for customer care services of your mobile operator
-- -- 30.6 31.6 8.8 22.8
Vodafone % within Name of the service provider -- 12.0 20.0 57.0 11.0 100.0
% within Rating for customer care services of your mobile operator
-- 9.0 9.7 25.3 32.4 16.7
Reliance % within Name of the service provider -- 29.5 38.6 22.7 9.1 100.0
% within Rating for customer care services of your mobile operator
-- 19.5 16.5 8.9 23.5 14.7
194
Rating for Customer Care Services of Mobile Operator
Total
Name of the Service
Provider
Much worse than
expected
Worse than
expected
Equal to my expectations
Better than expected
Much better than
expected
BSNL % within Name of the service provider -- 40.5 35.7 22.6 1.2 100.0
% within Rating for customer care services of your mobile operator
-- 25.6 14.6 8.4 2.9 14.0
Tata % within Name of the service provider -- 33.3 31.2 33.3 2.1 100.0
% within Rating for customer care services of your mobile operator
-- 12.0 7.3 7.1 2.9 8.0
Idea % within Name of the service provider -- 21.9 20.3 57.8 -- 100.0
% within Rating for customer care services of your mobile operator
-- 10.5 6.3 16.4 -- 10.7
Aircel % within Name of the service provider -- 33.3 30.0 6.7 30.0 100.0
% within Rating for customer care services of your mobile operator
-- 7.5 4.4 0.9 26.5 5.0
Uninor % within Name of the service provider 3.8 38.5 46.2 7.7 3.8 100.0
% within Rating for customer care services of your mobile operator
50.0 7.5 5.8 0.9 2.9 4.3
MTS % within Name of the service provider 4.3 47.8 43.5 4.3 -- 100.0
% within Rating for customer care services of your mobile operator
50.0 8.3 4.9 0.4 -- 3.8
Total % within Name of the service provider 0.3 22.2 34.3 37.5 5.7 100.0
% within Rating for customer care services of your mobile operator
100.0 100.0 100.0 100.0 100.0 100.0
195
Figure 5.3.1.7C : Rating for Customer Care Services of Mobile Operators
a) Rating for Customer Care Services of Mobile Operators
b) Rating for Customer Care Services of Mobile Operators Service Provider wise
196
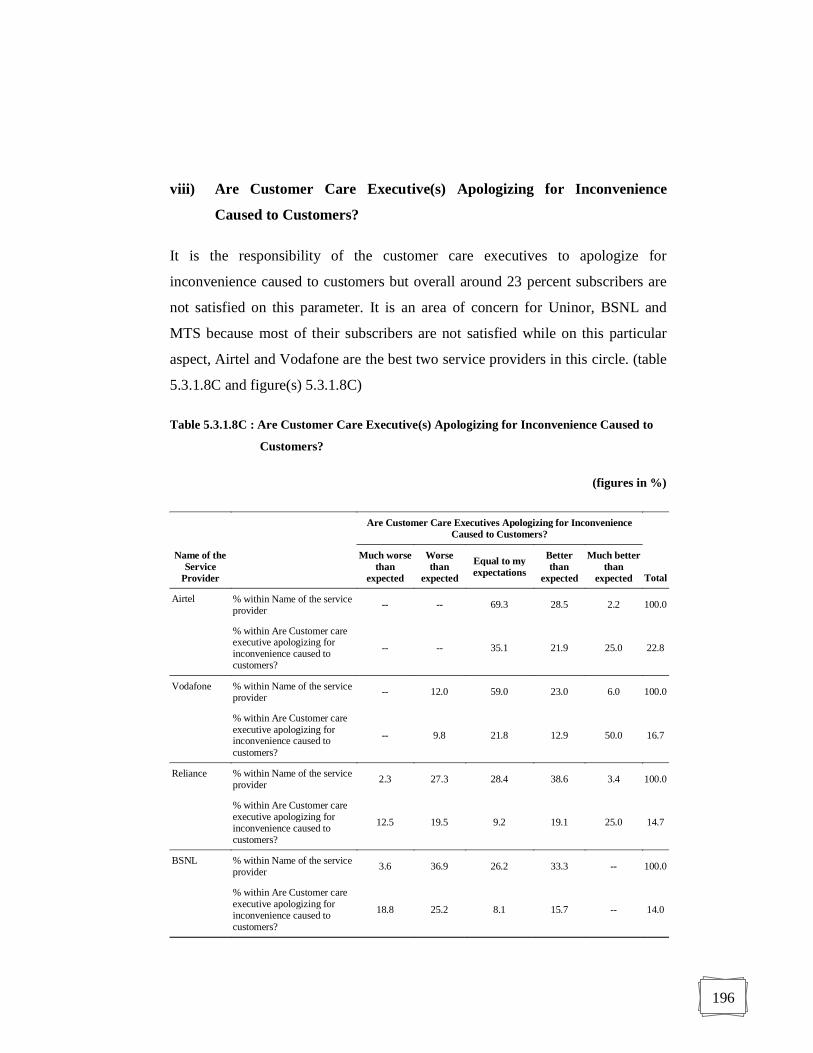
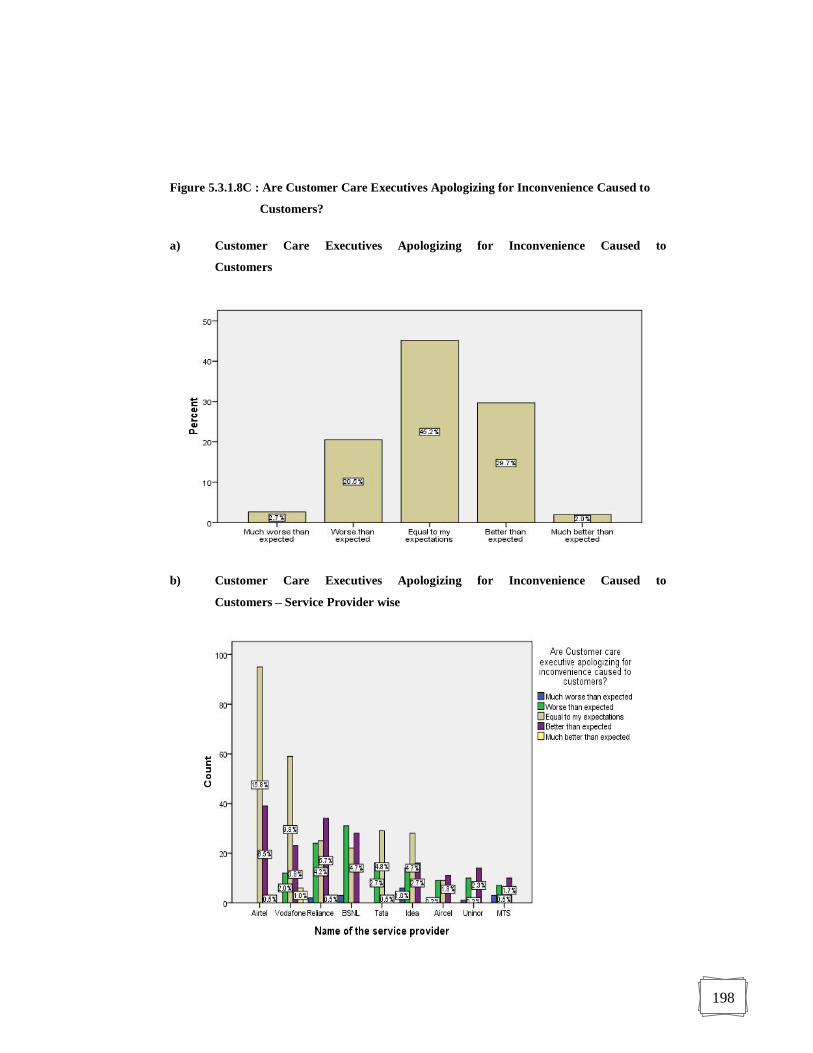
viii) Are Customer Care Executive(s) Apologizing for Inconvenience
Caused to Customers?
It is the responsibility of the customer care executives to apologize for
inconvenience caused to customers but overall around 23 percent subscribers are
not satisfied on this parameter. It is an area of concern for Uninor, BSNL and
MTS because most of their subscribers are not satisfied while on this particular
aspect, Airtel and Vodafone are the best two service providers in this circle. (table
5.3.1.8C and figure(s) 5.3.1.8C)
Table 5.3.1.8C : Are Customer Care Executive(s) Apologizing for Inconvenience Caused to
Customers?
(figures in %)
Are Customer Care Executives Apologizing for Inconvenience Caused to Customers?
Total
Name of the Service
Provider
Much worse than
expected
Worse than
expected
Equal to my expectations
Better than
expected
Much better than
expected
Airtel % within Name of the service provider -- -- 69.3 28.5 2.2 100.0
% within Are Customer care executive apologizing for inconvenience caused to customers?
-- -- 35.1 21.9 25.0 22.8
Vodafone % within Name of the service provider -- 12.0 59.0 23.0 6.0 100.0
% within Are Customer care executive apologizing for inconvenience caused to customers?
-- 9.8 21.8 12.9 50.0 16.7
Reliance % within Name of the service provider 2.3 27.3 28.4 38.6 3.4 100.0
% within Are Customer care executive apologizing for inconvenience caused to customers?
12.5 19.5 9.2 19.1 25.0 14.7
BSNL % within Name of the service provider 3.6 36.9 26.2 33.3 -- 100.0
% within Are Customer care executive apologizing for inconvenience caused to customers?
18.8 25.2 8.1 15.7 -- 14.0
197
Are Customer Care Executives Apologizing for Inconvenience Caused to Customers?
Total
Name of the Service
Provider
Much worse than
expected
Worse than
expected
Equal to my expectations
Better than
expected
Much better than
expected
Tata % within Name of the service provider -- 33.3 60.4 6.2 -- 100.0
% within Are Customer care executive apologizing for inconvenience caused to customers?
-- 13.0 10.7 1.7 -- 8.0
Idea % within Name of the service provider 9.4 21.9 43.8 25.0 -- 100.0
% within Are Customer care executive apologizing for inconvenience caused to customers?
37.5 11.4 10.3 9.0 -- 10.7
Aircel % within Name of the service provider 3.3 30.0 30.0 36.7 -- 100.0
% within Are Customer care executive apologizing for inconvenience caused to customers?
6.2 7.3 3.3 6.2 -- 5.0
Uninor % within Name of the service provider 3.8 38.5 3.8 53.8 -- 100.0
% within Are Customer care executive apologizing for inconvenience caused to customers?
6.2 8.1 0.4 7.9 -- 4.3
MTS % within Name of the service provider 13.0 30.4 13.0 43.5 -- 100.0
% within Are Customer care executive apologizing for inconvenience caused to customers?
18.8 5.7 1.1 5.6 -- 3.8
Total % within Name of the service provider 2.7 20.5 45.2 29.7 2.0 100.0
% within Are Customer care executive apologizing for inconvenience caused to customers?
100.0 100.0 100.0 100.0 100.0 100.0
198
Figure 5.3.1.8C : Are Customer Care Executives Apologizing for Inconvenience Caused to
Customers?
a) Customer Care Executives Apologizing for Inconvenience Caused to
Customers
b) Customer Care Executives Apologizing for Inconvenience Caused to
Customers Service Provider wise
199
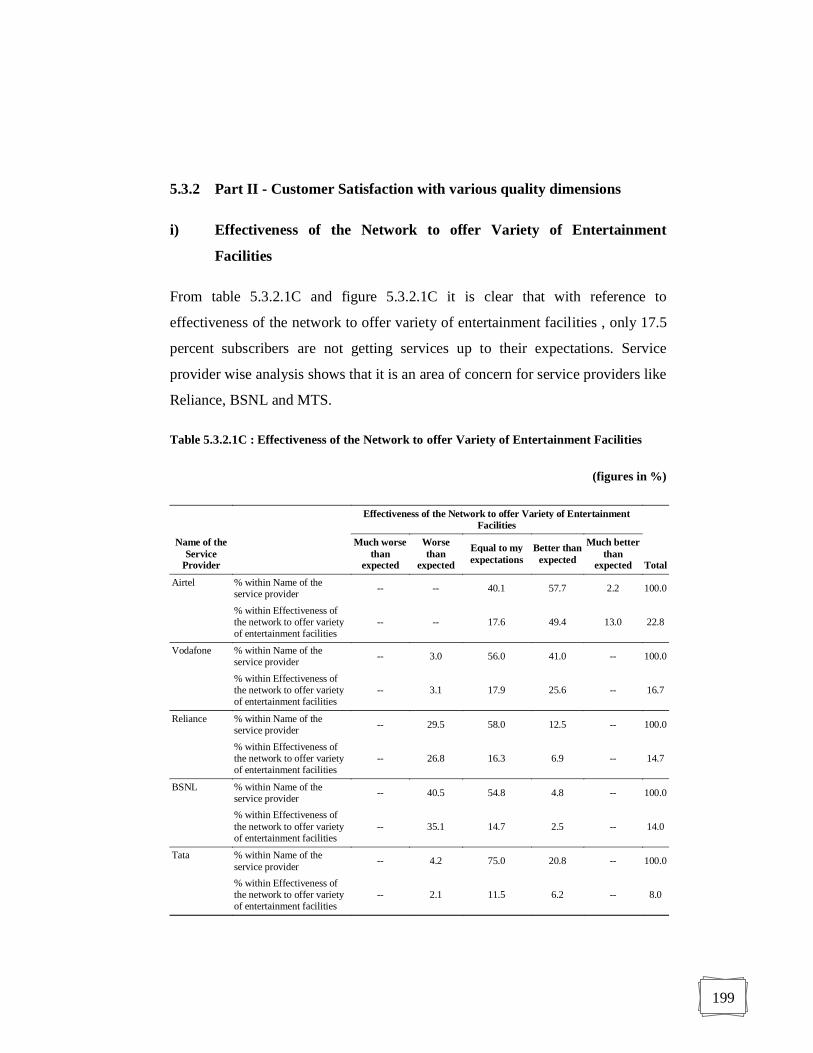
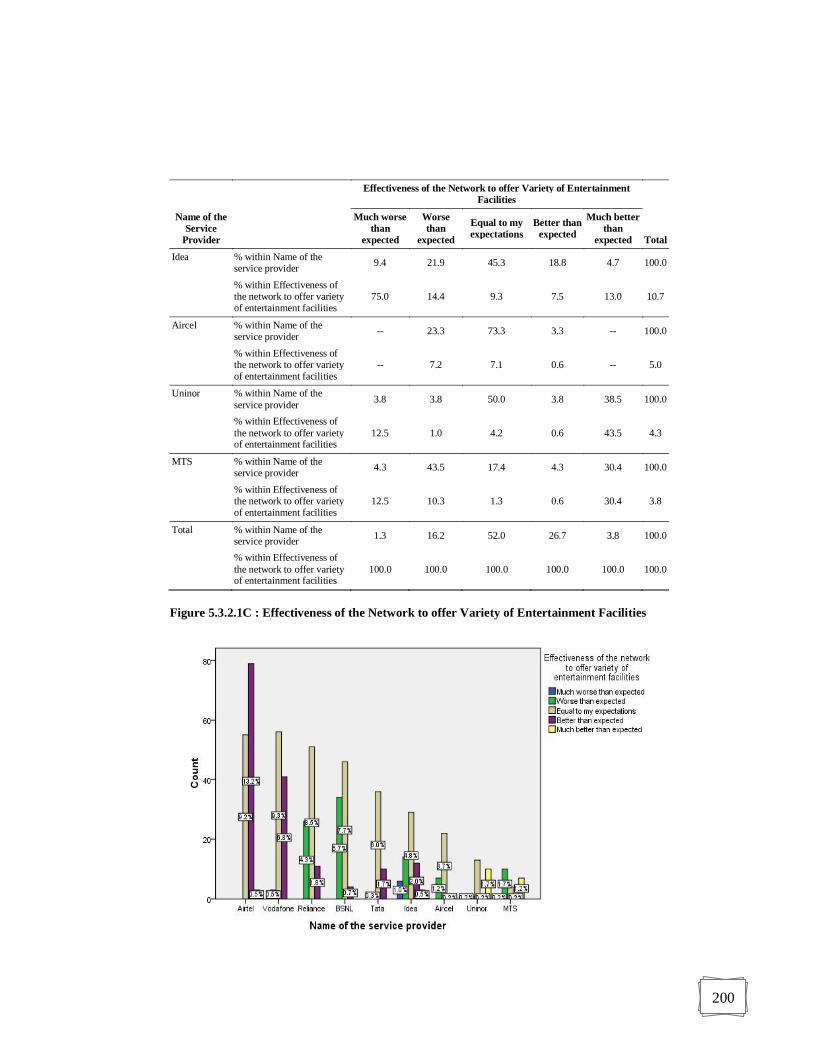
5.3.2 Part II - Customer Satisfaction with various quality dimensions
i) Effectiveness of the Network to offer Variety of Entertainment
Facilities
From table 5.3.2.1C and figure 5.3.2.1C it is clear that with reference to
effectiveness of the network to offer variety of entertainment facilities , only 17.5
percent subscribers are not getting services up to their expectations. Service
provider wise analysis shows that it is an area of concern for service providers like
Reliance, BSNL and MTS.
Table 5.3.2.1C : Effectiveness of the Network to offer Variety of Entertainment Facilities
(figures in %)
Effectiveness of the Network to offer Variety of Entertainment Facilities
Total
Name of the Service
Provider
Much worse than
expected
Worse than
expected
Equal to my expectations
Better than expected
Much better than
expected
Airtel % within Name of the service provider -- -- 40.1 57.7 2.2 100.0
% within Effectiveness of the network to offer variety of entertainment facilities
-- -- 17.6 49.4 13.0 22.8
Vodafone % within Name of the service provider -- 3.0 56.0 41.0 -- 100.0
% within Effectiveness of the network to offer variety of entertainment facilities
-- 3.1 17.9 25.6 -- 16.7
Reliance % within Name of the service provider -- 29.5 58.0 12.5 -- 100.0
% within Effectiveness of the network to offer variety of entertainment facilities
-- 26.8 16.3 6.9 -- 14.7
BSNL % within Name of the service provider -- 40.5 54.8 4.8 -- 100.0
% within Effectiveness of the network to offer variety of entertainment facilities
-- 35.1 14.7 2.5 -- 14.0
Tata % within Name of the service provider -- 4.2 75.0 20.8 -- 100.0
% within Effectiveness of the network to offer variety of entertainment facilities
-- 2.1 11.5 6.2 -- 8.0
200
Effectiveness of the Network to offer Variety of Entertainment Facilities
Total
Name of the Service
Provider
Much worse than
expected
Worse than
expected
Equal to my expectations
Better than expected
Much better than
expected
Idea % within Name of the service provider 9.4 21.9 45.3 18.8 4.7 100.0
% within Effectiveness of the network to offer variety of entertainment facilities
75.0 14.4 9.3 7.5 13.0 10.7
Aircel % within Name of the service provider -- 23.3 73.3 3.3 -- 100.0
% within Effectiveness of the network to offer variety of entertainment facilities
-- 7.2 7.1 0.6 -- 5.0
Uninor % within Name of the service provider 3.8 3.8 50.0 3.8 38.5 100.0
% within Effectiveness of the network to offer variety of entertainment facilities
12.5 1.0 4.2 0.6 43.5 4.3
MTS % within Name of the service provider 4.3 43.5 17.4 4.3 30.4 100.0
% within Effectiveness of the network to offer variety of entertainment facilities
12.5 10.3 1.3 0.6 30.4 3.8
Total % within Name of the service provider 1.3 16.2 52.0 26.7 3.8 100.0
% within Effectiveness of the network to offer variety of entertainment facilities
100.0 100.0 100.0 100.0 100.0 100.0
Figure 5.3.2.1C : Effectiveness of the Network to offer Variety of Entertainment Facilities
201
ii) How truthful is your service provider to you?
It is certainly important to know to what extent service providers are truthful to
their respective subscribers. The table 5.3.2.2C and figure 5.3.2.2C explain that
with reference to this factor, most of the service providers are trying their best to
fulfill the expectations of their subscribers but it is an area of serious concern for
all the service providers except Airtel and Vodafone.
Table 5.3.2.2C : How truthful is your service provider to you?
(figures in %)
How truthful is your service provider to you?
Name of the Service
Provider
Much worse than
expected
Worse than
expected
Equal to my expectations
Better than expected
Much better than
expected Total
Airtel % within Name of the service provider -- -- 29.2 53.3 17.5 100.0
% within Effectiveness of the network to offer variety of entertainment facilities
-- -- 23.3 26.4 88.9 22.8
Vodafone % within Name of the service provider -- 3.0 26.0 68.0 3.0 100.0
% within Effectiveness of the network to offer variety of entertainment facilities
-- 3.4 15.1 24.6 11.1 16.7
Reliance % within Name of the service provider 4.5 25.0 30.7 39.8 -- 100.0
% within Effectiveness of the network to offer variety of entertainment facilities
10.5 25.3 15.7 12.7 -- 14.7
BSNL % within Name of the service provider 15.5 25.0 19.0 40.5 -- 100.0
% within Effectiveness of the network to offer variety of entertainment facilities
34.2 24.1 9.3 12.3 -- 14.0
Tata % within Name of the service provider 2.1 31.2 43.8 22.9 -- 100.0
% within Effectiveness of the network to offer variety of entertainment facilities
2.6 17.2 12.2 4.0 -- 8.0
Idea % within Name of the service provider 23.4 7.8 21.9 46.9 -- 100.0
% within Effectiveness of the network to offer variety of entertainment facilities
39.5 5.7 8.1 10.9 -- 10.7
202
How truthful is your service provider to you?
Name of the Service
Provider
Much worse than
expected
Worse than
expected
Equal to my expectations
Better than expected
Much better than
expected Total
Aircel % within Name of the service provider 3.3 20.0 16.7 60.0 -- 100.0
% within Effectiveness of the network to offer variety of entertainment facilities
2.6 6.9 2.9 6.5 -- 5.0
Uninor % within Name of the service provider 3.8 26.9 50.0 19.2 -- 100.0
% within Effectiveness of the network to offer variety of entertainment facilities
2.6 8.0 7.6 1.8 -- 4.3
MTS % within Name of the service provider 13.0 34.8 43.5 8.7 -- 100.0
% within Effectiveness of the network to offer variety of entertainment facilities
7.9 9.2 5.8 0.7 -- 3.8
Total % within Name of the service provider 6.3 14.5 28.7 46.0 4.5 100.0
% within Effectiveness of the network to offer variety of entertainment facilities
100.0 100.0 100.0 100.0 100.0 100.0
Figure 5.3.2.2C : How truthful is your service provider to you?
203
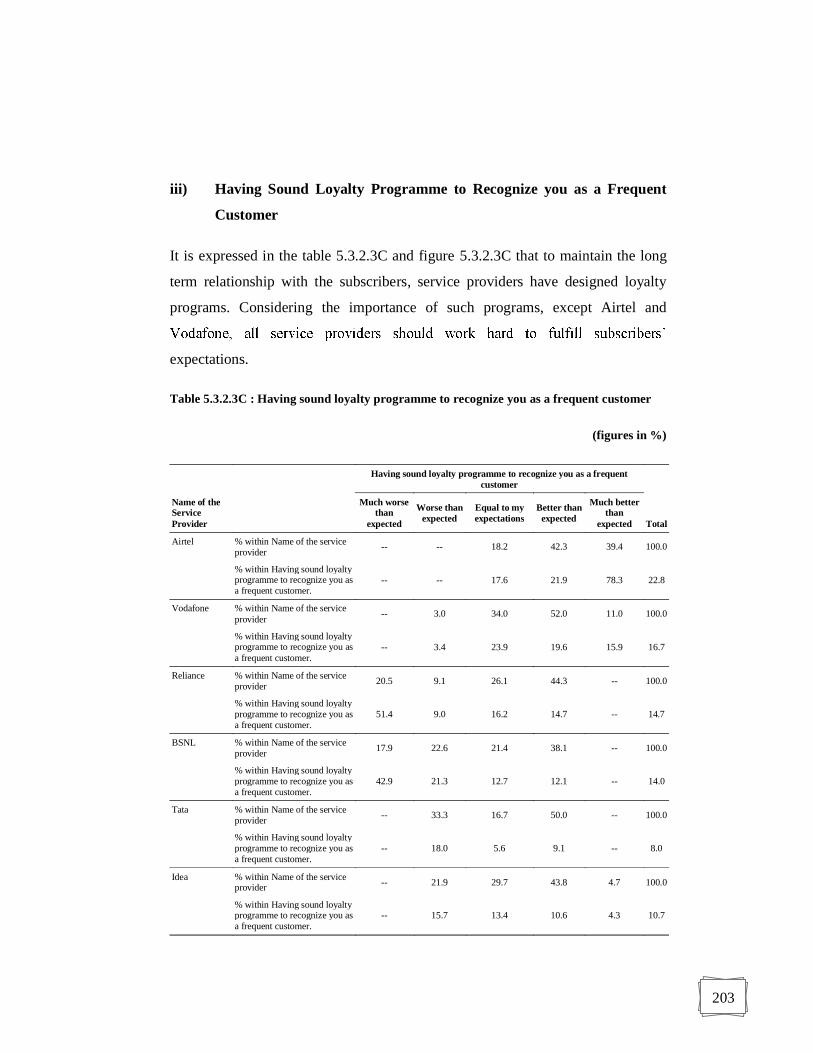
iii) Having Sound Loyalty Programme to Recognize you as a Frequent
Customer
It is expressed in the table 5.3.2.3C and figure 5.3.2.3C that to maintain the long
term relationship with the subscribers, service providers have designed loyalty
programs. Considering the importance of such programs, except Airtel and
expectations.
Table 5.3.2.3C : Having sound loyalty programme to recognize you as a frequent customer
(figures in %)
Having sound loyalty programme to recognize you as a frequent customer
Total
Name of the Service Provider
Much worse than
expected
Worse than expected
Equal to my expectations
Better than expected
Much better than
expected
Airtel % within Name of the service provider -- -- 18.2 42.3 39.4 100.0
% within Having sound loyalty programme to recognize you as a frequent customer.
-- -- 17.6 21.9 78.3 22.8
Vodafone % within Name of the service provider -- 3.0 34.0 52.0 11.0 100.0
% within Having sound loyalty programme to recognize you as a frequent customer.
-- 3.4 23.9 19.6 15.9 16.7
Reliance % within Name of the service provider 20.5 9.1 26.1 44.3 -- 100.0
% within Having sound loyalty programme to recognize you as a frequent customer.
51.4 9.0 16.2 14.7 -- 14.7
BSNL % within Name of the service provider 17.9 22.6 21.4 38.1 -- 100.0
% within Having sound loyalty programme to recognize you as a frequent customer.
42.9 21.3 12.7 12.1 -- 14.0
Tata % within Name of the service provider -- 33.3 16.7 50.0 -- 100.0
% within Having sound loyalty programme to recognize you as a frequent customer.
-- 18.0 5.6 9.1 -- 8.0
Idea % within Name of the service provider -- 21.9 29.7 43.8 4.7 100.0
% within Having sound loyalty programme to recognize you as a frequent customer.
-- 15.7 13.4 10.6 4.3 10.7
204
Having sound loyalty programme to recognize you as a frequent customer
Total
Name of the Service Provider
Much worse than
expected
Worse than expected
Equal to my expectations
Better than expected
Much better than
expected
Aircel % within Name of the service provider -- 33.3 30.0 36.7 -- 100.0
% within Having sound loyalty programme to recognize you as a frequent customer.
-- 11.2 6.3 4.2 -- 5.0
Uninor % within Name of the service provider 3.8 38.5 15.4 38.5 3.8 100.0
% within Having sound loyalty programme to recognize you as a frequent customer.
2.9 11.2 2.8 3.8 1.4 4.3
MTS % within Name of the service provider 4.3 39.1 8.7 47.8 -- 100.0
% within Having sound loyalty programme to recognize you as a frequent customer.
2.9 10.1 1.4 4.2 -- 3.8
Total % within Name of the service provider 5.8 14.8 23.7 44.2 11.5 100.0
% within Having sound loyalty programme to recognize you as a frequent customer.
100.0 100.0 100.0 100.0 100.0 100.0
Figure 5.3.2.3C : Having Sound Loyalty Programme to Recognize you as a Frequent
Customer
205
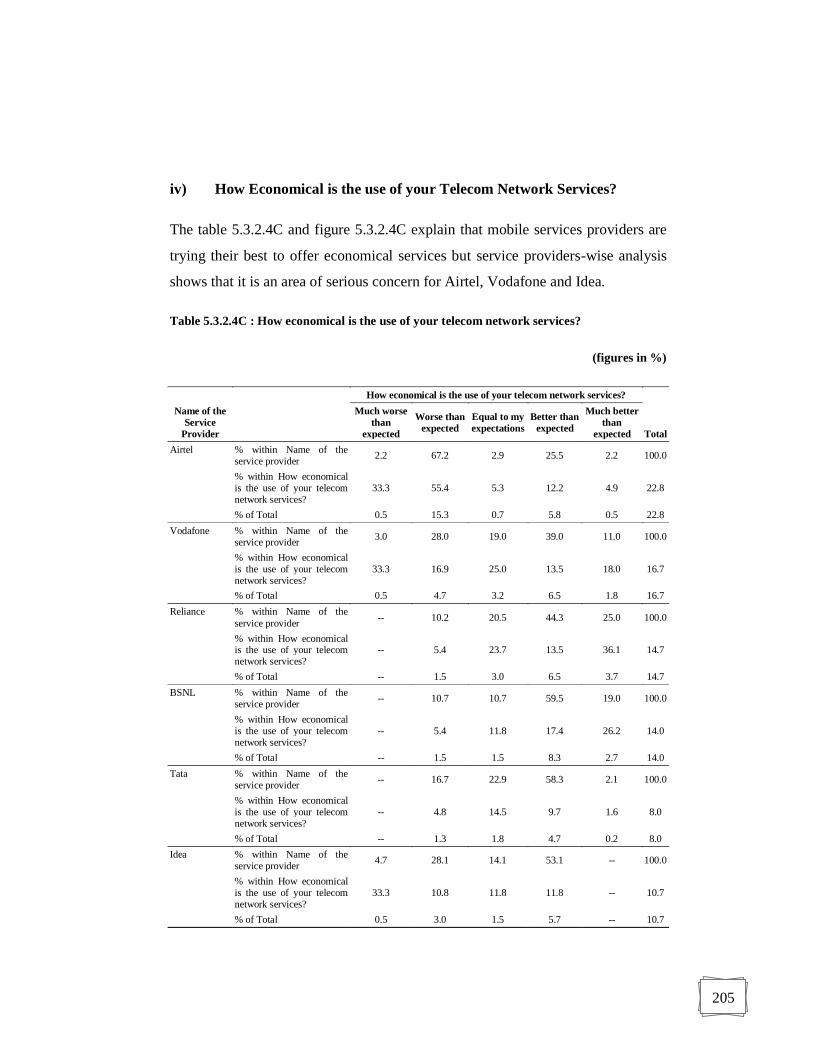
iv) How Economical is the use of your Telecom Network Services?
The table 5.3.2.4C and figure 5.3.2.4C explain that mobile services providers are
trying their best to offer economical services but service providers-wise analysis
shows that it is an area of serious concern for Airtel, Vodafone and Idea.
Table 5.3.2.4C : How economical is the use of your telecom network services?
(figures in %)
How economical is the use of your telecom network services?
Total
Name of the Service
Provider
Much worse than
expected
Worse than expected
Equal to my expectations
Better than expected
Much better than
expected Airtel % within Name of the
service provider 2.2 67.2 2.9 25.5 2.2 100.0
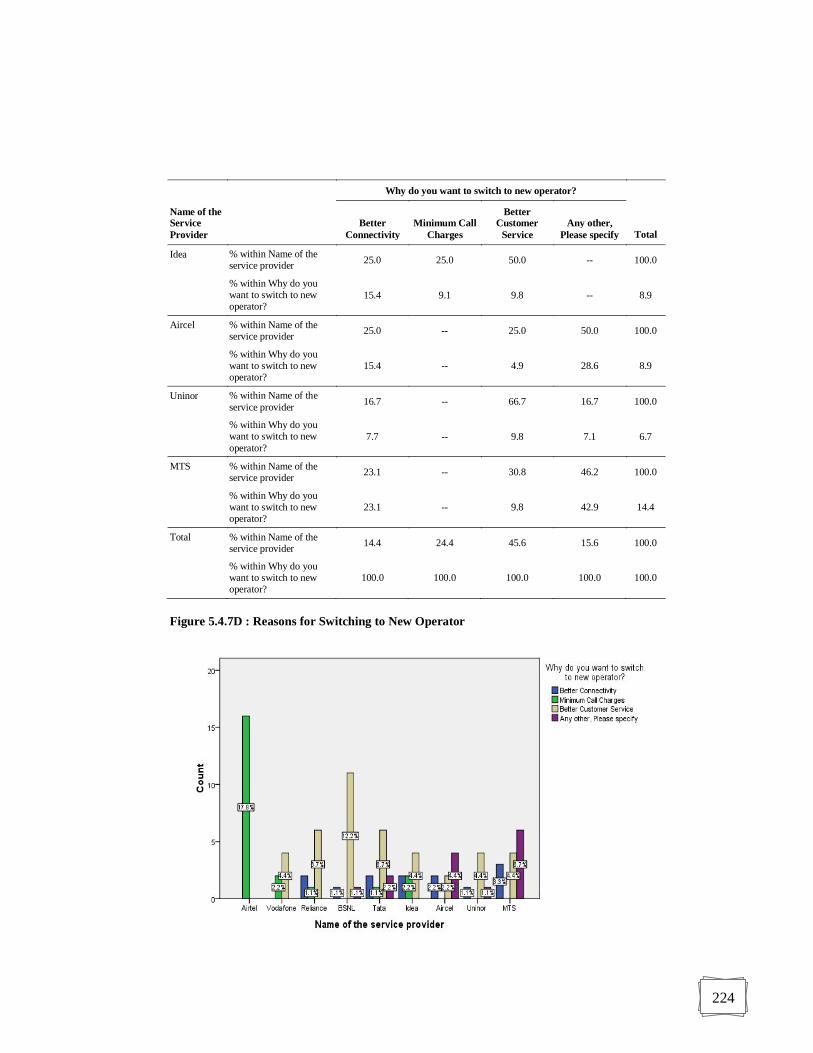
% within How economical is the use of your telecom network services?
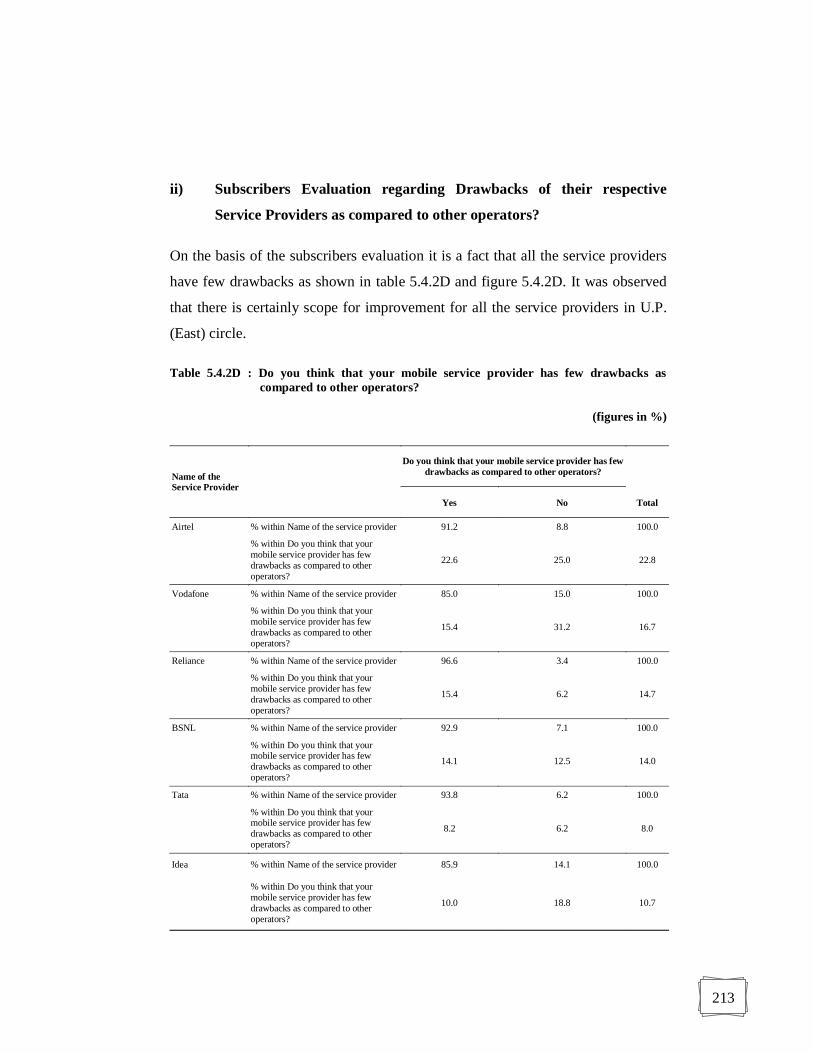
33.3 55.4 5.3 12.2 4.9 22.8
% of Total 0.5 15.3 0.7 5.8 0.5 22.8 Vodafone % within Name of the
service provider 3.0 28.0 19.0 39.0 11.0 100.0
% within How economical is the use of your telecom network services?
33.3 16.9 25.0 13.5 18.0 16.7
% of Total 0.5 4.7 3.2 6.5 1.8 16.7 Reliance % within Name of the
service provider -- 10.2 20.5 44.3 25.0 100.0
% within How economical is the use of your telecom network services?
-- 5.4 23.7 13.5 36.1 14.7
% of Total -- 1.5 3.0 6.5 3.7 14.7 BSNL % within Name of the
service provider -- 10.7 10.7 59.5 19.0 100.0
% within How economical is the use of your telecom network services?
-- 5.4 11.8 17.4 26.2 14.0
% of Total -- 1.5 1.5 8.3 2.7 14.0 Tata % within Name of the
service provider -- 16.7 22.9 58.3 2.1 100.0
% within How economical is the use of your telecom network services?
-- 4.8 14.5 9.7 1.6 8.0
% of Total -- 1.3 1.8 4.7 0.2 8.0 Idea % within Name of the
service provider 4.7 28.1 14.1 53.1 -- 100.0
% within How economical is the use of your telecom network services?
33.3 10.8 11.8 11.8 -- 10.7
% of Total 0.5 3.0 1.5 5.7 -- 10.7
206
How economical is the use of your telecom network services?
Total
Name of the Service
Provider
Much worse than
expected
Worse than expected
Equal to my expectations
Better than expected
Much better than
expected Aircel % within Name of the
service provider -- 3.3 10.0 80.0 6.7 100.0
% within How economical is the use of your telecom network services?
-- 0.6 3.9 8.3 3.3 5.0
% of Total -- 0.2 0.5 4.0 0.3 5.0 Uninor % within Name of the
service provider -- 3.8 -- 88.5 7.7 100.0
% within How economical is the use of your telecom network services?
-- 0.6 -- 8.0 3.3 4.3
% of Total -- 0.2 -- 3.8 0.3 4.3 MTS % within Name of the
service provider -- -- 13.0 69.6 17.4 100.0
% within How economical is the use of your telecom network services?
-- -- 3.9 5.6 6.6 3.8
% of Total -- -- 0.5 2.7 0.7 3.8 Total % within Name of the
service provider 1.5 27.7 12.7 48.0 10.2 100.0
% within How economical is the use of your telecom network services?
100.0 100.0 100.0 100.0 100.0 100.0
% of Total 1.5 27.7 12.7 48.0 10.2 100.0
Figure 5.3.2.4C : How Economical is the use of your Telecom Network Services?
207
v) Network Innovativeness
The table 5.3.2.5C and figure 5.3.2.5C describe that mobile services providers are
working on Network Innovativeness. Airtel and Vodafone are the leading brands
on this parameter while Idea and Tata are also doing well but other service
providers are required to formulate proper strategy to fulfill their subscriber
expectations.
Table 5.3.2.5C : Network Innovativeness
(figures in %)
Network Innovativeness
Total
Name of the Service Provider
Much worse
than expected Worse than
expected Equal to my expectations
Better than expected
Much better than expected
Airtel % within Name of the service provider -- -- 61.3 23.4 15.3 100.0
% within Network Innovativeness -- -- 34.0 18.2 30.4 22.8
Vodafone % within Name of the service provider -- 3.0 48.0 40.0 9.0 100.0
% within Network Innovativeness -- 2.9 19.4 22.7 13.0 16.7
Reliance % within Name of the service provider 2.3 33.0 27.3 21.6 15.9 100.0
% within Network Innovativeness 40.0 28.2 9.7 10.8 20.3 14.7
BSNL % within Name of the service provider -- 29.8 32.1 31.0 7.1 100.0
% within Network Innovativeness -- 24.3 10.9 14.8 8.7 14.0
Tata % within Name of the service provider -- 14.6 33.3 31.2 20.8 100.0
% within Network Innovativeness -- 6.8 6.5 8.5 14.5 8.0
Idea % within Name of the service provider -- 12.5 31.2 56.2 -- 100.0
% within Network Innovativeness -- 7.8 8.1 20.5 -- 10.7
208
Network Innovativeness
Total
Name of the Service Provider
Much worse
than expected Worse than
expected Equal to my expectations
Better than expected
Much better than expected
Aircel % within Name of the service provider 3.3 33.3 23.3 10.0 30.0 100.0
% within Network Innovativeness 20.0 9.7 2.8 1.7 13.0 5.0
Uninor % within Name of the service provider 3.8 38.5 50.0 7.7 -- 100.0
% within Network Innovativeness 20.0 9.7 5.3 1.1 -- 4.3
MTS % within Name of the service provider 4.3 47.8 34.8 13.0 -- 100.0
% within Network Innovativeness 20.0 10.7 3.2 1.7 -- 3.8
Total % within Name of the service provider 0.8 17.2 41.2 29.3 11.5 100.0
% within Network Innovativeness 100.0 100.0 100.0 100.0 100.0 100.0
Figure 5.3.2.5C : Network Innovativeness
209
vi) How do you rate the brand image and reputation of your service
provider?
The table 5.3.2.6C and figure 5.3.2.6C explain that with reference to brand image
and reputation of the service providers, MTS and Uninor should work hard while
Airtel and Vodafone have established their goodwill and are among the top two
players in this circle.
Table 5.3.2.6C : How do you rate the brand image and reputation of your service provider?
(figures in %)
How do you rate the brand image and reputation of your service provider?
Total
Name of the Service Provider
Much worse than
expected Worse than
expected Equal to my expectations
Better than expected
Much better than
expected
Airtel % within Name of the service provider -- -- 31.4 53.3 15.3 100.0
% within How do you rate the brand image and reputation of your service provider?
-- -- 15.5 38.8 77.8 22.8
Vodafone % within Name of the service provider 9.0 3.0 36.0 52.0 -- 100.0
% within How do you rate the brand image and reputation of your service provider?
40.9 3.5 13.0 27.7 -- 16.7
Reliance % within Name of the service provider 2.3 10.2 61.4 26.1 -- 100.0
% within How do you rate the brand image and reputation of your service provider?
9.1 10.5 19.5 12.2 -- 14.7
BSNL % within Name of the service provider 4.8 17.9 58.3 11.9 7.1 100.0
% within How do you rate the brand image and reputation of your service provider?
18.2 17.4 17.7 5.3 22.2 14.0
Tata % within Name of the service provider -- 16.7 75.0 8.3 -- 100.0
% within How do you rate the brand image and reputation of your service provider?
-- 9.3 13.0 2.1 -- 8.0
Idea % within Name of the service provider 4.7 12.5 59.4 23.4 -- 100.0
% within How do you rate the brand image and reputation of your service provider?
13.6 9.3 13.7 8.0 -- 10.7
210
How do you rate the brand image and reputation of your service provider?
Total
Name of the Service Provider
Much worse than
expected Worse than
expected Equal to my expectations
Better than expected
Much better than
expected
Aircel % within Name of the service provider -- 33.3 36.7 30.0 -- 100.0
% within How do you rate the brand image and reputation of your service provider?
-- 11.6 4.0 4.8 -- 5.0
Uninor % within Name of the service provider 3.8 61.5 26.9 7.7 -- 100.0
% within How do you rate the brand image and reputation of your service provider?
4.5 18.6 2.5 1.1 -- 4.3
MTS % within Name of the service provider 13.0 73.9 13.0 -- -- 100.0
% within How do you rate the brand image and reputation of your service provider?
13.6 19.8 1.1 -- -- 3.8
Total % within Name of the service provider 3.7 14.3 46.2 31.3 4.5 100.0
% within How do you rate the brand image and reputation of your service provider?
100.0 100.0 100.0 100.0 100.0 100.0
Figure 5.3.2.6C : How do you rate the brand image and reputation of your service provider?
211
Section D
5.4 Overall Customer Satisfaction Level and Switching Intention
i) Service Provider Wise Subscribers Satisfaction Level
The table 5.4.1D and figure 5.4.1D describe that 80 percent subscribers of
Vodafone are overall satisfied while in case of Airtel, Reliance, BSNL, Tata and
Idea, it ranges from 50 to 63 percent. The figure 5.4.1D shows that considering the
level of dissatisfaction, service providers like Reliance, BSNL, Tata, Aircel and
MTS should work hard to satisfy and retain their subscribers.
Table 5.4.1D : Rate Your Overall Satisfaction Level with Your Service Provider
(figures in %)
Name of the Service
Provider
Rate your overall satisfaction level with your service provider
Total Highly
Dissatisfied Dissatisfied Neutral Satisfied Airtel % within Name of the service
provider -- 21.9 26.3 51.8 100.0
% within Rate your overall satisfaction level with your service provider
-- 18.0 48.6 21.1 22.8
Vodafone % within Name of the service provider -- 15.0 5.0 80.0 100.0
% within Rate your overall satisfaction level with your service provider
-- 9.0 6.8 23.7 16.7
Reliance % within Name of the service provider 6.8 35.2 6.8 51.1 100.0
% within Rate your overall satisfaction level with your service provider
27.3 18.6 8.1 13.4 14.7
BSNL % within Name of the service provider -- 40.5 7.1 52.4 100.0
% within Rate your overall satisfaction level with your service provider
-- 20.4 8.1 13.1 14.0
Tata % within Name of the service provider -- 35.4 8.3 56.2 100.0
% within Rate your overall satisfaction level with your service provider
-- 10.2 5.4 8.0 8.0
Idea % within Name of the service provider -- 29.7 7.8 62.5 100.0
% within Rate your overall satisfaction level with your service provider
-- 11.4 6.8 11.9 10.7
212
Name of the Service
Provider
Rate your overall satisfaction level with your service provider
Total Highly
Dissatisfied Dissatisfied Neutral Satisfied Aircel % within Name of the service
provider 40.0 26.7 3.3 30.0 100.0
% within Rate your overall satisfaction level with your service provider
54.5 4.8 1.4 2.7 5.0
Uninor % within Name of the service provider 11.5 7.7 34.6 46.2 100.0
% within Rate your overall satisfaction level with your service provider
13.6 1.2 12.2 3.6 4.3
MTS % within Name of the service provider 4.3 47.8 8.7 39.1 100.0
% within Rate your overall satisfaction level with your service provider
4.5 6.6 2.7 2.7 3.8
Total % within Name of the service provider 3.7 27.8 12.3 56.2 100.0
% within Rate your overall satisfaction level with your service provider
100.0 100.0 100.0 100.0 100.0
Figure 5.4.1D : Rate Your Overall Satisfaction Level with Your Service Provider
213
ii) Subscribers Evaluation regarding Drawbacks of their respective
Service Providers as compared to other operators?
On the basis of the subscribers evaluation it is a fact that all the service providers
have few drawbacks as shown in table 5.4.2D and figure 5.4.2D. It was observed
that there is certainly scope for improvement for all the service providers in U.P.
(East) circle.
Table 5.4.2D : Do you think that your mobile service provider has few drawbacks as compared to other operators?
(figures in %)
Name of the Service Provider
Do you think that your mobile service provider has few drawbacks as compared to other operators?
Total Yes No
Airtel % within Name of the service provider 91.2 8.8 100.0
% within Do you think that your mobile service provider has few drawbacks as compared to other operators?
22.6 25.0 22.8
Vodafone % within Name of the service provider 85.0 15.0 100.0
% within Do you think that your mobile service provider has few drawbacks as compared to other operators?
15.4 31.2 16.7
Reliance % within Name of the service provider 96.6 3.4 100.0
% within Do you think that your mobile service provider has few drawbacks as compared to other operators?
15.4 6.2 14.7
BSNL % within Name of the service provider 92.9 7.1 100.0
% within Do you think that your mobile service provider has few drawbacks as compared to other operators?
14.1 12.5 14.0
Tata % within Name of the service provider 93.8 6.2 100.0
% within Do you think that your mobile service provider has few drawbacks as compared to other operators?
8.2 6.2 8.0
Idea % within Name of the service provider 85.9 14.1 100.0
% within Do you think that your mobile service provider has few drawbacks as compared to other operators?
10.0 18.8 10.7
214
Name of the Service Provider
Do you think that your mobile service provider has few drawbacks as compared to other operators?
Total Yes No
Aircel % within Name of the service provider 100.0 -- 100.0
% within Do you think that your mobile service provider has few drawbacks as compared to other operators?
5.4 -- 5.0
Uninor % within Name of the service provider 100.0 -- 100.0
% within Do you think that your mobile service provider has few drawbacks as compared to other operators?
4.7 -- 4.3
MTS % within Name of the service provider 100.0 -- 100.0
% within Do you think that your mobile service provider has few drawbacks as compared to other operators?
4.2 -- 3.8
Total % within Name of the service provider 92.0 8.0 100.0
% within Do you think that your mobile service provider has few drawbacks as compared to other operators?
100.0 100.0 100.0
Figure 5.4.2D : Do you think that your mobile service provider has few drawbacks as compared to other operators?
215
iii) Are you aware about the MNP (Mobile Number Portability)?
MNP or mobile number portability, allows the subscribers to transfer their
existing mobile phone number from one mobile phone network provider to
another mobile phone service provider. The table 5.4.3D and figure 5.4.3D show
that all the subscribers of all the service providers are aware about the MNP
(Mobile Number Portability) U.P.(East) circle.
Table 5.4.3D : Are you aware about the MNP (Mobile Number Portability)?
(figures in %)
Name of the Service Provider
Are you aware about the MNP (Mobile Number Portability)?
Total Yes
Airtel % within Name of the service provider 100.0 100.0
% within Are you aware about the MNP (Mobile Number Portability)? 22.8 22.8
Vodafone % within Name of the service provider 100.0 100.0
% within Are you aware about the MNP (Mobile Number Portability)? 16.7 16.7
Reliance % within Name of the service provider 100.0 100.0
% within Are you aware about the MNP (Mobile Number Portability)? 14.7 14.7
BSNL % within Name of the service provider 100.0 100.0
% within Are you aware about the MNP (Mobile Number Portability)? 14.0 14.0
Tata % within Name of the service provider 100.0 100.0
% within Are you aware about the MNP (Mobile Number Portability)? 8.0 8.0
Idea % within Name of the service provider 100.0 100.0
% within Are you aware about the MNP (Mobile Number Portability)? 10.7 10.7
Aircel % within Name of the service provider 100.0 100.0
% within Are you aware about the MNP (Mobile Number Portability)? 5.0 5.0
Uninor % within Name of the service provider 100.0 100.0
% within Are you aware about the MNP (Mobile Number Portability)? 4.3 4.3
MTS % within Name of the service provider 100.0 100.0
% within Are you aware about the MNP (Mobile Number Portability)? 3.8 3.8
Total % within Name of the service provider 100.0 100.0
% within Are you aware about the MNP (Mobile Number Portability)? 100.0 100.0
216
Figure 5.4.3D : Are you aware about the MNP (Mobile Number Portability)?
iv) Do you think MNP is helping operators to bring better choice to the
customers?
MNP or Mobile Number Portability is the process by which, you can shift
to another operator of your choice, but keep your same number you are
using for years. The table 5.4.4D and figure 5.4.4D describe that
subscribers in this circle consider that MNP is basically an opportunity for
operators to bring better choice to the customers.
217
Table 5.4.4D : Do you think MNP is helping operators to bring better choice to the customers?
(figures in %)
Name of the Service Provider
Do you think MNP is helping operators to bring better choice to the customers?
Total Yes No
Airtel % within Name of the service provider 100.0 -- 100.0
% within Do you think MNP is helping operators to bring better choice to the customers?
23.1 -- 22.8
Vodafone % within Name of the service provider 100.0 -- 100.0
% within Do you think MNP is helping operators to bring better choice to the customers?
16.8 -- 16.7
Reliance % within Name of the service provider 100.0 -- 100.0
% within Do you think MNP is helping operators to bring better choice to the customers?
14.8 -- 14.7
BSNL % within Name of the service provider 92.9 7.1 100.0
% within Do you think MNP is helping operators to bring better choice to the customers?
13.1 100.0 14.0
Tata % within Name of the service provider 100.0 -- 100.0
% within Do you think MNP is helping operators to bring better choice to the customers?
8.1 -- 8.0
Idea % within Name of the service provider 100.0 -- 100.0
% within Do you think MNP is helping operators to bring better choice to the customers?
10.8 -- 10.7
Aircel % within Name of the service provider 100.0 -- 100.0
% within Do you think MNP is helping operators to bring better choice to the customers?
5.1 -- 5.0
Uninor % within Name of the service provider 100.0 -- 100.0
% within Do you think MNP is helping operators to bring better choice to the customers?
4.4 -- 4.3
MTS % within Name of the service provider 100.0 -- 100.0
% within Do you think MNP is helping operators to bring better choice to the customers?
3.9 -- 3.8
Total % within Name of the service provider 99.0 1.0 100.0
% within Do you think MNP is helping operators to bring better choice to the customers?
100.0 100.0 100.0
218
Figure 5.4.4D : Do you think MNP is helping operators to bring better choice to the customers?
v) Do you have the Intention of Switching to a Better Service Provider?
The table 5.4.5D and figure 5.4.5D explain that overall 42 percent subscribers
have the switching intention and it an area of serious concern that except the
Vodafone subscribers, more than 40 percent of the subscribers of all the other
service providers have the switching intention. It is certainly a challenge for the
service provider to retain their existing customers in this competitive market after
the introduction of MNP. Airtel is the market leader in this telecom circle but 48.2
percent of its subscribers have the switching intention while in case of Vodafone it
is only 20 percent.
219
Table 5.4.5D : Do you have the Intention of Switching to a Better Service Provider?
(figures in %)
Do you have the intention of switching to a better service provider?
Total Name of the Service Provider
Yes No
Airtel % within Name of the service provider 48.2 51.8 100.0
% within Do you have the intention of switching to a better service provider? 26.2 20.4 22.8
Vodafone % within Name of the service provider 20.0 80.0 100.0
% within Do you have the intention of switching to a better service provider? 7.9 23.0 16.7
Reliance % within Name of the service provider 42.0 58.0 100.0
% within Do you have the intention of switching to a better service provider? 14.7 14.7 14.7
BSNL % within Name of the service provider 44.0 56.0 100.0
% within Do you have the intention of switching to a better service provider? 14.7 13.5 14.0
Tata % within Name of the service provider 43.8 56.2 100.0
% within Do you have the intention of switching to a better service provider? 8.3 7.8 8.0
Idea % within Name of the service provider 46.9 53.1 100.0
% within Do you have the intention of switching to a better service provider? 11.9 9.8 10.7
Aircel % within Name of the service provider 40.0 60.0 100.0
% within Do you have the intention of switching to a better service provider? 4.8 5.2 5.0
Uninor % within Name of the service provider 53.8 46.2 100.0
% within Do you have the intention of switching to a better service provider? 5.6 3.4 4.3
MTS % within Name of the service provider 65.2 34.8 100.0
% within Do you have the intention of switching to a better service provider? 6.0 2.3 3.8
Total % within Name of the service provider 42.0 58.0 100.0
% within Do you have the intention of switching to a better service provider? 100.0 100.0 100.0
220
Figure 5.4.5D : Do you have the Intention of Switching to a Better Service Provider?
vi) If Decided to Switching to a Better Service Provider, Name of New
Service Provider
If we analysis the behaviour of the subscribers who have the switching intention,
the table 5.4.6D and figure 5.4.6D show that 33.3 percent subscribers of U.P.
(East) circle with switching intention are switching to Airtel and 31.1 percent
switching to Vodafone, 15.6 percent to BSNL, 10 percent to Reliance, 6.7 percent
to Tata, 2.2 percent to Idea and only 1.1 percent to Uninor. Therefore, Airtel and
Vodafone can be considered as first two preferred operators in this circle as far as
switching intention is concerned after the introduction of MNP. So the other
operators have to formulate their strategies to face this challenge considering the
factors responsible for switching intention.
221
Table 5.4.6D : If Decided to Switching to a Better Service Provider, Name of New Service Provider
(figures in %)
Name of the Service Provider
Name of New Service Provider.
Total Airtel Vodafone Reliance BSNL Tata Idea Uninor
Airtel % within Name of the service provider -- 12.5 12.5 50.0 18.8 -- 6.2 100.0
% within If Yes, Please tick the name of new service provider.
-- 7.1 22.2 57.1 50.0 100.0 17.8
Vodafone % within Name of the service provider 66.7 -- -- 33.3 -- -- -- 100.0
% within If Yes, Please tick the name of new service provider.
13.3 -- -- 14.3 -- -- -- 6.7
Reliance % within Name of the service provider 22.2 44.4 -- 11.1 22.2 -- -- 100.0
% within If Yes, Please tick the name of new service provider.
6.7 14.3 -- 7.1 33.3 -- -- 10.0
BSNL % within Name of the service provider 61.5 23.1 7.7 -- 7.7 -- -- 100.0
% within If Yes, Please tick the name of new service provider.
26.7 10.7 11.1 -- 16.7 -- -- 14.4
Tata % within Name of the service provider 18.2 72.7 -- 9.1 -- -- -- 100.0
% within If Yes, Please tick the name of new service provider.
6.7 28.6 -- 7.1 -- -- -- 12.2
Idea % within Name of the service provider 37.5 25.0 12.5 25.0 -- -- -- 100.0
% within If Yes, Please tick the name of new service provider.
10.0 7.1 11.1 14.3 -- -- -- 8.9
Aircel % within Name of the service provider 50.0 -- 50.0 -- -- -- -- 100.0
% within If Yes, Please tick the name of new service provider.
13.3 -- 44.4 -- -- -- -- 8.9
222
Name of the Service Provider
Name of New Service Provider.
Total Airtel Vodafone Reliance BSNL Tata Idea Uninor
Uninor % within Name of the service provider 16.7 50.0 -- -- -- 33.3 -- 100.0
% within If Yes, Please tick the name of new service provider.
3.3 10.7 -- -- -- 100.0 -- 6.7
MTS % within Name of the service provider 46.2 46.2 7.7 -- -- -- -- 100.0
% within If Yes, Please tick the name of new service provider.
20.0 21.4 11.1 -- -- -- -- 14.4
Total % within Name of the service provider 33.3 31.1 10.0 15.6 6.7 2.2 1.1 100.0
% within If Yes, Please tick the name of new service provider.
100.0 100.0 100.0 100.0 100.0 100.0 100.0 100.0
Figure 5.4.6D : If Decided to Switching to a Better Service Provider, Name of New Service
Provider
223
vii) Reasons for Switching to New Operator
The table 5.4.7D and figure 5.4.7D describe the behavior of subscribers who have
the switching intention - overall 45.6 percent subscribers are switching to other
service providers for better customer services followed by 24.4 percent
subscribers are switching for minimum call charges, 14.4 percent subscribers are
switching for better connectivity and 15.6 percent are switching due to other
factors i.e. for better value added services, multimedia services, billing
services/tariff plans etc.
Table 5.4.7D : Reasons for Switching to New Operator
(figures in %)
Why do you want to switch to new operator?
Total
Name of the Service Provider
Better
Connectivity Minimum Call
Charges
Better Customer
Service Any other,
Please specify
Airtel % within Name of the service provider -- 100.0 -- -- 100.0
% within Why do you want to switch to new operator?
-- 72.7 -- -- 17.8
Vodafone % within Name of the service provider -- 33.3 66.7 -- 100.0
% within Why do you want to switch to new operator?
-- 9.1 9.8 -- 6.7
Reliance % within Name of the service provider 22.2 11.1 66.7 -- 100.0
% within Why do you want to switch to new operator?
15.4 4.5 14.6 -- 10.0
BSNL % within Name of the service provider 7.7 -- 84.6 7.7 100.0
% within Why do you want to switch to new operator?
7.7 -- 26.8 7.1 14.4
Tata % within Name of the service provider 18.2 9.1 54.5 18.2 100.0
% within Why do you want to switch to new operator?
15.4 4.5 14.6 14.3 12.2
224
Why do you want to switch to new operator?
Total
Name of the Service Provider
Better
Connectivity Minimum Call
Charges
Better Customer
Service Any other,
Please specify
Idea % within Name of the service provider 25.0 25.0 50.0 -- 100.0
% within Why do you want to switch to new operator?
15.4 9.1 9.8 -- 8.9
Aircel % within Name of the service provider 25.0 -- 25.0 50.0 100.0
% within Why do you want to switch to new operator?
15.4 -- 4.9 28.6 8.9
Uninor % within Name of the service provider 16.7 -- 66.7 16.7 100.0
% within Why do you want to switch to new operator?
7.7 -- 9.8 7.1 6.7
MTS % within Name of the service provider 23.1 -- 30.8 46.2 100.0
% within Why do you want to switch to new operator?
23.1 -- 9.8 42.9 14.4
Total % within Name of the service provider 14.4 24.4 45.6 15.6 100.0
% within Why do you want to switch to new operator?
100.0 100.0 100.0 100.0 100.0
Figure 5.4.7D : Reasons for Switching to New Operator
225
Section E
5.5 Testing of Hypotheses
i) Hypothesis - H01: There is no impact of customer care services on
overall satisfaction of the mobile Phone subscribers.
Table 5.5.1E : Rating of the customer care services and Rating of Overall Satisfaction Level
with the Service Provider
Parameters
Rate Your Overall Satisfaction Level with Your Service Provider
Total Highly
Dissatisfied Dissatisfied Neutral Satisfied
How do you rate the customer care services of your mobile operator?
Much worse than expected 0 2 0 0 2
Worse than expected 7 120 6 0 133
Equal to my expectations 0 27 68 111 206
Better than expected 0 18 0 207 225
Much better than expected 15 0 0 19 34
Total 22 167 74 337 600
Chi-Square Tests
Value df Asymp. Sig. (2-sided)
Pearson Chi-Square 6.532E2 12 .000
Likelihood Ratio 598.222 12 .000
Linear-by-Linear Association 170.119 1 .000
N of Valid Cases 600
Since the value of Pearson Chi-square is 6.532E2 i.e. 653.2, which is
greater than the tabulated value (21.03) at 12 degrees of freedom and 5% level of
significance therefore the Null Hypothesis There is no impact of customer care
226
services on overall satisfaction of the mobile phone subscribers is rejected; the
customer care services have an impact on the overall satisfaction of the mobile
phone subscribers.
ii) Hypothesis - H02: There is no relationship between overall satisfaction
and switching intention of the subscribers.
Table 5.5.2E : Overall Satisfaction Level with Service provider Switching Intention
Level of Satisfaction
Do you have the intention of switching to a better service provider Total
Yes No
Rate your overall satisfaction level with your service provider
Highly Dissatisfied 7 15 22
Dissatisfied 167 0 167
Neutral 68 6 74
Satisfied 10 327 337
Total 252 348 600
Chi-Square Tests
Value df Asymp. Sig. (2-sided)
Pearson Chi-Square 5.179E2 3 .000
Likelihood Ratio 657.131 3 .000
Linear-by-Linear Association 363.346 1 .000
N of Valid Cases 600
Since the value of Pearson Chi-square is 5.179E2 i.e. 517.9 is which is
greater than the tabulated value (7.82) at 3 degree of freedom and 5% level of
significance so the Null Hypothesis - There is no relationship between overall
satisfaction and switching intention of the subscribers is rejected and the above
data show that with the increase in the level of satisfaction subscribers do not
prefer to have the switching intention.
227
iii) Hypothesis - H03: There is no relationship between satisfaction with
effectiveness of the network and switching intention of the mobile
phone subscribers.
Table 5.5.3E : Satisfaction with effectiveness of the Network Switching Intention
Level of Satisfaction
Do you have the Intention of Switching to a better Service Provider Total
Yes No
Rate your satisfaction level with reference to effectiveness of the network
Dissatisfied 117 25 142
Neutral 74 241 315
Satisfied 61 82 143
Total 252 348 600
Chi-Square Tests
Value df Asymp. Sig. (2-sided)
Pearson Chi-Square 1.394E2 2 .000
Likelihood Ratio 145.596 2 .000
Linear-by-Linear Association 45.774 1 .000
N of Valid Cases 600
Since the value of Pearson Chi-square is 1.394E2 i.e. 139.4, which is
greater than the tabulated value (5.99) at 2 degrees of freedom and 5 per cent level
of significance therefore the Null Hypothesis There is no relationship between
satisfaction level with reference to effectiveness of the network and switching
intention of the mobile phone subscribers is rejected; and the above data show
that with the increase in the level of satisfaction with effectiveness of the network,
subscribers do not prefer to have the switching intention.
228
iv) Hypothesis - H04: There is no relationship between the call charges
and switching intention of the mobile phone subscribers.
Table 5.5.4E : Satisfaction with the Call Charges Switching Intention
Level of Satisfaction
Do you have the intention of switching to a better service provider Total
Yes No
Rate your satisfaction level with reference to call charges
Highly Dissatisfied 9 0 9
Dissatisfied 75 0 75
Neutral 44 114 158
Satisfied 84 215 299
Highly Satisfied 40 19 59
Total 252 348 600
Chi-Square Tests
Value df Asymp. Sig. (2-sided)
Pearson Chi-Square 1.688E2 4 .000
Likelihood Ratio 200.168 4 .000
Linear-by-Linear Association 36.850 1 .000
N of Valid Cases 600
Since the value of Pearson Chi-square is 1.688E2 i.e. 168.8, which is
greater than the tabulated value (9.49) at 4 degrees of freedom and 5% level of
significance therefore the Null Hypothesis There is no relationship between the
call charges and switching intention of the mobile phone subscribers is rejected;
and the above data show that with the increase in the level of satisfaction with call
charges, subscribers do not prefer to have the switching intention.
229
v) Hypothesis - H05: There is no relationship between satisfaction with
multimedia/value added services and switching intention of the mobile
phone subscribers.
Table 5.5.5E : Satisfaction with Multimedia/Value Added Services Switching Intention
Level of Satisfaction
Do you have the intention of switching to a better service provider Total
Yes No
Rate your satisfaction level with reference to multimedia/value added services
Dissatisfied 6 0 6
Neutral 108 116 224
Satisfied 138 229 367
Highly Satisfied 0 3 3
Total 252 348 600
Chi-Square Tests
Value df Asymp. Sig. (2-sided)
Pearson Chi-Square 16.923 3 .001
Likelihood Ratio 20.137 3 .000
Linear-by-Linear Association 12.515 1 .000
N of Valid Cases 600
Since the value of Pearson Chi-square is 16.923, which is greater than the
tabulated value (7.82) at 3 degrees of freedom and 5% level of significance
therefore the Null Hypothesis There is no relationship between satisfaction level
with Multimedia/Value added Services and switching intention of the mobile
phone subscribers is rejected; the above data show that with the increase in the
level of satisfaction with Multimedia/Value added services, subscribers do not
prefer to have the switching intention.
230
Section F
5.6 Factor Analysis
(i) Factor Analysis with reference to Customer Care Services
Factor Analysis is a method of reducing data complexity by reducing the number
of variables being studied. The first stage of factor analysis involves factor
extraction where our objective is to identify how many factors will be extracted
from the data. We Eigen value of 1
From the table given below, it is observed that all the eight variables are
combined together into one variable because only one factor has been extracted
and the label assign
Table 5.6.1F : Communalities
Initial Extraction Prompt customer services in terms of accessibility of customer care centres and handling of customer complaints
1.000 .581
Ability of the customer care executive to understand the specific needs of the customer and to communicate with them
1.000 .727
Sincerity, patience and capability to solve customer problems. 1.000 .722
Satisfaction with the response of customer care executive. 1.000 .714
Willingness of customer care executive to help in emergency situations 1.000 .728
The behaviour of Customer care executive in establishing service confidence and their customer centric approach
1.000 .790
Rating for customer care services of your mobile operator 1.000 .716
Are Customer care executive apologizing for inconvenience caused to customers? 1.000 .623
* Extraction Method: Principal Component Analysis.
231
Table 5.6.2F : Total Variance Explained
Component Initial Eigen values Extraction Sums of Squared Loadings
Total % of Variance
Cumulative % Total % of
Variance Cumulative
%
1 5.600 70.003 70.003 5.600 70.003 70.003
2 .732 9.155 79.158 - - -
3 .441 5.515 84.673 - - -
4 .373 4.661 89.334 - - -
5 .303 3.784 93.118 - - -
6 .236 2.953 96.072 - - -
7 .171 2.132 98.204 - - -
8 .144 1.796 100.000 - - -
* Extraction Method: Principal Component Analysis.
Table 5.6.3F : Component Matrixa
Component
1 Prompt customer services in terms of accessibility of customer care centres and handling of customer complaints
.762
Ability of the customer care executive to understand the specific needs of the customer and to communicate with them
.853
Sincerity, patience and capability to solve customer problems. .850
Satisfaction with the response of customer care executive. .845
Willingness of customer care executive to help in emergency situations .853
The behaviour of Customer care executive in establishing service confidence and their customer centric approach
.889
Rating for customer care services of your mobile operator .846
Are Customer care executive apologizing for inconvenience caused to customers? .789
* Extraction Method: Principal Component Analysis. a 1 components extracted
232
Table 5.6.4F : Rating of Customer Care Services and City of Respondents
Crosstab
Rating of customer care services
City of Respondent
Total Varanasi Kanpur Lucknow Allahabad
Much worse than expected
Count 42 26 18 21 107
% within Rating of customer care services of mobile operators
39.3 24.3 16.8 19.6 100.0
% within City of Respondent 28.0 17.3 12.0 14.0 17.8
Worse than expected Count 0 16 6 6 28
% within Rating of customer care services of mobile operators
-- 57.1 21.4 21.4 100.0
% within City of Respondent -- 10.7 4.0 4.0 4.7
Equal to my expectations
Count 54 87 82 64 287
% within Rating of customer care services of mobile operators
18.8 30.3 28.6 22.3 100.0
% within City of Respondent 36.0 58.0 54.7 42.7 47.8
Better than expected Count 48 15 44 59 166
% within Rating of customer care services of mobile operators
28.9 9.0 26.5 35.5 100.0
% within City of Respondent 32.0 10.0 29.3 39.3 27.7
Much better than expected
Count 6 6 0 0 12
% within Rating of customer care services of mobile operators
50.0 50.0 -- -- 100.0
% within City of Respondent 4.0 4.0 -- -- 2.0
Total Count 150 150 150 150 600
% within Rating of customer care services of mobile operators
25.0 25.0 25.0 25.0 100.0
% within City of Respondent 100.0 100.0 100.0 100.0 100.0
233
Figure 5.6.1F : Rating of Customer Services and City of the Respondents
In this study, data analysis is based on data collected from the mobile
phone subscribers of four major cities of U.P.(East) circle. Considering the city
wise variations in the effectiveness of customer care services, the researcher in
order to study and analyse U.P.(East) circle has included the mobile phone
i.e. Varanasi, Kanpur, Lucknow
and Allahabad of U.P.(East) circle.
234
Table 5.6.5F : Rating of Customer Care Services and Name of the Service Provider
Crosstab
Rating of customer care
services of mobile operators
Statistics Name of the Service Provider
Total Airtel Vodafone Reliance BSNL Tata Idea Aircel Uninor MTS
Much worse than expected
Count 0 3 24 33 16 11 7 2 11 107
% within Rating of customer care services of mobile operators
-- 2.8 22.4 30.8 15.0 10.3 6.5 1.9 10.3 100.0
% within Name of the service provider -- 3.0 27.3 39.3 33.3 17.2 23.3 7.7 47.8 17.8
Worse than expected
Count 0 9 2 1 0 3 3 9 1 28
% within Rating of customer care services of mobile operators
-- 32.1 7.1 3.6 -- 10.7 10.7 32.1 3.6 100.0
% within Name of the service provider -- 9.0 2.3 1.2 -- 4.7 10.0 34.6 4.3 4.7
Equal to my expectations
Count 83 41 31 37 27 36 9 13 10 287
% within Rating of customer care services of mobile operators
28.9 14.3 10.8 12.9 9.4 12.5 3.1 4.5 3.5 100.0
% within Name of the service provider 60.6 41.0 35.2 44.0 56.2 56.2 30.0 50.0 43.5 47.8
Better than expected
Count 42 47 31 13 5 14 11 2 1 166
% within Rating of customer care services of mobile operators
25.3 28.3 18.7 7.8 3.0 8.4 6.6 1.2 0.6 100.0
% within Name of the service provider 30.7 47.0 35.2 15.5 10.4 21.9 36.7 7.7 4.3 27.7
Much better than expected
Count 12 0 0 0 0 0 0 0 0 12
% within Rating of customer care services of mobile operators
100.0 -- -- -- -- -- -- -- -- 100.0
% within Name of the service provider 8.8 -- -- -- -- -- -- -- -- 2.0
Total Count 137 100 88 84 48 64 30 26 23 600
% within Rating of customer care services of mobile operators
22.8 16.7 14.7 14.0 8.0 10.7 5.0 4.3 3.8 100.0
% within Name of the service provider 100.0 100.0 100.0 100.0 100.0 100.0 100.0 100.0 100.0 100.0
235
Figure 5.6.2F : Rating of Customer Care Services and Name of the Service Provider
With reference to Rating of customer care services it is clear that Airtel
and Vodafone are the leading players and doing very well on this parameter
however it is an area of concern for players like Reliance, BSNL, Aircel, Tata
and MTS to retain their subscribers in this highly competitive telecom circle.
(ii) Factor Analysis with reference to Quality Dimensions
With reference to quality dimensions, it is observed that all the six variables
should be combined together into one variable because factor analysis has
extracted only one factor and the label assigned to that single factor could be
This single factor contains the maximum information of all the six
variables. With reference to quality dimensions, it is observed that contribution of
236
economical factor towards the quality dimensions is insignificant as compared to
the other factors and has already being analyzed separately.
Table 5.6.6F : Communalities
Initial Extraction
Effectiveness of the network to offer variety of entertainment facilities 1.000 .532
How truthful (keeping to promises) is your service provider to you? 1.000 .747
Having sound loyalty programme to recognize you as a frequent customer. 1.000 .767
How economical is the use of your telecom network services? 1.000 .102
Network Innovativeness 1.000 .596
How do you rate the brand image and reputation of your service provider? 1.000 .515
* Extraction Method: Principal Component Analysis.
Table 5.6.7F : Total Variance Explained
Component Initial Eigen values Extraction Sums of Squared Loadings
Total % of Variance
Cumulative % Total % of
Variance Cumulative
%
1 3.259 54.324 54.324 3.259 54.324 54.324
2 .941 15.689 70.013 - - -
3 .671 11.188 81.200 - - -
4 .599 9.991 91.192 - - -
5 .317 5.290 96.481 - - -
6 .211 3.519 100.000 - - -
* Extraction Method: Principal Component Analysis.
237
Table 5.6.8F : Component Matrixa
Component
1
Effectiveness of the network to offer variety of
entertainment facilities .729
How truthful (keeping to promises) is your service
provider to you? .865
Having sound loyalty programme to recognize you
as a frequent customer. .876
How economical is the use of your telecom
network services? .320
Network Innovativeness .772
How do you rate the brand image and reputation of
your service provider? .717
* Extraction Method: Principal Component Analysis. a 1 components extracted
238
Table 5.6.9F : Brand Image and Reputation of Service Provider and Name of the Service Provider
Crosstab
Brand image and reputation of
service provider Statistics
Name of the Service Provider
Total Airtel Vodafone Reliance BSNL Tata Idea Aircel Uninor MTS
Much worse than expected
Count 0 3 9 20 1 9 6 2 9 59
% within Brand image and reputation of service provider
-- 5.1 15.3 33.9 1.7 15.3 10.2 3.4 15.3 100.0
% within Name of the service provider -- 3.0 10.2 23.8 2.1 14.1 20.0 7.7 39.1 9.8
Worse than expected
Count 0 0 17 14 15 11 4 9 3 73
% within Brand image and reputation of service provider
-- -- 23.3 19.2 20.5 15.1 5.5 12.3 4.1 100.0
% within Name of the service provider -- -- 19.3 16.7 31.2 17.2 13.3 34.6 13.0 12.2
Equal to my expectations
Count 47 16 20 24 7 10 9 4 3 140
% within Brand image and reputation of service provider
33.6 11.4 14.3 17.1 5.0 7.1 6.4 2.9 2.1 100.0
% within Name of the service provider 34.3 16.0 22.7 28.6 14.6 15.6 30.0 15.4 13.0 23.3
Better than expected
Count 67 81 42 26 25 31 11 10 8 301
% within Brand image and reputation of service provider
22.3 26.9 14.0 8.6 8.3 10.3 3.7 3.3 2.7 100.0
% within Name of the service provider 48.9 81.0 47.7 31.0 52.1 48.4 36.7 38.5 34.8 50.2
Much better than expected
Count 23 0 0 0 0 3 0 1 0 27
% within Brand image and reputation of service provider
85.2 -- -- -- -- 11.1 -- 3.7 -- 100.0
% within Name of the service provider 16.8 -- -- -- -- 4.7 -- 3.8 -- 4.5
Total Count 137 100 88 84 48 64 30 26 23 600
% within Brand image and reputation of service provider
22.8 16.7 14.7 14.0 8.0 10.7 5.0 4.3 3.8 100.0
% within Name of the service provider 100.0 100.0 100.0 100.0 100.0 100.0 100.0 100.0 100.0 100.0
239
Figure 5.6.3F : Brand Image and Reputation of Service Provider
Service provider wise analysis shows that with reference to Brand Image
and reputation of service provider, only Airtel and Vodafone subscribers are
satisfied however, for all the other service providers, it is an area of serious
concern.
5.7 Conclusion
This chapter discussed the data analysis of the collected data i.e., profile of the
respondents, various problems faced by mobile subscribers, satisfaction level of
mobile subscribers with reference to the customer care services and the quality
dimensions, the level of overall satisfaction of the mobile phone subscribers with
their service providers, awareness about MNP, switching intention and reasons for
240
their switching intention. The data were collected from primary and secondary
sources. Researcher analyzed primary data with various statistical tools and
techniques and hypotheses testing were done to achieve the objectives of the
study. In this backdrop of analysis, the researcher proceeds with major findings,