22

»chapter 11Measurement
, ; . .; -:}.;;~~)~~·~}k~F~ii&{t;':·;;~:a;t:;(1~r. .~:";,l'-ngQ,,~ecIves,.,._, '..;
~#!!~~f~&~r'i~,:e::it~~::/·.'': ......< .",' -: , .,,,-,.,~fter rea~ii1gthis cliapter;'yoiJ stl()uldund~rstand.; ..
:;:.:. ,-..'~
'/ ' ..:.':1.· The distinction between measuring objects, properties, and indicants of properties.
J";The similarities and differences between the four scale types used in.measurement and when each is used.
The four major sources of measurement error ..
,~.4The criteria for evaluating good measurement:
;!..
>bringingresearchtolife
t.J~~~~t~;~~~;"€~~;,;'t'~~'d ectorasshe propds Jason across a manicured lawn' ouidi~h .' .",. ..•..
."
'MeJidanceT' ventures JasoD;''Tell me whatyoll" d(j~'\VeH;'$orp:e,;9ft#.#':'rJf .¥,ere." ..., . with tIs ffifOl:miUlY,'~'~0ttlhJ:*-P~':,i",,<
s "We offer one of the most outstanding summer hesitantly. .' ""'. ·".C •• ,,'.'
'~music festivals in the country-maybe the continent. "And they said ... ?"urg~s\rASG~;:mcit~':th''We present several concerts each week, all summer little impatiently, reme~b~rit;g~l¥@i'~p'#~~~long, with evening performances on both Friday and partner for usually h.mcllitlirthisp'h~s~preiplh ..
'.'. '.' . .... .)" ..... "'.... ,.",.,.'Saturday. During the week, rehearsals are open to research. .'>
· music patrons and students. And, of course, our skilled "One' commented; 'I've. neverLh~aro .tbist.~:
...:.§~;~;;;;~~~::~;;~;;~;;i~;':gf~ii;;'~fii}il~~ti~1fg1'coordinating closely with me on the budget. This is stage full of people sitting in chairs?' ", ;;,Iquite complicated, because most of our musicians "Hold on," says Jason, making a note in,h,i); .spend only two weeks with us. Fully 600 performing PalmPilot. "I can see your orchestra jsstrikingj(~.9ur .
·:::~,:::v:: ~:,:fo~::;~:;~e:~:':"ofthis.;~:;:::;:::~;~h;~~~:~~~~~i~lll'l~Jq;,."Colleges in British Columbia send me their' extensive programfor measuring custoiil~fs~t:i~f~<~l.. ..,,~:.;
'music scholarship students for summer employment: and.' .",. . ':'~:;;,~';:;"::;:~:".\;
·as dishwashers, waiters, cleaners, and the like. It is "Ah, yes, measuring cristonier"ia:tisf~dttort:;'"I
a special opportunity for them, rubbing shoulders interrupts the director, "second only'to.casli';.'fiow;. -." :.; F .,,:.,., . , .....••.• ' .: :."
-1
l..!"iiii'iP~ ,_ ,,_ _, >ft\'<:{,~CUniG .. servlce.:'·_ .. " :", ," ':;- of the:n et way" msitre'yoUi av:trerilf''''
1~i~~~;~~~ti.~!nf!'~:ttr:!;:~:.<~;~~:tit;~~~Jf;~i~~~~~~~'1:1¥;::~~::'::~:':::~~;::c··.g;~ifal~~'~I~i1r~~}·
.. "NO;;'explains Jason, "m.yinterests ran mote tow~d drive .youback.to the community airport; then: You're~tatisti~§tb~Sch)lbt!rt." bound to hav~alot-iQ ~oUImon." .
;'r ." " .. ". ;
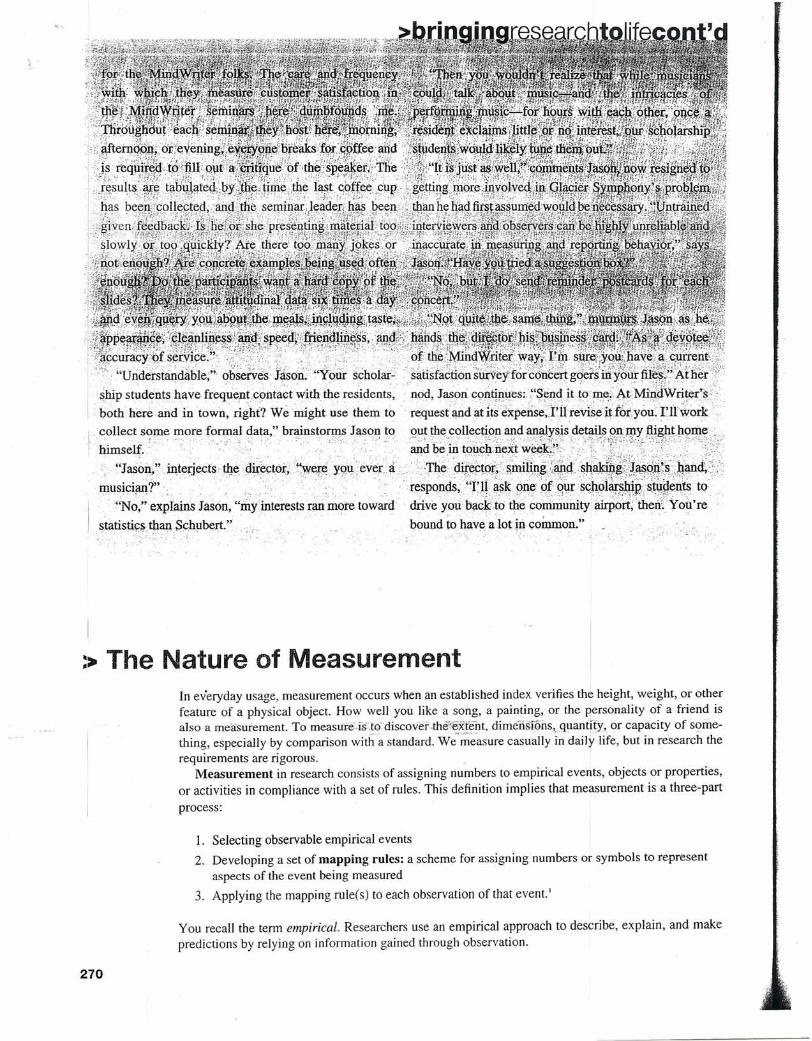
::> The Nature of MeasurementIn everyday usage, measurement occurs when an established index verifies the height, weight, or otherfeature of a physical object. How well you like a song, a painting, or the personality of a friend isalso a measurement. To measu:re.is~,tOdiscover-the"'tej(fent, dimens'fens, quantity, or capacity of some-thing, especially by comparison witha standard. We';;;~~sure casuallyin daily life, but in research therequirements are rigorous.
Measurement in research consists of assigning numbers to empirical events, objects or properties,or activities in compliance with a set of rules, This definition implies that measurement is a three-partprocess:
I. Selecting observable empirical events2. Developing a set of mapping rules: a scheme for assigning numbers or symbols to represent
aspects of the event being measured3. Applying the mapping rule(s) to each observation of that event.'
You recall the term empirical. Researchers use an empirical approach to describe, explain, and makepredictions by relying on information gained through observation.
270

>chapter 11 Measurement
Assume you are studying people who attend an auto show where prototypes for new models are ondisplay. You are interested in learning the male-to-female ratio among attendees. You observe thosewho enter the show area. If a person is female, you record an F; if male, an M. Any other symbols suchas 0 and 1 or # and % also may be used if you know what group the symbol identifies. Exhibit 1I -1 usesthis example to illustrate the three components.
;;..Exhibit 11-1 Characteristics of Measurement
Gender Styling Characteristics AttendeesAttendees
SampleElements A BeD E
Symbol 5
A BeD EEmpirical ~ GenderObservations
Desirabilityof auto styling
Mapping Rule AssignM if maleF if female
Assign5 if very desirable4 if desirable3 if neither2 if undesirable1 if very undesirable
(M,F) 4(1 through 5)
. ~.-
Atlendees A, B, and C are male, and find the auto's styling to be undesirable.Atlendees 0 and E are female and find the auto's styling desirable.
271

272 >part III The Sources and Collection of Data
Researchers might also want to measure the styling desirability of a new concept car at this show.They interview a sample of visitors and assign, with a different mapping rule, their opinions to the fol-lowing scale:
What is your opinion of the styling of the concept CS?
Very desirable 5 4 3 2 I Very undesirable
All measurement theorists would call the rating scale in Exhibit 11- I a form of measurement, but somewould challenge whether classifying males and females is a form of measurement. Their argumentIS that measurement must involve quantification-that is, "the assignment of numbers to objects torepresent amounts or degrees of a property possessed by all of the objects.'? This condition was metwhen measuring opinions of car styling. Our approach endorses the more general view that "numbersas symbols within a mapping rule" can reflect both qualitative and quantitative concepts.
The goal of measurement-indeed, the goal of "assigning numbers to empirical events in compli-ance with a set of rules"-is to provide the highest-quality, lowest-error data for testing hypotheses,estimation or prediction, or description. Researchers deduce from a hypothesis that certain conditionsshould exist. Then they measure for these conditions in the real world. If found, the data lend supportto the hypothesis; if not, researchers conclude the hypothesis is faulty. An important question at thispoint is, "Just what does one measure?"
The object of measurement is a concept, the symbols we attach to bundles of meaning that we holdand share with others. We invent higher-level concepts,-constructs-for specialized scientific explan-atory purposes that are not directly observable and for thinking about and communicating abstractions.Concepts and constructs are used at theoretical levels; variables are used at the empirical level. Vari-ables accept numerals or values for the purpose of testing and measurement. Concepts, constructs, andvariables may be defined descriptively or operationally. An operational definition defines a variable interms of specific measurement and testing criteria. It must specify adequately the empirical informationneeded and how it will be collected. In addition, it must have the proper scope or fit for the researchproblem at hand. We review these terms with examples in Exhibit 11-2. I
What Is Measured?Variables being studied in research may be classified as objects or as properties. Objects include theconcepts of ordinary experience, such as tangible items like furniture, laundry detergent, people, or au-tomobiles. Objects also include things that are not as concrete, such as genes] attitudes, and peer-grouppressures. Properties are the characteristics of the object. A person' s PhYSiC~1properties may be statedin terms of weight, height, and posture, among others. Psychological properties include attitudes andintelligence. Social properties include leadership ability, class affiliation, alld status. These and manyother properties of an individual can be measured in a research study. ~
In a literal sense, researchers do not measure either objects or properties. They measure indicants ofthe properties or indicants of the properties of objects. It is easy to observe that A is taller than Bandthat C participates more than I)jn a:group process. Ors~ppose y()u art<.<li1al~Zingme{Upers of a salesforce of several hundred people to learn what persotiiipt6perties ~ontriiSJt~~tosales siiicess. The prop-erties are age, years of experience, and number of calls made per week. The indicants in these cases areso accepted that one considers the properties to be observed directly.
In contrast, it is not easy to measure properties of constructs like "lifestyles," "opinion leader-ship," "distribution channel structure," and "persuasiveness." Since each property cannot be measureddirectly, one must infer its presence or absence by observing some indican~ or pointer measurement.
When you begin to make such linferences, there is oftendisagreement about how to develop an operational defini-tion for each indicant.
Not only is it a challenge to measure such constructs, buta study's quality depends on what measures are selected ordeveloped and how they fit the circumstances. The natureof measurement scales, sources ~f error, and characteristicsof sound measurement are considered next.
2 5 The percent of corporations using orplanning to use cloud computinq-:using software and server space viaInternet sources.
"
>chapter 11 Measurement 273
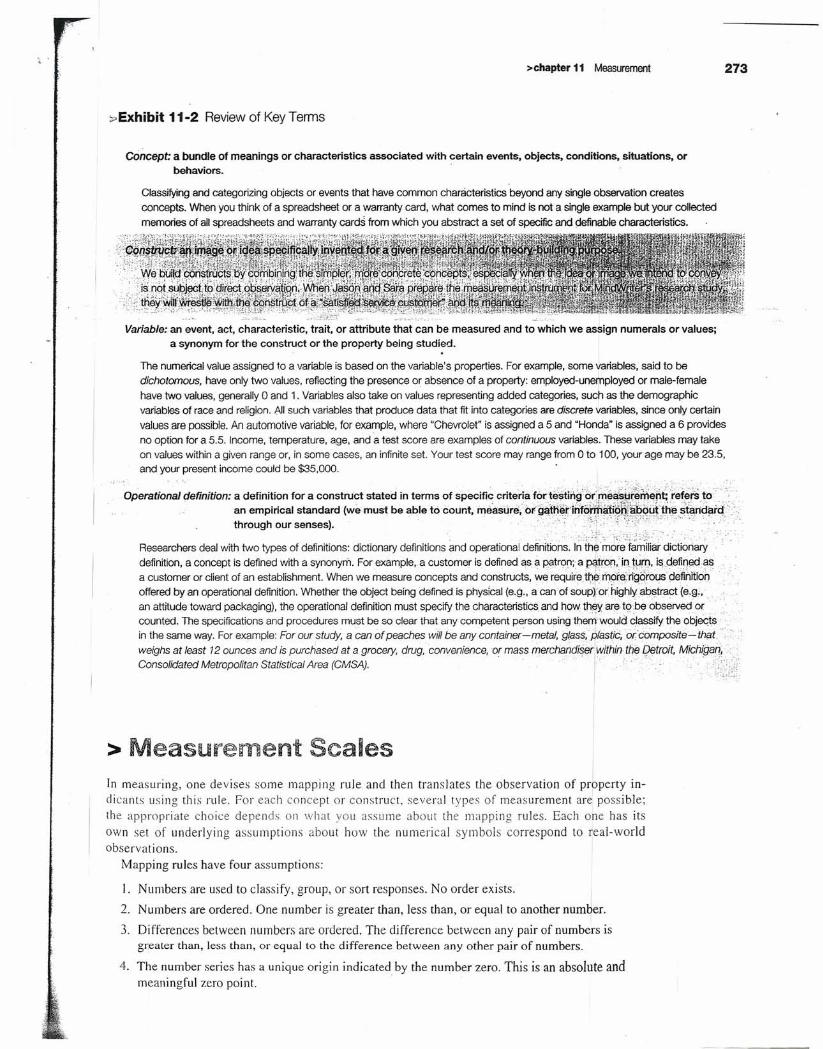
;:.Exhibit 11-2 Review of Key Terms
Concept: a bundle of meanings or characteristics associated with certain events, objects, conditions, situations, orbehaviors.
Classifying and categorizing objects or events that have common characteristics beyond any single observation createsconcepts. When you think of a spreadsheet or a warranty card, what comes to mind is not a single example but your collectedmemories of all spreadsheets and warranty cards from which you abstract a set of specific and <:iefinablecharacteristics.
Variable: an event, act, characteristic, trait, or attribute that can be measured and to which we assign numerals or values;a synonym for the construct or the property being studied.
The numerical value assigned to a variable is based on the variable's properties. For example, some variables, said to bedichotomous, have only two values, reflecting the presence or absence of a property: employed-unerlnployed or male-femalehave two values, generally 0 and 1. Variables also take on values representing added categories, such as the demographicvariables of race and religion. All such variables that produce data that fit into categories are discrete variables, since only certainvalues are possible. An automotive variable, for example, where "Chevrolet" is assigned a 5 and "Honda" is assigned a 6 providesno option for a 5.5. Income, temperature, age, and a test score are examples of continuous variables. These variables may takeon values within a given range or, in some cases, an infinite set. Your test score may range from 0 to 100, your age may be 23.5,and your present income could be $35,000.
.-,:".,,;; ..
Operational definition: a definition for a construct stated in terms of $peCifi~criteriafort~$tiri~{d~;':ri~~~r~iii~~~~eferi;to"an empirical standard (we-must be able tocount, ine'asure;org~tiieH~forffiiitidffi'a'bouht.ie st~dard':'through our senses). '.' . ." "i',: ·.Ji:1;:,',:';::;r~(~~;;'·~·'.'·<·':/.
Researchers deal with two types of definitions: dictionary definitions and operational defiri~ions. In the moreramlliar dictioriarY' .definition, a concept is defined with a synonym. For example, a customer is defined as a patron; a~jron,' jqWryJ. i$,defingdCl~a customer or client of an establishment. When we measure concepts and constructs, we require ttle rhOre;rtgorous c::Jefinitioi)offered by an operational definition. Whether the object being defined is physical (e.q., a can of s~uPr.~r'highlY"~siract (e.g.,",an attitude toward packaging), the operational definition must specify the characteristics and how thiry are to be observed or 'counted. The specifications and procedures must be so clear that any competent person using therrl' would classify the objeCtsin the same way. For example: For our study, a can of peaches wiil be any container'--metal, gfass;pfas(ic, or'compOsite'-that, .,
weighs at least 12 ounces and ~spurchased at a grocery, drug, convenience, or mass merCtiandiSerl~ithinthe qetroit, MiChigag; ..•.••••Consolidated Metropolitan Statistical Area (CMSA). . '.' ,'. . ' '.: ' . <),;:'
. c •• ;.,)--,.'
> Measurement ScalesIn measuring, one devises some mapping rule and then translates the observation of property in-
dicants using this rule, For each concept or construct. several types of measurement are possible;
the appropriate choice depends on what vou assume about the mapping rules. Each one has its
Own set of underlying assumptions about how the numerical symbols correspond la real-world
observations,
Mapping rules have four assumptions:
I, Numbers are used to classify, group, or sort responses. No order exists.
2. Numbers are ordered, One number is greater than, less than, or equal to another number.
3. Differences between numbers are ordered. The difference between any pair of numbers isgreater than, less than, or equal to the difference between any other pair of numbers.
4. The number series has a unique origin indicated by the number zero. This is an absolute andmeaningful zero point.

274 >part III The Sourcesand Collectionof Data
l, ,
>Exhibit 11-3 Measurement Scales
Type of Scale Characteristics of Data BasicEmpirical Operation Example
Nominal
Temperature in degrees
Classification (mutually exclusive andcollectively exhaustive categories), butno order, distance, or natural origin
"f~;\:b7J~>~0/~;;1~2~.~~~~~,'"':;~WI!::~~,!:,:ji~~~~~f#t~~1hh.',r;i"},~~~~!~i~~~,~\~)~t~i;~~;''lt~l~:~.z:",
Determination of equality Gender (male, female)
Classification, order, and distance, but nonatural origin
Interval Determination of equality ofintervals or differences
Combinations of these characteristics of classification, order, distance, and origin provide fourwidely used classifications of measurement scales.' (1) nominal, (2) ordinal, (3) interval, and (4) ratio.Let's preview these measurement scales before we discuss their technical details. Suppose your profes-sor asks a student volunteer to taste-test six candy bars. The student begins by evaluating each on achocolate-not chocolate scale; this is a nominal measurement. Then the student ranks the candy barsfrom best to worst; this is an ordinal measurement. Next, the student uses a 7-point scale that has equaldistance between points to rate the candy bars with regard to some taste criterion (e.g., crunchiness);this is an interval measurement. Finally, the student considers another taste dimension and assigns100 points among the six candy bars; this is a ratio measurement.
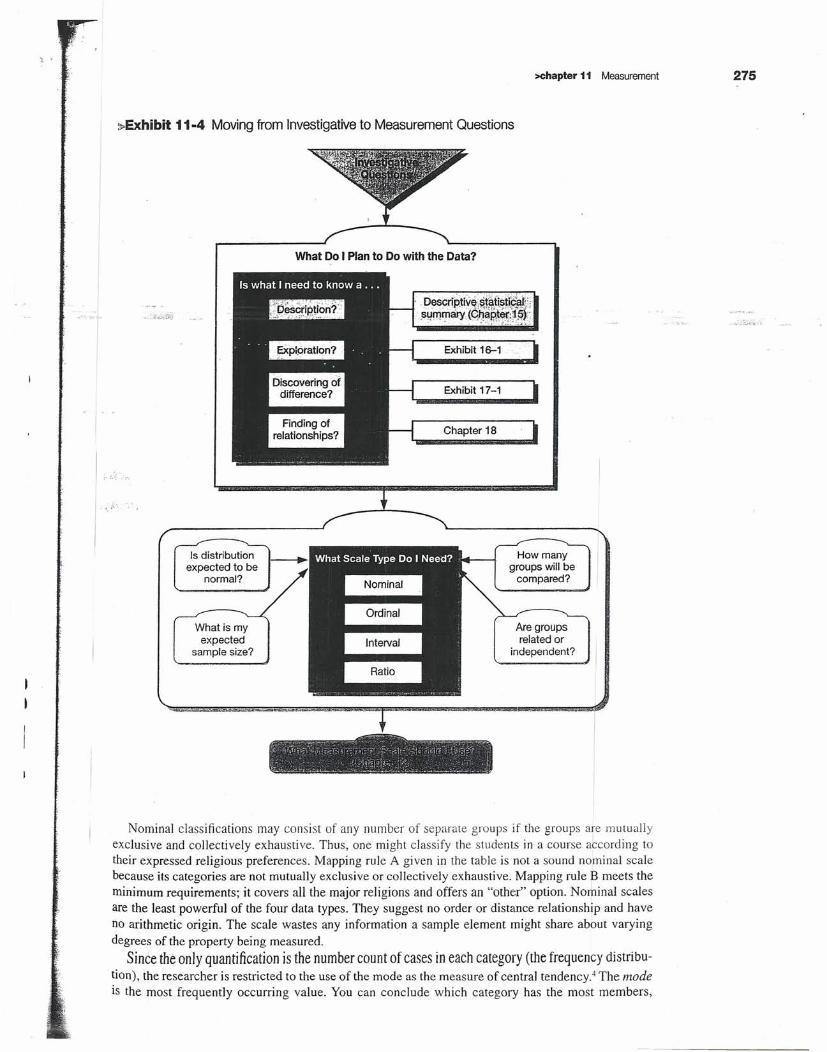
The characteristics of these measurement scales are summarized in Exhibit 11-3. Deciding whichtype of scale is appropriate for your research needs should be seen' as a part bf the research process, asshown in Exhibit 11-4.
Nominal ScalesIn business research, nominal data are widely used. With nominal scales, you are collecting infor-mation on a variable that naturally or by design can be grouped into two or more categories that aremutually exclusive and collectively exhaustive. If data were collected from the symphony patrons atthe Glacier compound, patrons could be classified by whether they hadattended prior symphony per-
formances or this was their first time. Every patron would fit into one of thetwo groups within the variable attendance. I
The counting of members in each group is the only possible arithmetic op-eration when a nominal scale is employed. If we use numerical symbols withinour mapping rule to identify categories, these numbers are recognized as labelsonly and have no.quantitative val!!~.The number23, we know, does not implya sequential couiitofplayers or askiU'level; it is only a.means of identification.Of course, you might want to argue about a jersey number representing a skilllevel if it is LeBron lames wearing jersey 23.
Reli~iOusP eferences .
MappingRuleA MappingRule B
1 = Baptist2 = Catholic.3 = Protestant4 = Scientology5 = Unitarian-Universalist6 = Jewish7 = Secular/nonreligious/agnostic/atheist
,. :;".r:1 = Christian2 = Muslim3 = Hindu4 b Buddhist5 = Jewish6 = Other
" -
>chapter 11 Measurement 275
>Exhibit 11-4 Moving from Investigative to Measurement Questions
-"'·of'"
What Do I Plan to Do with the Data?
Exhibit 16-1
Exhibit 17-1
Chapter 18
Is distributionexpected to be
normal?
How manygroups will be
compared?
What is myexpected
sample size?
Are groupsrelated or
independent?
Nominal classifications may consist of any number of separate groups if the groups are mutuallyexclusive and collectively exhaustive. Thus, one might classify the students in a course according totheir expressed religious preferences. Mapping rule A given in the table is not a sound nominal scalebecause its categories are not mutually exclusive or collectively exhaustive. Mapping rule B meets theminimum requirements; it covers all the major religions and offers an "other" option. Nominal scalesare the least powerful of the four data types. They suggest no order or distance relationship and haveno arithmetic origin. The scale wastes any information a sample element might share about varyingdegrees of the property being measured.
Since the only quantification is the number count of cases in each category (the frequency distribu-tion), the researcher is restricted to the use of the mode as the measure of central tendency." The modeis the most frequently occurring value. You can conclude which category has the most members,
276 >part III The Sources andCollection of Data
but that is all. There is no generally used measure of dispersion for nominal scales. Dispersion des-cribes how scores cluster or scatter in a distribution. By cross-tabulating nominal variables with othervariables, you can begin to discern patterns in data.
Although nominal data are statistically weak, they are still useful. If no other scale can beused, one can almost always classify a set of properties into a set of equivalent classes. Nominalmeasures are especially valuable in exploratory work where the objective is to uncover relation-ships rather than secure precise measurements. This type of scale is also widely used in survey andother research when data are classified by major subgroups of the population. Classifications suchas respondents' marital status, gender, political orientation, and exposure to a certain experienceprovide insight into important demographic data patterns.
Jason visited Glacier because of his familiarity with MindWriter's extensive research into customersatisfaction. His visit revealed Glacier's need for some exploratory nominal data on symphony patrons.Patrons could be divi?~~)!l!O groups-based 9,~}heir appreciation of the conductor (favorable, unfa-vorable); on their attitude-toward facilities (suitable, not suitable), on their perception of the program(cliched, virtuoso), on their level of symphony support (financial support, do financial supportj=-endthen analyzed.
Ordinal ScalesOrdinal scales include the characteristics of the nominal scale plus an indication of order. Ordinal datarequire conformity to a logical postulate, which states: If a is greater than band b is greater than c, thena is greater than c.5 The use of an ordinal scale implies a statement of "greater than" or "less than" (anequality statement is also acceptable) without stating how much greater or less. While ordinal measure-ment speaks of greater-than and less-than measurements, other descriptors may be used-"superiorto," "happier than," "poorer than," or "important than." Like a rubber yardstick, an ordinal scale canstretch varying amounts at different places along its length. Thus, the real difference between ranks Iand 2 on a satisfaction scale may be more or less than the difference between ranks 2 and 3. An ordi-nal concept can be extended beyond the three cases used in the simple illustration of a > b > c. Anynumber of cases can be ranked.
Another extension of the ordinal concept occurs when there is more than one property of interest.We may ask a taster to rank varieties of carbonated soft drinks by flavor, cOlol, carbonation, and a com-bination of these characteristics. We can secure the combined ranking either by asking the respondentto base his or her ranking on the combination of properties or by constructing a combination ranking ofthe individual ran kings on each property. I
Examples of ordinal data include attitude and preference scales. (In the next chapter, we providedetailed examples of attitude scales.) Because the numbers used with ordinal scales have only a rankmeaning, the appropriate measure of central tendency is the median. The median is the midpoint of adistribution. A percentile or quartile reveals the dispersion. I
Correlational analysis of ordinal data is restricted to various ordinal techniques. Measures of sta-tistical significance are technically confined to a body of statistics known as nonparametric methods.synonymous with distribution-free statistics. 6
Researchers differ about whether more powerful tests are appropriate for analyzing ordinal mea-sures. Because nonparametric tests are abundant, simple to calculate, have good statistical power,"and do not require that the researcher accept the assumptions of parametric testing, we advise their usewith nominal and ordinal data. It is understandable, however, that because parametric tests (such as thez-test or analysis of variance) are versatile, accepted, and understood, they will be used with ordinaldata when researchers can demonstrate that those data approach the assumptions necessary for intervallevel analysis.
Interval ScalesInterval scales have the power of nominal and ordinal data plus one additional strength: They
incorporate the concept of equality of interval (the scaled distance between I and 2 equals the dis-tance between 2 and 3). Calendar time is such a scale. For example, the elapsed time between 3 and
l '
>chapter 11 Measurement 277
6 a.m. equals the time between 4 and 7 a.m. One cannot say, however, that 6 a.m. is twice as late as3 a.m., because "zero time" is an arbitrary zero point. Centigrade and Fahrenheit temperature scalesare other examples of classical interval scales. Both have an arbitrarily determined zero point, nota unique origin.
Researchers treat many attitude scales as interval, as we illustrate in the next chapter. When a scaleis interval and the data are relatively symmetric with one mode, you use the arithmetic mean as themeasure of central tendency. You can compute the average time of a TV promotional message or theaverage attitude value for different age groups in an insurance benefits study. The standard deviation isthe measure of dispersion. The product-moment correlation, r-tests, F-tests, and other parametric testsarethe statistical procedures of choice for interval data."
When the distribution of scores computed from interval data leans in one direction or the other(skewed right or left), we often lls~.!he median as ~Q~.•:neasure of central tendency and the interquartilerange as the measure of dispersion. The reasons for this.are discussed in Chapter 15, Appendix 15a.
Ratio ScalesRatio scales incorporate all of the powers of the previous scales plus the provision for absolute zero ororigin. Ratio data represent the actual amounts of a variable. Measures of physical dimensions such asweight, height, distance, and area are examples. In the behavioral sciences, few situations satisfy therequirements of the ratio scale-the area of psychophysics offering some exceptions. In business re-search, we find ratio scales in many areas. There are money values, population counts, distances, returnTaty.~,productivity rates, and amounts of time (e.g., elapsed time in seconds before a customer servicerepresentative answers a phone inquiry).
Swatch's BeatTime-a proposed standard global.time introduced at the 2000 Olympics that may gainfavor as more of us participate in cross-time-zonechats {Internet or otherwise )-is a ratio scale. It offersa standard time with its origin at 0 beats (12 midnightin-Biel, Switzerland, at the new Biel Meridian time-line). A day is composed of 1,000 beats, with a "beat"worth I minute, 26.4 seconds."
With the Glacier project, Jason could measure acustomer's age, the number of years he or she has at-tended, and the number of times a selection has beenperformed in the Glacier summer festival. These mea-sures all generate ratio data. For practical purposes,however, the analyst would use the same statisticaltechniques as with interval data.
All statistical techniques mentioned up to this pointare usable with ratio scales. Other manipulations car-ried out with real numbers may be done with ratio-scale values. Thus, multiplication and division can beused with this scale but not with the others mentioned.Geometric and harmonic means are measures of cen-tral tendency, and coefficients of variation may also becalculated for describing variability.
Researchers often encounter the problem of evalu-ating variables that have been measured on differentscales. FOi example, the choice to purchase a product
.~y a consumer is a nominal variable, and cost is a ratiovariable. Certain statistical techniques require that the
. - - . - In measurement, a researcher needs to know precisely what is beingmeasurement levels be the- same. Since the nominal rneasured As this SAS 8(1indicates, not having a good view of the bigvariable does <lot have the characteristics of order, picture is unacceptable.distance, or poiDLot:-_~:;rig~,-w~ cannot create them _www.sas.com
278 >part 1\1 The Sources and Collectionof Data
Doesn't it seem.odd that some of the most popular shows onTV have the least watched ads? From TiVo research we dis-cover that, "nearly all of the television shows that won 2009Emmys showed higher levels of ad-skipping than the averagesfor their respective genres. »a Sitcoms had a 66 percent level ofad-skipping in contrast to the 88 percent whc fast-forwardedthrough "MadMen" adsand the 73 percent?t the audiences whoskipped over ads for allTV dramas." Accbrding to Todd Juenge~" , ..TiVo's vice president for auolence research and measurement,people who watch hit shows are more likelyto skip ads becausethey are more involved in the show than other viewers."
Madison Avenue media planners have long counseled com-panies to avoid buying ads in the fourth quarter of the Super Bowl,even understanding fhatpart of the appeal of the Super Bowl iswatching the ads. However, such advice is now being reassessedafter the second championship in consecutive years was won inthe finalmoments of play," NBe's broadcast of commercials in the
last quarter of Super Bowl XLIII had strong viewer numbers. Twoof the most-watched ads on TiVo DVRs were the final ads in thegame: Bud Ught Ume beer and GoDaddy.com, the website reg-istration firm. These ads were broadcast after the Arizona Cardi-nals touchdown and before the Pittsburgh Steelers reclaimed thelead and won. "There are two reasons a commercial gets a highrating pn a TWohO~~eJ:!.old]:Mr. Juenger said. "Bther [the show]is rewound often and watched repeatedly or [the ad) happens tobe in the middle of [compellingprodramming that is watched overand over) .•
Those who sat on the edge v~ their seats for the end of SuperBowl XLIII helped rank it as the second-mast-watched SuperBowl. For those rewatching the end of the fourth quarter, sug-gest some hypotheses that explain Iad-skipping. What measureswould you use to test your hypotheses?
www.tivo.com
·1artificially after the fact. The ratio-based salary variable, on the other hand, can be reduced. Rescalingproduct cost into categories (e.g., high, medium, low) simplifies the comparison. This example may beextended to other measurement situations-s-that is, converting or rescalin1 a variable involves reduc-ing the measure from the more powerful and robust level to a lesser oner The loss of measurementpower with this decision means that lesser-powered statistics are then used in data analysis, but fewerassumptions for their proper use are required.
In summary, higher levels of measurement generally yield more infor1fation. Because of the mea-surement precision at higher levels, more powerful and sensitive statistical 1 procedures can be used. Aswe saw with the candy bar example, when one moves from a higher measurement level to a lower one,there is always a loss of information. Finally, when we collect information at higher levels, we canalways convert, rescale, or reduce the data to arrive at a lower level.
> Sources of Measurement Diffelrences .The ideal study should be designed and controlled for precise and unamjjgUOUS measurement of thevariables. Since complete control is unattainable, error does occur. MUChl erroris systematic (resultsfrom a bias), while the remainder is random (occurs erratically). One auth~rity has pointed out severalsources from which measured differences can come." .
Assume you are conducting an ex post facto study of corporate citizenship of a multinational manu-facturer. The company produces family, personal, and household care products. The participants areresidents of a major city. The study concerns the Prince Corporation, a large manufacturer with itsheadquarters and several major facilities located in the city. The objective of the study 'is to discover thepublic's opinions about the company's approach to health, social welfare! and the environment. Youalso want to know the origin of any generally held adverse opinions. I .
Ideally, any variation of scores among the respondents would reflect true differences in their opinionsabout the company. Attitudes toward the firm as an employer, as an ecologically sensitive organization,
>chapter 11 Measurement 279
In connection with an issue centering on privacy issues, the edi- A subsequent question asked respondents, "In the future, dotors ofAmerican Demographics hired TNS Intersearch to conduct you think that the amount of (ACTNITY)willincrease, decrease,a study of adults regarding their behavior and attitudes relating to or stay the same?" where "(ACTlVITY)"relates to one of the fivecopyright infringement. The survey instrument for the telephone numbered elements. Also, each respondent was asked to selectstudy asked 1,051 adult respondents several questions about acti- a phrase from a list of four phrases "that best describes howvitiesthat might or might not be considered copyright infringement. you fool about (ACTIVITY)"and to select a phrase from a list ofThe lead question asked about specific copyright-related actMties:' four phrases that "best describes what you think may happen
Do you know someone who has done or tried to do arW'b(~" .as a result of (ACTIVITY)."The last content question asked thethe following? degree to which respondents would feel favorably toward a com-
pany that provided "some type of media content for free": morefavorable, less favorable, or "it wouldn't impact your impressionof the company." As you might expect, younger adults had dif-ferent behaviors and attitudes compared to older adults on someindicants. What measurement issues were involved in this study?
1. Copying software not licensed for personal use.2. Copying a prerecorded videocassette such as a rental or
purchased video.3. Copying a prerecorded audiocassette or compact disc.4. Oownloading music free of charge from the Intemet.5. Photocopying pages from a book or magazine. www.tns-us.com!
Ior as a progressive corporate citizen would be accurately expressed. However, four major error sourcesmay contaminate the results: (1) the respondent, (2) the situation, (3) the measurer, and (4) the datacollection instrument.
:'Error SourcesThe Respondent
(~pinion differences that affect measurement come from relatively stable characteristics of the respon- .dent. Typical of these are employee status, ethnic group membership, social class, and nearness tomanufacturing facilities. The skilled researcher will anticipate many of these dimensions, adjustingthe design to eliminate, neutralize, or otherwise deal with them. However, even the skilled researchermay not be as aware of less obvious dimensions. The latter variety might be a traumatic experience agiven participant had with the Prince Corporation, its programs, or its employees. Respondents may bereluctant to express strong negative (or positive) feelings, may purposefully express attitudes that theyIkrceive as different from those of others, or may have little knowledge about Prince but be reluctant~ admit ignorance. This reluctance to admit ignorance of a topic can lead to an interview consisting of"guesses" or assumptions, which, in turn, create erroneous data./. Respondents may also suffer from temporary factors like fatigue, boredom, anxiety, hunger, impa-Dlence, or general variations in mood or other distractions; these limit the ability to respond accuratelyand fully. Designing measurement scales that engage the participant for the duration of the measure-ment is crucial.
Situational Factors
Any condition that places a strain on the interview or measurement session can have serious effects onthe interviewer-respondent rapport If another person is present, that 'person can distort responses by• • • '.. I
Jommg in, by distracting, or by merely being there. If the respondents believe anonymity is not ensured,
they may be reluctant to express certain feelings. Curbside or intercept interviews are unlikely to elicitelaborate responses, while in-home interviews more often do ..,

\ '280 spart III The Sources and Collection of Data
The Measurer
The interviewer can distort responses by rewording, paraphrasing, or reordering questions. Stereotypesin appearance and action introduce bias. Inflections of voice and conscious or unconscious prompt-ing with smiles, nods, and so forth, may encourage or discourage certain replies. Careless mechanicalprocessing=checking of the wrong response or failure to record full replies-will obviously distortfindings. In the data analysis stage, incorrect coding, careless tabulation, and faulty statistical calcula-tion may introduce further errors,
The Instrument
A defective instrument can cause distortion in two major ways, First, it can be too confusing and am-biguous: The use of complex words and syntax. beyond participant comprehension is typical. Leadingquestions.oambiguousmeanings, mechanicaltlefects (inadequate space ~or replies, response-choiceomissions, and poor printing), and multiple questions suggest the range of problems. Many of theseproblems are the direct result of oper-ational definitions that are insufficient, resulting in an inappropri-ate scale being chosen or developed.
A more elusive type of instrument deficiency is poor selection from the universe of content items. Sel-dom does the instrument explore all the potentially important issues. The Prince Corporation study mighttreat company image in areas of employment and ecology but omit the company management's civic lead-ership, its support of local education programs, its philanthropy, or its position on minority issues. Evenif the general issues are studied, the questions may not cover enough aspects of each area of concern. Al-though we might study the Prince Corporation's image as an employer in terms of salary and wage scales,promotion opportunities, and work stability, perhaps such topics as working conditions, company manage-ment relations with organized labor, and retirement and other benefit programs should also be included.
> The Characteristics of Good M4~asurementWhat are the characteristics of a good measurement tool? An intuitive answer to this question is thatthe tool should be an accurate counter or indicator of what we are interested in measuring. In addition,it should be easy and efficient to use. There are three major criteria for evaluating a measurement tool:validity, reliability, and practicality. I
• Validity is the extent to which a test measures what we actually wish to measure.
c Reliability has to do with the accuracy and precision of a measurement procedure.
o Practicality is concerned with a wide range of factors of economy, convenience,and interpretability. 12
In the following sections, we discuss the nature of these qualities and how researchers can achieve themin their measurement procedures.
Many forms of validity are mentioned in the research literature, and the number grows as we expandthe concern for more scientific measurement. This text features two major forms: external and inter-nal validity." The externaL vaLidity of research findings is the data's ability to be generalized acrosspersons, settings, and times; we discussed this in reference to experimentation in Chapter 9, and morewill be said in Chapter 14 on sampling." In this chapter, we discuss only internal validity. Internalvalidity is further limited in this discussion to the ability of a research instrument to measure what it ispurported to measure. Does the instrument really measure what its designer claims it does?
One widely accepted classification of validity consists of three major forms: (J) content validity,(2) criterion-related validity, and (3) construct validity (see Exhibit 11-5).15
.. .~-.
>chapter 11 Measurement
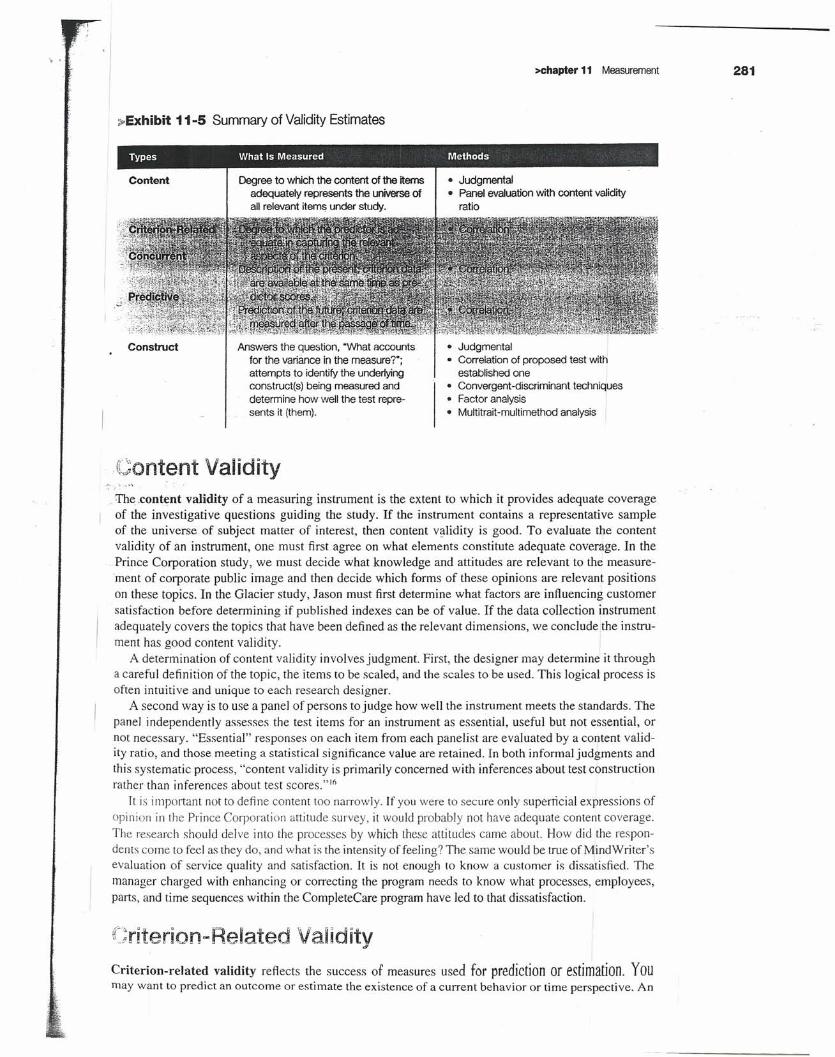
~Exhibit 11-5 Summary ofValidity Estimates
Types What Is Measured Methods
Content Degree to which the content of the itemsadequately represents the universe ofall relevant items under study.
• Judgmental• Panel evaluation with content validity
ratio
Construct Answers the question. ·What accountsfor the variance in the measure?";attempts to identify the underlyingconstruct(s) being measured anddetermine how well the test repre-sents it (them).
• Judgmental• Correlation of proposed test with
established one• Convergent-discriminant techniques• Factor analysis• Multitrait-multimethod analysis
Content ValidityThe .content validity of a measuring instrument is the extent to which it provides adequate coverageof the investigative questions guiding the study. If the instrument contains a representative sampleof the universe of subject matter of interest, then content validity is good. To evaluate the contentvalidity of an instrument, one must first agree on what elements constitute adequate coverage. In thePrince Corporation study, we must decide what knowledge and attitudes are relevant to the measure-ment of corporate public image and then decide which forms of these opinions are relevant positionson these topics. In the Glacier study, Jason must first determine what factors are influencing customersatisfaction before determining if published indexes can be of value, If the data collection instrumentadequately covers the topics that have been defined as the relevant dimensions, we conclude the instru-ment has good content validity.
A determination of content validity involves judgment. First, the designer may determine it througha careful definition of the topic, the items to be scaled, and the scales to be used. This logical process isoften intuitive and unique to each research designer.
A second way is to use a panel of persons to judge how welI the instrument meets the standards, Thepanel independently assesses the test items for an instrument as essential, useful but not essential, ornot necessary. "Essential" responses on each item from each panelist are evaluated by a content valid-ity ratio, and those meeting a statistical significance value are retained. In both informal judgments andthis systematic process, "content validity is primarily concerned with inferences about test constructionrather than inferences about test scores.':"
It is important not to define content too narrowly. If you were to secureonly superricial expressions ofopinion in the Prince Corporation attitude survey, it would probably not have adequate content coverage.The research should delve into the processes by which these attitudes came about. How did the respon-dents come to feel as they do, and what is the intensity of feeling? The same would be true of MindWriter'sevaluation of service quality and satisfaction, It is not enough to know a customer is dissatisfied. Themanager charged with enhancing or correcting the program needs to know what processes, employees,parts, and time sequences within the CompleteCare program have led to that dissatisfaction,
Criterion-Related ValidityCriterion-related validity reflects the success of measures used for prediction or estimation Youmay want to predict an outcome or estimate the existence of a current behavior or time perspective. An
281

,. 282 >part III The Sources andCollection of Data
attitude scale that correctly forecasts the outcome of a purchase decision has predictive validity. Anobservational method that correctly categorizes families by current income class has concurrent valid-ity. Although these examples appear to have simple and unambiguous validity criteria, there are dif-ficulties in estimating validity. Consider the problem of estimating family income. There is a knowabletrue income for every family, but we may find the figure difficult to secure. Thus, while the criterion isconceptually clear, it may be unavailable.
A researcher may want to develop a preemployment test that will predict sales success. There maybe several possible criteria, none of which individually tells the full story. Total sales per salespersonmay not adequately reflect territory market potential, competitive conditions, or the different profit-ability rates of various products. One might rely on the sales manager's overall evaluation, but howunbiased and accurate are such impressions? The researcher must ensure that the validity criterionused is itself "valid." Any criterion measure must be judged in terms of four qualities: (1) relevance,(2) freedom from bias, (3) reliability.iand (4) availability.'? ._
A criterion is relevant if it is defined-and scored in the terms we judge to be the proper me-asuresof salesperson success. If you believe sales success is adequately measured by dollar sales volumeachieved per year, then it is the relevant criterion. If you believe success shOUldinclude a high level ofpenetration of large accounts, then sales volume alone is not fully relevant.]In making this decision, youmust rely on your judgment in deciding what partial criteria are appropriate indicants of salespersonsuccess. I
Freedom from bias is attained when the criterion gives each salesperf.on an equal opportunity toscore well. The sales criterion would be biased if it did not show adjustments for differences in territorypotential and competitive conditions. I
A reliable criterion is stable or reproducible. An erratic criterion (using monthly sales, which arehighly variable from month to month) can hardly be considered a reliable standard by which to judgeperformance on a sales employment test. Finally, the information specified by the criterion must beavailable. Ifit is not available, how much will it cost and how difficult will it be to secure? The amountof money and effort that should be spent on development of a criterion depends on the importance ofthe problem for which the test is used. I
Once there are test and criterion scores, they must be compared in some way. The usual approachis to correlate them. For example, you might correlate test scores of 40 new salespeople with first-yearsales achievements adjusted to reflect differences in territorial selling conrtions.
I
Construct Validity I
In attempting to evaluate construct validity, we consider both the theory and the measuring instrumentbeing used. If we were interested in measuring the effect of trust in cross-functional teams, the way inwhich "trust" was operationally defined would have to correspond to an empirically grounded theory.If a known measure of trust was available, we might correlate the results obtained using this measurewith those derived from our new instrument. Such an approach would provide us with preliminary in-dications of convergent validity (the degree to which scores on one scale correlate with scores on otherscales designed to assess the same construct). If Jason were to develop a customer satisfaction index forGlacier and, when compared, the results revealed the same indications as b predeveloped, establishedindex, Jason's instrument would have convergent validity. Similarly, if -l- developed an instrumentto measure satisfaction with the CompleteCare program and the derived measure could be confirmedwith a standardized customer satisfaction measure, convergent validity W+ld exist.
Returning to our preceding example, another method of validating the trust construct would beto separate it from other constructs in the theory or related theories. To the extent that trust could beseparated from bonding, reciprocity, and empathy, we would have comI1leted the first steps towarddiscriminant validity (the degree to which scores on a scale do not correlate with scores from scalesdesigned to measure different constructs).
We discuss the three forms of validity separately, but they are interrelrted, both theoretically andoperationally. Predictive validity is important for a test designed to predic]; product success. In devel-oping such a test, you would probably first list the factors (constructs) that provide the basis for usefulprediction. For example, you would advance a theory about the variables in product success-an area
\ '>chapter 11 Measurement 283
;;.Exhibit 11-6 Understanding Validity and Reliability
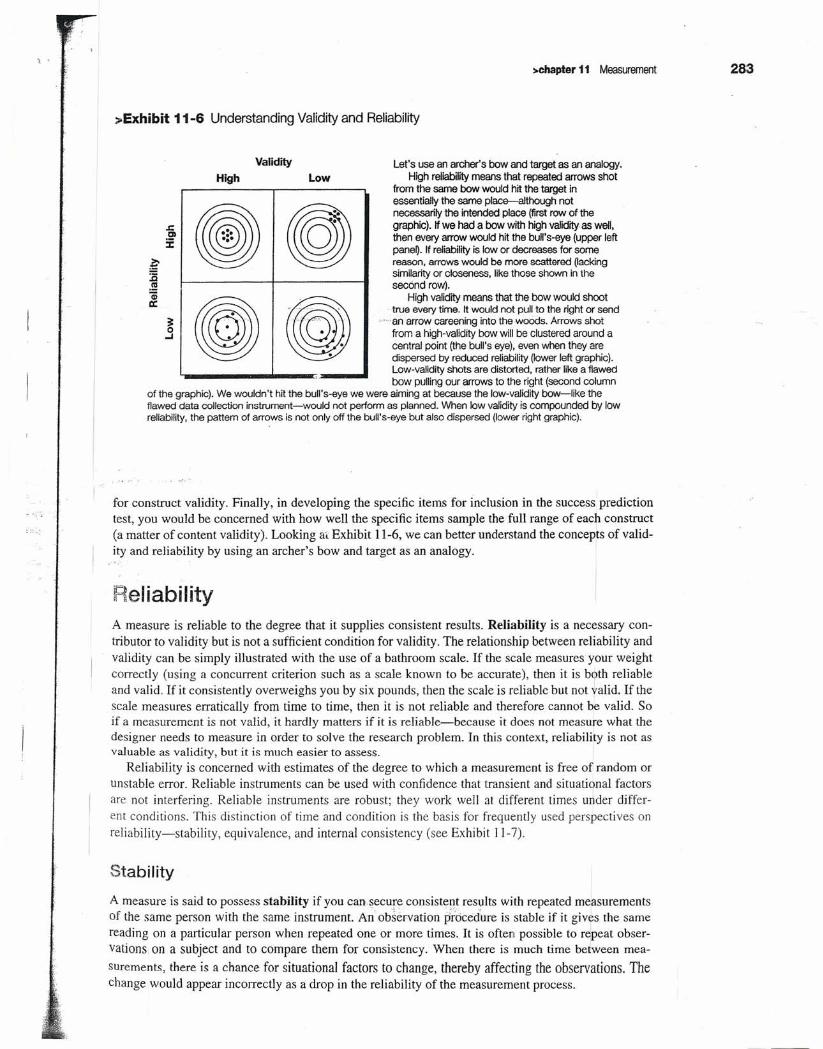
Validity Let's use an archer's bow and target as an analogy,High reliability means that repeated arrows shot
from the same bow would hit the target inessentially the same p1ace-although notnecessarily the intended place (first row of thegraphic). If we had a bow with high validity as well,then every arrow would hit the bull's-eye (upper leftpaneQ. If reliability is low or decreases for somereason, arrows would be more scattered (lackingsimilarity or closeness, like those shown in thesecond row).
High validity means that the bow would shoot" true every time. It would not pull to the right or send
..••an arrow careening into the woods. Arrows shotfrom a high-validity bow will be clustered around acentral point (the bull's eye), even when they aredispersed by reduced reliability Oower left graphic).Low-validity shots are distorted, rather like a flawedbow pulling our arrows to the right (second column
of the graphic), We wouldn't hit the bull's-eye we were aiming at because the low-validity bow-like theflawed data collection instrument-would not perform as planned. When low validity is compounded by lowreliability, the pattem of arrows is not only off the bull's-eye but also dispersed (lower right graphic).
High Low
for construct validity. Finally, in developing the specific items for inclusion in the success predictiontest, you would be concerned with how well the specific items sample the full range of each construct(a matter of content validity). Looking at Exhibit 11-6, we can better understand the concepts of valid-ity and reliability by using an archer's bow and target as an analogy.
ReliabilityA measure is reliable to the degree that it supplies consistent results. Reliability is a necessary con-tributor to validity but is not a sufficient condition for validity. The relationship between reliability andvalidity can be simply illustrated with the use of a bathroom scale. If the scale measures your weightcorrectly (using a concurrent criterion such as a scale known to be accurate), then it is both reliableand valid. If it consistently overweighs you by six pounds, then the scale is reliable but not valid. If thescale measures erratically from time to time, then it is not reliable and therefore cannot be valid. Soif a measurement is not valid, it hardly matters if it is reliable-because it does not measure what thedesigner needs to measure in order to solve the research problem. In this context, reliability is not asvaluable as validity, but it is much easier to assess. I
Reliability is concerned with estimates of the degree to which a measurement is free of random orunstable error. Reliable instruments can be used with confidence that transient and situational factorsare not interfering. Reliable instruments are robust; they work well at different times under differ-ent conditions. This distinction of time and condition is the basis for frequently used perspectives onreliability-stability, equivalence, and internal consistency (see Exhibit 11-7).
Stability
A measure is said to possess stability if you can secure consistent results with repeated measurementsof the same person with the same instrument. An"obServation p~6ced'ure is stable if it gives the samereading on a particular person when repeated one or more times. It is often possible to repeat obser-vations on a subject and to compare them for consistency. When there is much time between mea-surernents, there is a chance for situational factors to change, thereby affecting the observations. Thechange would appear incorrectly as a drop in the reliability of the measurement process.

, '. 284 >part III The Sources and Collectionof Data
>Exhibit 11-7 Summary of Reliability Estimates
Type Coefficient What Is Measured Methods
Test-Retest CorrelationStability Reliability of a test or instrument inferred fromexaminee scores; same test is administeredtwice to same subjects over an interval of lessthan six months.
Specialized correlational __formulas
-Split-Half, KR20; ---Cronbach's Alpha-'"
Intemal consistency Degree to which instrument items are homogeneousand reflect'the same underlying- constructts),
Stability measurement in survey situations is more difficult and less easily executed than in obser-vational studies. Although you can observe a certain action repeatedly, you usually can resurvey onlyonce. This leads to a test-retest arrangement-with comparisons between the two tests to learn howreliable they are. Some of the difficulties that can occur in the test-retest methodology and cause adownward bias in stability include:
• Time delay between measurements-leads to situationaLfactorchanges (also a problem in obser-vation studies). I _
o Insufficient time between measurements~permits the respondent to remember previous answersand repeat them, resulting in biased reliability indicators.
• Respondent's discernment of a study's disguised purpose-may introduce bias if the respondentholds opinions related to the purpose but not assessed with current measurement questions.
o Topic sensitivity-occurs when the respondent seeks to learn more about the topic or form newand different opinions before the retest.
A suggested remedy is to extend the interval between test and retest (from two weeks to a month).While this may help, the researcher must be alert to the chance that an outside factor will contaminatethe measurement and distort the stability score. Consequently, stability measurement through the test-retest approach has limited applications. More interest has centered on equivalence.
Equivalence
A second perspective on reliability considers how much error may be introduced by different inves-tigators (in observation) or different samples of items being studied (in questioning or scales). Thus,while stability is concerned with personal and situational fluctuations from one time to another,equivalence is concerned with variations at one point in time among observers and samples ofitems. A good way to test for the equivalence of measurements by different observers is to comparetheir scoring of the same event. An example of this is the scoring of Olympic figure skaters by apanel of judges.
In studies where a consensus among experts or observers is required, the similarity of the judges'perceptions is sometimes questioned. How does a panel of supervisors render a judgment on meritraises, a new product's packaging, or future business trends? Interrater reliability may be used in thesecases to correlate the observations or scores of the judges and render an index df how consistent theirratings are. In Olympic figure skating, a judge's relative positioning of skaters (determined by estab-lishing a rank order for each judge and comparing each judge's ordering for all skaters) is a means ofmeasuring equivalence. I
The major interest with equivalence is typically not how respondents differ from item to item buthow well a given set of items will categorize individuals. There may be many differences in response
" ,sehapter 11 Measurement
between two samples of items, but if a person is classified the same way by each test, then the testshave good equivalence.
One tests for item sample equivalence by using alternative or parallel forms of the same test ad-ministered to the same persons simultaneously. The results of the two tests are then correlated. Underthis condition, the length of the testing process is likely to affect the subjects' responses through fa-tigue, and the inferred reliability of the parallel form will be reduced accordingly. Some measurementtheorists recommend an interval between the two tests to compensate for this problem. This approach,called delayed equivalent forms, is a composite of test-retest and the equivalence method. As in test-retest, one would administer form X followed by form Y to half the examinees and form Y followed byform X to the other half to prevent "order-of-presentation" effects. 18
The researcher can include only a limited number of measurement questions in an instrument. Thislimitation implies that a sample of measurement questions from a content domain has been chosenarid another sample producing a similar number-will need to be drawn for the second instrument. It isfrequently difficult to create thIS second set.Yet it the pool is initially'large enough, the items may berandomly selected for each instrument. Even with more sophisticated procedures used by publishers ofstandardized tests, it is rare to find fully equivalent and interchangeable questions. 19
k~ternal Consistency
A third approach to reliability uses only one administration of an instrument or test to assess theinternal consistency or homogeneity among the items. The split-half technique can be used whenthe measuring tool has many similar questions or statements to which the participant can respond. Thet -instrument.is administered and the results are separated by item into even and odd numbers or into ran-domly selected halves. When the two halves are correlated, if the results of the correlation are high, theinstrument is said to have high reliability in an internal consistency sense. The high correlation tells usthere is similarity (or homogeneity) among the items. The potential for incorrect inferences about highinternal consistency exists when the test contains many items-which inflates the correlation index.'" The Spearrnan-Brown correction formula is used to adjust for the effect of test length and to esti-mate reliability of the whole test."
PracticalityI The scientific requirements of a project call for the measurement process to be reliable and valid, while, the operational requirements call for it to be practical. Practicality has been defined as economy, con-
venience, and interpretability." Although this definition refers to the development of educational andpsychological tests, it is meaningful for business measurements as well.
E;,:;onomyI
Some trade-off usually occurs between the ideal research project and the budget Data are not free, andinstrument length is one area where economic pressures dominate, More items give more reliability,but in the interest of limiting the interview or observation time (and therefore costs), we hold down thenumber of measurement questions. The choice of data collection method is also often dictated by eco-nomic factors. The rising cost of personal interviewing first led to an increased use of telephone surveysand subsequently to the current rise in Internet surveys. In standardized tests, the cost of test materialsalone can be such a significant expense that it encourages multiple reuse. Add to this the need for fastand economical scoring, and we see why computer scoring and scanning are attractive.
A measuring device passes the convenience test if it is easy to administer. A questionnaire or <i! measure-ment scale with a set of detailed but clear instructions, with examples, is easier to complete correctlythan one that lacks these features. In a well-prepared study, it is not uncommon for the interviewer
285

... 286 >part III The Sources and Collection of Data
sources: (a) the respondent or participant, (b) situational
factors, (c) the measurer, and (d) the instrument.
4 Sound measurement must meet the tests of validity, reli-ability, and practicality. Validity reveals the degree to which
an instrument measures what it is supposed to measure
to assist the researcher in solving the research problem.
Three forms of validity are used to evaluate measurement
scales. Content validity exists to the degree that a measure
provides an adequate reflection of the topic under study. Its
determination is primarily judgmental and intuitive. Criterion-
related validity relates to our ability to predict some outcome
or estimate the existence of some current condition. Con-
struct validity is the most complex and abstract. A measure
has construct validity to the degree that it conforms to
predicted correlations of other theoretical propositions.
A measure is reliable if it provides consistent results.
Reliability is a partial contributor to validity, but a measure-
ment tool may be reliable without being valid. Three forms of
reliability are stability, equivalence, and internal consistency.
A measure has practical value for the research if it is eco-nomical, convenient, and interpretable.
instructions to be several times longer than the interview questions. Naturally, the more complex theconcepts and constructs, the greater is the need for clear and complete instructions. We can also makethe instrument easier to administer by giving close attention to its design and layout. Although reliabil-ity and validity dominate our choices in design of scales here and later in Chapter 12, administrativedifficulty should play some role. A long completion time, complex instructions, participant's perceiveddifficulty with the survey, and their rated enjoyment of the process also influence design. Layout issuesinclude crowding of material, poor reproductions of illustrations, and the carryover of items from onepage to the next or the need to scroll the screen when taking a Web survey. Both design and layout is-sues make completion of the instrument more difficult.
Interpretability
This aspect of practicality is relevant when persons other than the test designers must interpret ther~sults. It isusually, but not exclusively, an issue with 'standardized tests. In such cases, the designerof the data collection instrument provides several key pieces of information to make interpretationpossible:
• A statement of the functions the test was designed to measure and the procedures by which itwas developed.
• Detailed instructions for administration.
• Scoring keys and instructions.& Norms for appropriate reference groups.
• Evidence about reliability.
• Evidence regarding the intercorrelations of subscores.• Evidence regarding the relationship of the test to other measures.
• Guides for test use.
e-summary
Although people measure things casually in daily life, re-
search measurement is more precise and controlled. Inmeasurement, one settles for measuring properties of the
objects rather than the objects themselves. An event is
measured in terms of its duration. What happened during
it, who was involved, where it occurred, and so forth, are all
properties of the event. To be more precise, what are mea-sured are indicants of the properties. Thus, for duration, one
measures the number of hours and minutes recorded. For
what happened, one uses some system to classify types of
activities that occurred. Measurement typically uses some
sort of scale to classify or quantify the data collected.
2 There are four scale types. In increasing order of power, theyare nominal, ordinal, interval, and ratio. Nominal scales classify
without indicating order, distance, or unique origin. Ordinal
data show magnitude relationships of more than and less than
but have no distance or unique origin. Interval scales have
both order and distance but no unique origin. Ratio scales
possess classltlcation, order, distance, and unique origin.
3 Instruments may yield incorrect readings of an indicant formany reasons. These may be classified according to error
, .>chapter 11 Measurement 287
" interval scale 277 properties 272 validity 280
mapping rules 270 ratio scale 277 construct 282
measurement 270 reliability 283 content 281
nominal scale 274 equivalence 284 criterion-related 281
objects 272 internal consistency 285 internal 280
ordinal scale 276 stability 283
practicality 285
Terms in ReviewWhat can we measure about the four objects listed below?Be as specific as possible,
a Laundry detergent
b Employees
c Factory output
d Job satisfaction
2 What are the essential differences among nominal, ordinal,interval, and ratio scales? How do these differences affectthe statistical analysis techniques we can use?
3 What are the four major sources of measurement error?Illustrate by example how each of these might affect mea-surement results in a face-to-face interview situation.
4 Do you agree or disagree with the following statements?Explain.
a Validity is more critical to measurement than reliability.
b Content validity is the most difficult type of validity todetermine.
c A valid measurement is reliable, but a reliable measure-ment may not be valid.
d Stability and equivalence are essentially the same thing.
Making Research Decisions5 You have data from a corporation on the annual salary'of
each of its 200 employees.
a Illustrate how the data can be presented as ratio, inter,val, ordinal, and nominal data.
b Describe the successive loss of information as the pre-sentation changes from ratio to nominal.
6 Below are listed some objects of varying degrees of ab-straction. Suggest properties of each of these objects thatcan be measured by each of the four basic types of scales.
a Store customers.
b Voter altitudes.
c Hardness of steel alloys.
d Preference for a particular common stock.
e Profitability of various divisions in a company.
7 You have been asked by the head of marketing to designan instrument by which your private, for-profit schoolcan evaluate the quality and value of its various curriculaand courses. How might you try to ensure that yourinstrument has:
a Stability?
b Equivalence?
c Internal consistency?
d Content vaiidity?
e Predictive validity?
Construct validity?
8 A new hire at Mobil Oil, you are asked to assume themanagement of the Mobi! Restaurant Guide. Each restaurantstriving to be included in the guide needs to be evaluated.Only a select few restaurants may earn the five-star status.What dimensions would you choose to measure to applythe one to five stars in the Mobi! Restaurant Guide?
9 You have been asked to develop an index of student mo-rale in your ciepartment.
a What constructs or concepts might you employ?
b Choose several of the major concepts, anci specify theirdimensions.
c Select observable indicators that you might use to mea-sure these dimensions.
d How would you compile these various dimensions into asingle index?
e How would you judge the reliability and/or validity ofthese measurements?
288 >part III TheSourcesandCollectionof Data
Bringing Research to Life10 Given that Glacier Symphony has previously measured its
customer satisfaction by survey, how might Jason assessthe internal validity of the Glacier questionnaire?
From Concept to Practice11 Using Exhibit 11-3 and one of the case questionnaires on
your text CD, match each question to its appropriate scaletype. For each scale type not represented, develop a mea-surement question that would be of that scale type.
Campbell-Ewald: R-E-S-P-E-C- TSpells Loyalty
It Data Development
• Donatos: Finding the New Pizza
NCRCC: Teeing Up and NewStrategic Direction
From the Headlines12 Aspart of its bankruptcy restructuring, on June 3,2009,
General Motors (GM)launched an ad campaign that revealedglimmers of a streamlined GM: fewer brands (Cadillac, Buick,Chevrolet, GMC) and fewer models within each brand.
a What researchwould you have done to determine whichvehicle models GM should retain and which it should drop?
b What would you have measured and with what type ofmeasurement scale?
• Ohio Lottery: Innovative ResearchDesign Drives Winning
G Pebble Beach Co.
Ramada Demonstrates Its Personal8est™
It USTA: Come Out Swinging
NetConversions Influences Kelley Yahoo!: Consumer Direct MarriesBlue Book . Purchase Metrics to Banner Ads
I'You will find a description of each cash in the Case Abstracts section of the textbook. Check the Case Index todetermine whether a case provides data, the research instrument, video, or other supplementary material. Written casesare downloadable from the text website (www.mhhe.com/cooper11e). All video material and video cases are avail-able from the Online Learning Center. The film reel icon indicates a video case or video material relevant to the case.


