10 CHAPTER 2 GLYCOLYSIS OF POLYETHYLENE TEREPHTHALATE (PET) Contents 2.1 INTRODUCTION 2.2 EXPERIMENTAL 2.2.1 Materials and reagents 2.2.2 Glycolysis conversion of recycled PET flakes 2.2.3 Polyester polyol from recycled PET flakes 2.2.4 Procedure and Characterisation 2.2.4.1 Determination of Hydroxyl Value (OHv) 2.2.4.2 Determination of molecular weight 2.2.4.3 Determination of moisture content 2.2.4.4 Determination of acid value 2.2.4.5 FTIR and 1 H NMR spectroscopy 2.2.4.6 Thermogravimetric analysis (TGA) 2.3 RESULTS AND DISCUSSION 2.3.1 Glycolysis of PET flakes 2.3.1.1 Influence of equivalent weight ratio 2.3.1.2 Influence of glycolysis temperature 2.3.1.3 Influence of glycolysis time 2.3.2 Characteristics of glycolysed PET 2.4 CONCLUSION 2.5 REFERENCES
Transcript
10
CHAPTER 2
GLYCOLYSIS OF POLYETHYLENE TEREPHTHALATE (PET)
Contents
2.1 INTRODUCTION
2.2 EXPERIMENTAL
2.2.1 Materials and reagents
2.2.2 Glycolysis conversion of recycled PET flakes
2.2.3 Polyester polyol from recycled PET flakes
2.2.4 Procedure and Characterisation
2.2.4.1 Determination of Hydroxyl Value (OHv)
2.2.4.2 Determination of molecular weight
2.2.4.3 Determination of moisture content
2.2.4.4 Determination of acid value
2.2.4.5 FTIR and 1H NMR spectroscopy
2.2.4.6 Thermogravimetric analysis (TGA)
2.3 RESULTS AND DISCUSSION
2.3.1 Glycolysis of PET flakes
2.3.1.1 Influence of equivalent weight ratio
2.3.1.2 Influence of glycolysis temperature
2.3.1.3 Influence of glycolysis time
2.3.2 Characteristics of glycolysed PET
2.4 CONCLUSION
2.5 REFERENCES
11
2.1 INTRODUCTION
Glycolysis of PET wastes from soft drink PET bottles in excess diol has been
studied for many years and most frequently using ethylene glycol [1-3], diethylene
glycol [4, 5], triethylene glycol [6] and propylene glycol [7, 8]. The process is
conducted in a wide range of temperatures from (180-250) °C [1-8] and various reaction
times from 0.5 to 8 hours. Generally, catalyst of 0.5% based on weight of PET is added
and the most frequently used is zinc acetate [2, 6, 7]. Utilization of the product obtained
has been the main target for most of the research study. For example, PET glycolysates
find applications in the manufacture of polyurethane foams [9] and unsaturated
polyester resins [7, 10].
In this work, PET has been glycolysed in excess of triol. As previous study, the
most preferred catalyst, zinc acetate, is used and the reaction was done under specific
reaction conditions. Common soft-drink PET bottles were glycolysed by glycerol in the
presence of zinc acetate as a catalyst. Three sets of experiments were designed to study
the influences of glycolysis temperature, time, and ratio of PET to glycerol on the
glycolysis conversion of recycled PET flakes. The optimum conditions determined and
were used as a guide to design a series of glycolysed PET with different hydroxyl value
and other characteristics of glycolysed PET. The glycolysed PET in the form of
polyester polyol, was then characterised.
12
2.2 EXPERIMENTAL
2.2.1 Materials and reagents
The poly(ethylene terephthalate) (PET) used in the glycolysis process was from
soft drink clear PET bottles. These bottles were cleaned and washed with detergent,
dried at room temperature before shredded into flakes by a rapid granulator. The size of
PET flakes is about 0.6 x 0.6 cm. PET flakes, as shown in appendix Figure A2-1 were
then dried in an oven at 150 °C for 3 hours and kept in the desiccators prior to use in the
glycolysis process.
Technical grade of glycerol (R&M Chemicals) was used as degrading agent. Zinc
acetate (R&M Chemicals), pyridine (MERCK), ethanol, toluene and phthalate
anhydride used were of analytical grade supplied by Systerm Chemicals and use as-
received.
2.2.2 Glycolysis conversion of recycled PET flakes
Glycolysis reaction was carried out in a 500 ml round bottom flask as reactor,
which was equipped with a thermometer, mechanical stirrer and reflux condenser.
While heating mantle with variable power control was used for heating. Appendix
Figure A2-2 shows the reaction set-up.
To study the influences of glycolysis temperature, time, and ratio of PET to
glycerol, on the glycolysis conversion of recycled PET flakes, 3 sets of experiment were
designed. In the first set, glycolysis temperature was set at 210 ˚C in 2 hours, and the
equivalent weight ratio of PET:Glycerol was varied from 1:3 to 1:12 as shown in Table
2.1. Zinc acetate, 0.5% w/w based on weight of PET, was added as transesterification
catalyst.
13
Table 2.1 Ratio variation of glycolysis conversion
Glycolysed PET Equivalent weight ratio of PET: Glycerol
C-0 1:3
C-3 1:6
C-4 1:8
C-5 1:10
C-6 1:12
After the specified reaction time, flask reactor was removed from the heating mantle
and hot water was slowly added into the reactor followed by vigorously agitation. Then
the whole product was quickly filtered using the strainer with a 1.0 x 1.0 mm pore size.
Those PET flakes which were not degraded were collected, dried and weighed.
The conversion for the glycolysis of the recycled PET flakes was determined as;
% Conversion = [(PETinitial – UF)/ PETinitial] x 100
Where PETinitial refers to weight of PET flakes before reaction and UF represents the
weight of unreacted flakes.
The above experimental procedure was repeated for the second and third set of
experiment excluding the temperature and reaction time. In the second set, the
glycolysis time of 2.0 hours and 1:6 ratio of PET:Glycerol were fixed while glycolysis
temperature were varied from 150 ˚C to 210 ˚C at 20 ˚C intervals, i.e. (150, 170, 190,
210) ˚C. Same as in the first set, zinc acetate, 0.5% w/w based on weight of PET was
added as transesterification catalyst.
14
Glycolysis in the third set was carried out at 210 ˚C and the ratio of
PET:Glycerol was 1:6, whereas manipulated variable which is the glycolysis time was
varied from 0.5 to 4 hours. (0.5, 1.0, 2.0, 3.0, 4.0 hours). Zinc acetate catalyst (0.5%
w/w based on weight of PET) was added. The influences of glycolysis ratio of PET to
glycerol, temperature and reaction time on the conversion of recycled PET flakes were
discussed in section 2.3.
2.2.3 Polyester polyol from recycled PET flakes
Basically, the experimental arrangement and procedures to prepare polyester
polyol from recycled PET flakes were almost similar to glycolysis process which had
been described in the previous section. The main difference was that after the reaction
time and temperature were maintained in the required range, glycolysed product was
then left to cool to room temperature before collected for further analysis. Glycolysis
reactions were also carried out in longer period with a minimum of 6 hours to ensure all
PET flakes were glycolysed completely since the amount of PET flakes used was larger.
All of the glycolysed PET (GP) was analysed for hydroxyl value, acid number, moisture
content and other test as discussed further in the next section. Table 2.2 summarised the
variation of reaction parameters in this experiment.
15
Table 2.2 Variation in parameters used in the PET glycolysis
Parameter PET:Glycerol Time (h) Temp. (˚C) Product Code
Ratio
1:3 6 200 GP-0
1:4 6 200 GP-1B
1:5 6 200 GP-2A
1:6 6 200 GP-3B.r
Time
1:6 6 200 GP-3B.i
1:6 9 200 GP-6
1:6 12 200 GP-7
Temperature
1:6 6 180 GP-4
1:6 6 200 GP-3B
1:6 6 220 GP-5
PET is a large molecule with only two terminals. One side is hydroxyl group and the
other side is carboxylic group. Thus it does not contribute to hydroxyl value of the
glycolysed PET. However, when certain amount of glycerol is add in, the glycerol will
be the one who is responsible for introducing the hydroxyl group. Example calculation
in the preparation of glycolysed PET is shown in appendix Table Ap2-1.
Expected hydroxyl value, OHv from the calculation is then used as a guide in the
determination of hydroxyl value by titration method.
16
2.2.4 Procedure and Characterisation
2.2.4.1 Determination of Hydroxyl Value (OHv)
The hydroxyl value (OHv) of a polyol, sometimes called the hydroxyl number,
is defined as the number of milligrams of potassium hydroxide equivalent to the
hydroxyl content of one gram of the sample. The hydroxyl value is determined via
esterification of the hydroxyl groups with an excess of anhydride pyridine mixture.
After conversion the surplus anhydride is titrated with aqueous sodium hydroxide. In
this study, hydroxyl value determination is based on ASTM D4274-94 (Standard Test
Method for Testing Polyurethanes Raw Materials: Determination of Hydroxyl Numbers
of Polyols) as a correction to the theoretical calculated OHv.
The procedure is described further in appendix-Chapter2_2.2.4.
2.2.4.2 Determination of molecular weight
The average molecular weights of glycolysed PET products were determined by
gel permeation chromatography, GPC (Waters model). Samples were dissolved in THF
at a constant concentration of 0.2 wt% and all GPC scans were carried out up to 55
minutes.
2.2.4.3 Determination of moisture content
This determination is based on a titration in accordance with the Karl Fischer
method which corresponds to the reaction equation:
Equation: SO2 + I2 + 2H2O 2HI + H2SO4
Sulphur dioxide is oxidised to sulphuric by iodine acid in the presence of water. The
bases added have an effect that the balance of the reaction is shifted to the right hand
side. The titration end point is potentiometrically determined.
17
Water content of the sample was determined by Karl Fisher titrator, DL 31, with
electrode DM 143-SC from Mettler Toledo as shown in appendix Figure A2-3. Weight
of sample used was in range of 0.4 to 1.4 g and was ensured to be homogenized before
the test.
2.2.4.4 Determination of acid value
Acid value (Av) of glycolysed PET, sometimes called the acid number, was
determined based on Standard Test Methods for Polyurethane Raw Materials:
Determination of Acid and Alkalinity Numbers of Polyols (ASTM D 4662-93). Acid
number is the mass of potassium hydroxide (KOH) in milligrams that is required to
neutralize one gram of glycolysed products. The purpose of this test was to estimate the
degree of conversion of PET. All the reagents and chemicals used were of analytical
grades and details procedures are described further in appendix.
2.2.4.5 FTIR and 1H NMR spectroscopy
FTIR analysis was performed on the flake of PET bottle and its glycolysed
product. The IR spectrum of glycolysed product was analyzed from a thin film of
sample on a sodium chloride cell using a Perkin-Elmer FTIR Spectrum RX-1. Samples
were scanned at wave numbers from 4000 - 400 cm-1 at a resolution of 4 cm-1.
For polyurethane foam, IR analysis was done with Spotlight 400 Perkin Elmer
Spectrometer, from 4000 - 400 cm-1 at resolution of 4 cm-1 and 15 scanning numbers
using attenuated total reflectance (ATR) method.
1H NMR was obtained using DMSO as solvent for the identification of chemical
structures of the glycolysed PET products.
18
2.2.4.6 Thermogravimetric analysis (TGA)
Thermogravimetric measurement was carried out on Perkin Elmer 4000, as
shown in appendix Figure A2-4. Thermogram obtained was used to analyse the
composition of multi –component in glycolysed product as well as the thermal
decomposition behavior of the glycolysed product and polyurethane foam.
About 5-10 mg of sample was placed into the crucible cup that was positioned in
the furnace of the equipment. The test was carried out in the temperature range of 50 °C
to 900 °C at heating rate of 20 °C/min and under the purge nitrogen gas flow of 20
mL/min.
19
2.3 RESULTS AND DISCUSSION
2.3.1 Glycolysis of PET flakes
The conversion of the glycolysis is shown to be influenced by equivalent weight
ratio of PET to glycerol, the duration of glycolysis as well as the reaction temperature.
2.3.1.1 Influence of equivalent weight ratio
In this series of experiment, amount of PET flakes was fixed while amount of
glycerol used was varied based on their equivalent weights as in table below:
Table 2.3 Influence of equivalent weight ratio of PET:Gly on conversion of recycled PET flakes at 210 °C and glycolysis of 2 hours.
PET:Gly Glycolysis conversion (%)
1:3 98
1:6 99
1:8 95
1:10 99
1:12 93
The glycolysis temperature was set at 210 ˚C and glycolysis time was set at 2 hours.
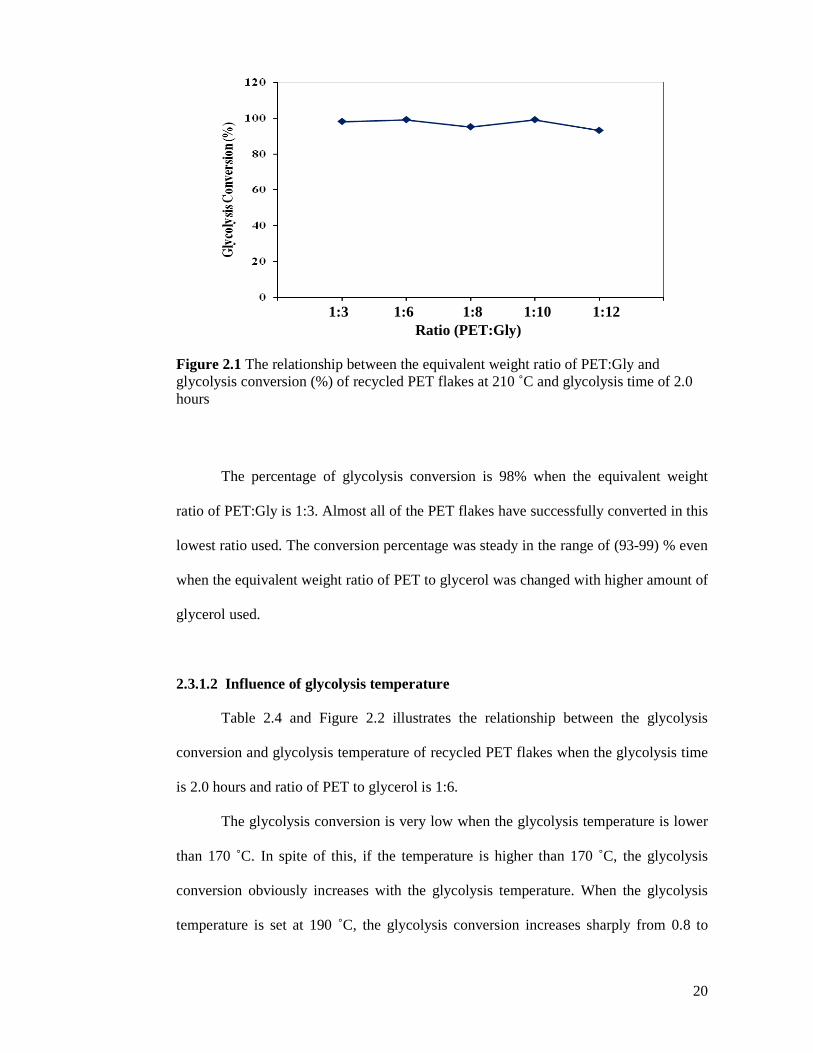
Figure 2.1 displays the relationship between the equivalent weight ratio of PET:Gly and
conversion of recycled PET flakes.
20
Ratio (PET:Gly)
Figure 2.1 The relationship between the equivalent weight ratio of PET:Gly and glycolysis conversion (%) of recycled PET flakes at 210 ˚C and glycolysis time of 2.0 hours
The percentage of glycolysis conversion is 98% when the equivalent weight
ratio of PET:Gly is 1:3. Almost all of the PET flakes have successfully converted in this
lowest ratio used. The conversion percentage was steady in the range of (93-99) % even
when the equivalent weight ratio of PET to glycerol was changed with higher amount of
glycerol used.
2.3.1.2 Influence of glycolysis temperature
Table 2.4 and Figure 2.2 illustrates the relationship between the glycolysis
conversion and glycolysis temperature of recycled PET flakes when the glycolysis time
is 2.0 hours and ratio of PET to glycerol is 1:6.
The glycolysis conversion is very low when the glycolysis temperature is lower
than 170 ˚C. In spite of this, if the temperature is higher than 170 ˚C, the glycolysis
conversion obviously increases with the glycolysis temperature. When the glycolysis
temperature is set at 190 ˚C, the glycolysis conversion increases sharply from 0.8 to
1:3 1:6 1:8 1:10 1:12
21
95% and become steady at 99% conversion when the temperature is set at 200 ˚C and
up to
210 ˚C. Hence the glycolysis temperature is a very critical factor for glycolysis
conversion.
Table 2.4 Influence of glycolysis temperature on conversion of recycled PET flakes
Glycolysis Temp.
(˚C)
Glycolysis
conversion (%)
1/T ln k
150 0.3 0.0067 -1.2040
170 0.8 0.0059 -0.2231
190 95 0.0053 4.5539
200 99 0.0050 4.5951
210 99 0.0048 4.5951
220 99 0.0045 4.5951
Figure 2.2 The relationship between the glycolysis temperature and glycolysis conversion of recycled PET flakes with a glycolysis time of 2.0 hours and 1:6 ratio of PET:Gly
22
Chemical intuitions suggest that the higher the temperature, the faster a chemical
reaction will proceed. Quantitatively this relationship between the rate of reaction
proceeds and its temperature is determined by the Arrhenius Equation. Theoretically at
higher temperatures, higher collision rate will result in a higher kinetic energy, which
has an effect on the activation energy of the reaction. The activation energy, Ea based
on the empirical expression, k = A-Ea/RT, can be determined from the slope of a graph of
ln k versus 1/T. (Value of ln k and 1/T are as shown in Table 2.4).
Figure 2.3 ln k versus 1/T
From the graph in Figure 2.3, the Ea is 32.4 kJ/mol. [-Ea = -3902 (8.314 x 10⁻³
kJ/mol/K)] Sample calculation is shown in appendix Figure A2-6.
Several studies on the kinetic of glycolysis of PET under various conditions have been
reported. Chen and friends (2012) carried out glycolysis with excess ethylene glycol in
the presence of zinc acetate under microwave irradiation and reported that the activation
energy as evaluated using the Arrhenius equation was found to be 36.5 kJ/mol [11]. An
23
even lower values of activation energy of 26.3 kJ/mol and 24.2 kJ/mol have been
reported by Mishra S. (2003) [12] and Goje,A.(2004) [13] respectively. The former
value was obtained from alkaline depolymerisation of waste PET while the latter from
hydrolysis of PET waste with nonaqueous potassium hydroxide solution.
2.3.1.3 Influence of glycolysis time
The relationship between glycolysis time and the conversion of recycled PET
flakes is presented in Table 2.5 and Figure 2.4. The glycolysis temperature was set at
210 ˚C and the ratio of PET to glycerol was 1:6. As shown in Figure 2.4, generally the
glycolysis conversion increases with the time of glycolysis and reaches a steady
conversion when the time is longer than 2.0 h.
Table 2.5 Influence of glycolysis time on conversion of recycled PET flakes
Glycolysis time (hour) Glycolysis conversion (%)
0.5 0.9
1 92
2 99
3 99
4 99
24
Figure 2.4 The relationship between the glycolysis time and glycolysis conversion of recycled PET flakes with a glycolysis temperature at 210 ˚C and ratio of PET:Gly of 1:6
The conversion is very low and almost zero percent for the initial half hour of glycolysis
before increases drastically within 0.5 to 1.0 h and slowly increases during the next 1.0
to 2.0 hours before reaching 99% after 2.0 h or longer.
2.3.2 Characteristics of glycolysed PET
Based on the optimum glycolysis condition of recycled PET flakes, a series of
glycolysed products have been produced. Glycolysed PET obtained is a brownish thin
liquid at temperature above 60 °C as shown in appendix Figure A2-5. However it
became viscous liquid when it was cooled to room temperature at 25 °C. Other
characteristics (hydroxyl value (OHv), acid value (Av), water content and molecular
weight, Mw of glycolysed PET) were also studied. Following the same procedure as in
section 2.2.2, PET flakes and glycerol were charged into the reactor. Zinc acetate, 0.5%
w/w based on weight of PET was added as transesterification catalyst. Due to high ratio
of solids to liquid in the flask, the stirrer was not turned on until the PET flakes start
25
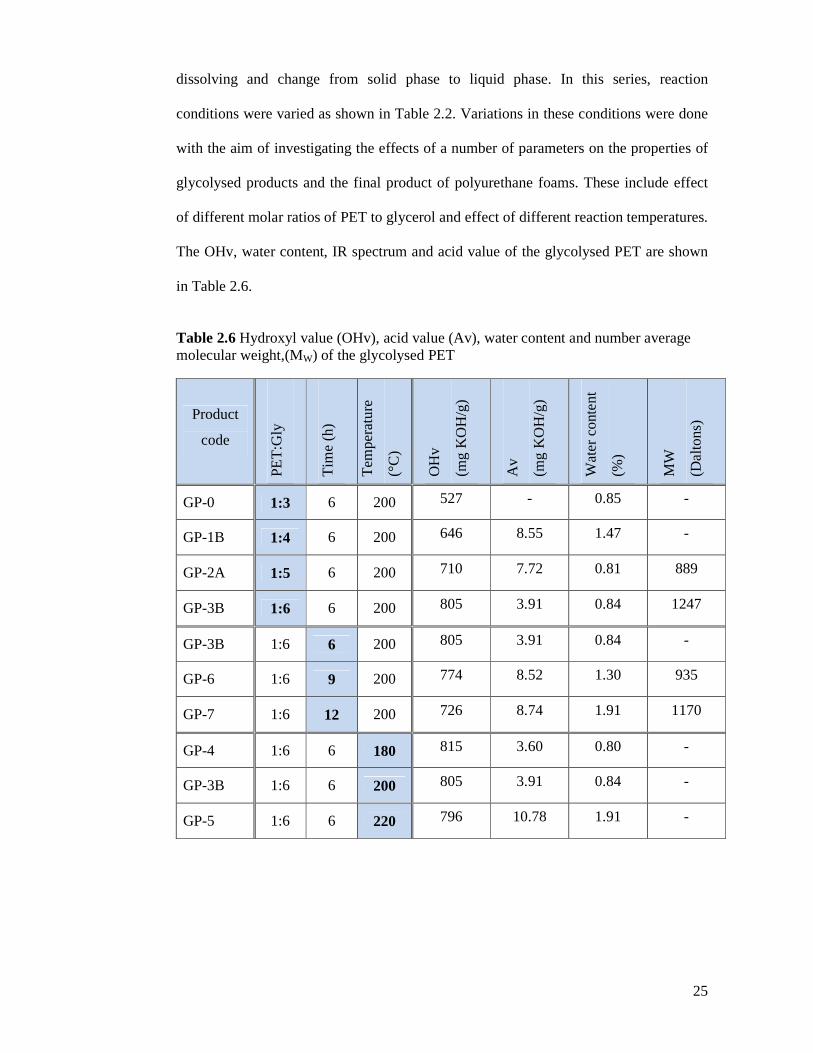
dissolving and change from solid phase to liquid phase. In this series, reaction
conditions were varied as shown in Table 2.2. Variations in these conditions were done
with the aim of investigating the effects of a number of parameters on the properties of
glycolysed products and the final product of polyurethane foams. These include effect
of different molar ratios of PET to glycerol and effect of different reaction temperatures.
The OHv, water content, IR spectrum and acid value of the glycolysed PET are shown
in Table 2.6.
Table 2.6 Hydroxyl value (OHv), acid value (Av), water content and number average molecular weight,(MW) of the glycolysed PET
Product
code
PE
T:G
ly
Tim
e (h
)
Te
mpe
ratu
re
(°C
)
OH
v
(mg
KO
H/g
)
Av
(mg
KO
H/g
)
Wa
ter
cont
ent
(%)
MW
(Da
ltons
)
GP-0 1:3 6 200 527 - 0.85 -
GP-1B 1:4 6 200 646 8.55 1.47 -
GP-2A 1:5 6 200 710 7.72 0.81 889
GP-3B 1:6 6 200 805 3.91 0.84 1247
GP-3B 1:6 6 200 805 3.91 0.84 -
GP-6 1:6 9 200 774 8.52 1.30 935
GP-7 1:6 12 200 726 8.74 1.91 1170
GP-4 1:6 6 180 815 3.60 0.80 -
GP-3B 1:6 6 200 805 3.91 0.84 -
GP-5 1:6 6 220 796 10.78 1.91 -
26
It is found that glycolysed products have low acid value (Av) in the range of 3.0 – 10
mg KOH/g, although the glycolysis of PET should yield oligomers with hydroxyl end
groups. This low acid value indicates that insignificant hydrolysis may be occurring
during glycolysis reaction [6] due to the presence of water as impurity or formed by side
reactions.
The results indicate that the OHv of the olygomeric triols increases with the
amount of glycerol used in the glycolysis. This shows that the extent of
depolymerization increases with the amount of glycerol. This is in agreement to the
previous reported study on glycolysis of PET using ethylene glycol. The hydroxyl
values are comparable to that of bis(hydroxyethyl) terephthalate implying that the extent
of depolymerization is quite significant. However OHv decreases with increasing
reaction time. This may probably be due to the conversion of hydroxyl group to water
since the moisture content increases with time. All the glycolysed products have water
content of 2.0 % and below as shown in Table 2.6. Average molecular weights, Mw, of
the selected glycolysed products as determined from GPC are in the range of 889 to
1247.
FTIR and H1 NMR spectrum
IR spectrum of PET film is expected to show strong features with ester
functionality (1718, 1252, and a doublet at 1126 and 1099 cm-1) and aromatic ring
(3054, 1615, 1578, 1505, 1021 and 728 cm-1). Bands assigned to the “ethylene” CH2
group of –O-(CH2CH2)-O- moiety are also observed at 1134 and 848 cm-1 [14]. This is
comparable to the PET flakes taken from soft-drink PET bottles from this research
materials where absorptions at 1714, 1242, and 1096 cm-1 were observed as well as
1505 and 723 cm-1 for aromatic ring.
27
Previous study on glycolysis of PET bottles had also reported that the IR
spectra for glycolysed product have absorptions at 3000-3500, 2850-3000, 1720, 1503
and 1100 cm-1 attributed to -OH, -CH2, C=O, aromatic group and C-O stretching
respectively [15]. This is close to the IR spectrum of the glycolysed product obtained as
shown in Figure 2.5 (B) where the presence of absorptions at 3352 cm-1 is for –OH,
2882-2948 cm-1 for –CH2, 1711 cm-1 for the carbonyl group (C=O), 1505 cm-1
represents the aromatic group and 1102 cm-1 for C-O stretching .
4000.0 3000 2000 1500 1000 600.0cm-1
%T
Figure 2.5 FTIR spectra for PET flakes before (A) and after (B) glycolysis
A : PET flakes
B : Glycolysed PET
3352 OH
2948 CH2
1711C=O
1505 Aromatic group
1102 C-O
1714 1242 1096
723
1505
28
Although the absorption bands in spectrum B are almost similar to those in
spectrum A, there is an obvious band between 3000 and 3500 cm-1 in spectrum B
compared to spectrum A. This may result from strong hydrogen bonding in the
glycolysed product. The broad band is observed in all the glycolysed products which is
not obtained in PET spectrum. Another absorption band is observed in the range of
1000-1200 cm-1 due to C-O of C-OH group stretching but it may overlap with the
terephthalate group which also has the same absorption range.
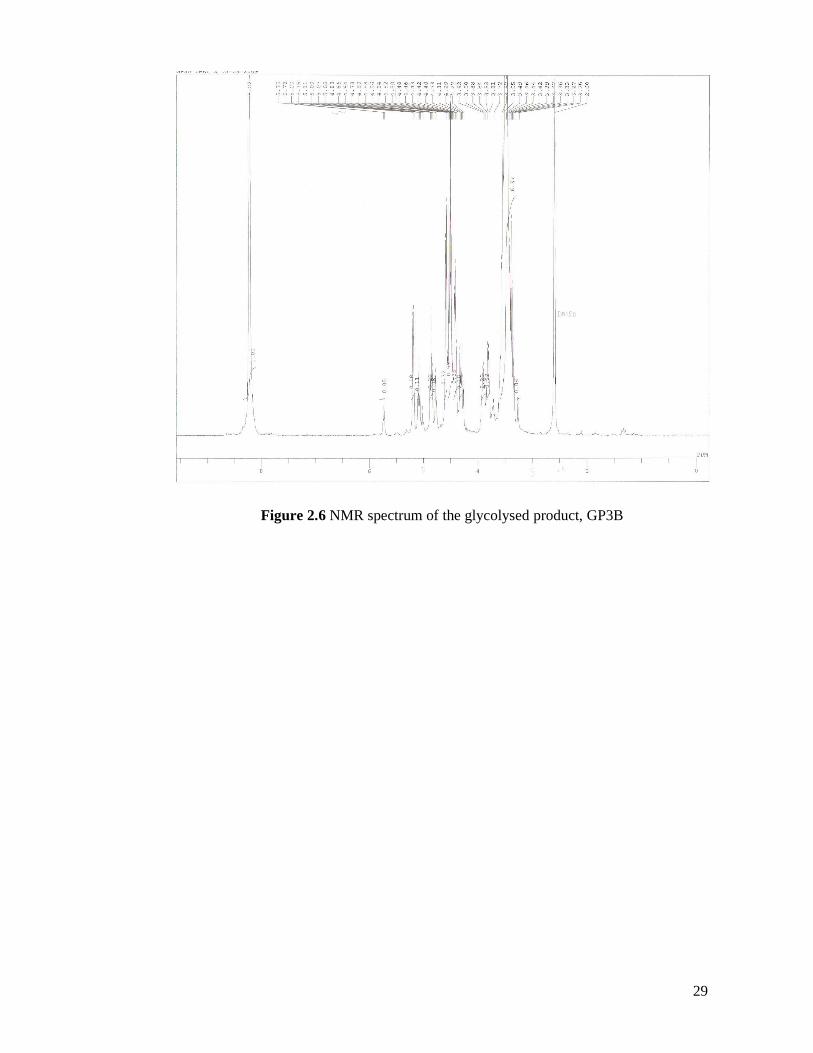
Figure 2.6 shows a 1H NMR spectrum of a typical glycolysed PET (GP3B).
29
Figure 2.6 NMR spectrum of the glycolysed product, GP3B
30
The peak at 8.22 ppm can be assigned to benzene ring (P) as shown in Figure 2.7.
Multiplets at 4.4 ppm and 4.6 ppm are characteristic of the secondary (Q) and primary
OH (R) groups. The other signals at 3.5-3.9 ppm correspond to protons of S, T and U.
Based on the IR and 1H NMR spectra, there is strong evidence that glycolysed product
has a chemical structure as shown in Figure 2.7(a) though the glycolysed product
actually mainly consists of oligomers.
C C
OCH2CH2HO OH
OH
+
HOCH2CHCH2OC
OH
O
O
O
O
COCH2CH2OH
O
GlycerolPET
+ higher oligomers+ remaining glycerol
(a)
Figure 2.7 Possible structure for the glycolysed product obtained in the glycolysis reaction of PET and glycerol
P U T
Q
R U S
31
Thermogravimetric analysis
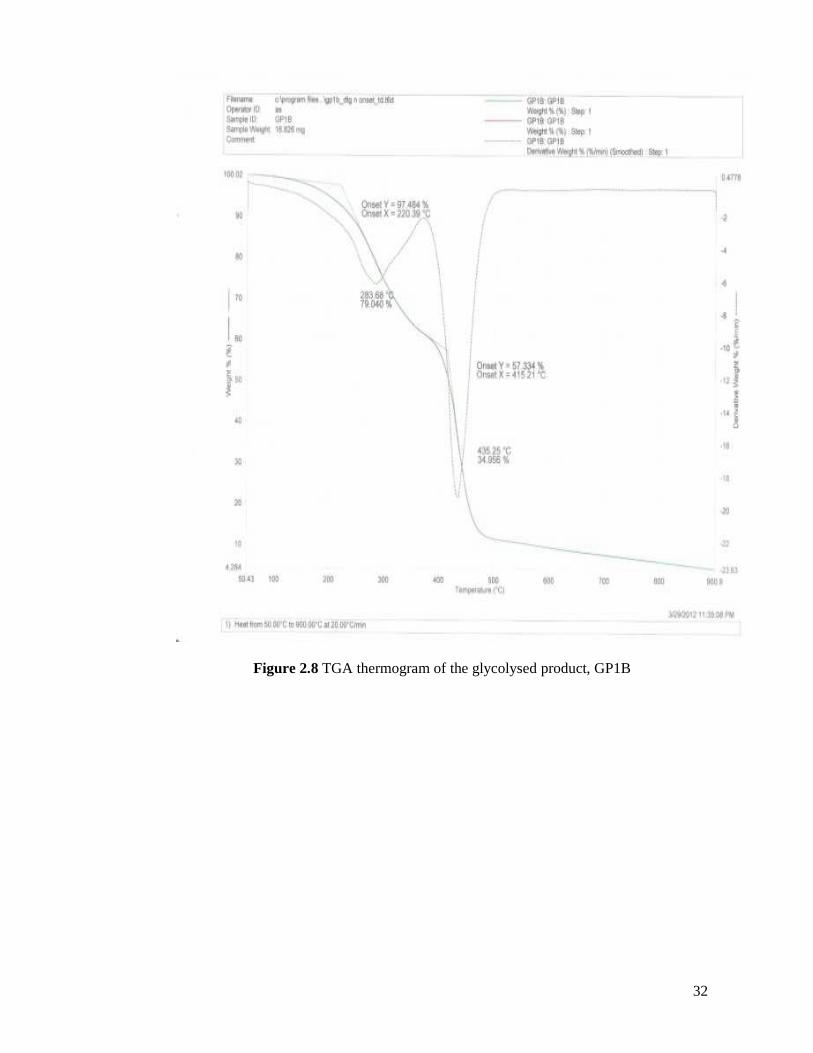
Figure 2.8 in next page shows the thermogram of the glycolysed product. A
clear two-step degradation process under nitrogen atmosphere is observed. The first step
illustrates that the glycolysed product undergoes thermal degradation at 220 °C. The
weight loss decomposes slowly with a total mass loss of 38 %. Meanwhile the second
step degradation process demonstrates that the glycolysed product undergoes thermal
degradation at about 415 °C. However at this step, glycolysed product decomposes
rapidly with a total mass loss of 50%.
While Figure 2.9 in the following page displays the TGA thermogram of
glycerol and PET flakes used in glycolysis experiments. The thermogram shows the
glycerol thermal degradation begins at 221 °C while the PET flakes red thermogram,(b)
at 421 °C. Both these temperatures are close to the first and second steps of thermal
degradation of glycolysed PET. As shown in Figure 2.8, thermal degradation of first
step is about 220 °C almost similar to glycerol whereas second step is around 415 °C
which is considered to be PET flakes.
32
Figure 2.8 TGA thermogram of the glycolysed product, GP1B
33
Figure 2.9 Thermogram of (a) glycerol-blue curve and (b) PET flakes-red curve
34
2.4 CONCLUSION
Post-consumer PET waste bottles can be glycolysed using glycerol. The
influences of glycolysis time, glycolysis temperature and the equivalent weight ratio of
PET to glycerol (amount of glycerol) were presented. Highest yield of 98 % of
glycolysed PET was obtained at glycolysis temperature of 200 ˚C, glycolysis time of 2
hours and glycolysis ratio of 1:6 with the glycolysis conversion of almost 100 %. The
rate constants for glycolysis were calculated for four different temperatures, yielding
activation energy of 32.4 kJ/mol. The FTIR and NMR results confirmed structure of the
glycolysed PET while GPC shows presence of oligomers. The hydroxyl number is
found to be in the range of 527-815 mg KOH/g depending on their ratio of equivalent
weight ratio of PET to glycerol.
35
2.5 REFERENCES
1. Xi, G., M. Lu, and C. Sun, Study on depolymerization of waste polyethylene terephthalate into monomer of bis (2-hydroxyethyl terephthalate). Polymer degradation and stability, 2005. 87(1): p. 117-120.
2. Baliga, S. and W.T. Wong, Depolymerization of poly (ethylene terephthalate) recycled from post‐consumer soft‐drink bottles. Journal of Polymer Science Part A: Polymer Chemistry, 2003. 27(6): p. 2071-2082.
3. Chen, J., et al., Depolymerization of poly (ethylene terephthalate) resin under pressure. Journal of applied polymer science, 1991. 42(6): p. 1501-1507.
4. Karayannidis, G.P., et al., Alkyd resins derived from glycolized waste poly (ethylene terephthalate). European polymer journal, 2005. 41(2): p. 201-210.
5. Suh, D., O. Park, and K. Yoon, The properties of unsaturated polyester based on the glycolyzed poly (ethylene terephthalate) with various glycol compositions. Polymer, 2000. 41(2): p. 461-466.
6. Mansour, S. and N. Ikladious, Depolymerization of poly (ethylene terephthalate) wastes using 1, 4-butanediol and triethylene glycol. Polymer Testing, 2002. 21(5): p. 497-505.
7. Vaidya, U.R. and V.M. Nadkarni, Unsaturated polyester resins from poly (ethylene terephthalate) waste. 1. Synthesis and characterization. Industrial & engineering chemistry research, 1987. 26(2): p. 194-198.
8. Vaidya, U. and V. Nadkarni, Unsaturated polyesters from PET waste: Kinetics of polycondensation. Journal of applied polymer science, 1987. 34(1): p. 235-245.
9. Vaidya, U. and V. Nadkarni, Polyester polyols for polyurethanes from PET waste: Kinetics of polycondensation. Journal of applied polymer science, 2003. 35(3): p. 775-785.
10. Öztürk, Y. and G. Güçlü, Unsaturated polyester resins obtained from glycolysis products of waste PET. Polymer-Plastics Technology and Engineering, 2005. 43(5): p. 1539-1552.
11. Chen, F., et al., Kinetics of glycolysis of poly (ethylene terephthalate) under microwave irradiation. Journal of applied polymer science, 2012.
12. Mishra, S. and A. Goje, Chemical recycling, kinetics, and thermodynamics of alkaline depolymerization of waste poly (ethylene terephthalate)(PET). Polymer Reaction Engineering, 2003. 11(4): p. 963-987.
13. Goje, A., et al., Chemical recycling, kinetics, and thermodynamics of hydrolysis of poly (ethylene terephthalate) waste with nonaqueous potassium hydroxide solution. Polymer-Plastics Technology and Engineering, 2004. 43(2): p. 369-388.
14. Lobo, H. and J.V. Bonilla, Handbook of plastics analysis. Vol. 68. 2003: Crc Press.
15. Chen, C.H., et al., Studies of glycolysis of poly (ethylene terephthalate) recycled from postconsumer soft‐drink bottles. I. Influences of glycolysis conditions. Journal of applied polymer science, 2001. 80(7): p. 943-948.