CHAPTER I INTRODUCTION When Ind ia became free, Kerala was made up of two states, Travancore and Cochin, and Malabar princely which was under the direct administration of the British. Under the States Re-organization Act of 1956, Travancore- Cochin State and Malabar were uni ted to form the State of Kerala on 1st November, 1956. Some territorial adjust- ments had necessary to be made on re-organization. In this adjustment, Kerala lost the taluks of Thovala, Agasteeswaram, Kalkulam and Vilavancode in the far south and Shencotta in the east, while it gained the Malabar district and the Kasargod taluk of South Kanara district in the north. The Lacccadive, Minocoy and Amindivi islands lying off the coast of Malabar were detached from Kerala and declared as Union Territory. 1.1. Industrialisation in Travancore-Cochin and Malabar From the days immemorial, traditional industries like mat 'weaving, handlooms, bamboo products etc. were popular in different parts of Travancore, Cochin anQ Malabar. But concrete attempts for industrialisation were started only by the middle of the 19th century. The first
Transcript
CHAPTER I
INTRODUCTION
When Ind ia became free, Kerala was made up of two
states, Travancore and Cochin, and Malabar princely
which was under the direct administration of the British.
Under the States Re-organization Act of 1956, Travancore
Cochin State and Malabar were uni ted to form the State
of Kerala on 1st November, 1956. Some territorial adjust
ments had necessary to be made on re-organization. In
this adjustment, Kerala lost the taluks of Thovala,
Agasteeswaram, Kalkulam and Vilavancode in the far south
and Shencotta in the east, while it gained the Malabar
district and the Kasargod taluk of South Kanara district
in the north. The Lacccadive, Minocoy and Amindivi
islands lying off the coast of Malabar were detached
from Kerala and declared as Union Territory.
1.1. Industrialisation in Travancore-Cochin and Malabar
From the days immemorial, traditional industries
like mat 'weaving, handlooms, bamboo products etc. were
popular in different parts of Travancore, Cochin anQ
Malabar. But concrete attempts for industrialisation were
started only by the middle of the 19th century. The first
2
factory, a textile factory was started at Quilon in 1881
by an American group.l Subsequently, coir, tea and rubber
factories flourished in diffe~ent parts.
While we trace the industrial development of
Travancore, Sir C.P. Ramaswamy Diwan deserves special
mention. He realised the fact that capital and skilled
labour are not sufficiently available in Travancore or
nearby states and hence he inv i ted outsiders to start
industries in Kerala. Even foreign companies reacted
favourably to the call given by him. For instance 'Alakan~
a Canadian Company expressed their willingness which
led to the starting of 'Indian Aluminium Company' at
Eloor. The other major industries started during the
days· of Sri C.P. were Travancore Sugars and Chemicals
Limited, Ogale Glass Factory, Fertilisers and Chemicals
Travanore Limited, Rayons, Perumbavoor and Travancore
Titanium Products Limited.
The important industries flourished in Cochin state
were coconut oil and textiles. One of the important
textile mills in Cochin state was Pushpagiri Weaving Mills
1. Raj an, K.A. (1987), Keralathilay Vyvasayang al, Kerala Language Institute, Trivandrum, Vol. I, p.l.
3
started at Trichur in 1908, the present Sitaram Textiles.
An industrial survey was conducted in 1909 by Cochin
state government, followed by an economic survey in 1920.
The survey committee suggested the starting of an Indus-
trial Advisory Board. As per this recommendation, the
Board was constituted but soon after it was merged with
the Economic Development Committee formed in 1925.
Just like Cochin state, Malabar also earned good
amount of foreign exchange from the export of coconut
oil. Another important industry popular in Malabar was
soap industry. Whi 1 e we t race the indust r ial i sat ion of
Malabar or even North Kerala, the works of Basel Mission
deserves special reference.
1.2. Basel Mission activities
Basel Evangelical Missionary Society, or Basel
Mission, a missionary organisation established in Basel,
Swi tzerland started operating in the Madras Presidency
from 1834 onwards. The activities of the mission concen-
trated in Malabar and South Canara (Karnataka state)
2 may be chronologically placed under
2. Jai Prakash Raghaviah (1986), "Basel Mission Industries in Malabar and South Canara (1834-1914)", M.Phil desertation submitted to the Centre for Development Studies, Trivandrum (unpublished), p.35.
early phase
middle phase
final phase
1834 - 1852
1852 - 1882
1882 - 1914
4
The early phase begins with the arrival of mission
aries in the Malabar coast in 1834. Initially, the
missionaries organised various industrial activities
mainly based on local crafts. This phase was characterised
by the initiatives undertaken by the industrial missiona
ries on their own.
During the middle phase (1852-1882) industrial
activities became increasingly under the control of the
industrial commission. This period was characterised by
the establishment of factory type of production organisa
tion. Handloom weaving establishments at various centres
were set up beginning with Mangalore. The first tile
factory, printing press and
also' established at Mangalore
mechanical workshop
during this period.
were
The
phase also witnessed considerable diversifications of
trading activity of the mission.
The final phase started from 1882 when the Industrial
Commission was amalgamated with the missionary joint
stock company. It enabled higher capital investment and
expansion < of industrial activities in Malabar coast.
5
However, in 1914 with the outbreak of the world war I,
the missionary involvement in the indust rial act i vi ties
came to an end. In 1914, the Basel Mission sold their
entire enterprises to the Commo~ Wealth Trust.
1.3. Industrial Development in the state of Kerala
Kerala constitutes only 1.2 per cent of the entire
land surface of India, but at the same time has to
support about 3.8 per cent of the total popUlation of
the country (1981)3. This disparity between land and
population lies at the root of her many economic problems
especially those of mounting unemployment and chronic
poverty. This problem cannot be solved by agricul tural
and social services alone unless it is supplemented by
speedy industrialisation in which small, medium and
large industries will have to play their legitimate
role. The progress made by the state in the growth of
factories, employment and production is presented in
table l.l~
3. Sankaranarayanan, K. C. and Karunakaran, V. (1985) , Kerala Economy, Oxford & IBH, New Delhi, p.lS3.
6
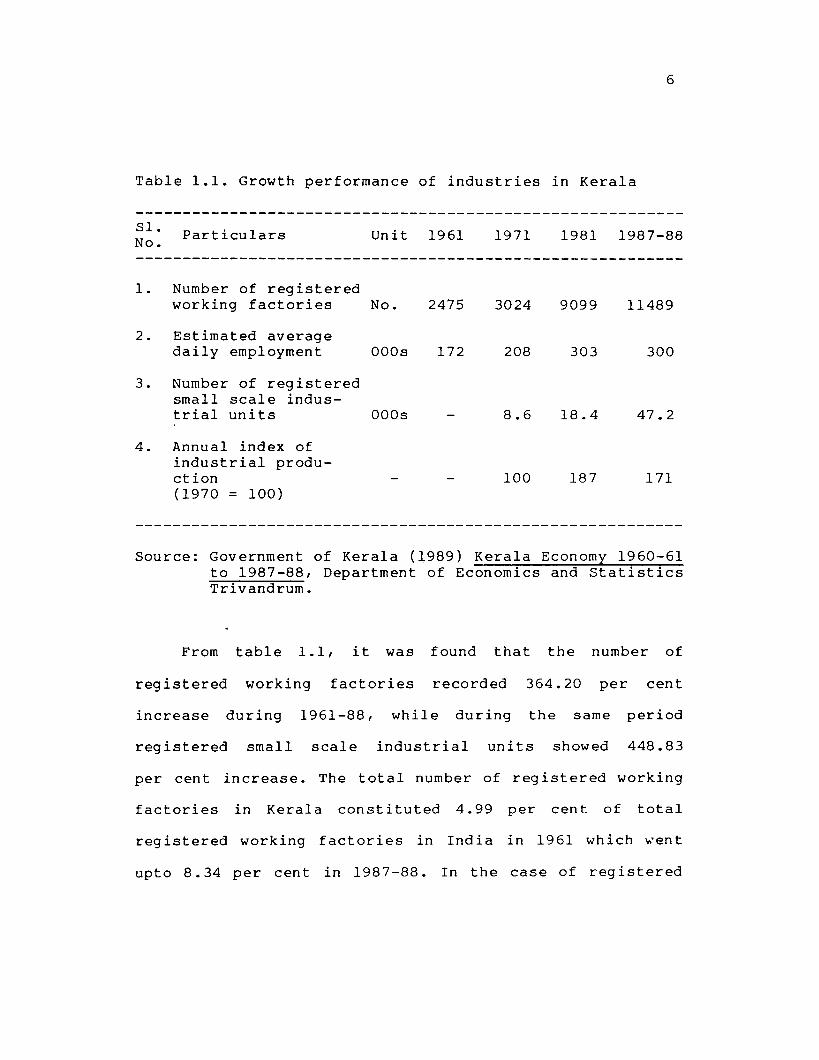
Table 1.1. Growth performance of industries in Kerala
SI. No. Particulars
1. Number of registered
Unit 1961
working factories No. 2475
2. Estimated average daily employment OOOs 172
3. Number of registered small scale indus-trial units OOOs
4. Annual index of industrial production (1970 = 100)
1971
3024
208
8.6
100
1981 1987-88
9099 11489
303 300
18.4 47.2
187 171
Source: Government of Kerala (1989) Kerala Economy 1960-61 to 1987-88, Department of Economics and Statistics Trivandrum.
From table 1.1, it was found that the number of
registered working factories recorded 364.20 per cent
increase during 1961-88, while during the same period
registered small scale industrial units showed 448.83
per cent increase. The total number of registered working
factories in Kerala constituted 4.99 per cent of total
registered working factories in India in 1961 which ~ent
upto 8.34 per cent in 1987-88. In the case of registered
7
small scale units, the share fall from 3.59 per cent
in 1971 to 2.97 per cent in 1987-88. Also it wns observed
that the maximum growth in the number of working
factories occurred during 1971-81 (299.89 per cent).
Investment in Industrial Sector
Industrial development in the state sector did not
receive much attention in majority of the five year
plans due to resource constraint. Because of the social,
political and economic compulsions, the state had to
give more emphasis to other sectors like social services
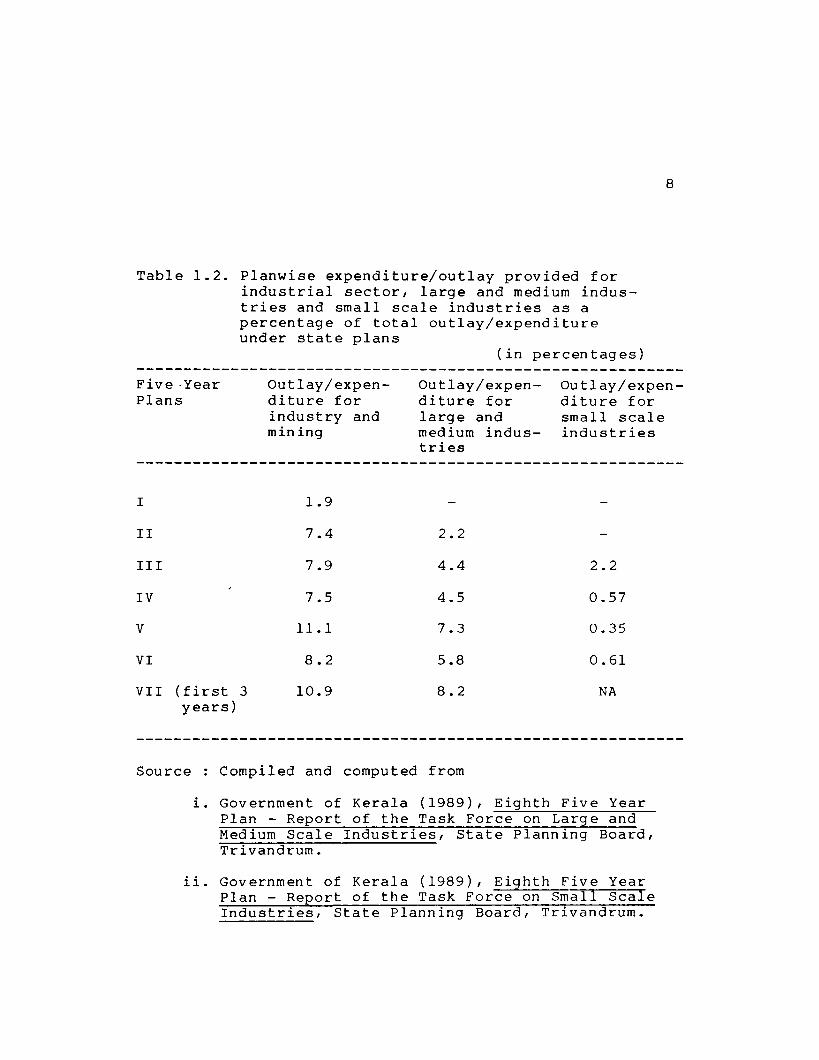
sector during the five year plans. The plan outlay/expen
diture for the industrial sector includes mining is
given in tabl e I. 2 as a percentage of the tot al outlay /
expenditure incurred by the state government during the
plan periods. From table 1.2, it is evident that the
industrial sector of the state did not attract adequate
investment in the earlier plans. This calls for heavy
investment in the vital sector of the economy by the
central government, national term lending institutions
and private entrepreneurs. On the other hand, the share
of the state in the central sector investment is coming
down since 1971-72. Though in absolute terms it has shown
Table 1.2. Planwise expenditure/outlay provided for industrial sector, large and medium industries and small scale industries as a percentage of total outlay/expenditure under state plans
(in percen tag es)
8
Five·Year Plans
Outlay/expenditure for industry and mining
Outlay/expenditure for large and medium industries
Outlay/expenditure for small scale industries
I 1.9
11 7.4 2.2
III 7.9 4.4 2.2
IV 7.5 4.5 0.57
V 11.1 7.3 0.35
VI 8.2 5.8 0.61
VII (first 3 10.9 8.2 NA years)
Source : Compiled and computed from
i. Government of Kerala (1989), Eighth Five Year Plan - Report of the Task Force on Large and Medium Scale Industries, State Planning Board, Trivandrum.
ii. Government of Kerala (1989), Eighth Five Year Plan - Report of the Task Force on Small Scale Industries, State Planning Board, Trivandrum.
9
increase over the past few years, the percentage share
of the state decl ined from 2.9 per cent in 1971-72 to
1.6 per cent in 1987-88. 4
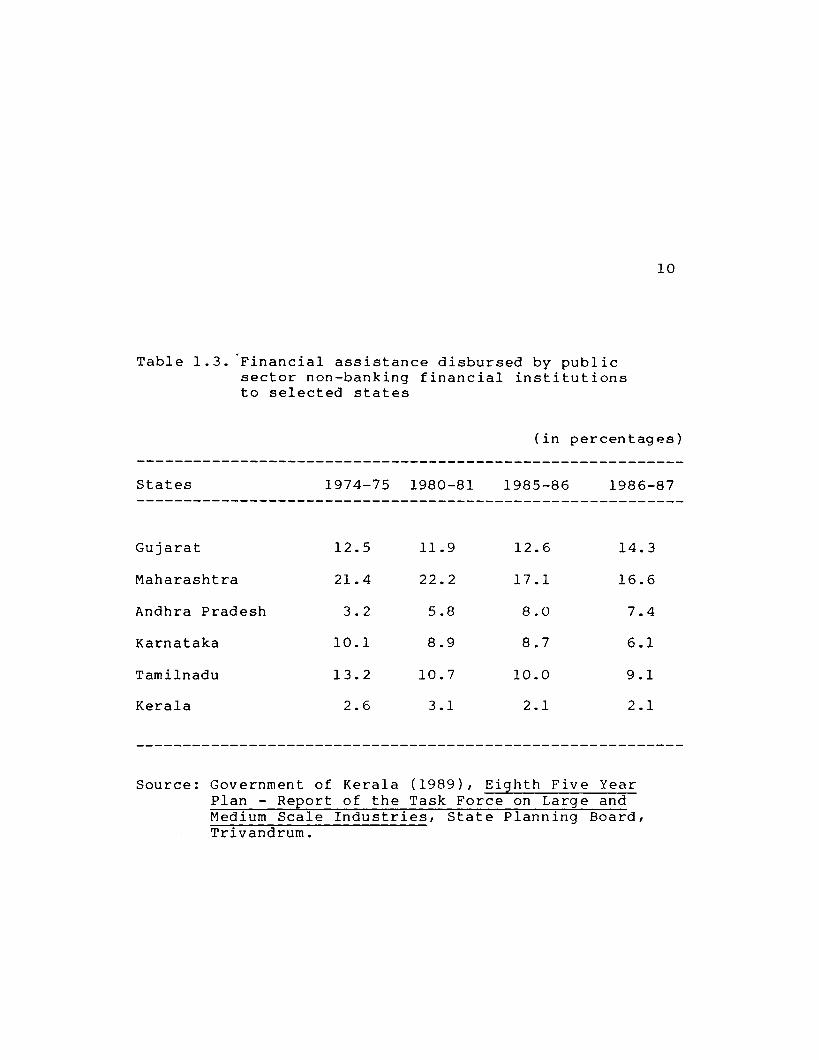
Similarly, the total financial assistance disbursed
by the All , India financial institutions such as IDBI,
IFCI, ICICI, LIC and GIC to Kerala has also found to
be very low. States 1 ike Maharash t ra, Guj ara t and Tamil
Nadu received much higher quantum of financial assistance
compared to Kerala which is visible from table 1.3.
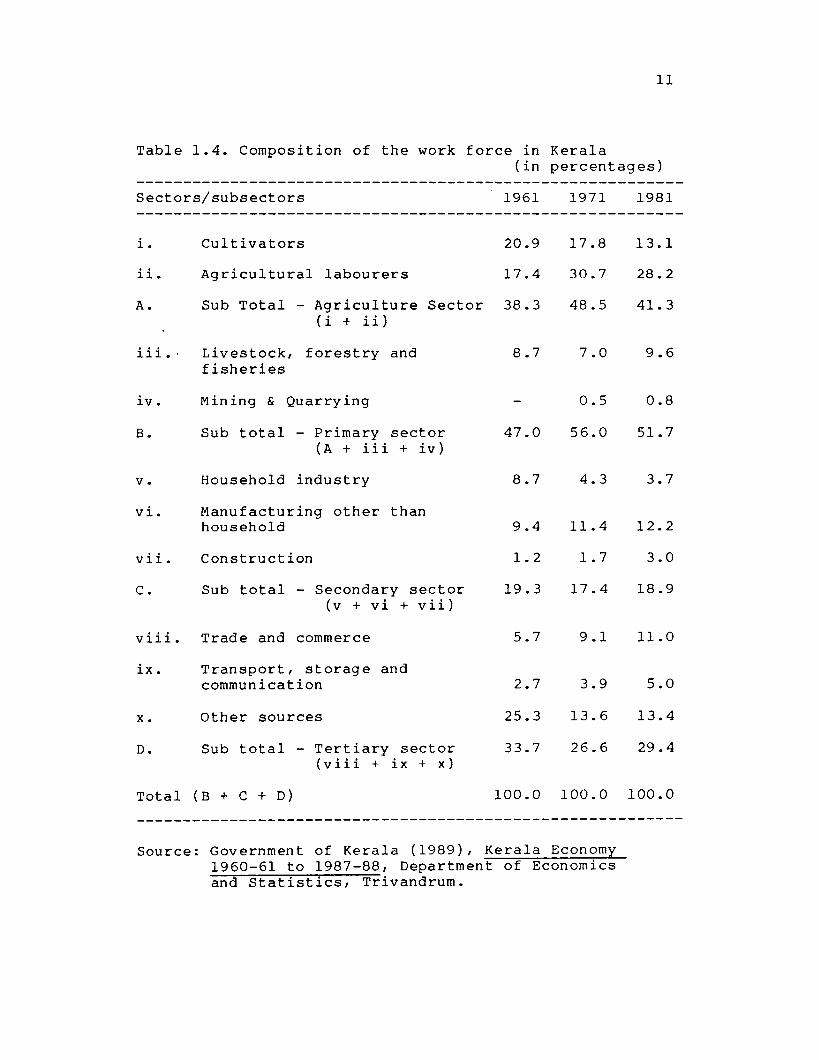
Composition of labour force
Another important indicator of industrial develop-
ment is the increase in the percentage of labour force
depending on industries and allied sectors. Table 1.4
gives a detailed picture of the composition of workers
in Kerala which shows that in 1981, 51.7 per cent of
the workers depend on primary sector compared to 47 per
cent in 1961. Also the percentage of workers engaged
in agricul ture sector increased from 38.3 per cent in
1961 to 41.3 per cent in 1981. The percentage of workers
4. Government of Kerala (1989), Eighth Five Year Plan: Report of the Task Force on Large and Medium Scale Industries, State Planning Board, Trivandrum, p.13.
Table 1.3. Financial assistance disbursed by public sector non-banking financial institutions to selected states
10
(in percen tages)
States 1974-75 1980-81 1985-86 1986-87
Gujarat 12.5 11.9 12.6 14.3
Maharashtra 21.4 22.2 17.1 16.6
Andhra Pradesh 3.2 5.8 8.0 7.4
Karnataka 10.1 8.9 8.7 6.1
Tamilnadu 13.2 10.7 10.0 9.1
Kerala 2.6 3.1 2.1 2.1
Source: Government of Kerala (1989), Eighth Five Year Plan - Report of the Task Force on Large and Medium Scale Industries, State Planning Board, Tri vandrum.
11
Table 1.4. Composition of the work force in Kerala (in percentages)
Sectors/subsectors 1961
i. Cultivators 20.9
ii. Agricultural labourers 17.4
A. Sub Total - Agriculture Sector 38.3 (i + ii)
iii., Livestock, forestry and 8.7
iv.
B.
v.
vi.
vii.
C.
fisheries
Mining & Quarrying
Sub total - Primary sector (A + iii + iv)
Household industry
Manufacturing other than household
Construction
Sub total - Secondary sector (v + vi + vii)
viii. Trade and commerce
ix.
x.
D.
Transport, storage and communication
other sources
Sub total - Tertiary sector (viii + ix + x)
47.0
8.7
9.4
1.2
19.3
5.7
2.7
25.3
33.7
1971 1981
17.8 13.1
30.7 28.2
48.5 41.3
7.0 9.6
0.5 0.8
56.0 51.7
4.3 3.7
11.4 12.2
1.7 3.0
17.4 18.9
9.1 11.0
3.9 5.0
13.6 13.4
26.6 29.4
Total (B + C + D) 100.0 100.0 100.0
Source: Government of Kerala (1989), Kera1a Economy 1960-61 to 1987-88, Department of Economics and Statistics, Trivandrum.
12
engaged in the secondary sector, which includes the sub
sectors, household, manufacturing and construction
actually declined to 18.9 per cent in 1981 from 19.3
per cent in 1961. This clearly reveals the low rate of
industrialisation in the state.
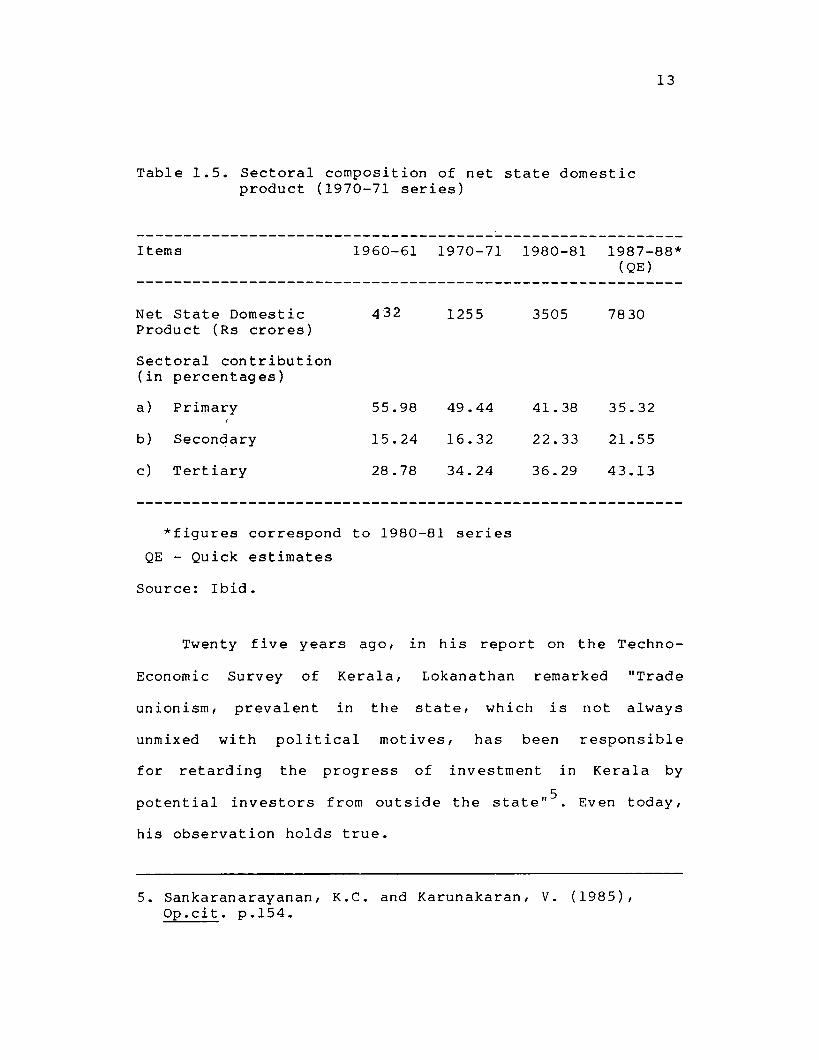
The contribution of the secondary sector to the
net state domestic product is another yard stick to
measure the levels of industrial development. The
details of the net state domestic product is illustrated
in table 1.5 which shows that the share of the secondary
sector increased from 15.24 per cent in 1960-61 to 22.33
per cent in 1980-81. But the quick estimates for the
year. 1987-88 indicates that the share of the secondary
sector has marginally declined to 21.55 per cent.
Major reasons for the low rate of industrialisation
in Kerala are:
i. Non availability of deposits of industrial fuel
like coal or oil or other resources.
ii. Lack of industrial skill and traditions of indus-
trial enterprise.
iii. Acute labour troubles.
Table 1.5. Sect oral composition of net state domestic product (1970-71 series)
13
Items 1960-61 1970-71 1980-81 1987-88* (QE)
Net State Domestic Product (Rs crores)
Sectoral contribution (in percentages)
a) Primary
b) Secondary
c) Tertiary
432 1255
55.98 49.44
15.24 16.32
28.78 34.24
*figures correspond to 1980-81 series
QE - Quick estimates
Source: Ibid.
3505 7830
41.38 35.32
22.33 21.55
36.29 43.13
Twenty five years ago, in his report on the Techno-
Economic Survey of Kerala, Lokanathan remarked "Trade
unionism, prevalent in the state, which is not always
unmixed with political motives, has been responsible
for retarding the progress of investment in Kerala by
5 potential investors from outside the state" . Even today,
his observation holds true.
5. Sankaranarayanan, K.C. and Karunakaran, V. (1985), Op.cit. p.154.
14
1.4. Traditional industries in Kerala
. Traditional industries in Kerala assume importance
because of the large labour force employed in these
industries. The major traditional industries in the
state are coir, handlooms, cashew, Khadi and Village
industries, handicrafts, bamboo, beedi and tiles with
a total employment of about 10 lakh persons (coir 44
per cent, handloom 20 per cent, cashew 10 per cent,
Khadi and Village Industries 11 per cent and others 15
per cent)6.
There are certain characteristics common to all
the traditional industries. Firstly, these industries
are concentrated in certain regions of the state on
account of geographical, historical and sociological
factors and resource endowments. Other characteristics
common to the trad it ional industries in the sta te are,
low level of technology and reluctance to adopt modern
LecillliyueB o[ pruullcLlulI. '.l'iw LIl>Ulll LU1CL' III LldulLiulldl
6. Government of Kerala (1989), Eighth Five Year Plan -Report of the Task Force on Traditional Industries, State Planning Board, Trivandrum, p.4.
industries do not get full time employment throughout
the year owing to mUltiplicity of reasons, the most
important among them being scarcity of raw materials
and slump in the market.
a) Coir industry
Among the traditional industries of the state, coir
has the foremost place. The back waters of Kerala suitable
for husk retting and the traditional skills of the
workers have been responsible for the concentration of
this industry in the state. The main centres of this
industry are Chirayankeezhu, Quilon, Kilrullilgilppilly,
Karthikappilly and Ambalapuzha taluks. Although, coir
industry has found a place in Karnataka and Tamil Nadu,
Kerala still produces 70 per cent of the coir and coir
products in the country. Thirty per cent of coir and
7 coir products manufactured in the state are exported.
During 1988-89 the export earnings from coir and coir
products reached Rs 3332.12 lakh compared to Rs 3219.74
lakh in 1987-88. 8
7. Government of Kerala, (1989), Economic Review, State Planning Board, Trivandrum, p.66.
8. Ibid.
16
The internal market for coir and coir products is
steadily increasing. The internal consumption of coir
and coir products in India during 1986-87 was found
61000 9 tonnes. Sales through the sales depots of the
Coir Board increased from Rs 145 lakh in 1981-82 to
Rs 250.03 lakh in 1985-86. 10 In order to expand the
domestic market further, a system of rebate of 20 pei.-
cent on sale of coir and coir products for 90 days in
11 a year was introduced from 1987 onwards.
The total number of workers in coir industry in
Kerala including part-time workers is estimated to be
4.30 lakh. 12 In 1988 the state government, with the
assistance of the Coir Board, has issued family benefit
cards to 222886 coir worker families including families
f . . k 13 o part-t1me C01r wor ers.
9. Government of Kerala (1989), Eighth Five Year Plan: Report of the Task Force on Traditional Industries, Op.cit. p.12.
10. Government of Kernln (1989), IO:ighth Five Year P]illl:
Report of the Task Force on Traditional Industries, Op. ci t.
11. Government of Kerala (1989), Eighth Five Year Plan: Report of the Task Force on Traditional Industries, Op.cit.
12. Government of Kerala (1989), Eighth Five Year Plan: Report of the Task Force on Traditional Industries, Op.cit.
13. Government of Kerala (1989), Economic Review, Op.cit.
17
The main thrust of coir development programmes in
the five year plans has been the strengthening of the ,
co-operative sector by bringing more workers into the
co-operative fold and enabling them to have more days
of work and better way of living. There were 828 coir
co-operative societies in Kerala as on June 30, 1988.
Of these, 448 societies are working, 120 newly
registered societies have not started functioning, 68
are dormant and 192 are under
constraints of this industry are:
1 · . d t' 14 l.qUl. a l.on.
i. Difficulties in getting the raw materials
The major
ii. Decl ining foreign market for coi rand coi r products
iii. Reluctance to modernise the factories due to histo-
rical and sociological reasons.
b) Cashew industry
Most of the cashew processing units are confined
in and around Quilon town. Cashew industry is mainly
ill the Lac t or'y BecLor' , DU L 1 L 1B cOJl~.lidl'led dt) d
traditional industry because of the low level of techno-
logy involved in the processing of cashew nuts.
14. Ibid.
18
There were 274 cashew factories in the state at the
end of 1988 employing 1.11 lakh persons, which show an
increase of 10 factories and 4000 labourers over those
at the end of 1987. 15 Cashew industry accounted for only
2.2 per cent of the total number of registered factories
in the state, but it reached 35.9 per cen t of the total
16 number of factory workers.
The industry had flourished on large imports of
raw nuts from East African Countries of Mosambique,
Kenya and Tanzania. Over the last decade, these countries
have developed their own cashew processing units and
have almost ceased to export nuts. Traditional sources
of raw cashew nuts have also dried up and there arose
strong competition from countries like Brazil and China
for purchase of raw nuts. Hence, scarcity of raw nuts
and the consequent unemployment of workers are the major
problems facing the cashew industry in the state.
15. Ibid.
16. Ibid.
1<)
c) Handloom industry
The industry is greatly concentrated in the
districts of Trivandrum, Kozhikode and Cannanore provi-
ding employment to about 17 2 lakh persons. The northern
districts produce handloom fabrics to cater to the
export market and the southern districts specialise in
the production of finer varieties for meetinq domestic
demand.
Handloom weaving has been traditionally associated
with particular caste and communities of Kera1a for
several centuries. The Pattaryas of Kottor, Erawiel in
the erstwhile South Travancore and the Chalias in the
other parts of the state are examples of caste guilds
which grew up around the handloom industry.18
Production of handloom cloth in the state during
1988-89 is estimated to be 104.88 million meters, valued
at Rs 69.82 crores. Fifty seven per cent of the produc-
tion was contributed by the co-operative sector, while
17. Sankaranarayanan, K.C. and Karunakaran,V. (1985), Op.cit. p.253.
18. Ibid. <
20
the corporate sector and private sector produced three
per cent and 40 per cent respectively.19
The number of looms in the corporate sector increa-
sed to 6984 as on 31.3.1989 from 6370 at the end of
1987-88. 20 On the other hand, the number of looms in
the unorganised sector decreased by 2.7 per cent during
the year 1988-89 compared to 30,130 at the end of the
. 21 prevl.ous year.
In recent years, the industry has been facing many
difficulties such as high price of yarn, and dyes and
the continuous threat from the mill sector with its
superior production technology, design and marketing
strategy. Though the industry could rehabilitate itself
to a certain extent and improve its production and
marketing services owing to the liberal assistance from
the central and state governments, the problem of accumu-
lation of unsold stocks still persists.
19. Government of Kerala (1989), Economic Review, Op.cit.p.66.
20. Ibid.
21. Ibid.
21
d) Beedi industry
Beedi industry provides employment to about 3 lakh
workers.22
There is hardly any village without a beedi
rolling shop. Yet it is seen unorganised to some extent
in the erstwhile Malabar area of the state, where the
industry is carried on a big scale employing a large
number of workers and where it remains concentrated.
Co-operativisation of beedi industry is unique and
the story started about 40 years back. In 1937, when
the congress government came to power for the first time
in the state of Madras, a noted trade union leader from
Kerala, C.P.Krishnan, put forward the idea of organising
beedi workers in the co-operative front. Later in 1957,
the government which came to power in Kerala organised
about 20 beedi employee co-operative societies. For some
time, these societies worked rather satisfactorily.
Today, only 3 to 4 of them cont inue to ex ist. Bu t the
Dinesh Beedi Co-operative which was started in 1969 at
Cannanore has been making remarkable strides.
22. Ibid. p. 68.
22
Twenty two primary beedi workers co-operative
societies are functioning under the Kerala Dinesh Beedi
Workers' Central Co-operative Society. The Society provi-
ded employment to 32670 workers during 1988-89 including
8168 women workers.23
The total number of beedies manu-
factured by the society during the year 1988-89 was
531.06 crores, valued at Rs 27.04 24 crores. More than
99 per cent of the raw materials consumed by the society
are imported from other states, wh il e abou t 87 per cen t
of the sales proceeds are realised from the domestic
market.25
e) Handicrafts
The Handicrafts Development Corporation of Kerala
is t'he primary agency for promotion and development of
handicrafts industry in the state. Procurement and
distribution of raw materials and marketing of finished
goods are the main activities of the corporation. During
1988-89, the corporation has procured raw materials such
as sandal wood, rose wood, etc. valued at Rs 4.09 lakh
23. Ibid.
24. Ibid.
25. Ibid.
23
and distributed the above i terns worth Rs 3.28 lakh to
handicrafts . 26 h artl.sans. T e total sales proceeds of the
corporation have increased from Rs 244.92 lakh in
1987-88 to Rs 282.21 lakh in 1988-89, registering an
increase of 15 per cent over th ' 27 h e prev l.OUS years. T e
performance in the export of handicrafts was also
encouraging as the value of exports rose by 21 per cent
from Rs 16.37 lakh in 1987-88 to Rs 19.83 lakh in
1988-89. 28
f) Bamboo industry
The Kerala State Bamboo Corporation Limited is the
sole agency engaged in the promotion and development
of bamboo industry in the state. The procurement and
distribution of bamboo reeds to traditional workers and
collection and sale of mats produced by them are the
main functions of the corporation. The manufacturing
and marketing of resin bounded bamboo boards is another
activity recently started.
26. Ibid. p.64.
27. Ibid.
28. Ibid.
24
The corporation has collected and distributed 120
lakh reeds valued at Rs 137 lakh during 87_88. 29 Mats
procllred and sold during the year was 695 lakh sq. ft.
worth Rs 161 lakh, compared to 629 lakh sq.ft. worth
Rs 174 lakh during the previous 30 year. Bamboo boards
manufactured was 3.29 lakh sq. ft. worth Rs 23.20 lakh
and the effective sale was 2.18 lakh sq.ft. for Rs 11.76
lakh. Thus the total turnover of the corporation during
1988-89 was Rs 370 lakh reg i ster ing an increase of 16
per cent over Rs 318 lakh during the prev i ous 31 year' .
The corporation provides employment to 15000 weaver
families, 2500 reed cutters and 1000 other workers
1 b 1 · h k . 32 most y e onglng to t e wea er sectl0n.
g) Khadi and village industries
The Kerala Khadi and Village Industries Board was
constituted under the provisions of the Kerala Khadi
and Village Industries Act of 1957. It is the function
of the Board to organise, develop and regulate Khadi
and Village Industries recognised by the Khadi and
village Industries Commission. The Board also organises
29. Ibid.
30. Ibid.
31. Ibid.
37.. Ibid.
25
co-operative societies for the development of Khadi and
Village Industries and sanctions loans and grants and
prov ides ot her assistan ce to the co-operat i ve societ ies
registered institutions and individual artisans which
mainly include (i) village pottery industry (ii) fibre
and screpine industry (iii) blacksmithy and carpentry
(iv) village leather industry (v) non edible oil and
soap industry (vi) cottage match industry (vii) cane
and bamboo industry (v i i i) fru i t processing and preser-
vation industry and (ix) gobar gas.
During the year 1988-89, the Khadi and Village
Industries Board has registered 25 co-operative
societies, raising the total number of co-operatives
under its control to 1997.33
During the year the Board
could provide employment to 1.79 lakh persons through
its various production centres, registered institutions
and co-operative . t' 34 SOCle les. The value of production
of khadi cloth increaflco from Rfl 7.IIG.SO 1ilkh 111 1<)87-88
to Rs 360.31 lakh in 1988-89. The sales value also
recorded an increase of 27.5 per cent during 88-89 to
33. Ibid. p. 65.
34. Ibid.
26
Rs 510.98 lakh compared to previous year's Rs 400.85
lakh. The value of production of village industries
increased from Rs 46.03 crores in 1987-88 to Rs 51.66
crores in 1988-89. 35
1.5. Tile industry
The tile industry is about a century old in Kerala.
About 12,000 persons are directly employed in this
industry and the indirect employment is estimated to
be 3000. 36 The main centres of tile industry are,
Alwaye and Quilon together accounting for 85 per cent
of the tile factories in
capacity is 100 crore
the
tiles
37 state. The
per annum
installed
currently
producing 55 crore tile per annum valued at about
Rs 60 crores. Seventy per cent of the products were sold
outside the state till the middle of 1960s, main markets
35. Ibid.
36. Government of Kerala (1989), Eighth Five Year Plan, Report of the Task Force on Traditional Industries, Op.cit. p.14.
37. Government of Kerala (1986), Economic Review, State Planning Board, Trivandrum, p.65.
27
being Tamil Nadu, Anohra Pradesh, Gujarat, Rajasthan,
Orissa and Maharashtra. 38
1.6. Statement of the problem
Kerala was enjoying a dominant position in tile
production in the country for a century. The demand for
Kerala tiles was steadily increasing till 1965 both in
the local and external markets. The number of tile
factories also doubled in early 1960s as natural clay,
firewood and unskilled labour were easily available.
But the situation changed since 1965. Development of
tile factoriees in other states like Tamil Nadu,
Karnataka, Andhra Pradesh and Gujarat reduced Kerala's
external trade. Preference for RCC type houses crippled
internal markets also. Scarcity of good clay, stiff
resistance from environmentalists towards clay mining,
scarcity and high price of firewood and other inputs
and increase in the cost of labour adversely affected
the tile industry and the majority of the factories are
on the brink of sickness.
38. Kotti Reddy, A (1987), Status of Tile Industry in Kerala, Small Industries Service Institute, Trichur, p.!.
28
1.7. Objective of the study
i. To study the economics of the tile industry in
Kerala for the period 1978-79 to 1987-88.
ii. To examine the reg ional variations in the economics
of the industry.
iii. To identify the major problems and constraints con
fronted bi the tile industry in Kerala.
iv. To examine the prospects of tile industry in
Kerala.
1.8. Methodology
a) Sample selection
The tile industry in Kerala is a traditional one
and due to various reasons like availability of quality
clay, firewood etc. it has certain regional concentra
tion. The basic organis~tional structure also differs
from p 1 ace top 1 ace. Fur the r , the un its vary in the i r
production capacity
quality of tiles and
also. The type of control, the
unit to unit.
cost
Therefore,
of production also differ from
i t was f e 1 t t hat a s t rat i f i ed
analysis will be more appropriate based on location and
size ~
29
Classification on the basis of location
On the basis of location, the tile industry in
Kerala can be classified into four regions namely
Calicut region, Trichur region, Alwaye region and Quilon
reg ion.
In northern part of Kerala, the industry is concen
trated in Calicut and Feroke which constitute Calicut
region. Superior variety of clay is available in plenty
in this area. The facility of water transpoort in this
region reduces the cost of transportation of raw
lIIaterials and the [irtinllC'd <Juod:t.
Trichur region constitutes the factories located
at Trichur, Ollur, Pudukad and Chalakudy. Majority of
factories located in this region are very small in size.
The factories spread around the banks of Periyar
river form ]\lwaye rE'C'Jion. ,"lust likE' C'<llirtlt- reqion,
facility of water transport is an advantage in this
region.
at
In southern part of
Quilon. Just like
Kerala, the industry is located
Trichur and Alwaye reg ions,
30
factories located in Quilon region are also small in
size and modernisation is yet to takE' place in this
reg ion.
Classification on the basis of size
The men and machinery of a factory are related to
its size. The Small Industries Service Institute,
Trichur classified the industry according to its size
in 1981 as follows. 39
Category A: Those un its producing less than 7500 tiles
per day come under this category and their share in the
total factories in the state is worked out to be 76 per
cent.
Category B: units producing between 7500-20,000 tiles
per day are included in this group, percentage share
being 21.
Category C: Un its producing more than 20,000 t i 1 es per
day come under this group (l pC'r cellt)
39. Small Industries Service Institute (1980), Status Report on Tile Industry in Kerala, Trichur, pp. 3.4 - 3.5
31
However, while selecting the sample for the purpose
of this study, size wise classification is not
considered due to
i. inadequate number of units under Category C
ii. Even if a strata is formed from category C or from
category B, they cannot be combined with units from
category A.
b) Sampling size
Of the total 324 factories in Kerala* 33 are
located in Calicut region (10.18 per cent), 157 in
Trichur region (48.45 per cent), 36 in Alwaye region
(11.11 per cent) and 51 in Quilon region (15.74 per
cent). The remaining 47 factories are spread in other
40 areas. Sample consists of 32 factories selected at
random from each region, comprising of five factories
from Calicut reg ion, sixteen factories from 'l'richur
reg ion, five factori0s from rNl ion .,n<i
40. Goverhment of Kerala (1987), Economic Review, State Planning Board, Trivandrum, p.66.
six
*Note: Economic Rev iew 1987 showed that there are 337 factories in the state. But field enquiry revealed that, 13 factories have stopped production due to various reasons and hence, for the purpose of this study, population is taken as 324 factories.
32
factories from Quilon region. Data were collected for
a ten year period from 1978-79 to 1987-88 with the help
of pre tested structured schedule.
In order to examine the economics of the industry,
details on capital structure, inputs, output, workers
emoluments etc. were required. All these concepts are
developed for large manufacturing concerns and it varies
even from industry to industry. For tile industry, exclu
sive definitions are not available and hence the defini
tions adopted by Annual Survey of Industries have been
used for the study and hence modifications were also
made wherever necessary. Collected data were analysed
with the help of percentages and structural ratios.
Working definitions
a) Fixed capital
Fixed capital represents the value of fixed assets
owned by the factory as on the closing day of the accoun
ting year. Fixed assets include land, buildings and
depreciation is also to be accounted. But all the survey
units were started years and years back and hence, depre
ciation in the value of fixed assets is not considered.
b) Physical working capital
Physical working capital is defined to include all
physical inventories owned, held or controlled by the
factory as on the closing day of the accounting year
such as stock of materials, stock of semi-finished goods
and stock of finished goods.
c) Working capital
Working capital is the sum total of the physical
working capital and the cash deposits in hand and at
bank and the net balance of amounts receivable over
amounts payable at the end of the accounting year.
d) Productive capital
Productive capital is the total of fixed capital
and working capital as defined above. •
34
e) Invested capital
Invested capital is the total of fixed capi tal and
physical working capital as defined above.
f) Workers
Workers are defined to include all persons employed
in the factory.
If we go for strict definition, the administrative
staff is to be treated separately. But in tile industry,
the number of administrative staff is only one- or two
in each factory and even they participate in production
process occasionally. Hence workers include administra
tive staff also.
g) Emoluments
Emoluments are defined to include wages/salaries
and also the other benefits enjoyed by the workers.
h) Inputs
Inputs comprise gross value of materials,
etc. consumed during the accounting year.
fuels
35
i) Cost of production
The total cost of product i on is the sum total of
inputs costs, wages/salaries and other establishment
costs.
j) Value of output
Value of output is defined to include the
ex-factory value of products and by products manufactu
red during the accounting year.
k) Gross profit (output cost)
Gross profit at output cost is defined as the dif
ference between value of output and total cost of
production.
1) Value added
Value added is obtained by deducting the value of
total inputs from the value of total output.
St ructura 1 chang es over the ref eren ce per i od were
discussed with the help of selected structural ratios
namely, fixed capital to invested capital ratio, fixed
capital to productive capital ratio, input output ratio,
36
value added to output ratio, fixed capital to output
ratio, invested capital to output ratio, value added
to invested capi tal ratio, value added to inpu t ratio,
output input ratio, output invested capital ratio and
input invested capital ratio.
In order to examine the regional variations ANOVA
and Critical Difference Test were used. Capital labour
relationship was examined with the help of Cobb-Douglas
production function. Problems were ident if ied from
discussions with owners, manag ers, workers, brokers and
customers.
The prospects of tile industry is related to the
demand from housing sector. Hen ce, the population,
housing demand and housing stock were proj ected unt il
2001 AD using exponential function of t form y = ab . The
pattern of houses in Kerala is not available from the
secondary source since 1971. Hence the researcher colle-
cted the details of 600 houses built since ]975 from
the offices of local bodies. 'rhis 600 houses included
200 houses from south Kerala, 200 from central Kerala
and 200 from north Kerala and 200 houses represented
100 rural house and 100 urban house from each strata.
37
Based on <these details collected, the annual require
ment of roofing tiles and company produced bricks were
estimated until 2001 AD under different alternatives.
An attempt was also made to indicate the area where the
industry can diversify.
1.9. Review of literature
The 1 i terature ava i lable on tile indust ry includes
papers published/presented and a few reports prepared
by various individuals and institutions. Below an attempt
is made to review the available studies and they are
placed in chronological order.
Ceramics is an old industry. Ceramic products were
manufactured and used for centuries. The first knowledge
abou t the art of ceram i cs is ava i I abl e from the Vedas
itself especially Atherva Veda, Rig Veda and Yjur Veda.
Of the different ceramic products, the most popular are
tiles and bricks.
The work wh ich is cIa imed to be the first compl ete
work on bricks and tiles in the English language is the
one entitled "A Rudimentary Treatise on the Manufacture
of Bricks and Tiles" by Edward Robson (1889). In the
38
work, he explained in detail the ancient importance of
tiles and how this formed an importannt part of
monuments in different parts of the world. The book also
gives a detailed account of different designs existed
41 in olden days.
In India, the tile factories were first started
by Basel Mission. The Basel Mission also contributed
to the entire development of north Kerala. These efforts
were well explained hy Hoffman in his book "The Basel
Mission Industries" (1913). Basel Mission decided to
start tile factor ies in Manga10re and northern bel t of
Kerala because of the favourable factors existed there
like the availabili ty of good qual i ty clay, labour and
cheap transportation f ·1·· 42 aCl ltles. Further information
about the origin and development of tile industry are
available from the workers of Appaswamy et al.(1948),43
Ill. F.nW<'lrn RohR<"m, 71. (lAAQ), "~_~~~i.:'2_~~t,I~~:r('"t-in(' 011 the Manufacture of Bricks and Tiles", Crosshy Lockwood and Sons, London, 10th Edn. pp. 1-3.
42. Hoffman, H (1913), The Basel Mission Industries, Basel Mission Press, Mangalore, pp 15-19.
43. Appaswamy et al. (1948), Introduction to Modern Indian Sculpture,-Sright and Singh Publishers, Bombay.
39
Bose (1948)44 Chandler (1949)45 Chaudhury (1949)46, and
Du by, (1 950) • 47
The first research work on tile industry in India
came from Karat (1955). His thesis entitled "History
and Development of the tile industry in Mangalore",
examined the factors responsible for the concentration
of tile industry in Mangalore. He was of the opinion
that, the availability of good quality clay and cheap
labour were the primary factors which led to the concen-
tration of the industry in and around Mangalore. He also
made a comparison between new trends in housing constru-
ction and suggested that unless the industry diversi-
fies by 1980, the future of the industry will become
45. Chandler M.N. (1949), Ceramics in the Modern World, Bright & Singh Publishers, Bombay.
46. Chaudhury M.R. (1949), Indian Industries Development and Location, Wisdom Books, Delhi.
47. Duby R.N. (1950), A Treatise on Industrial Minerals in India, Bright & Singh Publishers, bombay.
48. Karat B.G.(1955), History and Development of the Tile Industry in Mangalore, Department of Economics, University of Bombay (unpublished) Quoted in: Nayak K.V. (1987), "Tile Industry Some Aspects", paper presented in the seminar on Tile Industry organised by Western India Tile Manufacturers Association at Mangalore.
40
In 1957, the Department of Industries, Government
of Madras, evaluated the merits and defects of d i ff eren t
building construction technologies. The survey carried
out in Madras city led the team to conclude that, when
compared to RCC roofing, tiled roofs are more suitable
. Id' d' t' 49 co n lan con 1 lons.
An early evaluation of the t il e indust ry in Kerala
is available from the "Report of the Minimum Wage
Committee for Employment in Tile Industry" headed by
V.R. Pillai (1961). The report closely examined the
extent of labour absorption in the industry and also
pointed out that the extent of labour absorption is
50 coming down over the years.
National Council of Applied Economic Research (1962)
discussed the factors which led to the localisation of
the industry in Kerala in their report "Techno Economic
Survey of Kerala". The team also examined the market
potential of the products. Their analysis also revealed
49. Government of Madras (1957), Manufacture of Building Materials, Department of Industries & Commerce, Madras
50. Government of Kerala (1961), Report of the Minimum Wages Committee for Employment in Tile Industry.
41
that the demand for tile and other products of the
industry are much influenced by the goodwill of the firm. 51
A call for modernisation of tile industry came from
Poornam (1962) in his article "Common Tile Industry in
Kerala". He was of the opinion that the only remedy to
uplift the fast declining industry is diversification. 52
Bhaskaran (1963) opined that modernisation is the
urgent necessity of the tile industry. He examined the
pattern of declining role of tile industry in the indus-
trial map of Kerala wi th the help of relevant structural
. 53 M ratlos. enon, P.K.S. (1963 ) also believed that the
tile industry can surv ive only if the industry goes for
modernisation. As a first step, he suggested that, the
. d th' k f d' l' t . 1 54 ln ustry can ln 0 pro uClng g aZlng 1 es.
Tile industry in Kerala had a glorious past. But
the situation started deteriorating by mid 1960s. This
aspect was considered in depth by Lokanathan (1965). He
51. National Council of Applied Economic Research (NCAER) (1962), Techno-Economic Survey of Kerala.
52. Poornam R. (1962), "Common Tile Indust ry in Kerala" Kerala Productivity Journal, July-Sept.1962, pp 56-61
53. Bhaskaran, K.R. (1963), "Tile Factories in Kerala," Paper presented in the Industries Seminar held at Small Industries Service Institute, Trichur, July 1963
was of the view that the major factors responsible for
the decline were, the falling external market, high
55 labour cost and non-availability of good quality clay.
John et al. (1966 ) highlighted how the scientific
knowledge can be used for developing tile industry. He
observed that one of the drawbacks of the roofing tile
industry is the absence of technological innovation. 56
The problems of the tile industry in the country
are listed in the paper prepared by the economic
research wing of the Syndicate Bank (1968). The paper
highlighted that the modernisation programme is delayed
due to the problem of finance particularly working
capital. It was suggested that, the survival of the
industry is possible only if, the banks and other
financial institutions come forward to liberalise the
d.. 57 con ltlons.
55. Lokanathan (1965) , Industrial Programmes for the Fourth Five Year Plan, National Council of Applied Economic Research.
56. John, N.C. et al.(1966), Bricks and Tile Research in Indian, Central Building .\.esearch Institute, Roorkee.
57. Syndicate Bank (1968) "The Travails of Tile Industry", Pigmy Economic Review, Vol.14, No.I, Auyust 19GB.
43
Another important study on tile industry in the
state was made by John Thomas Chirayath (1969). This
study, besides tracing the origin and growth of the
industry, assembled the main statistical data relating
to its structure. 58
Earlier studies highlighted that, one of the
important reasons for the concentration of the industry
in Kerala was the availability of good quality clay.
But Ayyappan Nair (1973) in his article on clay deposits
caut ioned that our clay deposi t s are fast decl in ing and
the adequate supply of clay will be a problem in the
59 near future.
The new trends emerging in tile industry was
examined in deta il by Karunakaran (1975) who suggested
that the tile manufacturing process should be changed
. th d . . 60 to SU1t e new tren s 1n construct1on.
58. John Thomas Ch i raya th (1969), A Industry in Kerala, Labour and ~T~r-1~·v--a-n~d~r~u-m--.----------
Study on the Tile Industrial Bureau,
59. Ayyappan Nair (1973), 'Clay Reserves in Kerala', Paper presented in the Seminar on 'Tile Industry in Kerala' organised by Tile Manufacturers' Association at Trichur, May 1973.
60. Karunakaran (1975), "Emerg ing Trends in Hou se Construction'" Kerala Productivity Journal, July-Aug. 1975.
44
One of the important steps in tile manufacturing
process is kiln firing. A detailed account on different
types of kilns, their relative merits and demerits are
available from "Developments in the technology of kilns"
by Sreedharan Nair (1975).61
The memorandum submitted to the Minimum Wages
Revision Committee for Employment in Tile Industry in
1979 gives a detailed account of the problems of the
indust ry. The memorandum also high 1 ight ed the necessi ty
f f "" "" ""1 f "62 o ~x~ng m~n~mum wages ~n t~ e actor~es.
Radha (1979) discussed the economics of the tile
industry in Trichur district in terms of the distribu-
tion of units, total amount of capital invested, output
and demand. She also listed out the major problems of
the industry, which included, non availability of good
61. Sreedharan Nai r, M. R. (1975), "Developmen t s in the Technology of Kiln~", K0r'-11 .. Prodllctivity ,jollrntll, Nov-Dec. 1975.
62. Small Industries Service Institute (1979), The Memorandum to the Minimum Wages Revision Committee for Employment in Tile Industry.
45
clay, high fuel cost, high labour cost, lack of demand
and loss of "external" market. 63
A comparative study on different construction
methods were made by Anto (1979) with the help of social
cost benef i t analysis and came to the conclusion that
RCC roofing is not preferable under Kerala conditions. 64
Another major study in this area was the status
report prepared by Small Industries Service Institute,
Trichur in 1980. The primary objective of this study
was to examine the status of tile industry in Kerala
and the study team suggested the introduction of quality
control, implementation of new model kilns and moderni-
. h 65 sat~on sc ernes.
63. Radha c.v. (1979), Economics of Tile Industry in Kerala wi th Special Reference to Trichur District, Ml\ desertation suhmitted to Dr.,lohn Jl1.,t-h.-li ('('ntrf', University of Calicut (unpublished).
64. Anto,C.C. (1979), Cost Reduction in Building Technology, MBA desertation submitted to School of Management Studies, University of Cochin (unpublished).
65. Small Industries Service Institute (1980), op.cit.
46
Information on tile industry particularly in
Trichur district is available from the works of Shyam
Bhat (1981)66 and Paul (1981)~7
Aminya Rao (1981) surveyed the sufferings of tile
industry workers in Gujarat and concluded that the rich
1 h 1 · t t h t . 1 k . . 68 c ass very muc exp 01 s e 1 e wor ers ln Gu]arat.
Khosala (1983) discussed the various alternatives
of building technology and claimed that even today, the
rural population use tiles for roofing purposes and
there is sufficient scope for this industry in rural
areas. She also suggested that the problem can be solved
if credi~ sales are introduced. 69
66. Shyam Bhat,K. (1981), Role of Traditional Industries, MA desertation submitted to Dr. John Mathai Centre, University of Calicut (unpublished).
67 • P a u 1 , K • A • ( 1981 ), S t ru c tu r e and Pat t ern 0 fIn d u strial Development in Trichur District, MA desertation submitted to Dr. John Mathai Centre, University of Calicut (unpublished).
68. Aminya Rao (1984), "Bonded Brick-kiln Labour In Poverty and Bondage", Economic and Political Weekly, Vol. 16, July 4, 1981, p.1137.
69. Khosala, R (1983), "The Architecture of Rural Housing Some issues in India", Journal of Rural Development, August 1983, p.32.
47
Aravindakshan (1983) classified the tile industry
in Kerala into 3 categories small, medium and large
and a study was made with the following important
b. . 70 o Ject~ves.
a) to ascertain the degree of modernisation required
b) to ascertain the volume of financial requirement
c) to ascertain the agencies that can act as catalysts
for modernisation.
The major findings of this study were the following.
i. There is technological stagnation in the tile
industry
ii. More units are becoming sick because of the high
production cost.
iii. Preference towards tile roofed houses are fast
declining.
iv. Intermediaries are responsible for a high selling
price
v. The industry is highly labour intensive.
70. Aravindakshan, K (1983), A study of Tile Industry in Kerala with Special Reference to Trichur District, Ph.D.desertation submitted to Department of Commerce, University of Calicut (unpublished).
48
In earlier days, Mangalore and Kerala had a predo-
minant position in tile production. But, later the
industry spread to other parts of the country I particu-
larly to Morv i in Guj ara t • An accoun t abou t the t il e
industry in Morvi is available from the survey report
prepared by the Government of Gujarat (1984). From a
comparison of the findings with Kerala scene, it was
found that the problems which are predominant in Kera1a
71 are equally relevant in Gujarat also.
Balan (1986) is of the opinion that the industry
stagnated because of the static nature of the industry.
He also observed that, the majority of the tile units
in Kerala are following traditional methods mainly due
to the lack of R & D facilities.72
Ananthasubramanian (1986) is of the view that moder-
nisation is delayed due to the lack of finance.
71. Government of Gujarat (1984), Roofing Tile Industry in Morvi, Department of Industries, Gandi Nagar.
72. Balan, P.P., (1986), Modernisation of Clay Products Paper presented in the Seminar organised by State Productivity Council at Trichur in August, 1986.
Modernisation is postllule ollly It Llle ULlIIK..!cl dud oLllet'
financial institutions come forward to finance the
industry.73 The urgent need of modernising tile industry
74 was stressed by Thomas also (1986).
The study team appointed by the Western India Tile
Manufacturers Association (1986) evaluated the growth
of the industry in Mangalore for the last 100 years in
terms of technology, production, finance and market.
The team observed that, the corn ing up of factories in
Morvi in Gujarat poses a threat to tile factories in
Mangalore and also in northern Kerala. The team also
Suggested liberalised lending to tile factories. 75
An overview on the different aspects of raw
material processing based on red clays is available from
"Red clay based ceramic products An overview" by
73. Ananthasubramanian, D. (1986), Financing for Modernisation of the Industry. Paper presented in the Seminar organised by State Productivity Council at Trichur in August, 1986.
74.
75.
Thomas, P.P. (1986), Need for Development nology in Tile Industry. Paper presented Seminar organised by State Productivity at Trichur in August, 1986.
of Techin the
Council
Western (1986), Indust ry.
India Problems
Tile Manufacturers Association and Prospects of Roofing Tile
50
Warrier et al. (1987). The ent ire discussion is based
on important parameters, such as raw material quality,
processing conditions and quality of products. Some of
the recent developments in the red clay product manufa-
cture, such as, the concept of vitrified red clay tiles
and firing practices were also discussed in this paper. 76
National Productivity Council (1987 ) made some
attempt to measure the productivity of tile industry
in Kerala. The study revealed that, eventhough the
industry is expanding in terms of number of units, the
capital and labour productivity are declining particularly
since 1975, mainly due to high labour cost and raw
. 1 t 77 materla cos.
According to Kolti Hcddy (1987) it 1:1 ncce.s.sury
that all the tile units in Kerala state should immediately
form a single organisation to represent their problems
76. Warrier, K.G.K. et al. (1987), "Red Clay Based Ceramic Products - an Overview", Vyawasaya Keralam, Feb.1987, pp. 9-12.
77. National Productivity Council (1987), Productivity of Tile Industry in Kerala.
51
to the government and to take necessary steps to solve
marketing and technical problems collectively and in
association
. 78 agencJ.es •
with various research bodies and other
. Haj ela (1988) cri t ically examined the probl ems and
approaches for the modernisation of clay roofing tile
industry. He listed the following factors responsible
f 1 d . . 79 or s ow mo ernJ.satJ.on.
i. Industry is small scale, labour-intensive and rural
based
ii. Lack of R & D facilities
He also suggested the following areas where moderni-
sation is required:
i. standardisation of products
ii. Diversification of kiln design
iii. Introduction of semi-mechanisation at various
stages of clay preparation.
78. Kotti Reddy, A. (1987), op.cit.
79. Hajela, R.B. (1988), Problems and Approaches for the Modernisation of Clay Roofing Tile Industry, Central Building Research Institute, Roorkee.
52
A detailed account on the level of modernisation
required at different levels is available from the paper
"Modernisation aspects of tile Industry" prepared by
Balachandran (1988). The paper poin t ed out that the cost
of production of tile has been increasing due to high
cost of firewood, clay, labour and transportation. He
is of the view that cost reduction is possible only if
modernisation is introduced at different levels. 80
Besides the above mentioned stud i es, annual report s
of the tile manufacturers assoc iat ion, prof il es prepared
by different tile factories and such other materials
also give insight into the various aspects of tile
industry. However, barring a few, almost all the studies
suffer from the following deficiencies.
1. The studies are made by individuals or associations
and not by authentic sources.
2. The studies are not uosed on oily scientific
methodology.
80. Balachandran, s. (1988), Modernisation Aspects of Tile Industry, National Productivity Council.
53
3. Almost all the studies suggested that, the prospe
cts of tile industry lies in, to whut extent the
industry can diversify. lJut !lot a sinyle study so
far attempted to quantify the prospects or direct
the area or magnitude where the industry should
diversify.
The present study is an improvement
earlier studies in the following respects.
over the
1. This is an attempt to study the economics of tile
industry in Kerala drawing samples from all the
four reg ions namely, Calicut, Trichur, Alwaye and
Quilon together accounted for 85 per cent of tile
factories in the state.
2. In order to study the economics of the industry,
the methodology followed by the Annual Survey of
'Industries was used.
3. The study also examined the intra variations (varia
tions for the same region over the years) and inter
variations (variations between regions)
4. In order to examine the prospects of tile industry,
an attempt was also made to estimate the average
54
annual requirement of roofing tiles and burnt
bricks in Kerala till 2000 AD and thus to identify
the area where the industry can diversify.
1.10. Limitations of the study.
1. Tile industry is a traditional one and the facto
ries rarely fol19wed the practice of keeping proper
records. Hence sufficient difficulty was experienced
in getting required data for a ten year period.
2. In an industry like thi~, details of quantity
of inputs used qnd quant.ity produced
because of the non-availability of
is 'important. But
quantity details,
the maj or part of the analysis was done in value terms.
3. Majority of the tile factories were started
before 1947 and hence, while calculating fixed cost,
depreciation is not accounted.
4. While selecting the samples, classification
based on location and size are to be considered. But
the samples for the present study were drawn exclusively
55
on the basis of location because of the inadequate
number of factories in category C.
5. Standard definitions of various concepts
developed for manufactu ring industr ies are not reI evan t
for a traditional industry like tile industry. So
certain working
analysis.
definitions are also used for the
6. Though tile industry is also producing certain
items like ceiling tiles, floor tiles, ridges and bricks,
in the entire literature, the tile industry is discussed
on the basis of the production of roofing tiles only.
Even in studies made by Annual Survey of Industries,
the industry is examined strictly on the basis of produ
ction of roofing tiles. Hence in the present study also,
major thrust is placed on roofing tiles.
7. Similarly, accurate information of sales are
not known. So sales analysis is not done in a detailed
mann er.
8. In the Sixth chapter, an attempt is made to esti
mate the average annual requ iremen t of roof ing tile and
burnt bricks in Kerala till 2001 AD. But about this,
56
earlier studies were not available and also the require
ment of roofing tiles and burnt bricks will vary from
design to design. Hence the estimates made. by the resear
cher cannot be considered as 'final' eventhough every
effort was made to give possible accuracy by computing
under different alternatives.
1.11. Scheme of the study
The present study is arranged in seven chapters.
The introductory chapter starts with a discussion
on the industrial development of Kerala and a review
of important traditional industries. This is followed
by the statement of the problem, objectives,
methodology, review of literature and limitations.
The second chapter traces the evolution of the
industry and rev iews the growth. After this, the
manufacturing process of tiles is also described.
The economics of the tile
discusse~ in the third chapter
capital structure, input costs,
industry in Kerala is
with reference to the
labour cost, product
mix, value added and gross profit with the help of the
57
data collected from the samples. Structural changes were
examined with the help of selected structural ratios.
A regional analysis of the industry is attempted
in the next chapter. Economics of four reg ions namely
Cal i cu t, 'l'ri chu r, A lWilye
separately and compared.
und Quilon were studied
The third objective of the study, ie. the identifi
cation of the problems and constraints confronted by
the tile industry in Kerala is covered in the fifth
chapter.
The sixth chapter examines the prospects of the
tile industry in Kerala. The chapter starts with a discus
sion on housing problem in India followed by a detailed
analysis of the situation in Kerala. The annual addition
to the total housing stock till 2001 AD is also estimated.
Based on these est ima t es, the average annual requ i remen t
of roofing tiles is derived under different alternatives.
This chapter also examines the scope of diversifying
tile industry into the production of low cost bricks.