Chapter I THE SOCIO-ECONOMIC FRAMEWORK ________________________________________________________________________________________________________________________________________________________________ A. General information Geographic situation The Russian Federation is situated in Eastern Europe and Northern Asia, and borders the Arctic Ocean between Europe and the Northern Pacific Ocean. With a total land area of 17,075,400 km², it is the largest country in the world. Its land boundaries total 19,990 km and it shares land borders with Azerbaijan, Belarus, China, the Democratic People’s Republic of Korea, Estonia, Finland, Georgia, Kazakhstan, Latvia, Lithuania, Mongolia, Norway, Poland and Ukraine, and maritime boundaries with Japan and the United States. Political system The Russian Federation is a federal republic. Its new Constitution was adopted on 12 December 1993. The Constitution created a two-chamber legislature: the lower house or State Duma, with 450 deputies elected by constituencies, and the upper house or Federation Council, with 178 deputies, two from each of the Russian Federation’s 89 republics and regions. The head of State is the President, elected for a four-year term. The country is administratively divided into 49 oblasts , 21 republics, 10 autonomous okrugs , 6 krays , 2 federal cities (Moscow and St Petersburg), and 1 autonomous oblast 2 . The recent creation of seven federal districts headed by presidential representatives is aimed at ensuring that regional legislation complies with federal law and at strengthening the federal authorities’ control over the regions. 2 In the following these entities will be referred to as regions. B. Economy Overall economic development In the aftermath of the Soviet Union’s disintegration, the Russian Federation’s economy was marked by collapsing output and surging inflation. Twelve years later, the Russian Federation is still actively establishing an effective market economy and beginning to achieve strong economic growth. By the end of 1997, it had made economic progress. Inflation had been brought under control, the rouble had stabilized, and an ambitious privatization programme had transferred thousands of enterprises into private ownership. The financial collapse in August 1998 brought this positive development to an abrupt halt. Annual inflation, which had fallen to a post-Soviet low of 6.4% at the end of June 1998, reached 84.5% by end of that year. However, the feared return to hyperinflation did not materialize, and inflation fell to 36.5% at the end of 1999; in the first quarter of 2003 inflation was at 14.6%. The sharp devaluation of the rouble in August 1998 delivered a stronger than expected boost to the Russian economy. Gross industrial output, which had fallen continuously since 1990, jumped by 9.4% in 1999, as Russian enterprises took advantage of the gains in competitiveness brought about by devaluation. The rise in international oil prices helped to sustain the recovery in 2000, when industrial output rose by another 12.4% and this underpinned real GDP growth of 10% - the best economic performance in 30 years. Growth slowed in 2001 and 2002, to 5% and 4.3% respectively, and the engine of growth shifted from net exports to domestic demand. The growth rate for 2003 is estimated at 6.2%. 3 3 EIU, Country Profile Russian Federation: 2003.
A. General information Geographic situation The Russian Federation is situated in Eastern Europe and Northern Asia, and borders the Arctic Ocean between Europe and the Northern Pacific Ocean. With a total land area of 17,075,400 km², it is the largest country in the world. Its land boundaries total 19,990 km and it shares land borders with Azerbaijan, Belarus, China, the Democratic People’s Republic of Korea, Estonia, Finland, Georgia, Kazakhstan, Latvia, Lithuania, Mongolia, Norway, Poland and Ukraine, and maritime boundaries with Japan and the United States. Political system The Russian Federation is a federal republic. Its new Constitution was adopted on 12 December 1993. The Constitution created a two-chamber legislature: the lower house or State Duma, with 450 deputies elected by constituencies, and the upper house or Federation Council, with 178 deputies, two from each of the Russian Federation’s 89 republics and regions. The head of State is the President, elected for a four-year term. The country is administratively divided into 49 oblasts, 21 republics, 10 autonomous okrugs, 6 krays, 2 federal cities (Moscow and St Petersburg), and 1 autonomous oblast2. The recent creation of seven federal districts headed by presidential representatives is aimed at ensuring that regional legislation complies with federal law and at strengthening the federal authorities’ control over the regions.
2 In the following these entities will be referred to as regions.
B. Economy Overall economic development In the aftermath of the Soviet Union’s disintegration, the Russian Federation’s economy was marked by collapsing output and surging inflation. Twelve years later, the Russian Federation is still actively establishing an effective market economy and beginning to achieve strong economic growth. By the end of 1997, it had made economic progress. Inflation had been brought under control, the rouble had stabilized, and an ambitious privatization programme had transferred thousands of enterprises into private ownership. The financial collapse in August 1998 brought this positive development to an abrupt halt. Annual inflation, which had fallen to a post-Soviet low of 6.4% at the end of June 1998, reached 84.5% by end of that year. However, the feared return to hyperinflation did not materialize, and inflation fell to 36.5% at the end of 1999; in the first quarter of 2003 inflation was at 14.6%. The sharp devaluation of the rouble in August 1998 delivered a stronger than expected boost to the Russian economy. Gross industrial output, which had fallen continuously since 1990, jumped by 9.4% in 1999, as Russian enterprises took advantage of the gains in competitiveness brought about by devaluation. The rise in international oil prices helped to sustain the recovery in 2000, when industrial output rose by another 12.4% and this underpinned real GDP growth of 10% - the best economic performance in 30 years. Growth slowed in 2001 and 2002, to 5% and 4.3% respectively, and the engine of growth shifted from net exports to domestic demand. The growth rate for 2003 is estimated at 6.2%.3
3 EIU, Country Profile Russian Federation: 2003.
Country Profiles on the Housing Sector - Russia
22
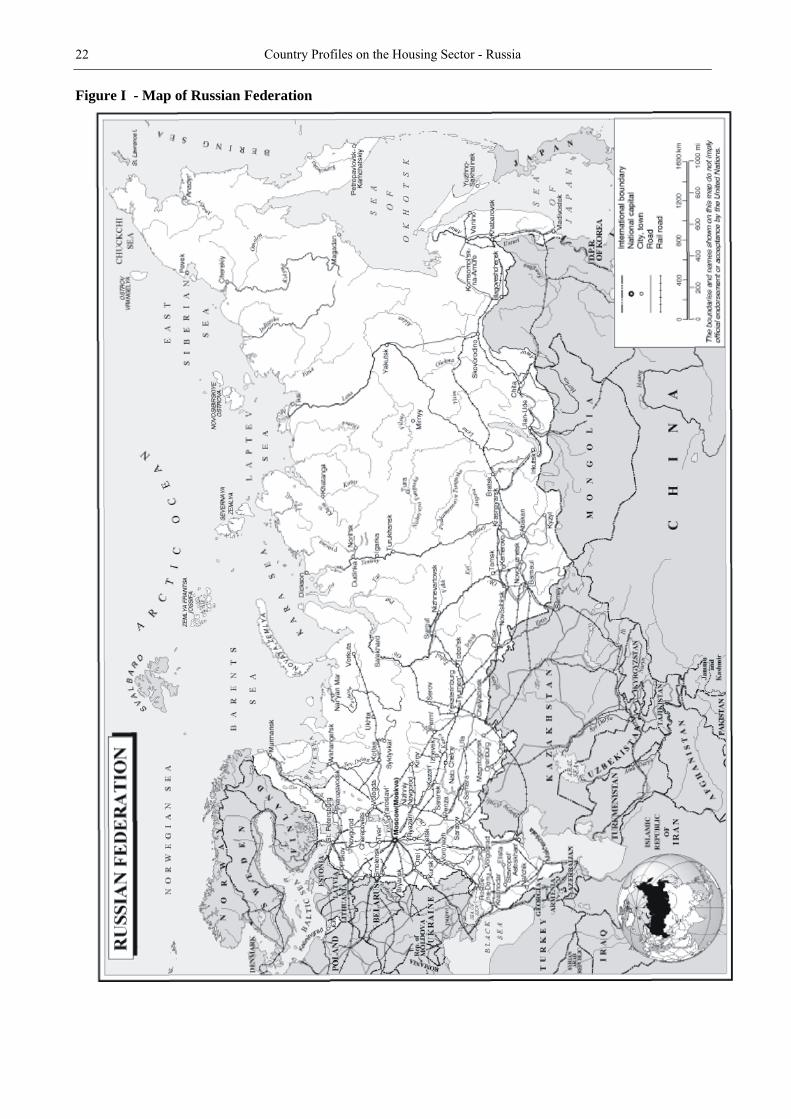
Figure I - Map of Russian Federation
The Socio-Economic Framework 23 _______________________________________________________________________________________________________________________________________________________________
Wages and income The collapse in the economy following the Soviet Union’s disintegration had its effect on wages and, consequently, living standards. According to the official Goskomstat estimates, the ratio of the average monthly wages and other payments to the subsistence level of the working population has decreased from 335% in 1991 to 207% in 2001. Although it is argued that living standards have not been as badly affected as official statistics might suggest – partly due to the notorious underreporting of wages to avoid taxation – there is, however, little doubt that living standards were hit hard by the market reforms.
Wages are by far not the only source of household income. Other sources such as transfers from the State (pensions, unemployment benefits, allowances, etc.) as well as cash and non-cash income from home production and the informal sector, sales/rentals of personal property and dividends made up slightly more than 50% of average household income in 2001.4 The structure of household income sources has changed markedly during the past decade with increasingly less income coming from the public sector. In addition to a lesser share of the population working for the public sector, those who do work there find it necessary to complement public sector wages by other sources of income, as public sector wages as a rule are too low to secure a living. Multiple jobs held by one individual is therefore a strong feature of the Russian Federation’s labour market. Compared to other countries in transition, however, the shift to private sector employment has been relatively slow. While in 1992, nearly 95% of wage income reported by households was earned from work for State-owned organizations, this proportion had fallen only to 71% by 2000. The main reason is likely to be the slow growth of small and medium-sized enterprises in
4 According to information from the Russia Longitudinal Monitoring Survey, 2002.
the Russian Federation, which often account for a large share of total employment growth in other industrialized countries.5 As household incomes fell in the 1990s, income inequality increased dramatically. The transition has been associated with a large increase in wage differentials – across regions, across industries and sectors, and across types of workers. According to official estimates, the Gini coefficient rose from 0.289 to 0.396 between 1992 and 2001, demonstrating the growing inequality in society. According to Goskomstat the lowest income quintile of the population today earns 5.9%, while the highest income quintile earns 47% (2002). The UNDP common country assessment found that wage inequality as well as its increase during the period of transition is much greater in the Russian Federation than in other countries in transition including Hungary, Poland, the Czech Republic and Slovakia.6 Unemployment Parallel to declining incomes, unemployment increased. Between 1992 and 1998 it rose from 5.2% to 13.3%. It began decreasing only in 1998 and reached 8.8% in 2002, which however is still well above the 1992 level. Although the unemployment rate in the Russian Federation seems large, it is comparable to that of West European countries, such as France and Germany. There are, however, large regional variations in the unemployment rate ranging from 1% in Moscow to 23% in the Ingush Republic. Furthermore, according to a study conducted by UNDP in 2002, there is some evidence that regional variations in unemployment have increased over time.7 Unemployment also varies across age groups, with young people facing the highest rates. In November 2000, unemployment was as high as 35.1% among those under the age of 20 and 16.6% for youth aged 20-24 years. The absolute number of unemployed in these two age groups more than doubled between 1992 and 2000.8
5 UNDP, Common Country Assessment: 2002. 6 UNDP, Common Country Assessment: 2002. 7 UNDP, Common Country Assessment: 2002. 8 UNDP, Common Country Assessment: 2002.
24 Country Profiles on the Housing Sector - Russia
Source: UNECE, Economic Survey of Europe 2003, based on the Russian Federation Goskomstat's monthly estimates according to the ILO definition, i.e. including all persons not having employment but actively seeking work. Figure II. Unemployment
One characteristic of the situation in the Russian Federation is that the persistently unemployed constitute a very large share of the unemployed. According to UNDP, the proportion of unemployed individuals who were unemployed for over a year increased rapidly – from 18.2% in 1993 to 40.3% in 1998 and to 42.3% in 2000.9 Persistent unemployment tends to be concentrated in certain geographical regions, especially those that have experienced little economic growth. The lack of regional labour mobility is a problem.10 9 UNDP: Common Country Assessment: 2002. 10 UNDP, Common Country Assessment: 2002.
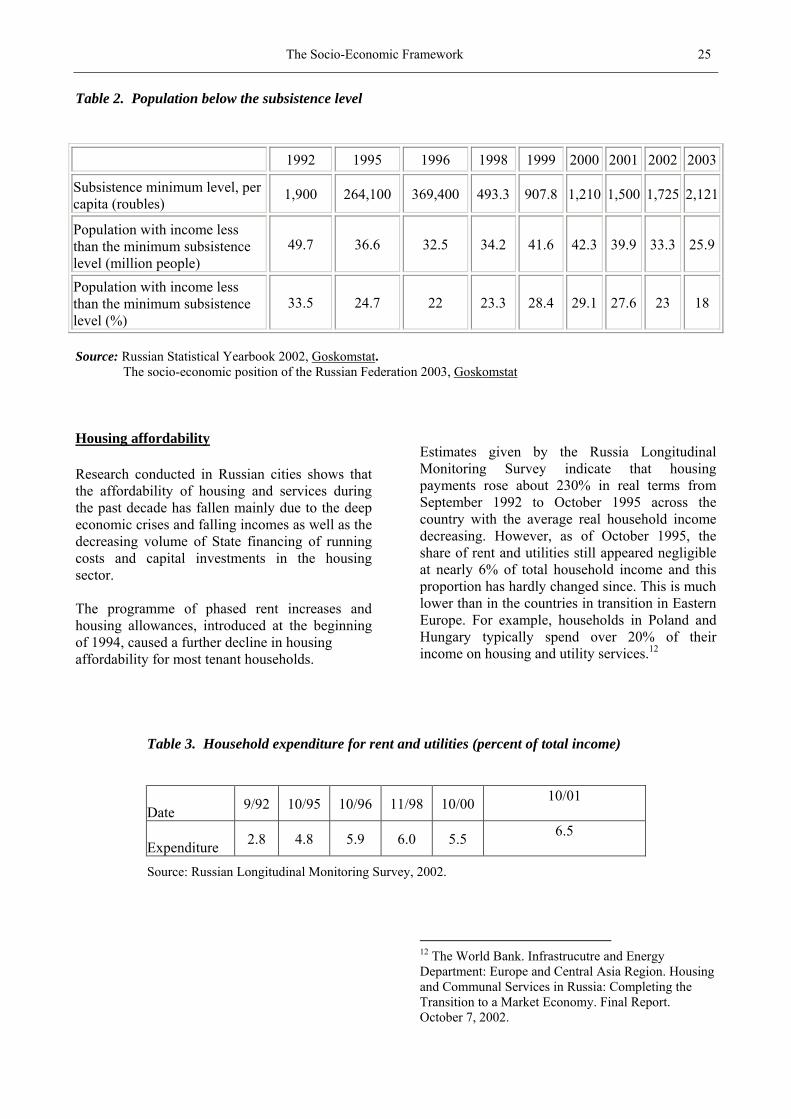
Poverty The economic contraction during much of the transition coupled with declining wages as a result of the sharp drop in the number of public sector jobs and the decline in real public sector wages as well as rising income inequality led to a sharp increase in poverty, with children aged 7-15 and women being affected most.11 However, with economic growth resuming the incidence of poverty is declining. The number of people with incomes below the subsistence level is at its lowest since the early 1990s, according to official Goskomstat data.
The socio-economic position of the Russian Federation 2003, Goskomstat
Housing affordability Research conducted in Russian cities shows that the affordability of housing and services during the past decade has fallen mainly due to the deep economic crises and falling incomes as well as the decreasing volume of State financing of running costs and capital investments in the housing sector. The programme of phased rent increases and housing allowances, introduced at the beginning of 1994, caused a further decline in housing affordability for most tenant households.
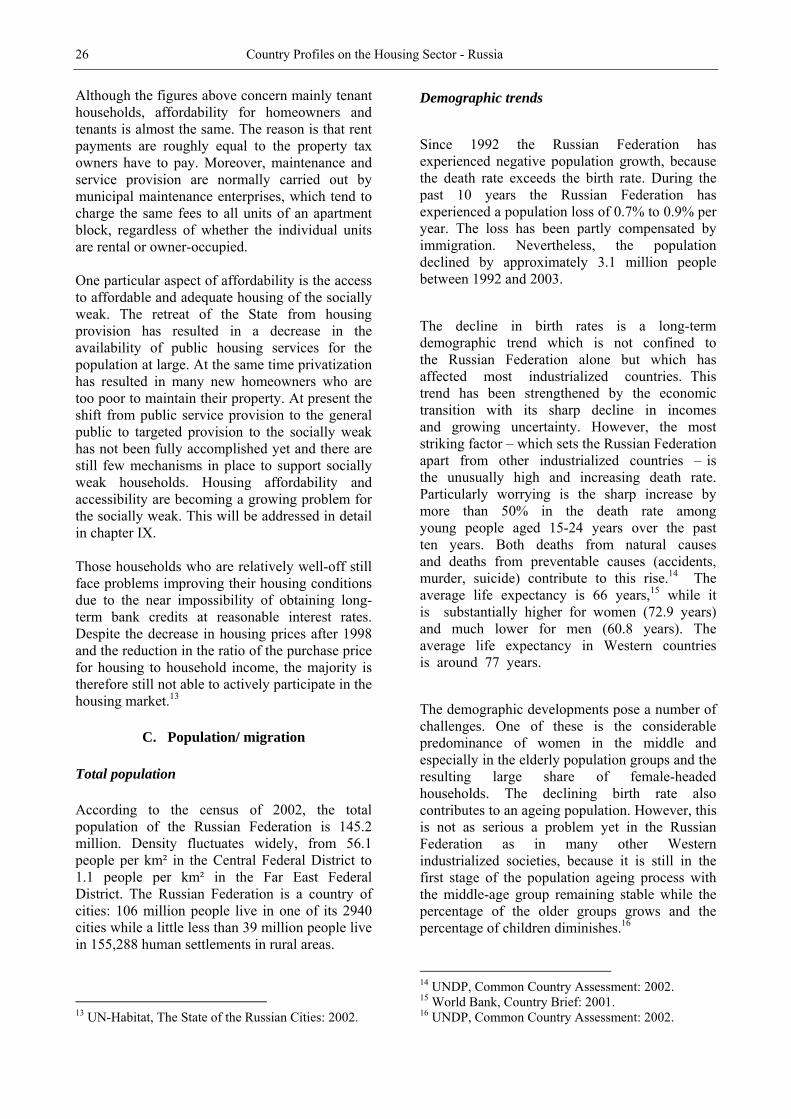
Estimates given by the Russia Longitudinal Monitoring Survey indicate that housing payments rose about 230% in real terms from September 1992 to October 1995 across the country with the average real household income decreasing. However, as of October 1995, the share of rent and utilities still appeared negligible at nearly 6% of total household income and this proportion has hardly changed since. This is much lower than in the countries in transition in Eastern Europe. For example, households in Poland and Hungary typically spend over 20% of their income on housing and utility services.12
12 The World Bank. Infrastrucutre and Energy Department: Europe and Central Asia Region. Housing and Communal Services in Russia: Completing the Transition to a Market Economy. Final Report. October 7, 2002.
Table 3. Household expenditure for rent and utilities (percent of total income)
26 Country Profiles on the Housing Sector - Russia
Although the figures above concern mainly tenant households, affordability for homeowners and tenants is almost the same. The reason is that rent payments are roughly equal to the property tax owners have to pay. Moreover, maintenance and service provision are normally carried out by municipal maintenance enterprises, which tend to charge the same fees to all units of an apartment block, regardless of whether the individual units are rental or owner-occupied. One particular aspect of affordability is the access to affordable and adequate housing of the socially weak. The retreat of the State from housing provision has resulted in a decrease in the availability of public housing services for the population at large. At the same time privatization has resulted in many new homeowners who are too poor to maintain their property. At present the shift from public service provision to the general public to targeted provision to the socially weak has not been fully accomplished yet and there are still few mechanisms in place to support socially weak households. Housing affordability and accessibility are becoming a growing problem for the socially weak. This will be addressed in detail in chapter IX. Those households who are relatively well-off still face problems improving their housing conditions due to the near impossibility of obtaining long-term bank credits at reasonable interest rates. Despite the decrease in housing prices after 1998 and the reduction in the ratio of the purchase price for housing to household income, the majority is therefore still not able to actively participate in the housing market.13
C. Population/ migration Total population According to the census of 2002, the total population of the Russian Federation is 145.2 million. Density fluctuates widely, from 56.1 people per km² in the Central Federal District to 1.1 people per km² in the Far East Federal District. The Russian Federation is a country of cities: 106 million people live in one of its 2940 cities while a little less than 39 million people live in 155,288 human settlements in rural areas. 13 UN-Habitat, The State of the Russian Cities: 2002.
Demographic trends
Since 1992 the Russian Federation has experienced negative population growth, because the death rate exceeds the birth rate. During the past 10 years the Russian Federation has experienced a population loss of 0.7% to 0.9% per year. The loss has been partly compensated by immigration. Nevertheless, the population declined by approximately 3.1 million people between 1992 and 2003. The decline in birth rates is a long-term demographic trend which is not confined to the Russian Federation alone but which has affected most industrialized countries. This trend has been strengthened by the economic transition with its sharp decline in incomes and growing uncertainty. However, the most striking factor – which sets the Russian Federation apart from other industrialized countries – is the unusually high and increasing death rate. Particularly worrying is the sharp increase by more than 50% in the death rate among young people aged 15-24 years over the past ten years. Both deaths from natural causes and deaths from preventable causes (accidents, murder, suicide) contribute to this rise.14 The average life expectancy is 66 years,15 while it is substantially higher for women (72.9 years) and much lower for men (60.8 years). The average life expectancy in Western countries is around 77 years. The demographic developments pose a number of challenges. One of these is the considerable predominance of women in the middle and especially in the elderly population groups and the resulting large share of female-headed households. The declining birth rate also contributes to an ageing population. However, this is not as serious a problem yet in the Russian Federation as in many other Western industrialized societies, because it is still in the first stage of the population ageing process with the middle-age group remaining stable while the percentage of the older groups grows and the percentage of children diminishes.16 14 UNDP, Common Country Assessment: 2002. 15 World Bank, Country Brief: 2001. 16 UNDP, Common Country Assessment: 2002.
The Socio-Economic Framework ________________________________________________________________________________________________________________________________________________________________
27
Migration The migratory patterns in the Russian Federation during the past decade saw a reversal in some of the traditional trends. While the rural population has steadily declined in both absolute and relative terms since the beginning of the 20th century, this trend decreased sharply in 1989 and reversed into an urban-to-rural flow in 1992 and 1993. The economic collapse during those early years of transition affected the urban areas the most, while the impact was slightly softer in rural areas due to possibilities for self-sufficiency. While the flow of people from rural to urban areas continued from 1994 onwards, it took place at a reduced pace than in the late 1980s. However, owing to the net immigration of ethnic Russians from other former Soviet republics, the rural population has continued to increase in absolute terms since 1992.17 Another reversal of earlier trends is the migratory movement from the north-east to the south-west
17 UNDP, Common Country Assessment: 2002.
of the country, which has characterized the past decade. The northern region contains the majority of the nation’s natural resources. During the Soviet era the Government regarded the industrial development of the north as strategic priority and, therefore, channelled large subsidies to the region and encouraged large-scale labour inflow. These policies resulted in the north having a relative large population, which would not have developed under normal circumstances, i.e. without the large subsidies. The transition resulted in a sharp reduction in these subsidies, which in turn resulted in some people leaving the north because there are no economic opportunities. Citizens who relocate from the far north and other areas of equal status are eligible for housing subsidies from the federal budget if they meet certain conditions. The criteria for eligibility and the amount of subsidies are regulated by the federal Law on Housing Subsidies for Citizens Moving from Regions of the Far North and Areas of Equal Status.18