16 CHAPTER II GROWTH AND DEVELOPMENT OF RETAILING: GLOBAL & INDIAN SCENARIO INTRODUCTION This chapter deals with concepts and evolution of retailing; growth and development of global retailing; non store retailing and special emphasis on Asia Pacific grocery retailing and exclusively focusing on Indian retailing in general and growth and development of food & grocery retailing in particular followed by an overview of south Indian & Hyderabad retailing. Finally, this chapter ends with stating the changing trends of store base grocery retail formats. 2.1 Retailing Concept The word “Retail” is derived from the French Word “Retaillier ” meaning to ‘cut a piece off’ or ’to break bulk’. In simple terms this means a firsthand transaction with the customer. Retailing thus might be understood as the final step in the distribution of merchandise, for consumption by the end consumers. It thus consisted of all activities involved in the marketing of goods and services directly to the consumers for their personal, family or household use. Retailing involves a direct interface with the customer and the coordination of business activities from end to end- right from the concept or design stage of a product or offering, to its delivery and post-delivery service to the customer. Retailing forms an integral part of the Marketing Mix. In this marketing mix “Place” refers to the distribution and availability of the products at the various
Transcript
16
CHAPTER II
GROWTH AND DEVELOPMENT OF RETAILING: GLOBAL & INDIAN SCENARIO
INTRODUCTION
This chapter deals with concepts and evolution of retailing; growth and
development of global retailing; non store retailing and special emphasis on
Asia Pacific grocery retailing and exclusively focusing on Indian retailing in
general and growth and development of food & grocery retailing in particular
followed by an overview of south Indian & Hyderabad retailing. Finally, this
chapter ends with stating the changing trends of store base grocery retail
formats.
2.1 Retailing Concept
The word “Retail” is derived from the French Word “Retaillier” meaning to
‘cut a piece off’ or ’to break bulk’. In simple terms this means a firsthand
transaction with the customer. Retailing thus might be understood as the final
step in the distribution of merchandise, for consumption by the end consumers.
It thus consisted of all activities involved in the marketing of goods and
services directly to the consumers for their personal, family or household use.
Retailing involves a direct interface with the customer and the coordination of
business activities from end to end- right from the concept or design stage of a
product or offering, to its delivery and post-delivery service to the customer.
Retailing forms an integral part of the Marketing Mix. In this marketing mix
“Place” refers to the distribution and availability of the products at the various
17
locations. Customers were first introduced to the product through the retail
stores. Organizations would sell their products and services through these
stores and also simultaneously get a feedback on the performance of the
product and the customer’s expectations of the product. Retail stores would
also serve as the communication hub of the customer. At the point of sale or the
point of purchase, the customer would transmit information to the Marketing
Manager through the retailer.
Retail was the final stage of any economic activity. By virtue of this
fact, retail occupied an important place in the world of economy. According to
Philip Kotler:“Retail includes all the activities involved in selling goods or
services to the final consumers for personal, non-business use. A retailer or
retail store was any business enterprise whose sales volume comes primarily
from retailing.
Any organization selling to final consumers whether it was a manufacturer,
wholesaler or retailer- was doing retailing. It would not matter how the goods
or services were sold (by person, mail, telephone, vending machine, or internet
or where they are sold- in a store, on the street, or in the consumer’s home)”.
The North American Industry Classification system (NAICS) specifies that the
retail trade sector comprises establishments primarily engaged in retailing
merchandise, generally without transformation, and rendering services
incidental to the sale of merchandise.
18
2.2 Evolution of Retailing
A revolution in the shopping habits of the people across the entire world had
virtually brought the supermarket to the main street. This revolution was
unparalleled in human history as it had engendered the development of
distribution system that delivers food and other products to the consumer in
unprecedented abundance, variety and quality. It had gone through its natural
process of evolution in all areas from the initial concept of the supermarket and
department store to the hypermarket and shopping mall. It was believed that the
first true department store in the world was founded in Paris in 1852 by
Aristide Boucicaut and was named Bon Marche. Then, the department store
business was a bare-bones operation. It was only after World War II that
retailers in the West began to upgrade their services, facilities and merchandise
selection to offer a fascinating array of additional benefits to consumers
through organized retailing.
In the early part of the twentieth century, the consumers, while shopping
for their household purpose, bought different products at different shops and at
different places. It was back then that chain stores which existed such as the
Great Atlantic and Pacific Tea Company (now known as the ‘A & P’ chain of
stores) started introducing new methods of food selling. Soon these chain stores
too began to sell different products under one roof (one-stop shopping). This
chain store revolution had compelled the small merchants to open self-service
stores of their own in order to reduce business expenses and compete with
chain store prices. The supermarket revolution was first sparked off its span in
19
the 1920s and by the 1930s; the self- service supermarket concept had become
quite popular with the housewives. It was sparked off by the success of
Michael Cullen, an independent operator who opened the King Kullen
supermarket in Jamaica, New York. In 1950s, it had won acclaim almost
throughout America. It was in the mid-1930s, that A & P too opened its first
supermarket in the mid-West. Very soon other chains followed, and large
supermarkets replacing groups of small stores everywhere. As supermarket
grew, they extended the self-service concept to other foods besides groceries.
In the 1940s, pre-packing of food and groceries began and customers liked the
speed and convenience of picking up a package of products that had already
been weighed and priced. Over a period of time, this pre-packaging and
supermarket of self- service had become the rule rather than an exception all
over America. By the late 1950s, about 40 % of the American population was
buying food and groceries from these organized retail stores.
However, the competition among the retail stores were so fierce that it had
not only precipitated dramatic changes in the international retailing industry,
especially in the latter half of the twentieth century, but also promises to
unleash more excitement in this new millennium. Many of the old and informal
store formats had been completely transformed into the scientifically designed
new formats.
2.3 Global Retailing Scenario
The latter half of the 20th Century, in both Europe and North America, has
seen the emergence of the supermarket as the dominant grocery retail form.
20
The reasons why supermarkets have come to dominate food retailing are not
hard to find. The search for convenience in food shopping and consumption,
coupled to car ownership, led to the birth of the supermarket. As incomes rose
and shoppers sought both convenience and new tastes and stimulation,
supermarkets were able to expand the products offered. The invention of the
bar code allowed a store to manage thousands of items and their prices and led
to 'just-in-time' store replenishment and the ability to carry tens of thousands of
individual items. Computer-operated depots and logistical systems integrated
store replenishment with consumer demand in a single electronic system. The
superstore was born. On the Global Retail Stage, little has remained the same
over the last decade. One of the few similarities with today is that Wal-Mart
was ranked the top retailer in the world then and it still holds that distinction.
Other than Wal-Mart’s dominance, there’s little about today’s environment that
looks like the mid-1990s. The global economy has changed, consumer demand
has shifted, and retailers’ operating systems today are infused with far more
technology than was the case six years ago. Saturated home markets, fierce
competition and restrictive legislation have relentlessly pushed major food
retailers into the globalization mode. Since the mid-1990s, numerous
governments have opened up their economies as well, to the free markets and
foreign investment that has been a plus for many a retailer. However, a more
near-term concern, has been the global economic slowdown that has resulted
from dramatic cutback in corporate IT and other types of capital spending.
Consumers themselves have become much more price sensitive and
21
conservative in their buying, particularly in the more advanced economies.
From an operational point of view, active practitioners have voiced their
opinion that retailer concerns in 2003 have turned to deflation, lack of pricing
power, global over-capacity, low interest rates, economic stagnation, slump in
world tourism and declining consumer confidence. But, even before the global
economic slowdown that forced retailers into monitoring costs more
effectively, technological advances were a way of life in retail organizations.
Technology has become the real enabler for retailers over the last six years.
Supply chain innovations for retailers were particularly strong in the second
half of the 1990s and have continued into today. With all the emphasis on
technology and cost-cutting, a major thrust of retailers continues to be demand-
based: finding new markets through globalization efforts. In 1990’s, more than
half (53 percent) of the top 200 retailers operated in only one country. Today,
only 44 per cent remain single-country merchants. This globalization trend can
only intensify in the years ahead. The benefits of increased sales and greater
economies of scale are too large to be ignored.
The global retail industry has travelled a long way from a small
beginning to an industry where the world wide retail sales alone are valued at $
12.1 trillion (Source: 2009 Global Retail Report, Data monitor). The top 200
retailers alone account for 30% of world-wide demand. Retail sales being
generally driven by people’s ability (disposable income) and willingness
(consumer confidence) to buy, compliments the fact that the money spent on
household consumption worldwide increased 78% between 2005 and 2010.
22
The leader has in-disputably been the USA where some two-thirds or $ 6.6
trillion out of the $ 10 trillion American economy is consumer spending. About
40% of that ($ 3 trillion) is spending on discretionary products and services.
Retail turnover in the EU is approximately Euros 2000 billion and the sector
average growth looks to be following an upward pattern. The Asian economies
(excluding Japan) are expected to grow at 6% consistently till 2009-10.
Positive forces at work in retail consumer markets today include high rates of
personal expenditures, low interest rates, low unemployment and very low
inflation. Negative factors that hold retail sales back involve weakening
consumer confidence.
From the very inception of retail business, retailers had been involved in
international trade, with their involvement primarily centering on the
procurement of merchandise. However, retailers from all over the world were
venturing beyond their own borders to establish stores even in other countries.
Thus, the business of retailing could become a global business. Over the last
decade, it was found that there had been sweeping changes in the general
retailing business for various reasons like:
Ø Changing demographics and industry structure
Ø Immense impact of communication technology that had made a major
contribution towards educating consumers about the products and services
they require and the internet explosion is bound to further this trend
Ø Fierce competition that put great emphasis on lower costs and prices
Ø Emphasis on greater convenience and service
Ø Focus on productivity and added experimentation
23
Ø Continuing growth of non-store retailing
The world over retail business was dominated by smaller family run chain
stores and regionally targeted stores, but gradually more and more markets in
the western world were being taken over by billion dollar multinational
conglomerates such as Wal-Mart, Sears, Mc Donald’s, Marks and Spencer. A
major development in recent times had been the emergence of varied retail
formats that had started operating in most product categories. For instance,
there were large department stores that offer a huge assortment of goods and
services. There were discount stores that offer a wide array of products and
compete mainly on price. There were also the high-end retailers who target
extremely niche markets. Over the past few decades, retail formats had been
changed radically worldwide. The basic department stores and cooperatives of
the early 20th century had been given way to mass merchandise( Wal-Mart),
stores (7-Eleven). The global retailing industry group is defined here as the
sum of six segments, each comprising only business to consumer (B2C) sales
for the following groups of products:
The apparel, accessories, and luxury goods segment includes menswear,
women-wear, children-wear, footwear, watches, jewellery and related products.
The food and grocery segment includes food, beverages, tobacco, household
care, personal care, and related products. The electrical and electronics segment
includes audio-visual equipment, fixed and mobile telecommunications
24
equipment, computers and peripherals, domestic appliances, photographic
equipment, games consoles, and related products. The house and garden
segment includes carpets and floor coverings, domestic furniture, garden
products, home improvement products, and related goods. The media products
segment includes books, newspapers, stationery, recorded music and video, and
related products.
2.4 The Far East Experience:
The Food Retail Industry in the Far East has evolved into what could be called
‘the breeding ground’ for emerging models with countries like Singapore
being the home to some of the big players in the industry in these parts of the
world. The presence of all the major players of the retailing industry is found in
Singapore. Singapore has 2 hypermarkets, one run by Carrefour and the other
by Giant Hypermarket, part of Dairy Farm International. According to the
government, there are slightly more than 11,000 market stalls operating in 150
markets located all across Singapore Island. The markets further spread to
China, Thailand, and Malaysia thanks to the major support that the local
governments provided in creating the necessary regulatory framework in
establishing their presence. Singapore, Malaysia and Thailand not only fueled
the retail industry within the country, but also attracted hordes of tourists to
experience the shopping “experiences” that they created in these islands. The
markets are now saturated with no additional space for a new entrant and are
expected to consolidate within the next few years. Apart from Singapore,
which is a more recent development, Japan enjoys an active spot on the
25
retailers’ map. According to the latest annual report from the U.S. Census
Bureau(2009) the toral amount of sales for U.S. retail industry (including food
services and automation) was U.S.$ 4.13 trillion. The leaders in sales are Ito-
Yokado, Aeon, Daiei, Takashimaya, and Uny, in that order. Several retailers,
however, have made recent improvements in their warehousing and distribution
technologies to make their presence felt in the Japanese market. Convenience
stores, which are small and suitable in a country where land is very expensive,
continue to do well. Food, in fact, has been one of the few sectors that have
experienced growth over the last several years. A period of shake up in the
industry is likely now that Wal-Mart has entered Japan. Numerous smaller,
less efficient retailers may become takeover targets. The entire Japanese retail
sector will likely undergo some form of restructuring over the next decade as a
result of overcapacity, dismal profits and the Wal-Mart factor. In Mainland
China, the retail markets have mushroomed over the years of intense economic
development to a very considerable size. The total volume of retail sales for
consumer goods and food increased by 10.6 percent in China over the last
couple of years which shows tremendous growth. Consumer spending has held
strong. A decade ago, the top five retail enterprises in China were all traditional
merchandise companies, but now the top five are mainly supermarkets and
chain stores. The world is enamoured with China’s potential and opportunities.
But in medium-sized and small cities and rural areas, traditional retailing
methods, such as department stores and local retailing networks, will be
sufficient, as consumption is lower. In Indonesia, Wet markets and
26
supermarkets remained the major distribution channels for food products.
Although these retail sub-sectors also offered non-food products, such as
household goods, food products remained dominant in terms of the number of
items. Wet markets’ distribution of food products tended to be much greater
than non-food as these retail channels mainly provided fresh produce.
Conversely, supermarkets had an almost equal distribution, with food taking up
the greater proportion. On the other hand, the distribution of non-food products
benefited from both food and non-food retailers. For example, some food retail
formats offered non-food items, such as supermarkets, hypermarkets, and
convenience stores. These retail outlets provided some basic non-food
products, such as toothpaste, soap, or detergent. However, non-food retail
outlets rarely provided food items, except certain department stores or
druggists. In Malaysia, a majority of food retailer outlets offer food and non-
food items, with at least a 70:30 distribution. The traditional food distribution
system in Thailand is through so-called 'wet markets' which sell fruits,
vegetables, meat and fish, together with small 'mom and pop' food stores
which distribute dry goods. However, the rapid growth of the economy,
particularly during the decade before the financial crisis began, has led to
dramatic changes in the structure of the food-retailing sector. Modern
supermarkets, superstores, hypermarkets and convenience stores developed at
breakneck pace to service the growing middle class with their demand for more
sophisticated food stores and a greater variety of products many of which were
imported.
27
Global Retailing industry profile provides top-line qualitative and
quantitative summary information including: market size (value 2001-2010,
and forecast 2010 to 2015). The profile also contains descriptions of the
leading players including key financial metrics and analysis of competitive
pressures within the market. Essential resource for top-line data and analysis
covering the Global retailing market. Includes market size and segmentation
data, textual and graphical analysis of market growth trends, leading companies
and macroeconomic information.
Highlights29
• The global retailing industry group is defined here as the sum of six
segments, each comprising only business to consumer (B2C) sales for
the following groups of products:
• The global retailing industry had total revenues of US$12104 billion in
2009, representing a compound annual growth rate (CAGR) of 4.7% for
the period spanning 2005-2010.
• The food and grocery segment was the industries most lucrative in 2010,
with total revenues of $6,630.2 billion, equivalent to 63% of the
industry's overall value.
• The performance of the industry is forecast to accelerate, with an
anticipated CAGR of 4.6% for the five-year period 2010-2015, which is
expected to drive the industry to a value of $13,206.3 billion by the end
of 2015.
29 Global Retailing, Marketline (September 13, 2011), Pub ID: MTLN6554975
28
2.5 Global Retail Industry and economy
The retail industry had contributed to the economic growth of many countries
and was undoubtedly one of the fastest changing and dynamic industries in the
world today. With total sales of more than US$ 9 trillion, retailing was the
world’s largest private industry, ahead of finance (US $5.1trillion) and
engineering (US$ 3.2 trillion). Some of the world’s largest companies were in
this sector: over 50 Fortune 500 companies and around 25 of the Asian top 200
firms were retailers. Even as the developing countries were making rapid
strides in this industry, organized Retail was currently dominated by the
developed countries with the USA, EU & Japan constituting 80% of world.
Retail was a significant contributor to the overall economic activity the world
over: the total Retail share in the World GDP was 27% while in the USA it
accounted for 22% of the GDP. The share of organized Retail in the developing
markets ranged between 20% to 55%.Traditionally, local players tend to
dominate in their home markets. Wal-Mart, the world’s leading retailer in U.S.,
it delivered solid financial performance for fiscal year 2011. Its’ net sales are
increased by 3.4 percent to $419 billion from $ 405,312 in 2010 and operating
income by 6.4 percent to more than $25 billion. Similarly, Tesco net sales are
increased by 8.1 percent to £ 56,910 million in 2011 from £ 563,898 million.
The main value propositions that most large retailers use were a combination of
low price, ‘all-under-one-roof’ convenience and ‘neighbourhood’ availability.
Globally, retailing was customer-centric with an emphasis on innovation
in products, processes and services. A bustling global economy, competitive
29
pressures and heated merger activity fuelled the churn in the ranking of the
nation's top retailers in 1999. The Triversity Top 100 Retailers, published in the
July issue of STORES Magazine, revealed a landscape transformed by the
emergence of supermarket mega-chains and some noteworthy newcomers. The
retail industry, overall, turned in a stellar performance in 1999, posting sales of
nearly $3 trillion. The emergence of the global marketplace and the rise of the
24/7 economy had further fuelled the growth of retail across the world. The
global retailing industry, as understood under the Global Industry Classification
Standard (GICS), grew by 5.5% in 2004 to touch $ 9,498.5 billion. The global
retail sales were reached to US $ 12,104 in 2009, with an average growth of 5
percent (shown in Table 2.1).
Table 2.1The total sales of global Retail Industry from 2000 -2009
Year $billion % growth
2009 12,104.0 4.70%
2008 11,561.5 4.80%
2007 11,029.1 5.10%
2006 10,496.3 5.20%
2005 9,981.1 5.10%
2004 9,498.5 5.5%
2003 9,005.4 4.50%
2002 8,620.1 3%
2001 8,366.0 2.7%
2000 8,144.2 ___
Source: Global Retailing, published by Data monitor, 2009
30
As many as 10% of the world’s billionaires were retailers, the United States of
America dominated the world retail market space and accounted for 32.3% of
the global retailing group. Europe generated a further 30.8% of the group’s
value, Asia Pacific – 25.6% and the rest the world-27.4%. By the year 2009,
the industry was forecast to have a value of $ 12,104 billion, an increase of
27.4% since 2004. The total world retail sales break-up by sector wise, revealed
that non-grocery retailing occupied prime place in total retail sales from 2005-
2009 and continuously held its sway so far. There is a significant development
of direct retail sales growth (Shown in Figure 2.1) from 1998 to 2009.
Figure 2.1 The Global Direct Retail Sales from 1998 -2009 (US $ Billion)
Source: Global Retailing, published by World Federation of Direct
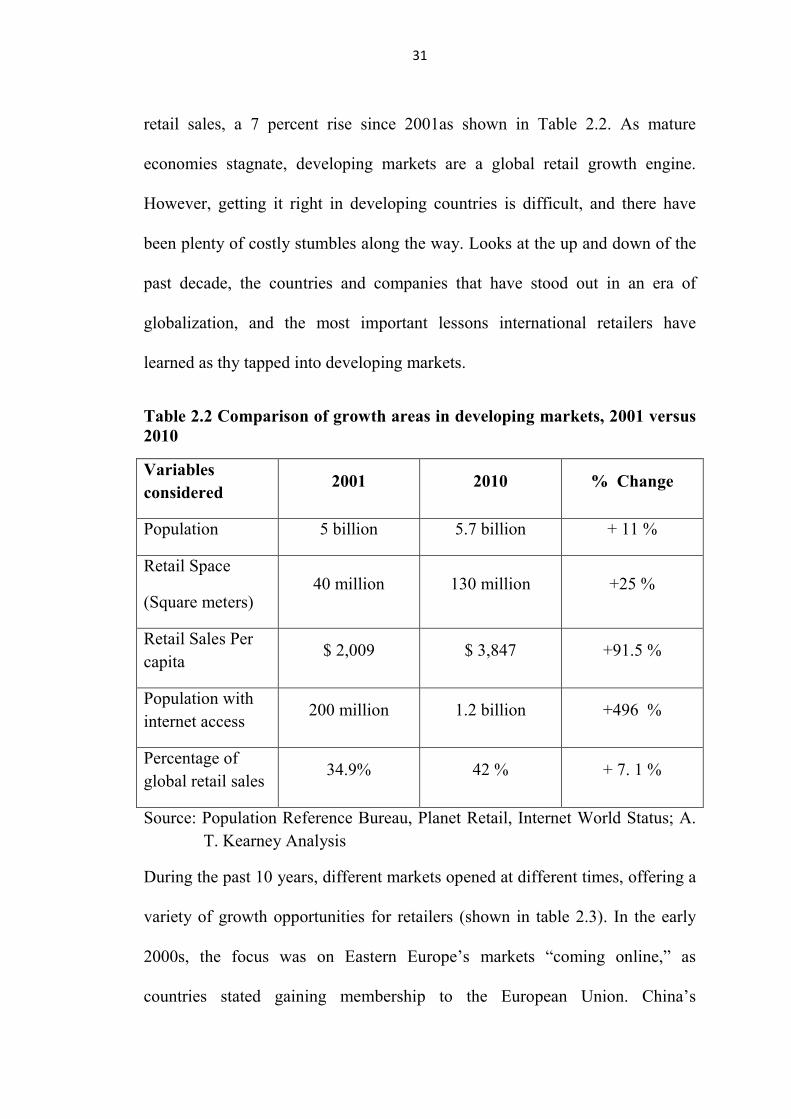
Selling Associations, 2010 By almost any measure, the retail landscape in developing markets has
experienced explosive growth over the past 10 years. As the population in these
countries increased by 11 percent, retail space expanded by 225 percent, retail
sales per capital increased almost 100 percent, and internet access grew more
than 400 percent. Developing countries now represent 42 percent of global
31
retail sales, a 7 percent rise since 2001as shown in Table 2.2. As mature
economies stagnate, developing markets are a global retail growth engine.
However, getting it right in developing countries is difficult, and there have
been plenty of costly stumbles along the way. Looks at the up and down of the
past decade, the countries and companies that have stood out in an era of
globalization, and the most important lessons international retailers have
learned as thy tapped into developing markets.
Table 2.2 Comparison of growth areas in developing markets, 2001 versus 2010
Variables considered
2001 2010 % Change
Population 5 billion 5.7 billion + 11 %
Retail Space
(Square meters) 40 million 130 million +25 %
Retail Sales Per capita
$ 2,009 $ 3,847 +91.5 %
Population with internet access
200 million 1.2 billion +496 %
Percentage of global retail sales
34.9% 42 % + 7. 1 %
Source: Population Reference Bureau, Planet Retail, Internet World Status; A. T. Kearney Analysis
During the past 10 years, different markets opened at different times, offering a
variety of growth opportunities for retailers (shown in table 2.3). In the early
2000s, the focus was on Eastern Europe’s markets “coming online,” as
countries stated gaining membership to the European Union. China’s
32
acceptance into the World Trade Organization (WTO) in 2001 marked the
opening of the market to trade and investment. Next came Southeast Asia, then
the rise of the BRIC nations (Brazil, Russia, India and China), and finally the
emergence of the Middle East and South America. While Africa has not made
its entrance onto the world retail scene yet, we believe its time will also come.
Throughout these years of change, five counties consistently ranked in the
Global Retail Development Index’s (GRDI) top 10: China, India, Russia,
Vietnam and Chile. The growth trajectory of the retail market in these countries
consistently surpassed other developing markets, as demonstrated by the
growth in retail spending per capita and retail space. Although each country is
in a different stage of retail development, they all represent significant potential
and will continue to draw the interest of leading retailers for years to come.
Table 2.3 Highlights of Global retail expansion during 2001-2010
Source: News reports; A.T. Kearney Global Retail Development Index, 10-year Retrospective, 2011
YEAR EXPANSIONS
2001 Metro enters Croatia & Home Depot enters Mexico
2002 Metro enters Vietnam
2003 Tesco enters Turkey
2004 Tesco enters China; Lidl enters Hungary & Zara enters Romania
2005 IKEA enters Turkey
2006 Carrefour enters Algeria & Media Market enters Russia
2007 Carrefour enters Kuwait
2009 Metro enters Kazakhstan; & Wal-Mart enters Chile
2010 Zara Enters India; IKEA enters Dominican Republic & Louis Vuitton enters Lebanon
33
According to A.T. Kearney’s GRDI report- 2011, the consistent growth
performance of developing countries like China, India, Russia, Vietnam and
Chile is increased phenomenally. While the retail spending has been increased
9 percent average rest of index, the modern grocery sales have been increased
by 20 percent average rest of index during 2001 – 2010. The consistent
performance of emerging retail markets is shown in figure 1.2. The following
paragraph explains the consistent performance of emerging retail markets.
Figure 2.2 GRDI’s most consistent performers during 2001-2010
Retail Spending Modern Grocery sales
(CAGR 2001 – 2010 per capita) (CAGR 2001 – 2010 area per capita)
Source: A.T. Kearney GRDI, 10- year perspective, 2011
China
China’s size has attracted international retailers for years, but the key to
success has been in estimating the market’s true value particularly the growing
middle class in the most populated regions. Understanding the Chinese
consumer is important, which several high-profile retailers discovered, albeit
too late, when they did not get their assortment, pricing or service models right.
34
Retailers also have no navigate intense domestic and foreign competition as
they seek first-move advantages in China’s rapidly developing tier 2 and 3
cities. While China slops to 6th place in the 2011 GRDI, it remains attractive to
retailers that cannot afford to ignore Chinas as part of their international growth
strategies
India
India’s sheer market size and the purchasing power of its growing middle class
have contributed to its growing middle class have contributed to its prominence
as a retail destination. The market remains quite fragmented, yet organized
retail has made impressive gains in 10 years. Regulatory challenges prevented
many retailers from entering, while others were forced into the unfamiliar
stance of entering the country with a partner. Despite the hurdles, postponing
entry into India is not an option, given the crunch for desirable real estate.
Foreign retailers that can successfully forge local partnerships and establish a
network posed for growth will find India a rewarding market.
According to Ireena Vittal, McKinsey said that she is clearly seeing five
trends in the Indian economy: (i) Shoppers are getting richer faster. India has
one of the youngest population in the world which has a high acceptance of
new brands. (ii) Many more Indians are emerging within the country
geographically and digitally. The top eight cities of India are countries in their
own right in terms of population and purchasing power. At least ten states have
developed a very large consumer base, with each going at differentiated rates.
Additionally, the online consumer base in India is going to expand four times
35
to 350 million by 2015, leading to huge opportunities for retailers. There is also
a huge base of mobile users who have already started buying through their
phones. (iii) Habits and aspirations of consumers are changing driven by supply
cycles of product upgrades. For example, the typical Indian customer changes
his mobile every eight months. (iv) volatility in cost and growth is here to stay,
especially in terms of food, cotton and power prices; and (v) the Indian industry
is going to witness more fragmentation before consolidation.
Russia
Russia has experienced a decade of remarkable double-digit retail growth and
its large and wealthy population has long been an attractive proposition for
international retailers. But Russia’s drop in the ranking in recent years
highlights how a lack of transparency in government regulations can curtail
foreign investment. A rise in consolidations among domestic players bodes
well for the possibilities of entering Russia via acquisition, yet so far this has
proven more difficult than expected because of local backlash. Competition is
rising in tier 2 and 3 cities, putting more pressure on foreign retailers hoping to
crack the Russian market.
Vietnam
All eyes were on Vietnam as it opened its borders to wholly own foreign trade
in 2009. While some retailers, particularly from Japan and Korea made
successful entries into large cities, the country has been slow in developing
infrastructure and distribution networks, hampering large-scale investment by
36
foreign retailers. Still, with improved growth forecasts in both GDP and
disposable income, Vietnam remains an attractive market for global retailers.
Chile
Chile lifted foreign direct investment restriction in 2001 and has been a target
market for international retailers ever since. A fast growing retail market and
Chilean’s high level of disposable income continues to attract foreign retailers.
Chile also has one of the most politically stable, pro-business governments in
Latin America. Although it is a small country with established, competitive
local retailers, Chile remains one of the most important markets for foreign
retailers considering a play in Latin America.
The retail landscape in developing markets has experienced explosive
growth over the past 10 years. As the population in these countries increased by
11 percent, retail space expanded by 225 percent, retail sales per capita
increased almost 100 percent, and Internet access grew more than 400 percent.
Developing countries now represent 42 percent of global retail sales. Our 10-
Year Retrospective explores how global retail has grown and changed over the
past decade. The ranks of different countries and the change from 2010 to 2011
are shown in Table 2.4
37
Table 2.4 Ranks of Retail Developing nations and change in ranks from
2010 - 2011
Country 2011- Rank 2010- Rank Change
Brazil 1 5 +4
Uruguay 2 8 +6
Chile 3 6 +3
India 4 3 -1
Kuwait 5 2 -3
China 6 1 -5
Saudi Arabia 7 4 -3
Peru 8 9 +1
U.A.E. 9 7 -2
Turkey 10 18 Source: A.T. Kearney Global Retail Development Index, 2011
Masters of Globalization – Four Retailers
According to A.T. Kearney GRDI retail perspective-2011, it is emphasized that
the four international retailers have made developing-market expansion a
priority.
Carrefour – Expansion Pioneers
Carrefour pioneered the globalization of hypermarkets and now has more than
15,660 stores in 34 countries, including more than 7,500 outside its home
market of France. International markets now represent 57 percent of
Carrefour’s sales (shown in figure 2.3). However, a recent effort to focus on a
smaller portfolio of countries resulted in Carrefour’s exit from several markets.
Between 2005 and 2009, it added eight new countries and exited nine.
38
Figure 2.3 Carrefour’s focus on a smaller portfolio of countries
Note: Carrefour withdrew from Slovakia I 2005; its remaining stores were converted to franchises in 2007, Source: Carrefour website and annual and financial reports, 2000 -2009
Metro Group – Entry Advantage
Metro Group operated a diversified group of banners and formats – including
wholesale, food retail, non-food specialty and departmental stores across 33
countries. The German – based company’s diverse portfolio of stores now
generates 61 percent of its revenue from international markets (shown in figure
2.4). Metro’s early entry into developing markets continues to bolster the
company’s overall performance.
39
Figure 2.4 Foreign Markets and Metro Groups’ Sales (61 Percent)
Source: Metro Group website and annual & financial report 2000 -09 Tesco – Spreading Globally The second most profitable retailer in the world has widespread international
reach in 14 countries, particularly in Asia and Europe. U.K based Tesco’s
international revenue has grown 27 percent annually in the past decade (shown
in figure 2.5), and it has expanded to the United States and India is the past two
years.
Figure 2.5 Tesco’s International Revenues in the past decade
Source: Tesco website and annual & financial report 2000 -09 Wal-Mart – Focusing on Developing Markets
40
The world’s largest retailer has already conquered the largest retail market (its
home market of the United States), but is continues to capitalize on the rapid
growth of developing markets in Latin America and Asia. As Wal-Mart
generates more than a quarter of its sale from 14 international markets (shown
in figure 2.6), the world watches its global expansion.
Figure 2.6 Wal-Mart’s presence in Latin America and Asia
Source: Wal-Mart website and annual & financial report 2000 -09
2.6 Non-Store Retailing Trends Non Store Retailing With the passage of time, the world is shrinking through
the advent and evolution of technology. Communication of people around the
world is now a vital aspect for every individual. People around the world are
broadening their modes of communication which now include the internet, and
social networking has become an imperative source for communication. Due to
the advent of globalization and the expansion of world markets, the global
market place has rather contracted and there are connections between all parts
of the world. This progress into technology and modernization has given a
41
great boost to companies selling products such as mobile phones and other
communicative technologies. Non-store retailing assumed a great significance
in the age of information technology especially in the developed and fast
developing countries. The following tables 2.5& 2.6 represents the changes in
non-store retailing trends in detail.
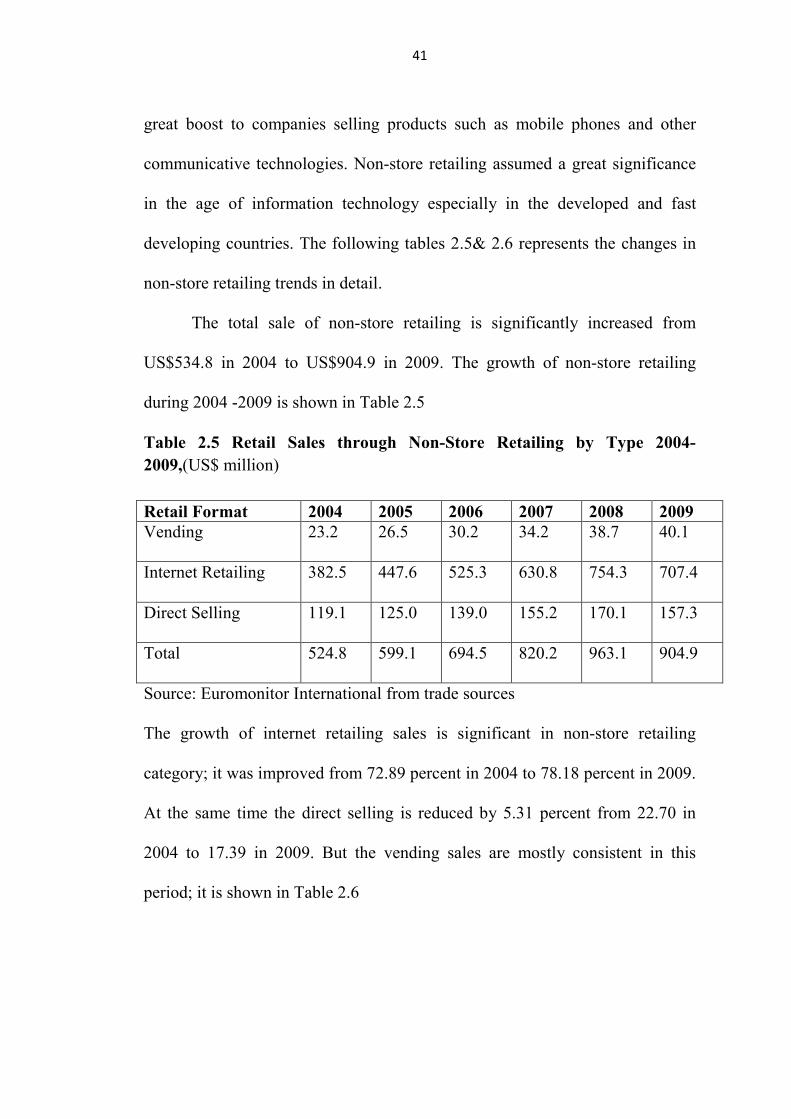
The total sale of non-store retailing is significantly increased from
US$534.8 in 2004 to US$904.9 in 2009. The growth of non-store retailing
during 2004 -2009 is shown in Table 2.5
Table 2.5 Retail Sales through Non-Store Retailing by Type 2004-2009,(US$ million) Retail Format 2004 2005 2006 2007 2008 2009 Vending 23.2 26.5 30.2 34.2 38.7 40.1
Internet Retailing 382.5 447.6
525.3 630.8 754.3 707.4
Direct Selling 119.1 125.0
139.0 155.2 170.1 157.3
Total 524.8 599.1
694.5 820.2 963.1 904.9
Source: Euromonitor International from trade sources
The growth of internet retailing sales is significant in non-store retailing
category; it was improved from 72.89 percent in 2004 to 78.18 percent in 2009.
At the same time the direct selling is reduced by 5.31 percent from 22.70 in
2004 to 17.39 in 2009. But the vending sales are mostly consistent in this
period; it is shown in Table 2.6
42
Table 2.6 Retail Sales through Non-Store Retailing by Type: % Analysis 2004-2009(% of total)
Retail Format 2004 2005 2006 2007 2008 2009
Vending 4.41 4.43 4.35 4.17 4.01 4.44
Internet Retailing 72.89 74.70 75.63 76.91 78.32 78.18
Direct Selling 22.70 20.87 20.02 18.92 17.66 17.39
Total 100 100 100 100 100 100
Source: Euromonitor International from trade sources Internet retailing is a major channel for companies to consider when they are
balancing alternatives to outlet expansion. However, the gulf between store-
based retailing and non-store retailing is captured by the fact that total internet
retailing value sales in 2010 were negligible within overall store-based
retailing. Internet retailing still has a very long way to go before it challenges
store-based retailing. Although less risky products such as media products,
apparel and electronics and appliance brands could generate some quantifiable
sales through internet retailing, sales of these products will still depend on
bricks-and-mortar stores for driving their sales in India, due to the low level of
internet penetration in the country.
According to Euromonitor International trade source 2009, the U.S.A.
has occupied prime position in non-store retailing, the sales of different
countries from 2004 – 2009 depicts that U.S.A. non-store retailing sales are US
$ 239.14 billion in 2009. However, India non-store retailing sales increased
from US $0.60 billion in 2004 to US $ 1.60 billion in 2009, it shown some
43
improvement in non-store retailing, but it is not as significant as the other
Asian countries like Japan, China and other nations.
Table 2.7 Non-Store Retailer Sales 2004-2009 in world, US$ billion
Nation 2004 2005 2006 2007 2008 2009
Argentina 1.75 2.04 2.41 3.06 3.98 4.17
Australia 3.16 3.56 3.81 4.56 4.90 4.08
Austria 2.08 2.13 2.17 2.43 2.68 2.44
Belgium 1.34 1.38 1.65 2.06 2.47 2.33
Brazil 4.22 6.06 8.34 11.19 14.3 13.75
Bulgaria 0.06 0.08 0.08 0.11 0.13 0.11
Canada 4.38 4.83 5.25 5.64 5.69 4.67
Chile 0.54 0.69 0.80 0.96 1.14 1.01
China 5.66 5.94 6.15 7.32 9.03 10.17
Colombia 0.70 0.85 0.95 1.16 1.47 1.23
Czech Republic 0.63 0.80 0.98 1.30 1.78 1.56
Denmark 0.81 0.99 1.23 1.65 2.01 1.99
Egypt 0.11 0.13 0.13 0.14 0.15 0.16
Finland 1.57 1.71 1.74 2.06 2.39 2.22
France 13.51 14.52 15.84 19.70 23.30 22.87
Germany 29.99 32.22 34.49 38.70 43.01 39.34
Greece 0.56 0.65 0.77 0.98 1.19 1.17
India 0.60 0.73 0.87 1.21 1.48 1.60
Japan 89.86 91.60 90.16 91.00 96.95 109.60
Malaysia 1.72 1.96 2.30 2.75 3.08 2.92
Mexico 4.56 5.16 5.74 6.55 7.08 5.71
New Zealand 0.60 0.68 0.66 0.78 0.77 0.60
Philippines 0.54 0.58 0.67 0.79 0.86 0.85
Poland 0.90 1.15 1.47 2.2 5 3.11 2.29
Russia 3.60 5.01 6.62 9.35 11.85
Saudi Arabia 0.18 0.20 0.23 0.26 0.30 0.33
Singapore 0.46 0.54 0.65 0.77 0.90 0.87
44
South Africa 1.57 1.76 1.83 1.97 1.82 1.59
South Korea 17.20 20.88 24.27 26.65 23.93 19.86
Spain 4.41 4.83 5.24 6.35 7.42 6.87
Thailand 0.83 0.90 1.10 1.33 1.49 1.50
United Kingdom 26.92 30.90 35.05 43.78 44.56 38.38
USA 194.67 212.07 230.33 245.11 247.33 239.14
Venezuela 0.68 0.77 0.89 1.16 1.61 2.26
Vietnam 0.02 0.02 0.02 0.03 0.03 0.04
Source: Euromonitor International from trade sources
2.7 Grocery Retailing in Asia Pacific - A snapshot
Grocery retailing industry in Asia is probably the most dynamic and diverse in
the world. While there are elements of commonality, each of the ten countries
profiled in our study displays distinct characteristics. Overall, the region has
fared well through various challenges in recent years, including the 1997 Asian
economic crisis, the SARS epidemic in 2003, political upheavals and, more
recently, the threat of an avian influenza epidemic. China and India remain two
of the region’s (and indeed the world’s) major growth engines, with their
massive populations and relatively immature retail industries. Already the
second and third largest grocery retail markets in Asia after Japan, there are
still scope for further development and expansion. Although their economic
and consumer indicators are the fastest growing, they do have among the
lowest per capita gross domestic product (GDP) and personal disposable
income (PDI) statistics in the region. Countries across the region are seeing
similar population trends – higher levels of education, increasing wealth,
smaller families, urbanization, westernization – which all contribute to the
45
inexorable rise of modern retailers in this region. Modern format operators are
wooing with success the high-to-mid income and professional classes.
Consumers are increasingly demanding, requiring not only quality and value
for money, but also a wide range of products, convenience and comfort.
Although still price sensitive, they have embraced Western brands with gusto.
These factors have led to the popularity of the hypermarket format in Asia, and
in this segment Western grocery retailers have established a strong presence.
French hypermarket group Carrefour has operated in most Asian countries
since the 1990s, and ranks among the top five players in half of the countries in
this study. Tesco and Wal-mart, who followed soon after Carrefour, have made
less of an impact in comparison, but have declared further expansion plans in
existing and new locations. Asian regional retailers have also made their mark.
Hong Kong’s dairy farm and Japan’s Aeon hold significant positions outside
their home markets, and are two of the largest retailers in the region. Dairy
Farm is the leading grocery retailer in Singapore and Malaysia, operating under
its giant and cold storage brands.
The huge disparities in wealth, education and standards of living in most
countries mean that traditional format grocery channels still maintain a big
share of the market, dominating the rural or suburban areas. With the exception
of Australia, Hong Kong, Singapore and Malaysia, traditional channels
command more than half of the grocery retail market in our surveyed countries.
In most Asian countries, the grocery retail market is far from saturated. There
is much scope for modern format retailers to increase penetration in suburban
46
areas and second tier cities. Fresh opportunities exist in niche areas, such as
health foods, private label products and luxury products, which only have a
fledgling presence in top tier cities at present. Online retailing is emerging as
the latest alternative channel, but this has yet to make much headway in Asia.
Overall internet penetration is low compared to Europe and the US, although
Japan and South Korea are leading the way in this area. However, the
challenges are considerable. Retailers have difficulty in meeting the needs of a
diverse and widespread population, and foreign retailers have struggled in
some cases to attune to local cultures and tastes. Domestic retailers are not
about to give up their market share easily, and they have the advantage of local
knowledge and customer loyalty. Governments have also acted to protect
domestic players; most countries have introduced restrictions on foreign
ownership of grocery retailers, and there is the additional impediment of
bureaucratic red tape. The encouraging market outlook will invite further
investment and evolution in the industry. Asia’s growing population of
increasingly wealthy, sophisticated and demanding consumers will continue to
drive grocery retailing, supported by relatively stable economies and improving
retail infrastructures. The months ahead will undoubtedly bring fresh and
interesting developments in this charismatic region.
Australia
As one of the more mature markets in our study, Australian grocery retailing is
characterised by low growth rates and fierce competition, dominated by the
country’s two major supermarket chains – the effective duopoly of Woolworths
47
and Coles Myer. Between them, these two giants command some 61 percent of
the market. This sector is also comprised of other national and minor chains,
including Foodland and Franklins; supermarkets account for 82 percent of the
total grocery retail market. Convenience stores such as 7-Eleven, City
Convenience, independent and speciality retailers make up the balance. Growth
in this market has been steady at around six percent annually. With intense
competition in this market, the ability to raise prices is very limited, leaving
volume growth and trading up as the only real opportunities. Australia’s
population growth is low at just over one percent per annum1, and so, to
achieve volume growth, grocery retailers are pursuing various alternatives to
increase their share of the retail market. The buoyant Australian economy, with
its low interest rates, low unemployment and rising property prices, has
boosted consumer confidence, which is manifested in increased spending in
general. Supermarkets are under pressure. They vie for consumer dollars in the
face of growing competition from convenience stores, as well as restaurants
and cafés, which benefit from the cash-rich time-poor nature of both urban and
suburban dwellers.
Australian consumers are increasingly sophisticated; they now demand
a wide range of products and healthier options, as well as convenience and
competitive prices. In addition, younger people continue to migrate towards the
larger cities like Sydney and Melbourne. This has led to streamlining of
supermarket outlets, with the closing of unprofitable stores, and there has been
an average four percent decrease in stores annually since 1999. In the pursuit of
48
growth, supermarket chains are attempting to provide a one-stop-shop solution
to customers, expanding their range of products and services significantly in
the last decade. Non-food items, such as health and beauty products, electrical
goods and toys, complement traditional grocery shelf space. The large chains
have had a successful entry into the petrol retailing market with co-branded
petrol-and-convenience store outlets, as well as discount and voucher schemes
in collaboration with the major oil companies such as Caltex and Shell. The
latest in new offerings – banking and financial services, including credit cards
and insurance – aim to leverage their massive consumer base. The figure 2.7
reveals the significant growth of Australian grocery retail revenue U.S. $54.7
billion of during 2000-2009.
Figure 2.7 Grocery Retail Revenue from 2000-2009
Source: IBIS Convenience stores in Australia, 2009
China
It’s a familiar story in China these days – traditional Chinese practices are
slowly but surely giving way to the modern Western invasion. But with such an
enormous pie, surely there will be enough to go around. China’s grocery
49
retailing market is estimated at some US$285 billion in 2004, and is growing
fast at an average seven percent annually. Growth is expected to accelerate
over the coming years to a rate of eight percent, to reach a market size of
US$456 billion by 2010 as shown in figure 2.8 This has largely been fuelled by
rising disposable income per capita, which has been growing at over 12 percent
annually, and is expected to continue at this rate over the next five years.
Another factor is continuous urbanisation, with ever more rural dwellers
migrating to the cities in the quest for work, as the government looks to
increase the urban population from 42 percent to 52 percent by 2020. The
statistics are telling: while traditional-style markets are still the leading channel
for grocery retail, cornering a 68 percent share by sales, they account for 99
percent of the number of grocery retail outlets in China. Clearly, the value of
sales in traditional wet markets and provision goods shops has reduced
considerably. In a relatively short space of time, modern retail channels have
gained ground and will continue to do so. In recent years, local and foreign
operators of hypermarkets, supermarkets and convenience stores have made
their presence felt.
Retailers must therefore customize their offering according to local
needs. Chinese consumers are very price sensitive, and low prices have been
the easiest way for retailers to gain market share. There is an increasingly
affluent and sophisticated population who value convenience and comfort over
price, but they are still very much the minority. In the meantime, retailers will
continue to focus on price. In the longer term, retailers will need to build brand
50
loyalty in order to maintain margins, and some already offer loyalty discounts
and private label products. Competition has been fierce as domestic and
international retailers continue to open more outlets across the country,
especially with the relaxation of most investment restrictions on foreign
investors in late 2003. Foreign players are able to build on their experience in
supply chain, logistics and inventory management, although they may lack
local consumer knowledge and relationships with local suppliers and
governments. While significant opportunities for growth clearly exist in
grocery retailing, a shortage of well-trained management and high staff
turnover are some of the issues to be overcome in the fight for market share.
Figure 2.8 Size of China’s grocery market from 2000-2010
Source: IGD, 2005; KPMG analysis
Indonesia
Despite positive economic indicators, the Indonesian retail market has faced
significant challenges in recent years. Since the Asian economic crisis in 1997,
GDP and other consumer indices have grown steadily. Interest rates have been
51
stable and improved access to consumer credit and financial products have
supported the retail market. On the downside, the retail industry has had a
couple of difficult years following natural and other disasters – the Bali
bombings, SARS, the Asian tsunami – that have dented consumer confidence.
Current issues include the bird flu outbreak, a weaker rupiah, fuel shortages
and rising fuel prices, in addition to the ever-present political ups and downs.
The highly-fragmented Indonesian grocery market is valued at US$50 billion,
dominated by traditional retailers, including wet markets, roadside stalls and
independent grocers9. While their numbers are shrinking, they still comprise 99
percent of total grocery retail outlets10. In rural areas, traditional retailers will
continue to play a significant role as customer loyalty is high. The number of
modern retail outlets grew nearly four-fold between 2002 and 2003, albeit from
a very small base. The added complexity in this market is the immense
geographical spread of the Indonesian archipelago and significant range
between the levels of wealth among consumers. Modern retailers are mostly
concentrated within the island of Java which, despite representing only seven
percent of its land mass, houses around 60 percent of Indonesia’s 225 million
population.
They are increasingly brand-conscious, demanding higher levels of
service and quality, and shopping is becoming more of a recreational activity in
the larger cities. Demand for processed foods and dairy products is still low but
growing, particularly in urban areas, driven by changing lifestyles as people
work longer hours and seek greater convenience. As a result, the average
52
selling price of fast-moving consumer goods among modern retailers fell by
three percent in 2004; in the same period, average prices of goods from
traditional retailers increased by 1.3 percent. Few foreign operators have
successfully established a foothold in Indonesian grocery retailing. FDI in
Indonesia is a minefield of red tape, and all new store openings are subject to a
myriad of regulations. Foreign investors establishing large-scale retail
operations are required to do so in co-operation with domestic companies. For
example, Carrefour’s hypermarkets are a 70-30 joint venture with consumer
products distributor Tigaraksa Satria.
Japan
While Japanese retail market is valued at US$370 billion in 2009, Japanese
grocery retail market is becoming matured – the world’s second largest after
the US15. In fact, Japan's grocery sale per capita is the highest in the world, at
over US$3,300 a year. The impressive statistics mask a troubled retail market.
In 2008 the grocery retail market slipped by 1.2 percent due to a combination
of economic and demographic factors. The Japanese economy has been in the
doldrums since the bubble burst in the early 1990s, followed by consumer price
deflation in subsequent years. Population growth has been flat in recent years,
providing little opportunity for volume growth in the retail market. Consumer
confidence has never fully recovered since the economic downturn. Although
demand for staple food and household items has remained flat, consumers have
switched from branded luxury products to more affordable private labels.
Having said that, Japanese consumers are still very brand conscious and
53
penetration of private label products is low. The market has also suffered from
a series of food safety scares, including an outbreak of Bovine Spongiform
Encephalopathy (BSE) in Japanese cows, mislabelling of product origin, and
use of non-approved additives in packaged foods. Japanese consumption
patterns have changed along with the demographic shift and lifestyle
variations. With birth rates declining and a rapidly ageing population – 25
percent18 of Japanese are over 60, with another 15 percent19 set to reach 60 in
the next decade – demand for health products and fortified foods is growing.
Healthy options such as reduced salt and sugar, and low fat alternatives are
extremely popular even though they are more expensive than standard
products. High levels of unemployment have spurred migration to city areas
where there are more work options, the upshot being increased demand for
Japanese-style fresh prepared and convenience foods. These are readily
available at convenience stores and food halls in department stores. Western
cuisines have yet to be widely embraced by the Japanese masses.
Malaysia
In Malaysia’s relentless drive towards economic and social development, the
only casualties would appear to be independent and traditional operators. The
Q311 BMI Malaysia Retail Report forecasts that total retail sales will grow
from MYR168.72bn (US$47.90bn) in 2011 to MYR284.02bn (US$80.63bn) by
2015. A low unemployment rate, rising disposable incomes and a strong
tourism industry are key factors behind the forecast growth. Large domestic
and multinational retailers have entered the fray with relative success, boosted
54
by increasing urbanization and westernization, and the growing demand for
convenience. Restrictions imposed on foreign-owned retailers have not
prevented their spread into major cities. The Malaysian government is keen to
see greater development across the board, and has set ambitious targets,
including promoting the use of technology; foreign retailers have brought in
valuable experience in this area. The food versus non-food retail sales in
Malaysia has been significant during 2003- 2008 as shown in Figure 2.9
Figure 2.9 Food Vs Non-Food Retailers of Malaysia from 2003- 2008
Source : New Straits Times, “Truly Giant”, 1 July 2005 Singapore
Grocery retailing in Singapore is more akin to Western countries: a mature
market with modern retailers taking the lion’s share, with limited growth
opportunities owing to a stable population. One of the most affluent nations in
Asia, the city-state presents a small but mature retail environment. With the
population expected to increase from 4.2 million to just 4.4 million by 2009,
55
overall volume growth will be low. Yet, the growing affluence of Singaporeans
is reflected in the forecast growth in household consumption per head at around
six percent annually. Rising incomes and busier lifestyles have also influenced
shopping and product preferences. The majority of Singaporeans prefer to shop
in modern retail outlets, seeking convenience and packaged foods in addition to
high quality basic food products. According to Business Monitor International
(BMI) Singapore retail report forecasts that total retail sales will grow from a
forecast SGD 43.88bn (US$32.63bn) in 2011 to SGD50.21bn (US$38.92bn) by
2015. A low unemployment rate, rising disposable income and a strong tourism
industry are key factors behind the forecast growth, rises in property prices,
along with a relatively stable economic outlook, have made Singaporeans feel
better off and hence more willing to spend.
South Korea
While retail market is valued at over £ 60.93billion in 2010, the South Korean
grocery retail market has become one of the largest in Asia, and represents 30
percent of the overall retail market41. Seoul is the center of a large and
dynamic retail market set to become increasingly congested. Grocery retailing
is not expected to grow as quickly as retailing in general, which is likely to
achieve rates of four to five percent annually, in line with GDP and average
wage growth rates. A two percent growth rate is probably a more realistic
forecast for grocery retailing, as population numbers will remain relatively
stable, and a greater proportion of incomes will shift towards leisure, luxury
goods and services. One of the grocery segments to benefit from the increase in
56
PDI is luxury and health foods. Over the last two decades there has been a
marked shift in the profile of the retail industry.
Thailand
It’s a battle between old and new in Thailand’s thriving retail market. For now,
the traditional sector is holding its own – but for how long? Thailand’s grocery
retail market is the second-fastest growing in Asia Pacific, after China. With a
population of 65 million set to grow at one percent annually, and GDP growth
forecast at 4-5 percent in 2006-07, Thailand provides further potential for
modern grocery retailers. Grocery retailing enjoys a strong position in
Thailand, having recovered steadily since the 1997 Asian economic crisis. In
2003 the proportion of retail sales made up by grocery sales stood at 60
percent, valued at US$29 billion.
2.8 Indian Retailing Scenario
The retailing sector is India’s largest industry after InfoTech, in terms of
contribution to gross domestic product (GDP) at 12 percent and also the second
largest employment generator (8 percent of total employment) after agriculture
sector.30 The retailing in India is largely unorganized and predominantly
consists of small, independent, owner-managed shops. Of the estimated 15
million retail outlets in the country, only about 4 percent of them are larger
30 Indian Business Directory – Business Maps of India 2011
57
than 500 sq. ft. in size.31 India has been one of the highest density of retail
outlets per capital in the world with a widely spread retail network but with the
lowest per-capita retail space @ 2 sq. ft per person. Indian retailing continues
to be one of the least evolved industries. The Indian retailing buoyed by
favourable political and economic outlook with government legislation
permitting foreign direct investment of 51% in single-brand retail and 100
percent in cash and carry retail business. The Indian retail market stood at Rs.
18,10,000 crore with annual growth of about 11 percent for 2009-1032. Of this,
the share of organised retail in 2009-10 was 12.74 percent, estimated at Rs.2,
29,870 crore. But this modern retail segment grew at the rate of 42.4 percent in
2010, and is expected to maintain a faster growth rate over the next three years.
Moving forward, organized retailing is projected to touch US$ 395.96 billion in
2011 2010 to US$ 785.12 billion by 2015, constituting roughly 13 percent of
the total retail market (India retail report, 2010). This generic growth is likely
to be driven by changing lifestyles and wider brand choice, strong surge in
income levels, which in turn will be supported by favorable demographic and
psychographic patterns. This is substantiated by the growth and development of
Indian retailing including organised retailing from the year 1999-2010 and
expected retail volume for 2011-2015 also shown In Table 2.3, Table 2.1 And
31 Mohan Guruswamy, Kamal Sharma, J.P Mohanty & Thomas J. Korah (2010), “FDI in India’s retail sector more bad than good?”, Centre for Policy Alternatives Society, New Delhi.
32 The Images F & R Research estimates for India Retail report-2010.
58
Table 2.2 Emphasis On sales in retailing by category (Value) and sales in
retailing by category (% current value growth) respectively.
Given the sustained growth and development of Indian retailing, it offers myriad opportunities, which are listed here:33
Ø Retail franchising has been growing at the rate of 60 percent in the last 3
years and is set to grow two-fold in the next 5 years.
Ø Food and Grocery remains one of the biggest categories of consumer
spending (75 percent) but account for only 10 percent of organized
retailing, representing a big opportunity for retailers. Wet groceries
(fruits, vegetables and meat products) are the most promising category
with great untapped potential.
Ø There are opportunities in consumer durables segment which currently
has 9 percent share of the modern retail is expected to grow to 11
percent by 2013. Home furnishing is another segment which is expected
to show a steep rise jumping from 2 percent in 2008 to 9 percent in 2013
Ø Number of shopping malls is expected to increase at a CAGR of more
than 18.9 percent from 2007 to 2015.
Ø The retail boom which has so far been concentrated in the metros is
beginning to percolate down to smaller cities and towns. Rural market is
projected to dominate the retail industry landscape in India by 2012 with
total market share of above 50 percent.
33 KPMG, 2010 an Indian Partnership and a member firm of the KPMG network of independent member firms affiliated with KPMG International Cooperative (“KPMG International”),
59
Ø Development of India as a sourcing hub will further make India an
attractive retail opportunity for global retailers. Retailers, such as Tesco,
J.C. Penney, etc are stepping up their sourcing
Ø Requirements from India, and moving from third-party buying offices to
establishing their own wholly owned/wholly managed sourcing and
buying offices.
Ø Table 2.8 & Table 2.9 states the market data of Indian retailing category
wise, percentage value growth of retailing in India and Table 2.10
enlighten the growth & development of Indian Retailing from 1999 -
2015
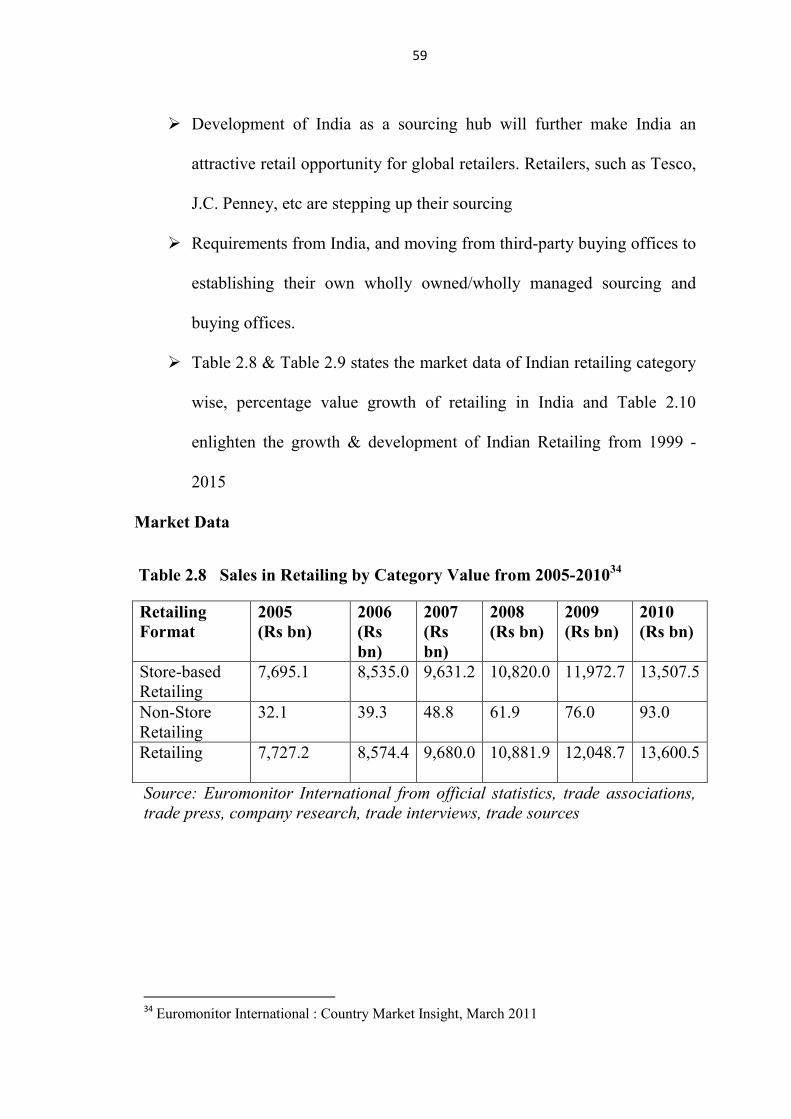
Market Data
Table 2.8 Sales in Retailing by Category Value from 2005-201034
Source: Euromonitor International from official statistics, trade associations, trade press, company research, trade interviews, trade sources
34 Euromonitor International : Country Market Insight, March 2011
60
Table 2.9 Sales in Retailing by Category: % Value Growth from 2005-2010 (%current value growth)
Retail Format 2009/10 2005 -10 CAGR 2005 /10 Total Store–based Retailing 12.8 11.9 75.5 Non-store Retailing 22.4 23.7 190.1 Retailing 12.9 12.0 76.0 Source: Euromonitor International from official statistics, trade associations, trade press, company research, trade interviews, trade sources
Table 2.10 Growth & development of Indian Retailing from 1999-2011 (at current prices)
Source: KSA Technopak retail report- 2000, 2001, 2002, 2003, 2004, 2005, 2006 and India retail report-2007 & 2009, and Business Monitor International (BMI) India retail report of 2010.
Year Total Retail Market (Rs Crore)
Organised Retail Market (Rs Crore)
% Share of Organised Retail
1999 7,00,000 5,000 0.7
2000 4,00,000 5,000 1.3
2001 7,20,000 13,000 1.6
2002 8,25,000 15,000 1.8
2003 8,85,000 23,000 2.6
2004 9,30,000 28,000 3.0
2005 10,30,000 37,500 3.6
2006 12,00,000 55,000 4.6
2007 13,30,000 78,300 5.9
2008 14,80,000 1,12,000 7.7
2009 16,40,000 1,60,000 9.7
2010 18,10,000 2,29,870 12.7
2011e 18,61,012 $ 395.96 billion (e)
2,37,092 $ 50.44 billion (e) 12.74 (e)
2012-15e 36,90,064 $785.12billion (e)
5,42,439 $115.41 billion (e) 14.7 (e)
61
2.9 Growth and Development of Food and Grocery Retailing
Food and Grocery is by far the most promising area for the corporate majors to
get into organised retail businesses. The Food and grocery is the second-largest
segment of the retail trade constitutes 53 percent of total private consumption
expenditure (USD 154 billion) and 70 percent of total retail sales (KSA
Technopak Report, 2007). The Indian food market is estimated at over US$
182 billion, and accounts for about two thirds of the total Indian retail market.
According to McKinsey retail report- 2010 , the retail food sector in India is
likely to grow from around US$ 70 billion in 2008 to US$ 150 billion by 2025,
accounting for a large chunk of the world food industry, which would grow to
US$ 400 billion from US$ 175 billion by 2025. Mass grocery retail (MCR)
sales in India are expected to undergo tremendous growth, the MGR outlets
will increase by 218 percent to reach US$ 27.67 billion by 2015(Business
Monitor International (BMI) India Retail Report, Second-quarter of 2011).
However, the Indian Brad Equity Foundation stated that, Rs 18,673 billion
(US$ 401 billion) Indian retail market entails only 6 percent of itself as
organised retail segment as of 2010. Hence, there is a great potential to be
explored by domestic and international players. The Business Monitor
International (BMI) India Retail Report for the fourth-quarter of 2011 forecasts
that the total retail sales will grow from US$ 411.28 billion in 2011 to US$
804.06 billion by 2015. But the growth of organized retailing in India has
changed the business landscape and buyer behaviour. Most of the food and
grocery products reach the consumers through traditional markets which are
62
unorganized (Bajaj et al, 2005). But the very fast changing trends in food and
eating habits of consumers have contributed immensely to the growth of
‘Western’ format typologies such as convenience stores, discount stores, super
markets, specialty stores and hyper markets for various conspicuous reasons
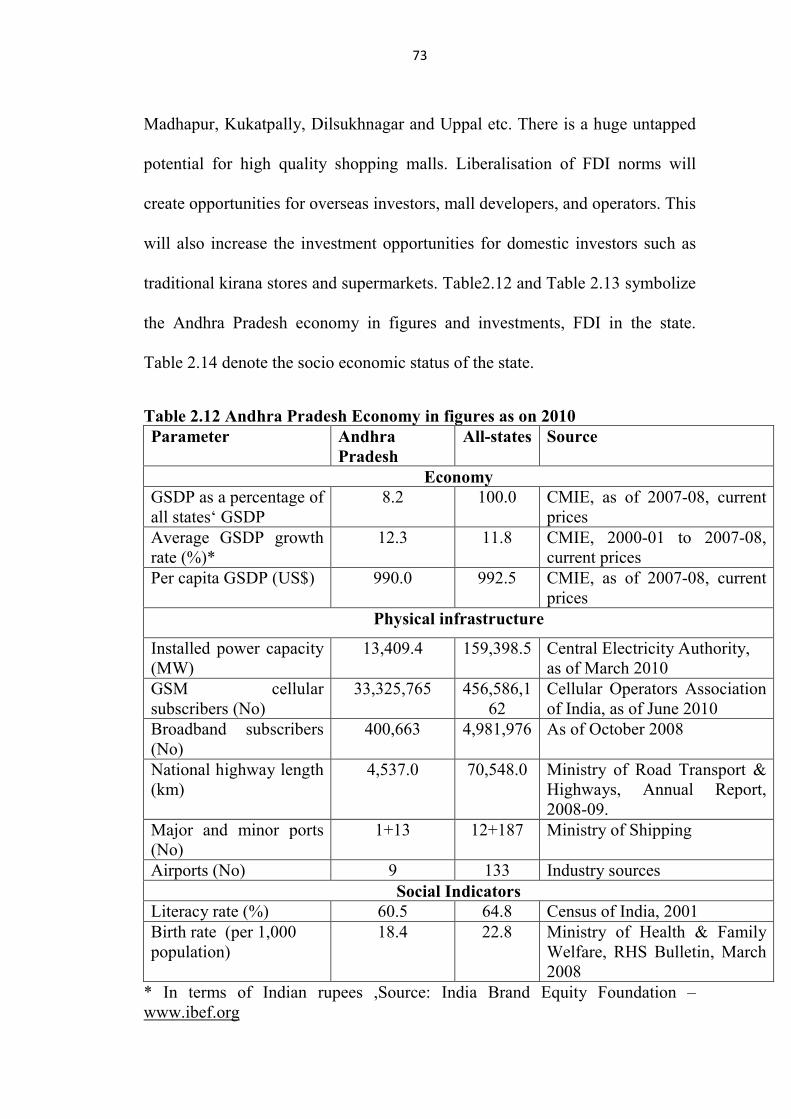
Table 2.13 Investments & FDI in Andhra Pradesh as n 2010 Parameter Andhra
Pradesh All-
states Source
FDI inflows (US$ billion)
4.8 120.2 Department of Industrial Policy and Promotion, April 2000 to May 2010
Outstanding investments (US$ billion)
146.1 1,972.6 CMIE, as of March 2010
Industrial Infrastructure PPP projects (No) 74 515 www.pppindiadatabase.com SEZ (No) 22 121 Functional as of August
2010,www.sezindia.nic.in PPP: Public private partnership, SEZ: special economic zone, Source: India Brand Equity Foundation – www.ibef.org
Table 2.14 Socio-economic snapshot of Andhra Pradesh in 2010
Parameters Andhra Pradesh
Capital Hyderabad Geographical area (sq km) 275,100 Administrative districts (No) 23 Population density (persons per sq km) 277 Total population (million) 76.2 Male population (million) 38.5 Female population (million) 37.7 Decadal population growth rate (%) 14.6 Sex ratio (females per 1,000 males) 978 Literacy rate (%) 60.5 Male (%) 70.3 Female (%) 50.4 Average life expectancy (years) 63.9
Sources: Andhra Pradesh Government (www.aponline.gov.in), Director, Census Operations, A.P. Hyderabad, Directorate of Economics and Statistics, Hyderabad, CMIE, and India Brand Equity Foundation – www.ibef.org