Chapter III Towards sustainable cities Introduction Cities and towns have become the primary human living space. Since 2007, more than half of the world’s population has been living in urban areas and the figure is estimated to exceed 70 per cent by 2050. is is a hallmark of the transformation of humans’ economic base and social structure, inasmuch as, previously, populations lived and worked primarily in rural areas. Cities can provide many socioeconomic benefits. By concentrating people, investment and resources (a process known as agglomeration), cities heighten the pos- sibilities for economic development, innovation and social interaction. More specifically, cities also make it possible to lower unit costs so as to provide public services such as water and sanitation, health care, education, electricity, emergency services and public recrea- tional areas (Polèse, 2009; Satterthwaite, 2010). However, this requires a functioning city Summary y Numerous challenges threaten the ability of cities to become viable pillars of sustain- able development. Unequal access to, and inefficient use of, public services, as well as financial fragility and the harm inflicted by natural hazards, demand an integrated and coordinated response at the local, national and international levels. y The predominance of small- and medium-sized cities provides an opportunity to invest in green infrastructures, bypassing old energy technologies, and in social development, before social inequities become unsustainable. y Rural development is critical for an integrated approach to sustainability and for reducing poverty. Ensuring wider and inclusive access to public services can reduce rural/urban inequalities, disaster risk and food insecurity, as well as strengthen net- works between cities and villages. y Building sustainable cities requires investment in (a) renewable energy sources, (b) ef- ficiency in the use of water and electricity, (c) design and implementation of compact cities, (d) retrofitting of buildings and increase of green areas, (e) fast, reliable and affordable public transportation and (f ) improved waste and recycling systems. Cities in poor countries need resources to support green technology transfer, and capac- ity development, and to improve access to soundly constructed housing, water and sanitation, electricity, health and education.
Transcript
Chapter IIITowards sustainable cities
IntroductionCities and towns have become the primary human living space. Since 2007, more than half of the world’s population has been living in urban areas and the figure is estimated to exceed 70 per cent by 2050. This is a hallmark of the transformation of humans’ economic base and social structure, inasmuch as, previously, populations lived and worked primarily in rural areas.
Cities can provide many socioeconomic benefits. By concentrating people, investment and resources (a process known as agglomeration), cities heighten the pos-sibilities for economic development, innovation and social interaction. More specifically, cities also make it possible to lower unit costs so as to provide public services such as water and sanitation, health care, education, electricity, emergency services and public recrea-tional areas (Polèse, 2009; Satterthwaite, 2010). However, this requires a functioning city
Summary
y Numerous challenges threaten the ability of cities to become viable pillars of sustain-
able development. Unequal access to, and inefficient use of, public services, as well
as financial fragility and the harm inflicted by natural hazards, demand an integrated
and coordinated response at the local, national and international levels.
y The predominance of small- and medium-sized cities provides an opportunity to
invest in green infrastructures, bypassing old energy technologies, and in social
deve lopment, before social inequities become unsustainable.
y Rural development is critical for an integrated approach to sustainability and for
reducing poverty. Ensuring wider and inclusive access to public services can reduce
rural/urban inequalities, disaster risk and food insecurity, as well as strengthen net-
works between cities and villages.
y Building sustainable cities requires investment in (a) renewable energy sources, (b) ef-
ficiency in the use of water and electricity, (c) design and implementation of compact
cities, (d) retrofitting of buildings and increase of green areas, (e) fast, reliable and
affordable public transportation and (f ) improved waste and recycling systems. Cities
in poor countries need resources to support green technology transfer, and capac-
ity development, and to improve access to soundly constructed housing, water and
sanitation, electricity, health and education.
54 World Economic and Social Survey 2013
government able both to ensure that such benefits are realized, and to adopt a sustainable framework that encourages the city’s growth within ecological limits. Along these lines, cities also face challenges that threaten their efforts to achieve sustainability, for example, through improvement of access to, and efficiency in the use of, public services, as well as reduction of their ecological footprint and financial fragility, and the building of resilience against the adverse impact of natural hazards.
The present chapter recommends an integrated strategy for making cities thriv-ing centres of sustainable development and innovation. It starts by assessing what a city is, the scale and speed of urbanization in recent decades, and the main trends and projections of urban growth across regions. The trends and projections analysed serve as an introduction to the conception of future urbanization as a process that can enhance the benefits of cities, while reducing the threats to a more balanced and sustainable development. The evolution of the concept of urban sustainability is described and a framework is proposed based on four pillars: economic development, social development, environmental management and effective urban governance. The following section examines relevant challenges associated to the fulfilment of those objectives by different groups of countries. The last section examines urbanization through the lens of the investment opportunities that addressing those chal-lenges involves. A proposal put forth for an integrated set of investments in infrastructure, public services and capacity development is complemented by an examination of relevant world experiences associated with urban sustainability at the sectoral level (e.g., disaster risk reduction, housing and green infrastructure) as well as a policy framework for a sustainable financing of cities.
The city and main urbanization trendsThere is no uniform definition of what constitutes a city, given the diversity of urban realities around the world. Every country defines cities according to its own criteria. It should also be noted that gaps in and measurement issues connected with urban data limit the accuracy of projections and international comparisons of levels of urbanization and sizes of city populations. Box III.1 discusses the different criteria used in defining cities and data issues.
Cities are diverse in terms of their size, structure, spatial form, economy, wealth, local resources availability and ecological impact. According to population size and conditions, urban centres can be, e.g., small, medium, large or mega. The popula-tion of an urban centre can range from a few thousand to over 10 million people or more. According to relevant studies, “small urban centres” have a population less than or equal to 500,000 people; medium urban centres, a population between 1 million and 5 million people; and mega urban centres, a population of 10 million or more (United Nations, Department of Economic and Social Affairs, Population Division, 2012; Dobbs and others, 2011b). For statistical comparison of urban centres’ sizes and development, this chapter uses the categories along with “large urban centres” defined as agglomerations with 5 million inhabitants or more.
The scale and scope of urbanization
At the start of the twentieth century, just 16 cities had 1 million or more people, with the majority located in advanced industrialized countries (Montgomery and others, 2004). By 2010, there were 449 cities with 1 million people or more, of which three quarters were
By 2050, the world urban population could reach 6.25 billion, 80 per cent
of whom would live in developing regions, and concentrated in cities of
Africa and Asia
55Towards sustainable cities
Definition of a city and data issues
The majority of countries use a single characteristic or a combination of administrative, population size or density, economic and urban characteristics (e.g., paved streets, water-supply systems, sewer-age systems and electric lighting) to define a city. The lower limit above which a settlement can be considered urban varies greatly, between 200 and 50,000 inhabitants, which can give rise to error when comparing urban populations (and urban areas) in different countries. For example, if India’s national authorities would classify populations of 5,000 or more as urban, the country would be considered predominantly urban and not rural. In Angola, Argentina and Ethiopia, all settlements with 2,000 people or more are classified as urban. In Benin, only areas with 10,000 people or more are considered urban. In Botswana, an agglomeration of 5,000 people or more where 75 per cent of the economic activity is non-agricultural can be considered urban (Cohen, 2006). Certain countries define the urban population as comprising people who live within certain administrative centres or municipios (El Salvador) or under the jurisdiction of municipality councils (Iraq). Others define cities as places with a municipality, municipal corporation, town committee or cantonment board (Bangladesh and Pakistan).
The population of any urban centre is influenced by how its boundaries are set—for instance, are they determined by the built-up area or are peri-urban areas which have little or no urban development included within them? The size of a city can be made significantly larger if fringe populations are included in official statistics; many cities have boundaries set to include the city and large areas around the city which may include small towns and large rural populations. Most large cities have more than one boundary—boundaries for the central city, for instance, for an entire metropolitan area, or for a wider planning region which often includes many rural settlements. In general, countries’ urban populations are defined as the residents whose main source of income is not from agriculture or forestry (Satterthwaite, 2010).
Inadequate attention paid to data limitations has led to misconceptions regarding urban trends which can ultimately distort urban policies. Urban population projections often do not include high- and low-variant estimations, which are typical of world population projections published by the United Nations (Satterthwaite, 2007; United Nations, Department of Economic and Social Affairs, Population Division, 2012). Moreover, the traditional urban/rural dichotomy has become increasingly inadequate for distinguishing between urban and rural settlements. Increased trade, labour mobility and innovation in communications have spread urban functions and influence over wide geographical areas, including rural ones. In parts of Asia and the Pacific, for example, intense economic activity in the intersection between urban and rural areas has blurred differences (Cohen, 2006). Yet, in the case of countries in Latin America and the Caribbean, censuses and surveys that consider the urban/rural dichotomy are still valid since they persistently indicate social inequalities subsisting between rural and urban areas (United Nations, Economic Commission for Latin America and the Caribbean, 2012). Still, some of the most profound social inequalities are seen within cities or within nations’ urban populations.
To improve the consistency and comparability of data on urban populations across countries and over time, the United Nations, Department of Economic and Social Affairs, Population Division (2012) uses two auxiliary concepts: (a) urban agglomeration, which refers to “population contained within the contours of contiguous territory” inhabited by, e.g., 750,000 inhabitants or more and (b) metropolitan region, which includes both the contiguous territory and “surrounding areas of lower settlement density” which are under the direct influence of the city through frequent transport, roads, commuting and so forth (p. 7). In addition, there is a potential for research on urban databases and data-collection mechanisms to support local policy, planning and investment decisions.
In general, caution is recommended regarding the interpretation and comparison of urban population statistics between nations, owing to different official criteria for defining urban areas, and setting city boundaries, and, in some cases, to the lack of census data.
Box III.1
Source: UN/DESA.
56 World Economic and Social Survey 2013
located in developing countries (United Nations, Department of Economic and Social Affairs, Population Division, 2012).
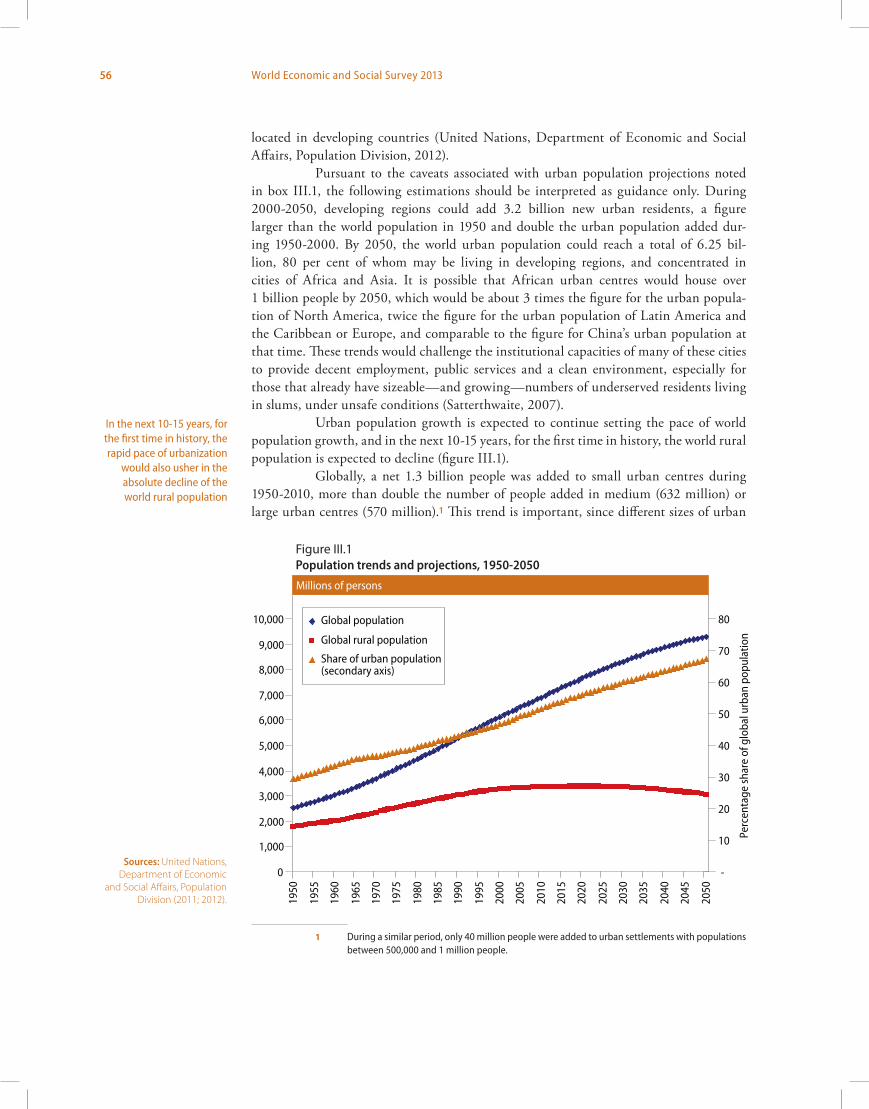
Pursuant to the caveats associated with urban population projections noted in box III.1, the following estimations should be interpreted as guidance only. During 2000-2050, developing regions could add 3.2 billion new urban residents, a figure larger than the world population in 1950 and double the urban population added dur-ing 1950-2000. By 2050, the world urban population could reach a total of 6.25 bil-lion, 80 per cent of whom may be living in developing regions, and concentrated in cities of Africa and Asia. It is possible that African urban centres would house over 1 billion people by 2050, which would be about 3 times the figure for the urban popula-tion of North America, twice the figure for the urban population of Latin America and the Caribbean or Europe, and comparable to the figure for China’s urban population at that time. These trends would challenge the institutional capacities of many of these cities to provide decent employment, public services and a clean environment, especially for those that already have sizeable—and growing—numbers of underserved residents living in slums, under unsafe conditions (Satterthwaite, 2007).
Urban population growth is expected to continue setting the pace of world population growth, and in the next 10-15 years, for the first time in history, the world rural population is expected to decline (figure III.1).
Globally, a net 1.3 billion people was added to small urban centres during 1950-2010, more than double the number of people added in medium (632 million) or large urban centres (570 million).1 This trend is important, since different sizes of urban
1 During a similar period, only 40 million people were added to urban settlements with populations between 500,000 and 1 million people.
In the next 10-15 years, for the first time in history, the rapid pace of urbanization
would also usher in the absolute decline of the world rural population
Figure III.1 Population trends and projections, 1950-2050
Sources: United Nations, Department of Economic
and Social Affairs, Population Division (2011; 2012).
Millions of persons
Figure III.1 Population trends and projections, 1950-2050
Sources: United Nations, Department of Economic and Social Affairs, Population Division (2012a; 2012b).Note: A mid-variant projection was available only for the global population.
0
1,000
2,000
3,000
4,000
5,000
6,000
7,000
8,000
9,000
10,000
1950
1955
1960
1965
1970
1975
1980
1985
1990
1995
2000
2005
2010
2015
2020
2025
2030
2035
2040
2045
2050
-
10
20
30
40
50
60
70
80
Perc
enta
ge sh
are
of g
loba
l urb
an p
opul
atio
n
Global population
Global rural population
Share of urban population(secondary axis)
57Towards sustainable cities
settlements can affect the levels of provision of services needed to sustain growing popula-tions. The challenges and policy implications of the likely continued predominance of small urban centres and the rising significance of middle and large urban centres in the next 15 years are noteworthy and will be further analysed below.
Diverse paths and paces of urbanization
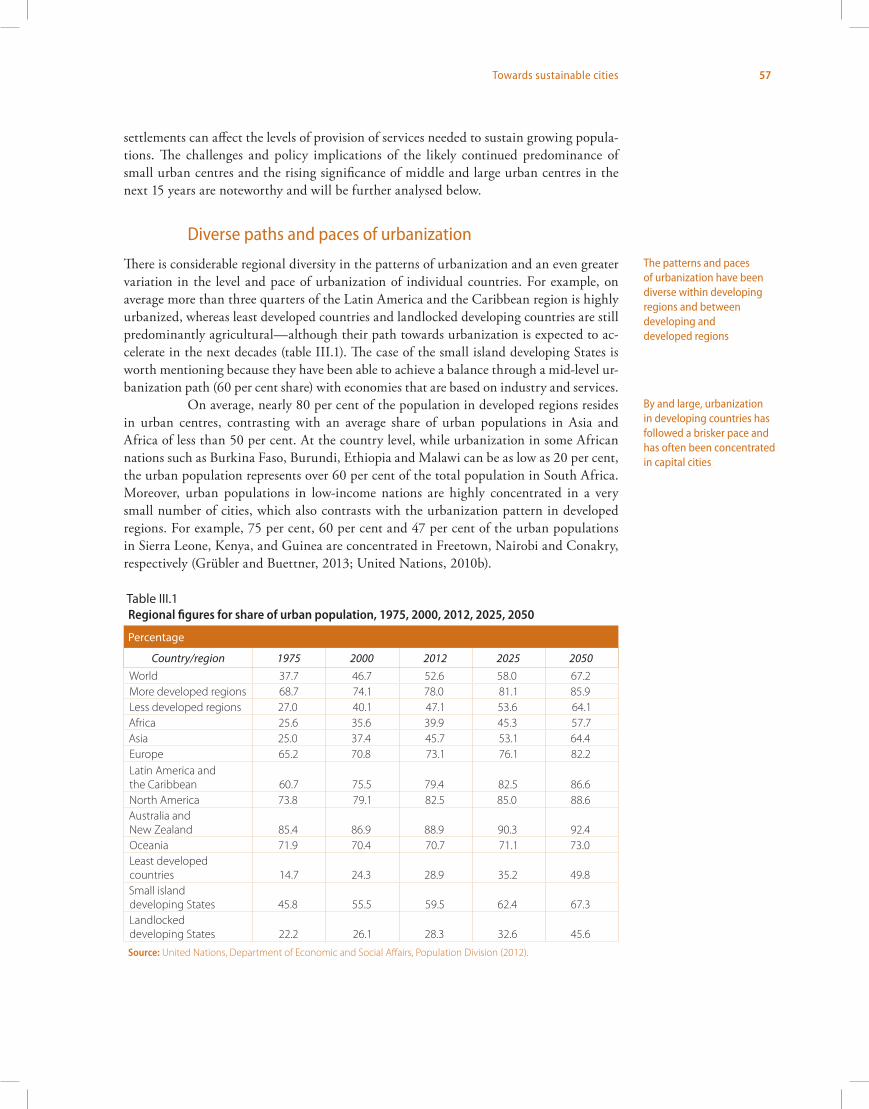
There is considerable regional diversity in the patterns of urbanization and an even greater variation in the level and pace of urbanization of individual countries. For example, on average more than three quarters of the Latin America and the Caribbean region is highly urbanized, whereas least developed countries and landlocked developing countries are still predominantly agricultural—although their path towards urbanization is expected to ac-celerate in the next decades (table III.1). The case of the small island developing States is worth mentioning because they have been able to achieve a balance through a mid-level ur-banization path (60 per cent share) with economies that are based on industry and services.
On average, nearly 80 per cent of the population in developed regions resides in urban centres, contrasting with an average share of urban populations in Asia and Africa of less than 50 per cent. At the country level, while urbanization in some African nations such as Burkina Faso, Burundi, Ethiopia and Malawi can be as low as 20 per cent, the urban population represents over 60 per cent of the total population in South Africa. Moreover, urban populations in low-income nations are highly concentrated in a very small number of cities, which also contrasts with the urbanization pattern in developed regions. For example, 75 per cent, 60 per cent and 47 per cent of the urban populations in Sierra Leone, Kenya, and Guinea are concentrated in Freetown, Nairobi and Conakry, respectively (Grübler and Buettner, 2013; United Nations, 2010b).
The patterns and paces of urbanization have been diverse within developing regions and between developing and developed regions
By and large, urbanization in developing countries has followed a brisker pace and has often been concentrated in capital cities
Table III.1Regional figures for share of urban population, 1975, 2000, 2012, 2025, 2050
Percentage
Country/region 1975 2000 2012 2025 2050World 37.7 46.7 52.6 58.0 67.2 More developed regions 68.7 74.1 78.0 81.1 85.9 Less developed regions 27.0 40.1 47.1 53.6 64.1 Africa 25.6 35.6 39.9 45.3 57.7 Asia 25.0 37.4 45.7 53.1 64.4 Europe 65.2 70.8 73.1 76.1 82.2 Latin America and the Caribbean 60.7 75.5 79.4 82.5 86.6 North America 73.8 79.1 82.5 85.0 88.6 Australia and New Zealand 85.4 86.9 88.9 90.3 92.4Oceania 71.9 70.4 70.7 71.1 73.0 Least developed countries 14.7 24.3 28.9 35.2 49.8 Small island developing States 45.8 55.5 59.5 62.4 67.3 Landlocked developing States 22.2 26.1 28.3 32.6 45.6
Source: United Nations, Department of Economic and Social Affairs, Population Division (2012).
58 World Economic and Social Survey 2013
Yet, “late urbanization” in Asia and Africa is expected to gain speed and con-centrate the majority of the additional 3 billion urbanites during 2010-2050. Similarly, the number of urban agglomerations (750,000 inhabitants or more) and the number of inhabitants per agglomeration are expected to grow significantly in Asia and Africa by 2025 (United Nations, Department of Economic and Social Affairs, Population Division, 2012). It is expected that over 80 per cent of the urban population added in the next 15 years will be found in middle-income countries such as China, India, South Africa, Nigeria, Indonesia and Pakistan (ibid.).
Changing patterns of urban settlements
Over 50 per cent of the world’s urban populations lived in settlements with 500,000 people or less by 2010. Although their significance will remain, the share will have been reduced to 42 per cent by 2025 (United Nations, Department of Economic and Social Affairs, Population Division, 2012). Medium cities (those with 1 million - 5 million people), on the other hand, will increase their share of the urban population, from 21 to 24 per cent over a similar time interval. The share of the urban population in large cities (those with more than 5 million people), including megacities, will grow the most, from 17 to 22 per cent, with an absolute increase of more than 410 million people. By 2010, megacities of 10 mil-lion inhabitants or more contained only 10 per cent of the global urban population (ibid.).
All of the types of growing cities will be located largely in low- and middle-income countries. In many developing countries, the main challenge is to provide un-derserved urban residents, including populations in large cities, with affordable access to adequate public services and job opportunities. Inhabitants in poor urban settlements typically reside on the outskirts as well as within large cities without adequate access to piped water, waste disposal, electricity and good schools. Evidence also suggests that rates of poverty and infant and child mortality can be high in small and large cities, often indicating an inadequate access to public-health facilities and the lack of political will to invest in them (Mitlin and Satterthwaite, 2012).
Cities in low-income countries may often lack the institutional capacity to manage growing populations. Although some national Governments in developing countries have begun to decentralize service delivery and revenue-raising to regional and local levels of government, lower tiers of urban government often do not have enough re-sources and adequate capacity to manage, e.g., health, education and poverty programmes (Montgomery and others, 2004).
Is there a twin path between urbanization and economic growth?
The economic strength of countries lies in cities; in fact, urban gross domestic product (GDP) represents about 80 per cent of world GDP (Grübler and Fisk, 2013). Cities have been pivotal centres for economic growth, employment creation, innovation and cultural exchange. Cities in many developing countries (e.g., Bangladesh, Brazil, China, Honduras, India, Nigeria, Peru and South Africa) concentrate the core of modern productive activi-ties and are the areas par excellence where income-earning opportunities are to be found (Satterthwaite, 2007). Cities are also the centres where women enjoy the highest labour participation, health access, literacy rates and upward social mobility (Cohen, 2006).
Even though small urban settlements will still retain
their predominance in 2025, the importance of
medium and large urban settlements will continue to
grow at the global level
59Towards sustainable cities
Nonetheless, urban population growth has outpaced economic growth as well as the needed improvement of competence and institutional capacity of city governments in many developing countries, which contrasts with the closer correlation found in de-veloped countries (figure III.2). Thus, for an equivalent level of urbanization, the level of income per capita in developing regions is several times lower. This trend, which might be explained partly by different criteria used for defining urban centres, has implications for the actual capacities of poor countries to build sustainable cities. Figure III.2 illustrates this trend in relation to the urbanization of the region of Latin America and the Caribbean.
Figure III.2 Urbanization and economic growth, developed regions and Latin America and the Caribbean, 1970-2010
Sources: UN/DESA; United Nations (2012a; 2012b).Note: Data for each country have been aggregated to obtain regional figures.
Urban population as percentage of total population
Figure III.2 Urbanization and economic growth, developed regions and Latin America and the Caribbean, 1970-2010
Sources: UN/DESA; United Nations (2012a; 2012b).Note: Data for each country have been aggregated to obtain regional figures.
1970
1980
19902000
2010
0
10
20
30
40
50
60
70
80
90
0 1000 2000 3000 4000 5000 6000
GDP per capita at constant 2005 prices in United States dollars
1970 1980 1990 20002010
0
10
20
30
40
50
60
70
80
90
0 5000 10000 15000 20000 25000 30000 35000
GDP per capita at constant 2005 prices in United States dollars
Developed regions, 1970-2010
Latin America and the Caribbean, 1970-2010
Urban population as percentage of total population
60 World Economic and Social Survey 2013
In particular, the urbanization process in least developed countries or coun-tries of sub-Saharan Africa may have occurred with negative or almost no economic growth (figure III.3), which ultimately implies an increased precariousness of urban life. Population in slums almost doubled in sub-Saharan Africa between 1990 and 2010, ris-ing from 103 million to 200 million (United Nations Human Settlements Programme (UN-Habitat), 2010). Even so, Satterthwaite (2010) recommends caution in the inter-pretation of the negative correlation between economic growth and urbanization in sub-Saharan countries because of data shortcomings, which can prevent accurate measurement of urbanization patterns (see, also, Potts, 2006).
Cities are constantly evolving as a result of dynamic processes heightened by population mobility, natural population growth, socioeconomic development, envi-ronmental changes and local and national policies. The trends and projections described above serve as the basis for an introduction to the concept of future urbanization as a process that can enhance the benefits and synergies of cities, while reducing the threats to a more balanced and sustainable development.
A framework for sustainable citiesIt has been suggested that the building of a “green” city is equivalent to the building of sustainability (Beatley, ed., 2012). Many countries are planning and engaged in building green cities and “eco-cities” as starting points for the building of sustainable develop-ment. Yet, it is important to understand cities’ sustainability as a broader concept which integrates social development, economic development, environmental management and
Within a framework of four pillars, effective
urban governance can be combined with
the achievement of social and economic
development and effective environmental
management
Urban population as percentage of total population
Figure III.3 GDP per capita and urban share of total population, sub-Saharan Africa and least developed countries, 1970-2010
Sources: UN/DESA; United Nations (2012a; 2012b).Note: Data for each country have been aggregated to obtain regional figures.
2010
2000
1990
1980
1970
2010
2000
1990
1980
1970
0
5
10
15
20
25
30
35
40
0 400 800 1200
GDP per capita at constant 2005 prices in United States dollars
Sub-Saharan Africa
Least developed countries
Figure III.3 GDP per capita and urban share of total population, sub-Saharan Africa and least developed countries, 1970-2010
Sources: UN/DESA; United Nations (2012a; 2012b).
Note: Data for each country have been aggregated to
obtain regional figures.
61Towards sustainable cities
urban governance, which refers to the management and investment decisions taken by municipal authorities in coordination with national authorities and institutions. In this regard, chapter II provides guidelines for possible sustainable development paths for coun-tries at different stages of development.
The 1987 report of the World Commission on Environment and Development, also known as the Brundtland Commission, defined sustainable development as develop-ment that meets the needs of the present, without compromising the ability of future genera-tions to meet their own needs. The report included a chapter on urban issues. In 1991, the United Nations Centre for Human Settlements (UNCHS) Sustainable Cities Programme attempted to define a sustainable city as one “where achievements in social, economic and physical development are made to last” (United Nations Human Settlements Programme (UN-Habitat), 2002, p. 6). However, this definition was still too general and neglected the fact that a sustainable city must have a low ecological footprint and reduce risk transfer (economic, social and environmental) to other locations and into the future (Rees, 1992).
The concept of sustainable cities and its links with sustainable development have been discussed since the early 1990s.2 Sustainable cities should meet their “inhabitants’ development needs without imposing unsustainable demands on local or global natural resources and systems” (Satterthwaite, 1992, p. 3). In this sense, consumption patterns of urban middle- and high-income groups as indicated in chapters I and II are responsible for the use of a significant portion of the world’s finite resources and contribute significantly to the production of polluting wastes. Sustainable development should focus on better living and working conditions for the poor, including affordable access to, and improvement of, housing, health care, water and sanitation, and electricity.
The first approximations to a concept of city sustainability noted above were re-flected in the 1992 Rio de Janiero Conference on Environment and Development (United Nations, 1993) attended by more than 178 Governments. The 1992 Rio Declaration inte-grated the economic, social, environmental and governability dimensions of sustainability and argued for the eradication of unsustainable patterns of production and consumption, the eradication of poverty, and the role of the State, civil society and international com-munity in protecting the environment.
Another outcome of the United Nations Conference on Environment and Development was Agenda 21 (United Nations, 1993), which aimed at preparing the world for the challenges of the twenty-first century. Agenda 21, which was built upon at subse-quent United Nations conferences, defined sustainability in the context of economic, so-cial, environmental and governance issues, noting the decisive role of authorities and civil society at the local, national and international levels for the implementation of sustainable development policies. Yet, Agenda 21 did not explain how the concept of sustainability could become the basis for the creation of sustainable cities.
The Habitat Agenda (United Nations, 1997), adopted by the United Nations Conference on Human Settlements (Habitat II), held in Istanbul from 3 to 14 June 1996, echoed the concerns expressed in Agenda 21 with respect to the multidimensionality of development, and discussed urban sustainability as requiring a harmonious integration of economic, social and environmental issues. At this summit, nations reported on the progress towards achieving the sustainability of their cities. Yet, this Agenda still needed to include climate change as one of the main threats to building sustainable cities and to development in general.
2 See, for example, Environment and Urbanization, vol. 4, No. 2 (October 1992).
62 World Economic and Social Survey 2013
At the first session of the World Urban Forum convened at the headquarters of the United Nations Human Settlements Programme (UN-HABITAT) in Nairobi from 29 April to 3 May 2002, an in-depth discussion was held on urbanization in the context of sustainable development. The Forum affirmed that addressing economic, social, environ-mental and governance issues was integral to the creation of sustainable cities, and that the inability to address those issues would prevent the achievement of sustainable development (United Nations Human Settlements Programme (UN-HABITAT), 2002). The main mes-sages of the Forum were comprehensively discussed and reaffirmed at the World Summit on Sustainable Development, held in Johannesburg, South Africa, from 26 August to 4 September 2002. More recently, this approach to sustainable cities has been echoed the the Rio+20 Declaration (United Nations, 2012b, p.26) and by the United Nations System Task Team on the Post-2015 UN Development Agenda (2012), which includes governance under the broader umbrella of peace and security issues. In an increasingly urbanized world which demands more sustainable ways of living, urban governance entails the fostering of urban planning and environmental management, which includes the reduction of ecologi-cal footprints, and the decentralization of decision-making, and resource allocation, as well as enhanced policy coordination between local and national authorities.
In this context, achieving the sustainability of cities can be conceived as entail-ing the integration of four pillars: social development, economic development, environmen-tal management, and urban governance. Figure III.4 presents the four pillars for achieving urban sustainability encompassing the balanced accomplishment of social and economic development, environmental management and effective governance. Yet, the ways in which a city is able to build sustainability will reflect its capacity to adapt, within the context of its particular history, to the policy priorities and goals defined by each pillar.
Figure III.4 Pillars for achieving sustainability of cities
Source: UN/DESA.
Sustainable cities
Economic development
Green productive growth
Creation of decent employment
Production and distribution of renewable energy
Technology and innovation (R&D)
Social development
Education and health
Food and nutrition
Green housing and buildings
Water and sanitation
Green public transportation
Green energy access
Recreation areas and community support
Urban governance
Planning and decentralization
Reduction of inequities
Strengthening of civil and political rights
Support of local, national, regional and global links
Environmentalmanagement
Forest and soil management
Waste and recycling management
Energy efficiency
Water management (including freshwater)
Air quality conservation
Adaptation to and mitigation of climate change
Figure III.4 Pillars for achieving sustainability of cities
Source: UN/DESA, Development Policy and Analysis Division.
63Towards sustainable cities
The integration of the four pillars can generate synergies, for example, between waste and recycling management (environmental management) and access to water and sanitation (social development); between air quality conservation and green public trans-portation; and among production and distribution of renewable energy sources, green energy access, and adaptation to and mitigation of climate change, as well as between the goal of reducing inequities (urban governance) and that of ensuring adequate access to green housing, education and health (social development). Investment is the catalyst behind the realization of each of the component goals of urban sustainability.
To build upon the four pillars can be a challenge for many cities and countries. Cities are often at different stages of development and have their own specific responses to policy priorities at the local and national levels. In this sense, the sets of sustainability challenges to be overcome by cities are diverse.
The challenges associated with building sustainable cities
The present section analyses the main social, economic and environmental challenges as-sociated with building sustainable cities in developing and developed countries.
For city governments, the challenges include securing the necessary resources for investment in disaster-proof public infrastructure, and renewable sources of energy, and providing incentives to the private sector to create decent employment for large urban populations that are underemployed and have limited access to good housing conditions, clean water, sanitation, drainage and schools (table III.2).
Upper middle income and high-income countries with urban populations that already have access to basic public services face the challenge of becoming more efficient in the use of energy and water, reducing the generation of waste, and improving their recycling systems. Growth of cities has often gone hand in hand with an increased use of natural resources and ecological systems, driven by economic growth and changes in the economic structure—in terms of a shift from agriculture to manufacturing and then to services. While wealthier cities and people, in particular, may have well-managed resource systems, they also have a greater ecological impact through drawing resources from larger areas. For example, wealthier residents in New York City, Los Angeles and Mexico City contribute greatly to the demand for freshwater from distant ecosystems, whose capacities are conse-quently affected and whose use generates significant levels of pollution and greenhouse gas emissions at the national and global levels (McGranahan and Satterthwaite, 2003). Thus, urbanization can be an important contributor to high resource use and waste generation, both with ecological effects at the local, regional and global levels.
Some of the most significant challenges associated with building sustainable cities are discussed more extensively below.
Socioeconomic inequalities
Inequalities between rural and urban areas as well as within urban areas have been features of development and urbanization in developing countries (Cohen, 2006; Baker., ed., 2012). The gap between rich and poor neighbourhoods can imply significant differences in access to job opportunities and basic public services such as water and sanitation, electricity,
Social, economic and environmental challenges exert direct and indirect effects on cities and the lives of people in both developing and developed nations
Inequalities in access to basic services between rural and urban areas as well as within urban areas have been typical features of urbanization in developing countries
64 World Economic and Social Survey 2013
Table III.2Challenges to and opportunities for building sustainable cities
Main urban trendsDeveloping countries Developed countries
By 2025, urban population will live mainly in small cities (42 per cent) and medium-sized cities (24 per cent)
Improve access to housing, water, sanitation; improve public infrastructure; foster institutional capacity
Investment in public infrastructure (including transportation); construction of compact buildings in middle-income countries; strengthen links between cities and rural areas
Social cohesion Investment in compact urban development and decentralization
Number of urban people living in slums continues to grow
Reduce number of urban poor and disease risk; improve social cohesion; reduce youth unemployment
Investment in universal access to affordable water and sanitation; establishing public transportation, and creation of jobs to reduce growth of slums; employment of the “youth” dividend in low-income countries
Reduce urban unemployment due to economic crises (of youth in particular); provide adequate housing in poor neighbourhoods
Strengthening and widening social safety nets; upgrading investment in social protection for an effective response to crises and their aftermath
Inefficient use of public services (water, electricity)
Improve waste and recycling management; support consumption of local produce; change overconsumption patterns of high-income households
Subsidies to households and small firms to reduce non-saving water systems and waste; incentives to local communities to improve recycling systems
Change overproduction and overconsumption styles; improve waste and recycling management
Investment in retrofitting of buildings; in water- and energy-saving devices; upgrading of public infrastructure
Ageing Create productive employment for older persons
Investment in universal pensions; extension of working age; support for family networks
Fiscal pressure to reduce health costs; improve productivity
Investment in retraining older persons, and extending the working age
EconomicInequality and financial fragility
Create policy space for inclusive development; reduce underemployment; promote economic diversification
Investment in green industry, adaptation to climate change, structural economic change (industrial and service leapfrogging for least developed countries); strengthening regional cooperation
Reduce unemployment; boost economic growth; strengthen international cooperation
Investment on green infrastructure; policy coherence and coordination
Food insecurity Improve access to food; increase productivity
Investment in urban agriculture, local crops, storage facilities; R&D
EnvironmentalEnergy access Provide access to clean
energy and reduce use of “dirty” energy in poor households (e.g., least developed countries); discourage high-energy consumption in high-income households
Investment in capacity development, energy-saving devices, production and use of renewable sources of energy; subsidies and incentives for efficient energy use and water use for middle- and high-income households
Reduce overproduction and overconsumption to sustainable levels
Investment and incentives to produce and use renewable energy sources; decentralization of energy production
Climate change Reduce impact on livelihoods; reduce carbon emissions; generate financial resources for adaptation
Investment in health and education infrastructures and facilities; adaptation and mitigation technology, early warning systems, green public trans por- tation; strengthen regional cooperation for green technology transfer
Investment in mitigation, industrial green transformation; retrofitting of buildings; policy coordination
Source: UN/DESA, Development Policy and Analysis Division.
65Towards sustainable cities
education and health, housing and communications. As a consequence, many urban residents in developing countries suffer to varying degrees from environmental health issues associated to inadequate access to clean water, sewerage services, and solid waste disposal. In many cities of developing countries, adequate water and sanitation services are primarily channelled to upper- and middle-class neighbourhoods, while low-income neighbourhoods often depend on distant and unsafe water wells and private water vendors who charge higher prices than the public rate for water delivery (Cohen, 2006). The poor often live in highly overcrowded dwellings in shacks which lack basic infrastructure and services. On the whole, less than 35 per cent of cities in developing countries have their waste water treated, while globally, 2.5 billion and 1.2 billion people lack safe sanitation and access to clean water, respectively (United Nations Human Settlements Programme (UN-Habitat), 2012). For a broader overview and assessment of the impact of social and economic inequalities, see also chapters I and II.
Wider urban access to public services, income-earning opportunities and broader social interaction in cities has driven rural-urban internal migration in many de-veloping countries for the past 60 years (Beall, Guha-Khasnobis and Kanbur, eds., 2012). The speed of urbanization has ultimately outstripped the limits of the economic oppor-tunities provided by cities, making poverty a salient feature of urban life. Cohen (2006) suggests that congestion costs in large cities might be high, since the well-being advantage has declined in many cities of developing countries since the 1970s. Moreover, the rising urban inequalities in, e.g., Brazil, China and the Philippines in the 1990s is consistent with the existence of highly heterogeneous urban labour markets, which are in part the result of their high level of exposure to world markets.
Mitlin and Satterthwaite (2012) indicate that 1 out of 7 persons in the world lives in poverty in urban areas, mainly in informal settlements of the developing world, with inadequate provision of water, sanitation, health care and schools. Yet, urban poverty is still underestimated mainly owing to inadequate methodologies used to define and measure poverty. For example, the $1.25-per-day poverty line does not necessarily capture higher costs of food and non-food items in large cities, while indicators of improved water provi-sion include public taps and standpipes which often do not provide safe and regular water.
About 1 billion people, lacking basic infrastructure and services, currently live in slums, whose number may multiply threefold by 2050 if no policy framework is in place to reduce their growth (United Nations Human Settlements Programme (UN-Habitat), 2012). More than half of urban dwellers in countries of sub-Saharan Africa and 40 per cent in Asia lack access to basic sanitation (Baker, ed., 2012). The growth of cities in least developed countries, in particular, often results in a rise in the number of people living under precarious conditions in respect of their livelihoods and employment, whose effect on the environment is harmful through their use of “dirty” energy, e.g., wood and charcoal, to meet basic energy needs.
At the regional level, data provided by the United Nations Human Settlements Programme (UN-Habitat) (2010) indicate that 62 per cent of urban populations in sub-Saharan Africa live in slums, a proportion that is expected to rise in the next decades. Slums in Latin America and the Caribbean and regions of Asia house about 24 per cent and 30 per cent of the urban populations, respectively.
Further, international migrants working in low-skilled occupations have in-creasingly joined the ranks of the poor in the main cities of both developed and developing countries. Key industries and trades such as food production and processing, construction
66 World Economic and Social Survey 2013
and repairs, buildings maintenance, taxi driving, the garment industry, household services, and agriculture often engage a significant share of immigrant workers.3 Frequently living in insecure and low-quality conditions in terms of housing and public services, many immigrants are undocumented and disenfranchised. In New York City and other cities in the United States of America, for example, unsafe labour conditions for many immigrant workers include working schedules of up to 60-72 hours per week and no social benefits such as health care and social security (Orrenius and Zavodny, 2009; Passel, 2006).
Sprawl and weakened capacities
Many large cities have also experienced rising sprawl over the past 50 years, challenging urban planning. Wealthier citizens have chosen to reside on the outskirts of cities where they enjoy greater privacy, have bigger homes and better schools for their children, and are spared having to use public transportation and endure the frenzied atmosphere of urban downtowns. As a consequence, the carbon footprint of wealthier inhabitants, households and neighbourhoods is often much higher than that of the rest of urban inhabitants (McGranahan and Satterthwaite, 2003).
Small cities with less than 500,000 inhabitants experience a different type of vulnerability. Although there is much diversity in their economic structure, many small cities in developing countries have very weak economies and inadequate communication with more economically dynamic cities. These cities tend to have inadequate infrastructure for provision of basic public services, which may be of low quality. Access may be time-consuming, costly and risky (in the case, for example, of public transportation). Poor land management and weak urban planning capacities are part of the problem. The deficiencies in urban governance, institution-building and adjustment to changing land development conditions have reduced real possibilities for improving urban planning (Cohen, 2006).
Energy access
The present section highlights the differences between the energy needs of poor urban house-holds and countries and rich ones. Access to cleaner sources of energy is intrinsically linked to development, and vice versa. Countries with higher gross domestic product (GDP) per capita (e.g., above US$ 4,000) are associated with the use of electricity by above 60 per cent of the urban population, and the use of wood and charcoal for cooking by a low proportion of urban households (e.g., 20 per cent or less).4 In fact, cities in the majority of middle-income countries have access to electricity, including Amman, Bogota, Buenos Aires, Cairo, Caracas, Jakarta, Rabat, Rio de Janeiro and Santo Domingo (Satterthwaite and Sverdlik, 2013).
Similarly, while only 18 per cent of urban dwellers in developing countries use wood and charcoal for cooking, the proportion for least developing countries is almost four times higher. Overall, there are about 680 million people in developing countries with no access to modern fuels (table III.3). Lack of access to electricity is associated with
3 At the same time, some of the “best and brightest” immigrants make up an increasing proportion of scientists, engineers, computer specialists and medical doctors in cities of developed countries (Kapur and McHale, 2005)
4 In countries with GDP per capita of US$ 6,000 or more, 95-100 per cent of their urban population have access to electricity.
67Towards sustainable cities
informal urban settlements where dwellers typically have high transportation costs and poor-quality housing. The use of cheap fuels implies increased deforestation, pollution, health risks, energy cost and time burden. Poor people often have to spend a lot of time for travelling to purchase or gather those fuels. In contrast, regular electricity supplies would often be cheaper and safer, and could be used for household appliances (e.g., lights needed by children when doing their homework and for reading) and home enterprises.
Common and differentiated impacts of natural hazards
The adverse impact of social inequalities on human health and the environment is multi-plied when we factor in the adverse effects of “natural” disasters. Natural hazards linked to climate change events have also increased in intensity and frequency. Most disasters tend to occur in developing countries and the human cost in terms of both the number of persons affected and the loss of human lives is much higher in these countries. Yet, some developed countries have also started to be affected despite their generally greater resilience (United Nations, 2011b). Mutizwa-Mangiza (2012) indicates that 40 per cent of the world’s urban population, many of them poor and vulnerable to storms, floods and sea-level rise (e.g., southern Brazil, China, Viet Nam and Honduras), live less than 100 kilometres from the coast (see also World Bank, 2009).
The combined impact of sea-level rise, floods, heatwaves and storms have ad-versely affected millions of livelihoods, homes and lives in different countries, with projec-tions indicating that the trend will continue and, in some cases, worsen (United Nations, 2011b). Middle-income countries such as China, India, Indonesia, the Philippines and Viet Nam had the highest number of floods and storms combined during 2000-2009. Cities lo-cated along the west Coast of Africa and the coastlines of South, East and South-East Asia have been affected by sea-level rise, flooding and salt intrusion in river flows and ground-water, compromising the quality of clean water. Endemic morbidity and mortality due to diarrhoeal disease are projected to increase in these regions. The reduction of the Andean
Effects of climate change deepen the vulnerabilities of cities in poor nations and threaten the resilience and adaptation capacities of cities in richer nations
Table III.3Proportion of urban population lacking access to electricity and modern fuels, and proportion using particular fuels for cooking, developing and least developed countries, circa 2003-2007
PercentageLack of access to: Developing countries Least developed countriesElectricity 10a 56b
Modern fuels (mostly gas) 30c 63d
Fuel(s) used for cooking Developing countries Least developed countriesWood, charcoal, and dung 18 68Coal 8 3Kerosene 7 4Gas 57 20Electricity 6 4
Source: UN/DESA, based on Satterthwaite and Sverdlik (2013).a Comprising 226 million people.b Comprising 116 million people.c Comprising 679 million people.d Comprising 130 million people.
68 World Economic and Social Survey 2013
glaciers and the melting of the Himalayan glaciers have disrupted the regular production of hydroelectric plants and reduced water supply in many cities (World Bank, 2010a).
In fact, the likelihood of mega-disasters has seized the attention of policy-makers, particularly in countries that have long coastlines, including Australia, China, France, Indonesia, the Philippines and the United States. Coastal developments in urban centres are likely to sharpen disaster risks from sea-level rise and increased intensity and frequency of storms and floods (Lee and others, 2012). Although disaster risks such as droughts disproportionately affect rural areas, there have been recent disasters in urban areas—such as earthquakes in Japan (2011), Haiti (2010), Chile (2010) and China (2010); flooding in China (2010), Pakistan (2010), Brazil (2010, 2011) and Bangkok (2012); and the extensive damage wrought across cities along the East Coast of the United States following Hurricane Sandy (2012)—which highlights the fact that urban disaster risk is also a reality. The concentration of people and economic activity in areas at risk from ex-treme weather events or earthquakes can interrupt global supply chains, reduce economic output, reverse development gains, and affect the livelihoods of the poor who often live in those areas (Baker, ed., 2012; United Nations Office for Disaster Risk Reduction, 2013).
Stronger storms and saltwater intrusion in water systems have weakened adap-tive capacities in coastal cities of both developed and developing countries. The damages to infrastructure in the former and the weakening of resilience in the latter threaten their pol-icy space for taking effective adaptation measures and developing capacities for rebuilding.
The integrated effects of the challenges described above threaten the economic resilience of cities and heighten their vulnerabilities. Cities have to start perceiving those challenges as opportunities for investment and building cities to serve as the main pillars for a sustainable world.
Opportunities for building sustainable citiesAs demonstrated above, there are both challenges and opportunities associated with build-ing sustainable cities. The multidimensional impact of megatrends represents a strategic op-portunity for taking an integrated approach to urban planning and a major opportunity for investment in industrial transformation, improved infrastructure, social development and environmental management. Sustainable development in growing cities, of poor countries in particular, implies investment in infrastructure such as roads, water, sewers, electricity and services such as schools, public transportation and health-care. Leapfrogging invest-ment in green industrial transformation can generate employment for the “youth bulge” dividend experienced by those countries. In cities of middle- and high-income countries, investment in the production and use of renewable sources of energy, as well as in the renovation of infrastructure, retrofitting of buildings and improved efficiency in the use of electricity and water, is important. At the same time, investment in strategies for the reduc-tion of waste production and improvement of waste collection and recycling systems are needed in most cities across the world. Inevitably, there will be trade-offs between invest-ments yielding benefits in the short term, e.g., infrastructure for development, and those with benefits in the long term, such as environmental protection and disaster risk reduction.
Cities’ contribution to sustainable development can be multipled if more countries are committed to that goal and when people are able to produce, consume and govern their behaviour in a sustainable manner. Thus, urban sustainability defined within the framework of a global integrated approach must include both developed and developing countries.
Challenges also offer a strategic opportunity for
an integrated approach to urban planning and investment in
industrial transformation, infrastructure, social
development and environmental management
69Towards sustainable cities
An integrated and coordinated approach
An integrated approach to urbanization will be based on a holistic view of its social devel-opment, economic development, environmental management (at the local, national and global levels) and governance components. It will entail the coordination of objectives and programmes among different city stakeholders (e.g., citizens, government and the business sector), as well as the development of linkages between and within socioeconomic sectors and activities. In economic terms, the integrated approach tries to improve synergies and efficiencies among activities such as public transportation, energy consumption, biodiver-sity and human health.
Further, under an integrative approach, city administrations would integrate in-vestment in various types of infrastructures with the development of institutional and man-agement capacities and the active participation of all stakeholders in the process of building sustainable cities. The city of Curitiba in Brazil has gained worldwide recognition for having successfully developed that kind of integrated approach to sustainability over the past 40 years. A description of the relevant process involved in Curitiba is offered in box III.2.
At the national level, the integration of the rural and urban sectors is critical. Wider access to public services and development of linkages with industrial development can leverage rural sector capacities to exchange resources and information, and engage in social interaction, with urban areas.
Investment in economic and social infrastructure in rural settlements can be a catalyst for reducing rural-urban migration. Although every area is characterized by a different configuration of land use, resources and potentials, the systemic integration of different villages, towns and cities in the context of their particular specializations and strategic locations can bring sustainable development to both urban and rural areas. Box IV.2 illustrates the positive effects of investment in rural infrastructure on Uganda’s food sustainability.
Empirical evidence suggests that for the drivers of sustained development in some newly industrialized countries of South-East Asia (Cambodia, Indonesia, Malaysia and Viet Nam) within the past 50 years included improved social development in the rural sector, increased agricultural productivity, and food supply, and support of decision-making capacities of peasant farmers. In fact, macroeconomic stabilization was important insofar as it was directed towards reduction of poverty, which was understood to be concentrated in rural areas (Kees van Donge, Henley and Lewis, 2012). Henley (2012) argues that the economic success of South-East Asia was due to pro-poor agricultural development and historical consistency in respect of investment in agriculture, as was the case for Malaysia over the period 1956-1990. Pro-rural sector policies are not the same as pro-poor policies; for example, investment in land redistribution is not necessarily pro-poor when the money is allocated to purchase land and not to implement poverty-reduction programmes, as was the case in Kenya during the 1960s and 1970s.
The road towards building sustainable cities covers two types of invest ment, namely:
(a) Investment in infrastructure and capacity development to close social develop-ment gaps linked to the issue of access to good-quality public transportation, water and sanitation, health, education, housing and energy services in urban and rural areas;
(b) Investment in urban resilience, including industrial transformation towards the use of renewable energy sources, creation of decent employment in green productive activities, and adoption of adaptation and mitigation strategies.
Cities and nations need to engage in investment in public infrastructure, renewable energy, energy efficiency, adaptation, retrofitting of buildings, and better waste and recycling systems
70 World Economic and Social Survey 2013
How Curitiba became a reference point for sustainable development
Curitiba, a city in southern Brazil, has approximately 3 million residents (including in the metropolitan area). The implementation of the Curitiba Master Plan began during the first administration of Mayor Jaime Lerner in the early 1970s. The plan relied on the physical integration of a public transport sys-tem, land-use legislation and a hierarchized road network. The urban growth structure is character-ized by a linear expansion across five “structural geographical sectors” which are served by “express buses”. It links the city centre with the periphery and other neighbour municipalities, with priority given to public transport.
The implementation of the Master Plan was conducted incrementally, consonant with the perception of sustainable urban design as a long-term process. Curitiba first developed a modest express route system with dedicated bus lanes. It then sought out ways to improve and extend the system. The result was a surface networked system which provides high-quality service comparable with that of well-known underground systems but at a capital cost that is about 200 times less. As a result, mass transit is almost entirely financed by passenger fares.
The systematic approach to urban transportation has reduced travel times and in-creased convenience for commuters and other travellers. Private companies operate public buses whose intensive use continues despite the fact that Curitiba has one of the highest automobile ownership rates in Brazil. Rider surveys suggest that at least 20 per cent of the new bus passengers previously commuted by automobile. The city has replaced several downtown streets with broad pedestrian malls and shopping areas. Reduced traffic appears to result in substantial fuel savings as well as reduced carbon emissions. Estimates based on information from URBS, the public-private company that manages the system, suggest that the reduction in automobile traffic has saved 27 million litres of fuel per year.
While Curitiba is best known for its innovative public transport system, this is only one among many initiatives that have improved the environment and reduced resource use. For exam-ple, residents of subsidized low-income housing have easy access to public transportation whose route is in the direction of the Curitiba Industrial City, where polluting industries are not allowed. Curitiba has 60 square metres of green area per inhabitant, one of the highest rates among all cities in the world. Curitiba’s green spaces are integrated with flood control; and artificial lakes in many public parks provide a flood control system for the entire city. A strictly enforced citywide policy ensures that rivers and streams are protected and rainwater is collected and recycled.
Curitiba has also implemented relevant solid waste programmes. The “Garbage that is not garbage” initiative, created in 1989, promotes domestic recycling through the separate collection of more than one thousand tons of metal, plastic, glass and paper per month. Additional benefits of this programme have included the positive change in the attitude of the population towards recy-cling and the extension of the life of landfills through the conservation of considerable space. The goal of the “Garbage purchase” programme is to clean up dense areas in low-income communities (favelas), where garbage collection vans do not have space to circulate. The community sells garbage to the city in exchange for bags of food, bus tokens, notebooks and tickets for soccer matches and plays. The innovative feature of these programmes is the integration of environmental improvement with social inclusion.
City planning is an ongoing challenge. Curitiba has grown more than fourfold in the last 30 years, which has resulted in social issues and the environmental challenges associated with traffic and transportation, land use, waste management and housing. Yet, Curitiba continues to stand out as a visible point of reference for integrated urban development based on sustainability princi-ples. The most important lesson is that Curitiba has taken control of its own destiny by embracing a sustainability approach which has brought important benefits. At the same time, it has become an inspiration for thousands of small and medium-sized cities worldwide which are about to make crucial choices for their future and the future of the planet.
Box III.2
Source: Jonas Rabinovitch, Senior Adviser on
Governance, Public Administration and
e-Government Issues, United Nations
Secretariat.
71Towards sustainable cities
The first area of investment applies mainly to cities located in low-income coun-tries and should be part of a development agenda that is supported by the international community with a view to spurring sustainability. In particular, support should be directed towards infrastructure investment efforts made by poor countries in order to reduce poverty (see box III.5 for an example of investment in waste processing infrastructure (Dhaka)). The second area of investment applies mainly to cities located in middle- and high-income countries. In the case of economies with fast growth, for example, resources generated by sustained economic growth in the past decade can serve as a means of financing the produc-tion and use of renewable energy as well as building resilience against natural hazards.
All things considered, building sustainable cities requires an integrated ap-proach to investment in (a) rural development and affordable access to public services by the urban poor, (b) rapid, reliable, accessible and affordable public transportation in all its forms, (c) industrial transformation based on the production and use of renewable energy sources and the creation of decent jobs, (d) retrofitting of buildings and increase in the number of green areas, (e) improved efficiency in the use of water and electricity and (f ) effective management of waste and recycling systems.
A study of urban households in the United States by Holian and Kahn (2013) indicates that investment and effective measures to reduce air pollution and crime in down-town areas have resulted in higher urban population density and reduced per capita carbon emissions. The Plan Verde of Mexico City is also making positive strides in reducing urban air pollution and carbon emissions (box III.3).
Green investment in poor countries would enable them to leapfrog from dirty/high-carbon energy use to a low/zero-carbon development path. Investment is needed in the renovation of infrastructures of transportation as well as in education programmes that value efficiency in the use of public services. Households and businesses in cities of middle- and high-income countries would need to continue investing in improving the quality of life in urban centres and to create incentives to retrofit buildings and subsidies for producing and consuming clean energy sources. Box III.4 lists 10 essentials for invest-ments and measures to reduce disaster risk, including investment in critical infrastructure, and early warning systems, and direct involvement of communities in designating preven-tion and reconstruction priorities.
Trade-offs between investments?
Cities with a growing number of informal settlements are trying to meet basic urban infrastructure needs, such as for public transportation, clean piped water, drainage sys-tems and waste management. As a result, investment in adaptation to climate change may take a back seat to investment in development. Moreover, building resilience has been constrained by poor infrastructure, weak institutions and lack of enforcement of planning regulations, e.g., in Pakistan. Similarly, in Narok and Kisumu (Kenya) and Moshi (United Republic of Tanzania), the municipalities’ limited capacity, knowledge and coordination, and competing priorities, have prevented the adoption of disaster risk reduction strategies (United Nations Office for Disaster Risk Reduction, 2013).
Post-disaster reconstruction is another area where cities often face trade-offs between investing in sustainable development and re-establishing services. As observed by the Intergovernmental Panel on Climate Change (2012b), tensions frequently arise as a result of competing demands for speed of delivery and sustainability of outcome. Response
72 World Economic and Social Survey 2013
and reconstruction funds tend to be time-limited, often requiring expenditure within 12 months or less from the time of disbursement, with disregard for long-term pay-offs. Such pressure is compounded by the fact that multiple agencies work with limited resourc-es and coordination. Indeed, trade-offs are often a by-product of short-sighted approaches versus long-term investment in win-win sustainable development solutions.
In fact, trade-offs between investments are often associated with whether or not formal established incentives exist for a particular type of investment. Wu and others (2013) argue that, in China, investments in transportation infrastructure, e.g., roads and electrification, tend to attract more incentives and therefore more rewards than invest-ments in the environment. For these reasons, local urban authorities often prioritize the former type of investment based on its higher correlation with real GDP growth, career promotion and cities’ revenues from land lease sales. As a result, investments in the envi-ronment tend to be negatively affected.
Plan Verde of Mexico City
In 1990, Mexico City had had 333 days in which the ozone level rose above Mexico’s national standard. In 2006, the city developed a 15-year Plan Verde which included the goal of reducing greenhouse gas emissions by 7 million metric tons during 2008-2012, which was accomplished in a timely manner. The Plan also has a business and citizens education component. Nearly 20 city agencies have worked together to optimize the use of the $1 billion-per-year investment, which represents about 7 per cent of the city’s yearly budget. By 2009, the number of days with an ozone level above the standard had fallen to 180. Moreover, the average number of hours per day during which the ozone standard was above the norm fell from 4.9 in 1990 to just 1.5 in 2009.
In addition to improving air quality, the plan includes other “pillars” encompassing: land conservation; public spaces; waste management and recycling; water supply and sanitation; climate action planning; and transportation and mobility. The city’s efforts to control atmospheric pollutants have included replacing ageing taxis, microbuses and government fleets with lower-emissions vehi-cles, introducing a bike-sharing programme, and building a bus rapid transit system. The city offers a tax incentive of 10 per cent of the value of a building for promotion of green roofs. By December 2011, 21,000 square metres of green roofs had been installed in public buildings and private establish-ments. The city has also implemented 22 programmes on 11,000 hectares of conservation land for improving water management by reducing soil loss due to water and wind erosion.
To reduce the effects of population growth and the increase in vehicle fleets, the city has plans to replace official Government vehicles with fuel-efficient and low-polluting units. By 2012, four lines of a bus rapid transit system which used clean-burning, ultra-low sulphur diesel fuel had been inaugurated. The city is investing $2 billion in constructing a twelfth metro line and is providing subsidies for replacing ageing taxis. By December 2011, 75,000 taxis had been replaced with more efficient vehicles and 12,695 taxis had been scrapped. The city has restricted vehicle usage on certain days and in certain high-traffic zones as part of the Hoy no circula programme which is designed to reduce both traffic and emissions. The city has also introduced a bicycle mobility strategy (EcoBici), which includes free bike rentals and the creation of 21 kilometres of new bicycle paths. The city has also built bicycle-parking infrastructures at major metro subway stations. By December 2011, EcoBici had made 1,200 bicycles available at 90 bike stations and had 35,000 registered users, who had taken a total of 3 million trips.
By focusing on improving air quality across multiple dimensions including land use, transportation, waste management and climate action planning, the city has produced effective programmes in seemingly unrelated areas such as water use and supply.
Box III.3
Sources: United Nations (2010b); and http://www.
mexicocityexperience.com/green_living/.
73Towards sustainable cities
Learning by doing in building sustainable cities
Building sustainable cities entails integration and coordination among sectors. For ex-ample, a land plan would need to include space for industry, residential housing, and green areas, to be integrated with adequate space for access to public transportation. Some overlaps would exist since investment in green infrastructure, for example, can imply a reduction of CO2 emissions, while protection of green areas can include management of groundwater sources.
Similarly, integration within sectors such as transportation would include the development of linkages between various transportation modes (e.g., bus, tram, metro, bi-cycle and walking) in order to reduce travel time, gas emissions and the use of private cars. China, Hong Kong Special Administrative Region, for example, has an extensive network of privately owned minibuses; maintains a low-fare tram system in the traditional downtown; and has effective pedestrian connection links with commercial buildings which double
Building sustainable cities entails integration and coordination among social, economic and environmental sectors as well as within sectors such as transportation
The 10 essentials for urban resilience
1. Put in place the organization and coordination needed to promote the understanding and reduction of disaster risk, based on participation of citizens groups and civil society. Build local alliances. Ensure that all departments understand their role in disaster risk reduction and preparedness.
2. Assign a budget for disaster risk reduction and provide incentives for homeowners, low-income families, communities, businesses and the public sector to invest in reducing the risks they face.
3. Maintain up-to-date data on hazards and vulnerabilities. Prepare risk assessments, to be used as the basis for urban development plans and decisions, and ensure that this information and the plans for your city’s resilience are made readily available to the public and are fully discussed with them.
4. Invest in and maintain critical infrastructure which reduces risk, such as flood drainage, adjusted where needed to cope with climate change.
5. Assess the safety of all schools and health facilities and upgrade them, as necessary.
6. Apply and enforce realistic risk-compliant building regulations and land use planning principles. Identify safe land for low-income citizens and upgrade informal settlements, wherever feasible.
7. Ensure that education programmes and training on disaster risk reduction are in place in schools and local communities.
8. Protect ecosystems and natural buffers to mitigate the impact of floods, storm surges and other hazards to which your city may be vulnerable. Adapt to climate change by building on good risk reduction practices.
9. Install early warning systems and emergency management capacities in your city and hold regular public preparedness drills.
10. After any disaster, ensure that the needs of the affected populations are placed at the centre of reconstruction, with support for those populations and their community organizations in designing and helping to implement responses, including rebuilding homes and livelihoods.
Box III.4
Source: United Nations Office for Disaster Risk Reduction (2012), chap. 4.
74 World Economic and Social Survey 2013
pedestrian capacity, directing people away from the noise and fumes generated by motorized traffic. Similarly, Bangkok has adopted the bus rapid transit (BRT), “a transportation system that mobilizes high-capacity buses along routes with limited stops” (Lim, 2012, p. 36).
In respect of water management, cities face access and efficiency challenges. Phnom Penh and Cape Town have been able to meet challenges by providing clean water at affordable rates to all people, including the poor living on the outskirts. Singapore has overcome its long-term water dependency with multi-pronged actions which included the installation of desalination plants and the recycling of waste water (Lim, 2012).
The annex to this chapter sets out the different profiles and policy experiences of a sample of cities in respect of building urban sustainability. Independent of its size or its breadth of experience, each city has started on its own road towards urban sus-tainability. Cities such as Curitiba, Copenhagen and Freiburg have greater experience in building sustainability, and a few of their accomplishments have already served as models for other cities; for example, Curitiba’s integrated bus system has been emulated by the TransMilenio bus system of Bogotá, Metrovia in Guayaquil, and Metrobús in Mexico City. Other cities have just started to design and implement a sustainability plan. As stated earlier, cities are poised to become pillars of sustainable development. In this sense, urban governance (figure III.4) can promote a more balanced and inclusive development as well as ensure a more effective use of local and national resources.
As policy areas, the sectors indicated in the annex capture the economic, social and environmental aspects of urban sustainability. The specific measures and activities listed in each cell do not necessarily constitute all of the actions taken by each city; rather, they reflect mainly the relevant information found and some of the agreed priority initia-tives that cities have begun to carry out. In particular, some cities have been quite actively supporting green infrastructure (in buildings and transportation); renewable energy and reduction of CO2 emissions; and management of waste and recycling.
The sustainability challenges faced by each city are diverse and reflect the size of its economy, technology capacities and population (e.g., Shanghai has 21 million residents, while Ilo has 53,000 residents), as well as its development priorities. Information and communications technologies (ICT) can increase efficiencies, reduce costs and enhance quality of life; however, the adoption of ICT depends on the capacity to scale up and on flexibility for implementation in different urban settings. Indeed, ICT also offers an op-portunity to integrate cities’ infrastructures, including utilities, real estate, transportation and other public services (Falconer and Mitchell, 2012).
Cities’ priorities are determined by their own urban planning capacities and by the pressing development challenges that they face. Different stakeholders, coming, e.g., from the business, professional, government and political sectors, often gather to discuss how to build a particular city’s sustainability. Their individual views on urban sustain-ability have to be synthesized to yield common denominators, e.g., a common language and a unified approach to implementation. The survey presented in the annex reveals the existing gaps and the diversity of policy priorities adopted in different cities. For example, housing in Kampala is a priority owing to the fact that 60 per cent of its inhabitants reside in slums, while in Paris one priority is to ensure the implementation of insulation pro-grammes for old buildings in order to improve households’ energy efficiency. On the other hand, it is the Clean Air Project that is of foremost importance in Ilo, a city whose mining activities have produced “one of the world’s highest levels of air pollution” (Boon, Alexaki and Herrera Becerra, 2001, p. 215). The improvement of water infrastructure is essential
75Towards sustainable cities
to improving the quality and efficiency of water use in a large urban area like Mexico City, while protection of groundwater to ensure a supply of safe drinking water and reduction of water consumption per capita are main priorities in Shanghai and Freiburg.
In this context, the fact that cities differ in their complexities militates against a “one size fits all” approach towards sustainability, since such differences render their priorities, objectives and paths diverse as well. Thus, measures of progress will be tailored to the particular challenges and opportunities determined and prioritized by the cities’ main stakeholders. Yet, establishment of stakeholder roles must precede development of a sustainability plan. For example, Governments should develop technical standards, e.g., building codes while working closely with the private sector; in its turn, the private sector should develop processes for partnering with government, academia and non-governmen-tal organizations “to ensure solutions that are both functional and economically feasible” (Falconer and Mitchell, 2012).
It is important to underscore the significance of ambitious housing plans and successful integration of public transportation infrastructures in some cities. In this regard, it is worth mentioning that China plans to build up to 36 million subsidized flats by 2015 for low-income people, mainly for the rural workers who come to work temporarily in the city and cannot afford decent housing. Similar subsidized housing projects are planned in Bangkok and Kuala Lumpur in order to reduce slums and squatter settlements (Lim, 2012). Of course, the quality of the housing to be built in terms of sustainability (based, for example, on the materials used and energy efficiency) will need to be assessed. The challenges faced by these cities in respect of providing adequate housing are enormous. For example, a vast floating population circulating among most of the cities in China, which is important for their economic success, do not have access to Government services (Mitlin and Satterthwaite, 2012).
In general, the integration and coordination of different infrastructures and modes of public transportation save travel time and energy and reduce congestion and car-bon emissions; the success of these measures has been reported in cities like Copenhagen, Curitiba, Freiburg and Paris. Other cities, like Bangkok, Lima, Mexico City and Singapore, are also working on integrating different forms of public mobility. In many of these cities, the goal is to reduce the transportation time between home, the city and the workplace, so as to reduce energy consumption and ensure that people have more time to be productive and enjoy urban life.
Copenhagen’s Finger Plan 2007 includes protection of its green belt and limita-tion of sprawl development through better use of city land, with new compact buildings located near public transportation and other services. The protection of green belts are im-portant for reducing carbon emissions and supporting urban agriculture, which can provide employment to local farmers, bring fresh produce to urban residents, and stabilize food prices, since transportation and packaging costs are thereby reduced. More important, direct public participation has been vital for planning legislation in Copenhagen, through, for example, the Citizen’s Dialogue Project, which is being financed through the city’s annual budget.
Freiburg promotes the integration and mixing of functions within compact buildings and neighbourhoods which encompass shops, medical offices, schools, churches and children’s playgrounds, including nearby green spaces. Renewable energy production is encouraged through the tax credits from the federal Government and subsidies from the regional utility Badenova; grass-roots financing schemes also allow citizens to invest directly in renewable energy sources.
76 World Economic and Social Survey 2013
It is important to note the level of awareness that some cities have attained with respect to waste reduction and recycling for urban sustainability. Waste is treated as a raw material and energy source in Freiburg, while cities like Copenhagen, Curitiba, Kampala, Shanghai, Singapore and Stockholm, have made significant progress in recy-cling and reducing waste. Private-public partnerships have often been the key to financing and improving waste collection and transformation. Although by many accounts, Dhaka exemplifies a city with an unsustainable growth pattern, box III.5 indicates that, even under those circumstances, it is possible to build up an effective partnership on solid waste management.
Lastly, in many cities, the use of the bicycle is becoming an essential part of public transportation. Education and initiatives to discourage car circulation (e.g., through the imposition of higher tariffs during rush hours in Singapore and the Hoy no circula programme in Mexico City), and the provision of adequate infrastructure, such as bike parks near metros and bike lanes, free bike rentals, and bike-sharing, have facilitated the rapid adoption of bicycles as a means of transport and the rapid spread of their use in cities of both developed and developing countries.
Act locally with national support and global coordination
To strengthen the financial and decision-making capacities of cities, national Governments need to adopt an inclusive and decentralized approach towards the use of resources and development. Issues such as rapid ageing in developing countries pose a real challenge to urban authorities, which often do not have sufficient resources to respond and therefore need long-term sources of finance. National authorities need to enhance decentraliza-tion and share the resources needed for economic growth to increase the policy space of local administrations. Effective dialogue between urban and national authorities on development priorities can be a means of identifying synergies and areas of development for national, regional and global coordination.
National sustainable strategies of development should explicitly consider cities as main pillars for building sustainability. Some countries have already begun to build sustainable cities in country capitals such as Copenhagen, Oslo and Stockholm and in a selected group of cities including Tianjin, Chongqing and Shenzhen (eco-cities) in China.
A coordinated international response is necessary. Sustainable national strate-gies should reflect development priorities that are consistent with cities’ priorities. For example, food security and adaptation to climate change are two of the most immediate priorities in poor countries, while recovery from financial fragility and measures for reduc-ing the impact of ageing can be pressing priorities in rich countries. In both cases, upfront investment in green productive activities, infrastructure and efficient use of public goods is essential for building thriving and sustainable cities.
Urbanization will be truly sustainable only when it engages the commitment of the global community. To overcome the challenges to building sustainable cities, the identification of common and differentiated urban development priorities should itself be prioritized and those priorities should be consistent with common and differentiated responsibilities for addressing the impact of climate change among countries. Further, binding commitments between countries to confront cross-border challenges such as cli-mate change can greatly improve the effectiveness of urban sustainability strategies.
77Towards sustainable cities
Financing sustainable cities
The scale and scope of needed finance
Building sustainable cities poses significant financial challenges to national and municipal authorities. It entails commanding enough resources to finance the cost of infrastructure and the provision of a wide range of public services, within the context of major chal-lenges such as ageing of populations and climate change threats. Urban authorities have to prioritize competing financing requirements, usually without sufficient budget resources to address the challenges of sustainable development simultaneously.
The nature of the trade-offs between economic development and climatic pri-orities varies from city to city. For cities located in poor countries (low-income and lower
A partnership in Dhaka to convert organic waste to a resource and generate carbon credits
Economic development, population growth and urbanization have generated rising volumes and diverse streams of municipal solid waste in Dhaka, a city with limited urban infrastructure and capa-bility. The city generates 3,500 metric tons of municipal solid waste daily, which is transported to a sanitary landfill. However, uncontrolled land filling has become a common practice in the city, which does not have adequate facilities for treatment, recycling and disposal of hazardous waste, a com-mon problem in many cities of poor countries. Eighty per cent of municipal solid waste generated in Dhaka is organic in nature, with a moisture content ideal for recycling into compost.
Waste Concern, a local non-governmental research organization, works in partnership with the Government, the private sector, international agencies and local communities to imple-ment community-based composting. Its services include waste collection, separation and com-posting. Since its launch of solid waste management projects in 1998, Waste Concern has served 30,000 people in Dhaka and 100,000 in 14 other cities and towns in Bangladesh, including low- and middle-income communities. The project has led to new job opportunities and better livelihoods in the communities.
Innovative financial arrangements have included community involvement and public-private cooperation. Communities utilize a door-to-door collection service and share the cost of waste collection by paying a monthly fee based on affordability. The private sector stakeholder has joint venture partners which include Waste Concern and banking institutions. The investment re-quired for the project was 12 million euros and the mode of financing was made up of equity (38 per cent), a soft loan (45 per cent) and a loan from a local bank (17 per cent).
A private company ensures the sale of compost by enriching the compost with nutri-ents and effecting its subsequent distribution to the market (e.g., farmers). As a result, 75 per cent of the project’s revenue comes from the sale of compost. The partnership was also registered as a Clean Development Mechanism project under the United Nations Framework Convention on Climate Change;a as a result, the remaining 25 per cent of the revenue comes from community contributions in the form of a user fee and the sale of certified emissions reductions (CERs).
The project had several positive effects: (a) reduction of the landfilling budget of the city; (b) creation of assured revenue for 10 years through the sale of compost and CERs; (c) creation of 800 jobs for poor urban residents; (d) production of 50,000 metric tons of compost for sustainable farming; and (e) achievement of knowledgeability by urban communities about the resource value of waste.
Box III.5
Source: United Nations (2010b).a United Nations, Treaty Series, vol. 1771, No. 30822.
78 World Economic and Social Survey 2013
middle income), sustainable development depends mainly on their capacities to finance investment in green infrastructure and access to basic services. For cities located in richer countries (upper middle income and high-income), financing is needed for restructuring cities’ design, infrastructure, transport and efficiency in the use of water and electricity.
Similarly, with a growing number of international migrants and rising in-equalities among countries, global and medium cities in both developed and developing countries are challenged to provide adequate public services. On the other hand, immigra-tion has often stimulated the economic and cultural revival of urban neighbourhoods and has been a source of labour vital for the growth and competitiveness of the cities. At the same time, many cities across the world need resources to finance the industrial processing of waste and the improvement of recycling systems.
A policy framework for sustainable financing
The creation of a policy framework for responding effectively to the challenge of financing the sustainability of cities requires multilayered cooperation among local national and global communities, including the development of partnerships to harness public and private resources for the purposes described above.
Financing investment in public infrastructure, including adaptation to and mitigation of climate change, is a daunting task, one that often demands large sums of upfront finance and an acceptance of the fact that returns will be seen mainly in the medium and long terms.
Regulatory measures, including market and non-market mechanisms, are important for determining pricing structures, taxes and subsidies for households and industry, e.g., for the development of compact neighbourhoods and the retrofitting of buildings. Various types of taxes—included, for example, in lower fares for public trans-portation—can be used to finance the gap between the financial outlay and the actual cost of services.
Thus, for cities in poor and rich countries alike, part of the financing would have to be directed towards limiting the damaging effects of climate change on the envi-ronment, biodiversity and the livelihoods of present and future generations. In this sense, the principle of common and differentiated responsibilities can guide the establishment of an international cooperation framework capable of supporting the development and resilience of poor countries.
Oil-exporting and emerging economies experiencing relatively high economic growth but with urban settlements vulnerable, for example, to sea-level rise, storms and droughts, should use part of the resources generated to finance cities’ risk reduction strate-gies and improved infrastructure for adaptation, mitigation and provision of public services.
Examples of financing strategies
Bond banks and resource pooling can be useful instruments for reducing risk. In 1998, the Ahmedabad Municipal Corporation issued 1 billion rupees in bonds (without a State guarantee) to finance a water supply and sewerage project. The bond issue improved the city’s finances (World Bank, 2013).
Public-private partnerships can also serve as viable instruments for raising funds for financing infrastructure projects, particularly in developing countries with
79Towards sustainable cities
limited access to long-term credit. Public-private partnerships can improve asset utiliza-tion and favour cost recovery through user fees. For example, improvement in the quality of public transportation services through engagement of the private sector can justify higher fees (see the annex for information on the public-private partnership established in Freiburg, Germany, to finance the production of renewable sources of energy).
Cities in poor countries may also leverage the value of land to finance infra-structure. In Cairo, for example, the auction of 3,100 hectares of desert land in 2007 generated $3.1 billion. This amount of resources was to be used to reimburse costs of internal infrastructure and build a connecting highway to the road surrounding Cairo. Leaseholds can also leverage the value of land. These instruments can generate the initial capital needed to cover the start-up costs of infrastructure investments. In the long run, other instruments, such as property taxes, can finance maintenance and upgrade of public investments. However, land-based financing instruments require relatively strong and ef-fective institutions and well-articulated legal frameworks.
Viet Nam has been able to finance universal access to electricity and achieve high levels of access to water and sanitation. In the poorest provinces, equalization has enabled access to basic services. Cities also finance themselves through taxes, land leases, short-term debt, investment funds and cross-subsidies from provincial public utility companies. Land leases, for example, are becoming an increasingly important source of finance. Yet, financing infrastructure services is still a challenging task for many cities (World Bank, 2013).
Sources of finance can have different degrees of stability and predictability. Financing for Germany’s cities is largely derived from tax income tied to business profits, which can fall during times of crisis. For example, since Berlin is liable for high interest payments on past borrowing, it has requested debt relief from the federal Government. In contrast, city budgets in France and Italy rely more on real estate taxes, partly because the revenues are more stable and easier to predict.
However, the situation of cities in many poor countries is more problematic. Financial support from national Governments and donor agencies is often minimal, and provided, typically, only for the initial construction of infrastructure and not for ongoing operations. Thus, cities rely mainly on fees, tariffs and property taxes. However, property valuations can be out of date or incomplete, while capacities to collect taxes remain weak. Sprawling, in particular, can weaken tax systems in dynamic cities since, frequently, sub-urban residents pay property taxes not in the city where they work but in a different—and smaller—community (PricewaterhouseCoopers, 2012).
In a context of policies of fiscal restraint, some national Governments are pressed to grant more autonomy to cities in generating resources and determining their destiny. For example, since 1988, the central Government of China has not financed local expenditure; hence, local governments have to provide and finance public services.