106 Chapter 4 Detection of Cell Surface Markers with Encoded ssDNA Reporters: Towards Global Cell Surface- ome Profiling 4.1 Introduction The proteins on the surface of the cell membrane play important roles in various aspects of tumor biology. Cell surface markers are involved in cancer pathogenesis, aid in staging, and represent a large class of proteins targeted for therapy. The importance of the membrane-bound oncogenes EGFR and ERBB2 and the development of small molecule inhibitors against them have been expounded on in the previous chapters. Identification of altered or expression of cancer associated surface antigens is an area of active research. For example, the cell surface marker CD40 has been found to be expressed in many B cell malignancies and has been investigated as the possible target for anti-CD40 antibody-based cancer therapy (1). Development of methods that enable
Transcript
106
Chapter 4
Detection of Cell Surface Markers with Encoded ssDNA Reporters: Towards Global Cell Surface-ome Profiling
4.1 Introduction
The proteins on the surface of the cell membrane play important roles in various
aspects of tumor biology. Cell surface markers are involved in cancer pathogenesis, aid
in staging, and represent a large class of proteins targeted for therapy. The importance of
the membrane-bound oncogenes EGFR and ERBB2 and the development of small
molecule inhibitors against them have been expounded on in the previous chapters.
Identification of altered or expression of cancer associated surface antigens is an area of
active research. For example, the cell surface marker CD40 has been found to be
expressed in many B cell malignancies and has been investigated as the possible target
for anti-CD40 antibody-based cancer therapy (1). Development of methods that enable
107
comprehensive mapping of the cell surface proteome would provide new avenues for
investigation, analogous to the effect global transcriptome expression profiling has had in
providing valuable fundamental and therapeutic information for various types of cancers
(2). However, there have been few documented effective strategies for high-throughput,
global profiling of surface membrane proteins. One approach is to purify cellular
membrane fragments by two-phase separation, but cross-contamination from cytosolic
proteins is a major limitation (3). Other reports have demonstrated the feasibility of
retrieving membrane fragments in vivo from endothelial cells using a combination of
colloidal silica particles and polymers (4). Membrane proteins have also been isolated
through chemical biotinylation followed by enrichment with a streptavidin column (5–7).
Typically after enrichment, the membrane bound proteins are identified by the
combination of 2-D gel electrophoresis and mass spectrometry. A major limitation of
these studies is that the labeling strategies are non-specific and the biological samples are
lysed, precluding dynamic studies.
In this chapter summarizing current work, I present an antibody-based,
membrane-protein profiling approach, which uses a library of capture agents to probe
membrane-bound antigens. Similar to DEAL or NACS conjugates, each capture agent is
conjugated to a distinct ssDNA tag but differs in that the sequence incorporates a photo-
labile base. The capture agents are allowed to bind to cell surface antigens, after which
the ssDNA tags are released into solution by UV-induced cleavage, collected and
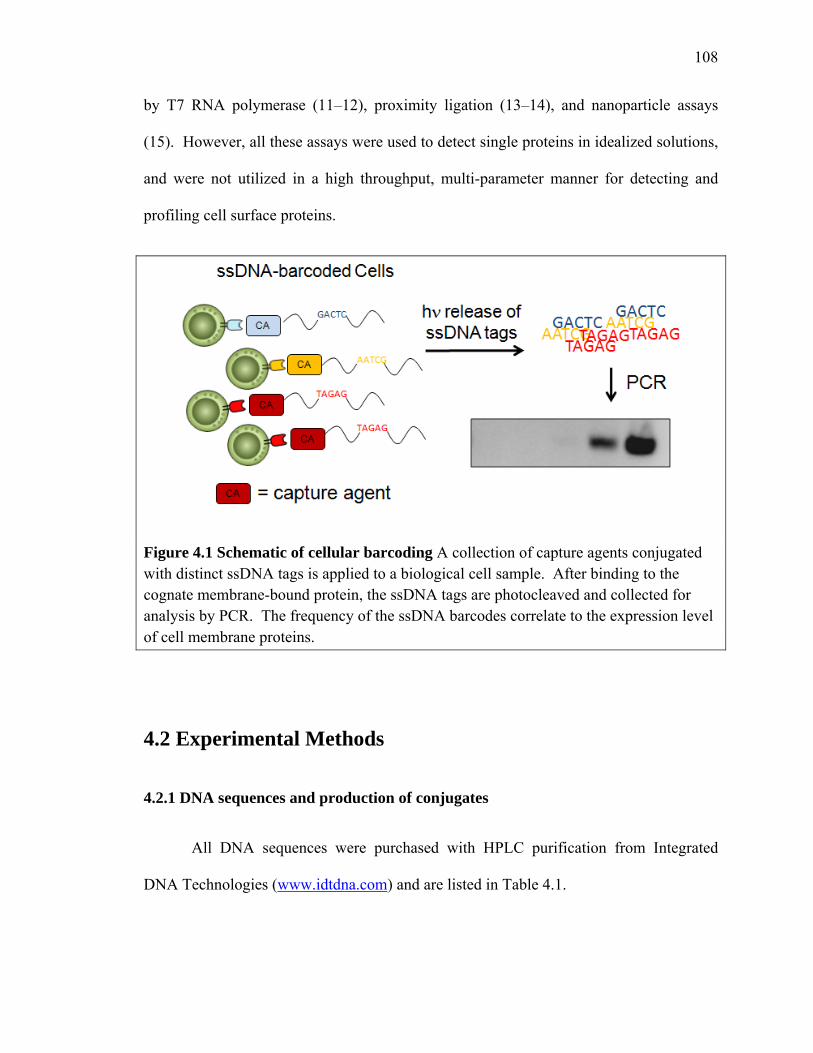
detected by PCR (Figure 4.1). This approach is called cellular barcoding. There have
been quite a few studies integrating the specificity of antibodies for antigen detection
with nucleic acid readouts, including immuno-PCR (8–10), immunodetection amplified
108
by T7 RNA polymerase (11–12), proximity ligation (13–14), and nanoparticle assays
(15). However, all these assays were used to detect single proteins in idealized solutions,
and were not utilized in a high throughput, multi-parameter manner for detecting and
profiling cell surface proteins.
Figure 4.1 Schematic of cellular barcoding A collection of capture agents conjugated with distinct ssDNA tags is applied to a biological cell sample. After binding to the cognate membrane-bound protein, the ssDNA tags are photocleaved and collected for analysis by PCR. The frequency of the ssDNA barcodes correlate to the expression level of cell membrane proteins.
4.2 Experimental Methods
4.2.1 DNA sequences and production of conjugates
All DNA sequences were purchased with HPLC purification from Integrated
DNA Technologies (www.idtdna.com) and are listed in Table 4.1.
5’ – TAG ATA CTG CCA CTT CAC ATT AGC GAT AGT AGA CGA GTG C
A’ 5' - NH2- AAA AAA AAA ATA CGG ACT TAG CTC CAG GAT-cy3
* The 5’ amine functional group for sequences PC and EcoRV is necessary to conjugate the oligonucleotide to SAC or antibodies. 1 PC = photocleavable
Antibody-ssDNA (DEAL) conjugates were synthesized, purified and characterized
according to previously published protocols (16). The HLA-A*0201 restricted MHC class I
monomers loaded with MART-126-35 (ELAGIGILTV) were produced in house according
to previous published protocols (17). The production of p/MHC-ssDNA constructs
(NACS conjugates) were according to previous published protocols (18).
4.2.2 Detection of surface markers with PCR
Prior to all experiments, blocking buffer (1.5% BSA, 150 μg/ml salmon sperm
DNA in PBS) was used to block all 1.5 ml tubes and a 96-well plate for 1 hour at room
temperature (RT) before rinsing 2x with PBS. The blocked tubes and plate were used
immediate for experiments. One million cells (Jurkatα-MART-1, Jurkatα-Tyro, or GBM1600)
were transferred to 1.5 ml tubes, and resuspended in 100 μl staining buffer (HBSS
supplemented with 2.5mg/ml BSA, 10mM HEPES, 0.01% azide). The cells were
blocked by adding 100 μl of 2mg/ml salmon sperm DNA for 20 min. at 37oC before
110
resuspension in staining buffer. Capture agents tagged with ssDNA (Cetuximab, MART-
1) were added (0.5 μg per 106 cells) to the cell suspension for 20–25 min. at 37oC. The
samples were then washed 3x with staining buffer before a final wash and resuspension
in 1% BSA PBS. For UV-dependent cleavage of the ssDNA tags, 5 x 10⁵ cells in 50 μl
were transferred to a 96-well plate on ice and exposed to long wave UV for 1 hr. The
cells were pelleted and the supernatant containing the DNA codes was collected for PCR
analysis.
4.3 Results and Discussion
4.3.1 Detection of differential cell surface expression of EGFR
To illustrate the feasibility of using ssDNA-antibody conjugates to detect
membrane-bound proteins by PCR, we selected two cell lines expressing differing levels
of human epidermal growth factor receptor (EGFR). GBM1600 cells are a low-passage
cell line derived from a primary brain tumor expressing high levels of EGFR. Jurkat cells
are a hematopoietic derived T cell line with null expression of EGFR. The presence or
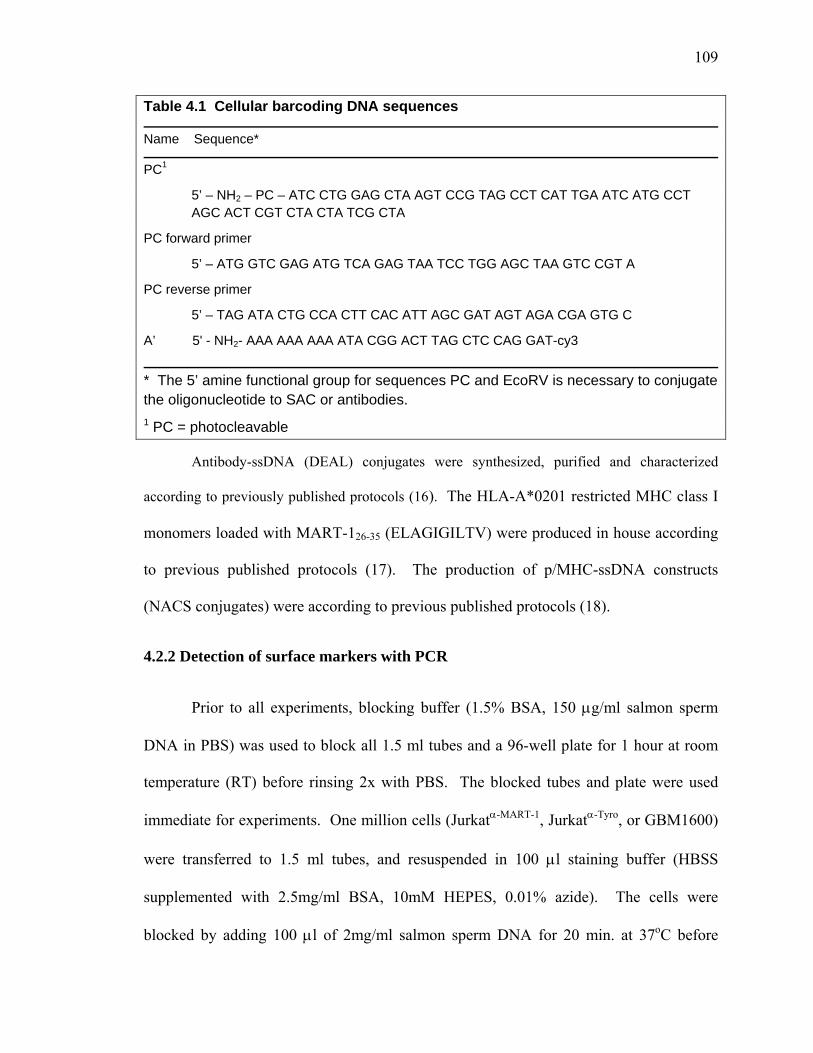
absence of EGFR expression was verified flow cytometry (Figure 4.2A).
We prepared anti-EGFR (Cetuximab) conjugated with photocleavable ssDNA
oligonucleotide (PC) and stained GBM1600 and Jurkat cells in separate tubes with the
conjugate. After removing excess Cetuximab-PC molecules, the samples were treated in
a 96-well plate with UV radiation for one hour. The photo-cleaved ssDNA tags were
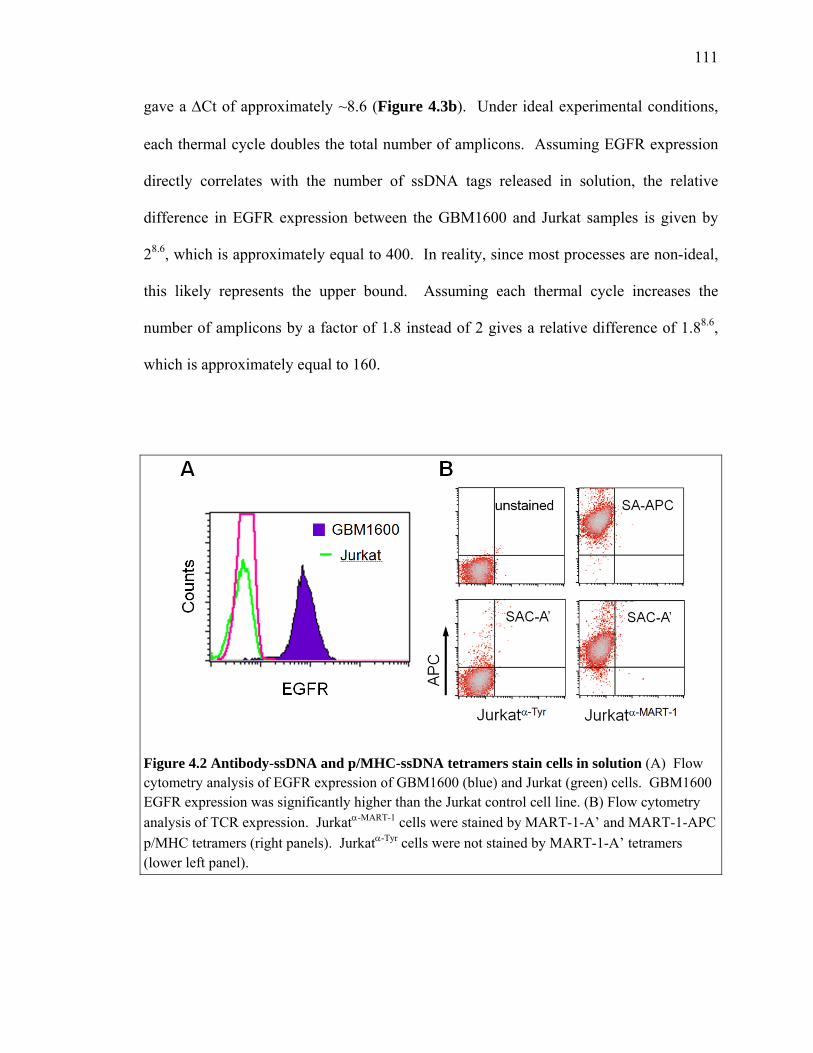
collected, amplified by PCR and visualized on a 4% agarose gel. As shown in Figure
4.3, the reporter tags were detected at an earlier thermal cycle during the amplification in
the GBM1600 sample than in the Jurkat sample. Quantitative assessment by Q-PCR
111
gave a ΔCt of approximately ~8.6 (Figure 4.3b). Under ideal experimental conditions,
each thermal cycle doubles the total number of amplicons. Assuming EGFR expression
directly correlates with the number of ssDNA tags released in solution, the relative
difference in EGFR expression between the GBM1600 and Jurkat samples is given by
28.6, which is approximately equal to 400. In reality, since most processes are non-ideal,
this likely represents the upper bound. Assuming each thermal cycle increases the
number of amplicons by a factor of 1.8 instead of 2 gives a relative difference of 1.88.6,
which is approximately equal to 160.
Figure 4.2 Antibody-ssDNA and p/MHC-ssDNA tetramers stain cells in solution (A) Flow cytometry analysis of EGFR expression of GBM1600 (blue) and Jurkat (green) cells. GBM1600 EGFR expression was significantly higher than the Jurkat control cell line. (B) Flow cytometry analysis of TCR expression. Jurkatα-MART-1 cells were stained by MART-1-A’ and MART-1-APC p/MHC tetramers (right panels). Jurkatα-Tyr cells were not stained by MART-1-A’ tetramers (lower left panel).
112
Figure 4.3 GBM1600 EGFR detection by cellular barcoding (A) Acrylamide gel electrophoresis of amplified products collected every 5th complete thermal cycle. Reporter ssDNA tags were detected earlier in GBM1600 samples than in Jurkat samples. (B) Ct values by Q-PCR.
4.3.2 Cellular barcoding limits of detection
In order to determine the minimum number of cells required for surface antigen
detection, two avenues were investigated. First, GBM1600 cells were spiked into Jurkat
cells to produce synthetic cellular mixtures composed of 100%, 10%, 1%, 0.1%, or 0%
GBM1600 cells. The total number of cells per condition was kept constant at 106 by
increasing the number of Jurkat cells. Second, GBM1600 cells were serially diluted into
separate tubes, each containing either 105, 104, 103, 102, or 0 cells per tube. No Jurkat
cells were added to these vials. These samples were stained using Cetuximab-PC
conjugates and the results are shown in Figure 4.5. For the cell mixtures, GBM1600
cells at 100% and 10% were detected significantly above the baseline while mixtures 1%
and 0.1% were similar in intensity to the baseline (Figure 4.5A). In the serial dilutions,
samples containing 104 cells or more were detected above background (Figure 4.5B).
Significant signal arose from the vial without any cells, which is likely due to non-
specific interactions between Cetuximab-PC conjugates and the vial. We are currently
113
investigating improvements in the blocking and washing steps to increase the signal to
noise ratio.
Figure 4.4 Limits of detection (A) Synthetic samples of spiked GBM1600 cells in Jurkat cells were detected by α-Cetuximab-ssDNA conjugate, with a dilution limit of about 10% (B) Reporter ssDNA amplification can detect EGFR expression from > 104 cells.
4.3.2 Detection of antigen-specific T cells using ssDNA-p/MHC tetramers
The ability to profile T cell receptors has many potential fundamental applications
in immunology as well as diagnostic potential in many fields like vaccine development,
immune monitoring, and cancer immunotherapy. Since the development of p/MHC
tetramers (19), it has been possible to directly analyze populations of antigen-specific T
cells by staining with fluorescent p/MHC tetramers. The fundamental limitation in this
approach is the difficulty in multiplexing since distinct T cell specificities need to be
encoded with different colors for discrimination. Therefore, there has been widespread
interest in developing p/MHC protein arrays, since in a spatially encoded format, the
114
degree of multiplexing can be increased greatly (18, 20-23). One inherent limitation of
array approaches however, is that the sensitivity and scalability is limited by the size of
the spots, since the sensitivity is directly proportional to the diameter of the capture
surfaces. In addition, arrays approaches are planar substrate-based detection schemes.
The limited diffusive capacity of T cells prevents cells from sampling an entire array.
Hence for all arrays approaches, T cell recovery is low. The majority of the cells settle
on inert areas of the substrate or on non-cognate spots. With an approach like cellular
barcoding, the engagement of the encoding agent with the cell surface receptor occurs in
solution. Thus by using NACS conjugates, all T cells in a solution is encoded after
staining and can subsequently be decoded.
To demonstrate the feasibility of detecting antigen-specific TCRs with cellular
barcoding, the T cell lines Jurkatα-MART-1 and Jurkatα-Tyr were chosen as the model lines.
These are transduced T cells expressing TCRs specific for the antigens MART-1 and
tyrosinase respectively and were described in detail in chapter 3. MART-1 p/MHC
tetramers were prepared encoded with fluorescent DNA (A’) or photocleavable DNA
(PC). MART-1-A’ p/MHC tetramers were compared with fluorescent MART-1-APC
p/MHC tetramers for their ability to stain Jurkatα-MART-1 cells. The results are shown in
Figure 4.2B. Both tetramers stained Jurkatα-MART-1 cells similarly (right upper, right
lower panels). Importantly, cells expressing the non-cognate TCR were not stained by
MART-1-A’ tetramers (lower left panel), demonstrating that p/MHC tetramers appended
with ssDNA pendants can engage with the cognate TCR in the suspension phase.
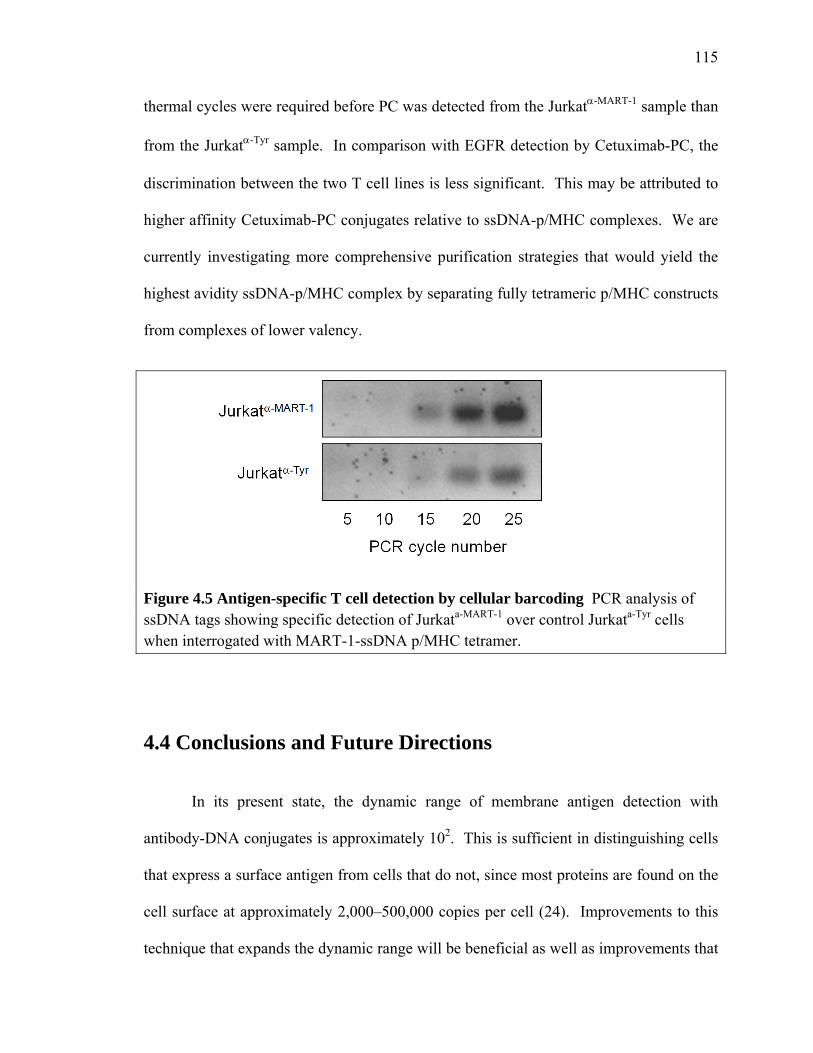
Both T cell lines were then stained with MART-1-PC tetramers, treated with UV
and analyzed by PCR. The results are shown in Figure 4.4. Approximately five fewer
115
thermal cycles were required before PC was detected from the Jurkatα-MART-1 sample than
from the Jurkatα-Tyr sample. In comparison with EGFR detection by Cetuximab-PC, the
discrimination between the two T cell lines is less significant. This may be attributed to
higher affinity Cetuximab-PC conjugates relative to ssDNA-p/MHC complexes. We are
currently investigating more comprehensive purification strategies that would yield the
highest avidity ssDNA-p/MHC complex by separating fully tetrameric p/MHC constructs
from complexes of lower valency.
Figure 4.5 Antigen-specific T cell detection by cellular barcoding PCR analysis of ssDNA tags showing specific detection of Jurkata-MART-1 over control Jurkata-Tyr cells when interrogated with MART-1-ssDNA p/MHC tetramer.
4.4 Conclusions and Future Directions
In its present state, the dynamic range of membrane antigen detection with
antibody-DNA conjugates is approximately 102. This is sufficient in distinguishing cells
that express a surface antigen from cells that do not, since most proteins are found on the
cell surface at approximately 2,000–500,000 copies per cell (24). Improvements to this
technique that expands the dynamic range will be beneficial as well as improvements that
116
lower the sensitivity of this approach, which would allow the detection of membrane
proteins from small sample sizes below 104 cells. In addition, with heterogeneous
mixtures of cells, it may be necessary to enrich for a particular phenotype prior to cellular
barcoding, since a surface antigen that has been detected cannot be assigned to any
particular cell type within a mixture a priori. To this end, it may be advantageous to
integrate DEAL/NACS cell sorting prior to barcoding.
While this demonstration using conventional PCR highlights the technical
feasibility of this approach, the goal is integration with high-throughput sequencing
employing the Solexa platform. This second generation sequencer works by ligating
cDNA libraries to the bottom of microfluidic flow cells. The flow cells are sufficiently
large to ensure scattered coverage, enabling spatial resolution of individual cDNA
fragments. After in situ amplification, the sequences are read by a sequence-by-synthesis
approach. Typically, 25 base pair reads are taken from 107–108 possible unique
sequences per flow cell (25, 26). This approach is digital and quantitative because each
read is from a cDNA fragment that is spatially resolved. By integrating a library of
capture agents encoded with ssDNA identifiers with Solexa sequencing, it should be
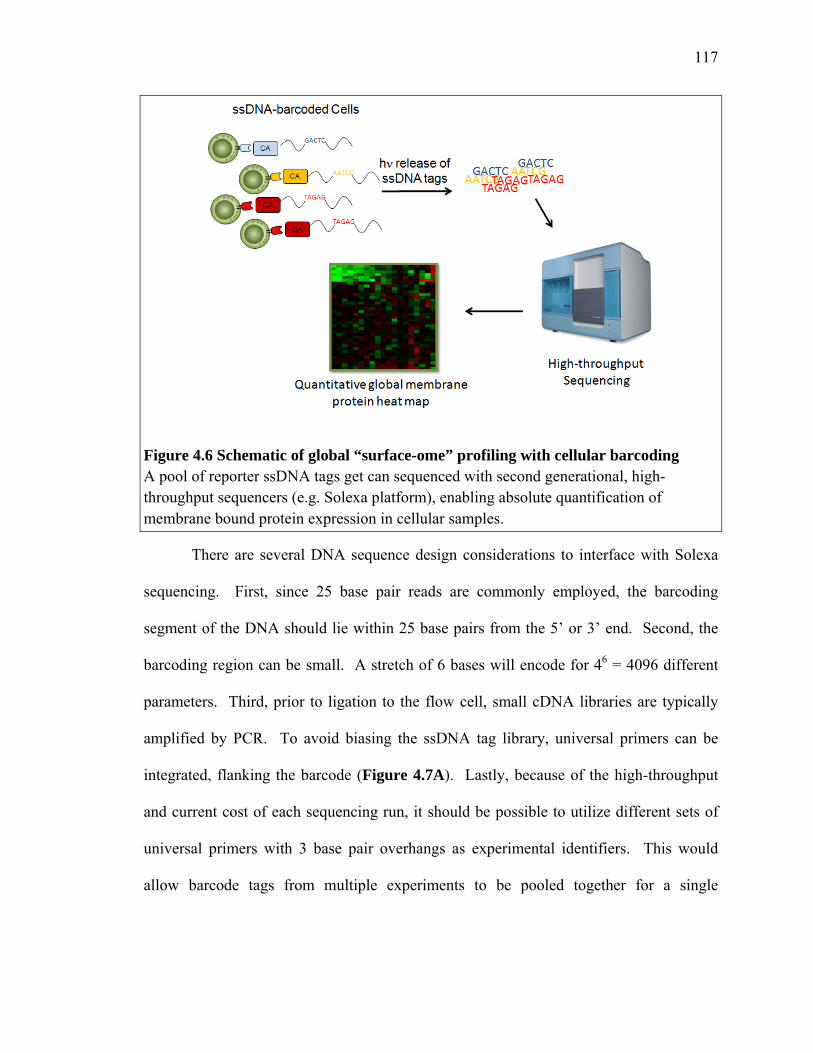
possible to generate a quantitative cell surface-ome heat map. A schematic is illustrated
in Figure 4.6.
117
Figure 4.6 Schematic of global “surface-ome” profiling with cellular barcoding A pool of reporter ssDNA tags get can sequenced with second generational, high-throughput sequencers (e.g. Solexa platform), enabling absolute quantification of membrane bound protein expression in cellular samples.
There are several DNA sequence design considerations to interface with Solexa
sequencing. First, since 25 base pair reads are commonly employed, the barcoding
segment of the DNA should lie within 25 base pairs from the 5’ or 3’ end. Second, the
barcoding region can be small. A stretch of 6 bases will encode for 46 = 4096 different
parameters. Third, prior to ligation to the flow cell, small cDNA libraries are typically
amplified by PCR. To avoid biasing the ssDNA tag library, universal primers can be
integrated, flanking the barcode (Figure 4.7A). Lastly, because of the high-throughput
and current cost of each sequencing run, it should be possible to utilize different sets of
universal primers with 3 base pair overhangs as experimental identifiers. This would
allow barcode tags from multiple experiments to be pooled together for a single
118
sequencing run (Figure 4.7B). A 3 base stretch would allow 43 = 64 different
experiments to be pooled together.
Figure 4.7 DNA sequence design considerations (A) Illustration of a generic DNA sequence that can interface with Solexa sequencing containing two universal primers flanking a 6 bp encoding region. Six bases encodes for 4096 different parameters. (B) Because the throughput of second generation sequencers are high, experimental ID tags can be integrated through unique set of universal primers, enabling multiple experiments to be decoded and sequenced simultaneously. A three base stretch is sufficient to encode 64 unique experiments.
In conclusion, a solution phase approach has been introduced that allow cell
membrane bound proteins to be detected by capture agents like antibodies or p/MHC
tetramers encoded with ssDNA tags. The pendant oligonucleotides function as reporter
molecules that can be detected and quantified with conventional thermal amplification
approaches. The successful integration of a library of ssDNA-encoded captured agents
with high-throughput sequencing for quantitative assessment would provide a global
profiling tool to survey the cell surface-ome with fundamental and diagnostic
implications.
119
4.5 References
1. Ottaiano, A.; Pisano, C.; De Chiara, A.; Ascierto, P.A.; et al. CD40 activation as
potential tool in malignant neoplasms. Tumori 2002, 88, 361–366.
2. Chan, S.M.; Utz, P.J. The challenge of analyzing the proteome in humans with
autoimmune diseases. Ann. NY Acad. Sci. 2005, 1062, 61–68.