Home Care Services And Development Perspective – A Study On Customer Perception And Acceptability In The Urban Parts Of India Page 105 Chapter IV CITY PROFILES Globalization of urbanization is seen as the most important social change in the 21 st century. The trend for the past 50 years is for cities to grow horizontally in the form of urban sprawl, whether as suburbs in the developed world or peri-urban expansion in the developing world. This has implications for the efficiency of urban services, including delivery of water and sanitation, provision of public transport, as well as for access to jobs, education, food and health services. In many cases, especially in the developing world, the speed of urbanization has outpaced the ability of governments to build essential infrastructure. Failure to plan for continued growth results in inadequate health services, water, sanitation, education, and essential infrastructure. Cities matter a lot for India. In 2008 an estimated 340 million people are already living in urban areas representing nearly 30 per cent of the total population. According to the medium range projections of the United Nations, 41 per cent of India‘s population will live in urban areas by 2030 (United Nations, 2005). By 2030 Indian cities will have twice the population of United States of America today. Cities are likely to house 40 per cent of India‘s population by 2030. The cities will have 270 million people net increase in working age population. In short we will witness a transformation of our cities that has not occurred in any part of the world except China. In India, urban planning can promote healthy behaviors and safety in many different ways, applicable both to existing and new areas. These would include design for physical activity in cities, where healthy food is available, safe, accessible and affordable, where affordable health services for all are provided adequately and where roads are safe. Improvements in housing and housing conditions, control of pollution and improvement in water and sanitation go a long way to mitigating health risks. The present research is undertaken in the four metropolitan cities of India viz. Delhi, Mumbai, Kolkata and Chennai. Table 4.1. Population Density and Urbanization In Four Metropolitan Cities INDICATORS DELHI MUMBAI KOLKATA CHENNAI Area Sq. Km 1483 157 185 174 Density 9340 21190 24760 24231 Urbanization Percentage 93 100 100 100 Source: Census of India, 2001. As per Table 4.1, of the four major Indian metropolitan cities (Chennai, Kolkata, and Mumbai being the other three), Delhi is the least densely populated, least urbanized and covers the largest geographical area (Table 4.1). Kolkata is highly densely populated.
Transcript
Home Care Services And Development Perspective – A Study On Customer Perception And Acceptability In The Urban Parts Of India Page 105
Chapter IV
CITY PROFILES
Globalization of urbanization is seen as the most important social change in the 21st century.
The trend for the past 50 years is for cities to grow horizontally in the form of urban sprawl,
whether as suburbs in the developed world or peri-urban expansion in the developing world.
This has implications for the efficiency of urban services, including delivery of water and
sanitation, provision of public transport, as well as for access to jobs, education, food and
health services. In many cases, especially in the developing world, the speed of urbanization
has outpaced the ability of governments to build essential infrastructure. Failure to plan for
continued growth results in inadequate health services, water, sanitation, education, and
essential infrastructure.
Cities matter a lot for India. In 2008 an estimated 340 million people are already living in
urban areas representing nearly 30 per cent of the total population. According to the
medium range projections of the United Nations, 41 per cent of India‘s population will live in
urban areas by 2030 (United Nations, 2005). By 2030 Indian cities will have twice the
population of United States of America today. Cities are likely to house 40 per cent of India‘s
population by 2030. The cities will have 270 million people net increase in working age
population. In short we will witness a transformation of our cities that has not occurred in
any part of the world except China.
In India, urban planning can promote healthy behaviors and safety in many different ways,
applicable both to existing and new areas. These would include design for physical activity
in cities, where healthy food is available, safe, accessible and affordable, where affordable
health services for all are provided adequately and where roads are safe. Improvements in
housing and housing conditions, control of pollution and improvement in water and
sanitation go a long way to mitigating health risks. The present research is undertaken in
the four metropolitan cities of India viz. Delhi, Mumbai, Kolkata and Chennai.
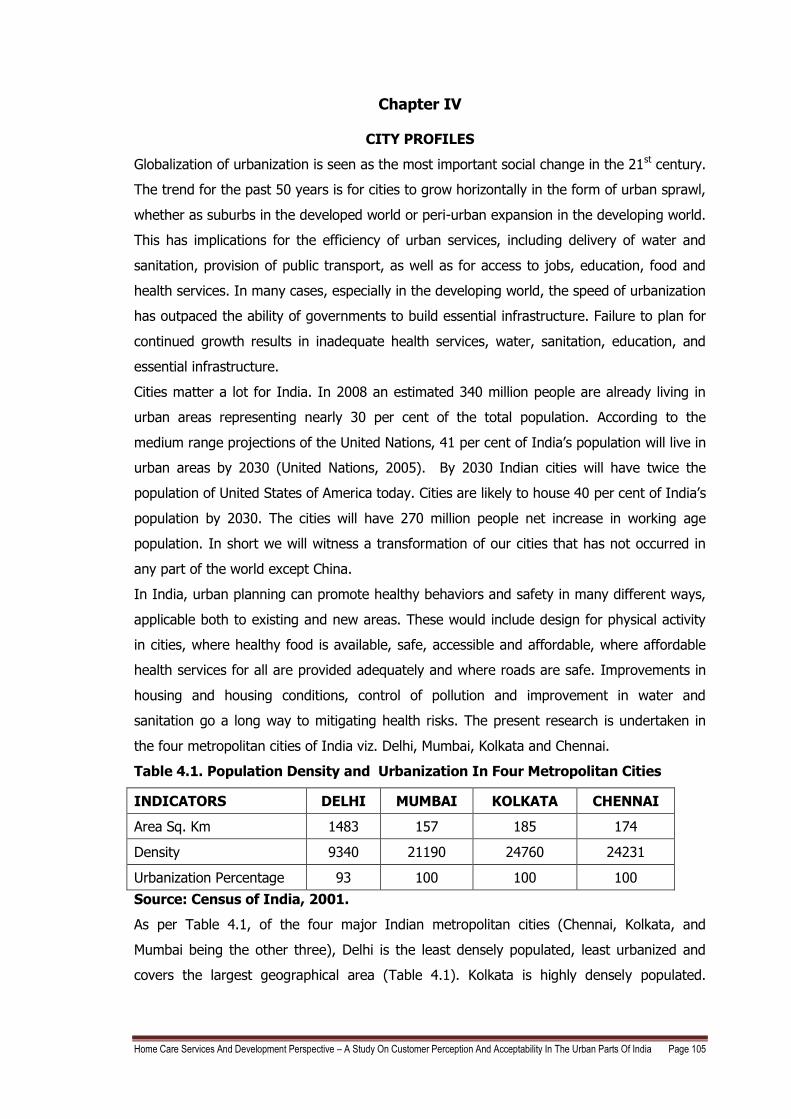
Table 4.1. Population Density and Urbanization In Four Metropolitan Cities
INDICATORS DELHI MUMBAI KOLKATA CHENNAI
Area Sq. Km 1483 157 185 174
Density 9340 21190 24760 24231
Urbanization Percentage 93 100 100 100
Source: Census of India, 2001.
As per Table 4.1, of the four major Indian metropolitan cities (Chennai, Kolkata, and
Mumbai being the other three), Delhi is the least densely populated, least urbanized and
covers the largest geographical area (Table 4.1). Kolkata is highly densely populated.
Home Care Services And Development Perspective – A Study On Customer Perception And Acceptability In The Urban Parts Of India Page 106
Mumbai Kolkata and Chennai are fully urbanized except Delhi which is 93 per cent
urbanized.
4.1. POPULATION AND THE ECONOMIC STATUS OF INDIAN URBAN CITIES
Among the selected metros, Mumbai has the highest population and Kolkata trailing behind
and Chennai has the least population among the metros (as shown in Table 4.1). In terms
of GDP, Mumbai ranks first followed by Delhi, Kolkata and Chennai. The average
households‘ income is highest in Mumbai followed by Delhi, Chennai and the least in
Kolkata. The household expenditure in Kolkata was found to be Rs. 1,822 per person per
month on average, which is much higher than other metros such as Delhi, Mumbai and
Chennai. Second comes Chennai, with a monthly per capita household expenditure of Rs.
1,570 followed by Mumbai and New Delhi.
Table: 4.2. Economic Status in the Urban Cities
City / Urban area
Population
in 2001 (in millions)*
Population in 2030#
(in millions)
GDP in
$ ID BN
in 2008**
PWC rank in 2008**
Average Households’ Income
(2007-2008)
***
Spending
Propensity
In 2007-
2008 ##
Monthly per capita consumption expenditure in Rs.###
Mumbai 16.36 33.00 $209 29 459,457 54 per cent 1270
Delhi 12.79 25.90 $167 37 408,237 60 per cent 1166
Kolkata 13.22 22.90 $104 61 287,199 65 per cent 1821
Chennai 6.43 11.0 $ 66 87 337,059 58 per cent 1570
Source: * India's national census of 2001
# Population Projection by McKinsey Global Institute Study, 2010
** PricewaterhouseCoopers, UK Economic Outlook, Pages 20-34, November 2009
*** The Next Urban Frontier: Twenty Cities to Watch, an NCAER-Future Capital Research
(of the Future Group), Rajesh Shukla and Roopa Purushothaman, 2008.
## NSSO (2004-2005) Household consumption expenditure as a share of income, per
cent.
### Hindustan Times, Kolkata, 2009.
Most of the households‘ in these cities are employed. Employment status and occupational
characteristics of a population are important aspects of a country‘s level of development,
particularly its economic development. Paid employment of women, in particular, has been
recognized as important for achieving the goal of population stabilization in India (Refer
Appendix 7).
Home Care Services And Development Perspective – A Study On Customer Perception And Acceptability In The Urban Parts Of India Page 107
An ongoing study at Indian Statistical Institute (ISI) by Buddhadeb Ghosh (Hindustan
Times, Kolkata, 2009), points out that Kolkata has the highest per capita purchasing power
among all metros. The reason: smaller population and low poverty compared with other
metros. Household expenditure in Kolkata was found to be Rs. 1,822 per person per month
on average, which is way above Delhi, Mumbai, Chennai and Bangalore. Chennai comes
second, with a monthly per capita household expenditure of Rs. 1,570. Hyderabad comes
third, followed by Mumbai, Bangalore and New Delhi. Data for the study was collected in
2004-05 by the National Sample Survey Organization (NSSO). The data collected by NSSO
was adjusted for regional price variations and differences in cost of living in each city. It has
been observed that the spending propensities are very high in the Indian Urban cities.
In order to assess the living standard of the population information on household ownership
of 19 different types of durable goods and four different means of transportation, as well as
possession of a bank account and coverage by health insurance or a health scheme was
done. Households‘ were also asked if they had a Below Poverty Line (BPL) card, which is
issued by the government and identifies households‘ below the official poverty line.
Information was also obtained on whether households‘ had a mosquito net that can be used
for sleeping. Appendix 8, 10 presents information on several of these items which show the
standard of living in the cities.
Urbanization will spread out across India impacting almost every state. India will have 68
cities with population more than 1 million up from 42 today (Europe has 35 today), 13 cities
with more than 4 million people and 6 megacities with more than 10 million or more and at
least 2 cities (Mumbai and Delhi) will be among the 5 largest cities in the world by 2030.
(McKinsey Global Institute Study, 2010).
4.2. SEX RATIO IN THE FOUR METROPOLITAN CITIES
According to the Population Census 2001, Delhi has been noted as the third most populated
city in India. Amongst the four metropolitan cities, Mumbai Urban Agglomeration occupies
the first position with highest population of 16.37 million. Second and Third positions have
been occupied by Kolkata and Delhi Urban Agglomeration with total population of 13.22
million and 12.79 million respectively, whereas Chennai Urban agglomeration is populated
with a population of 6.42 million only. A comparative picture of four metropolitan cities of
India in respect to population and sex ratio has been presented in the following Table 4.3.
The highest sex ratio in Census 2001 has been recorded in Chennai, followed by Kolkata,
Mumbai and Delhi.
Home Care Services And Development Perspective – A Study On Customer Perception And Acceptability In The Urban Parts Of India Page 108
Table 4.3. Population and Sex Ratio Of Four Metropolitan Cities In 2001
Sl. No. City/Urban Agglomeration Population Sex Ratio
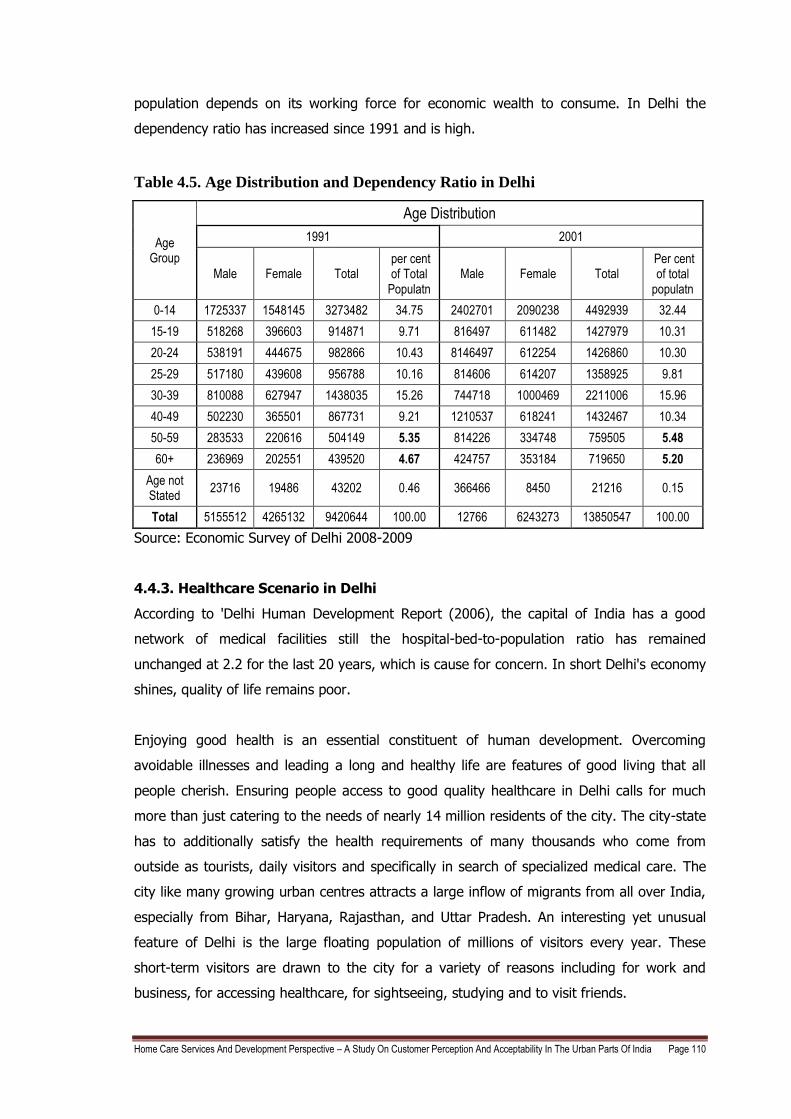
Total 5155512 4265132 9420644 100.00 12766 6243273 13850547 100.00
Source: Economic Survey of Delhi 2008-2009
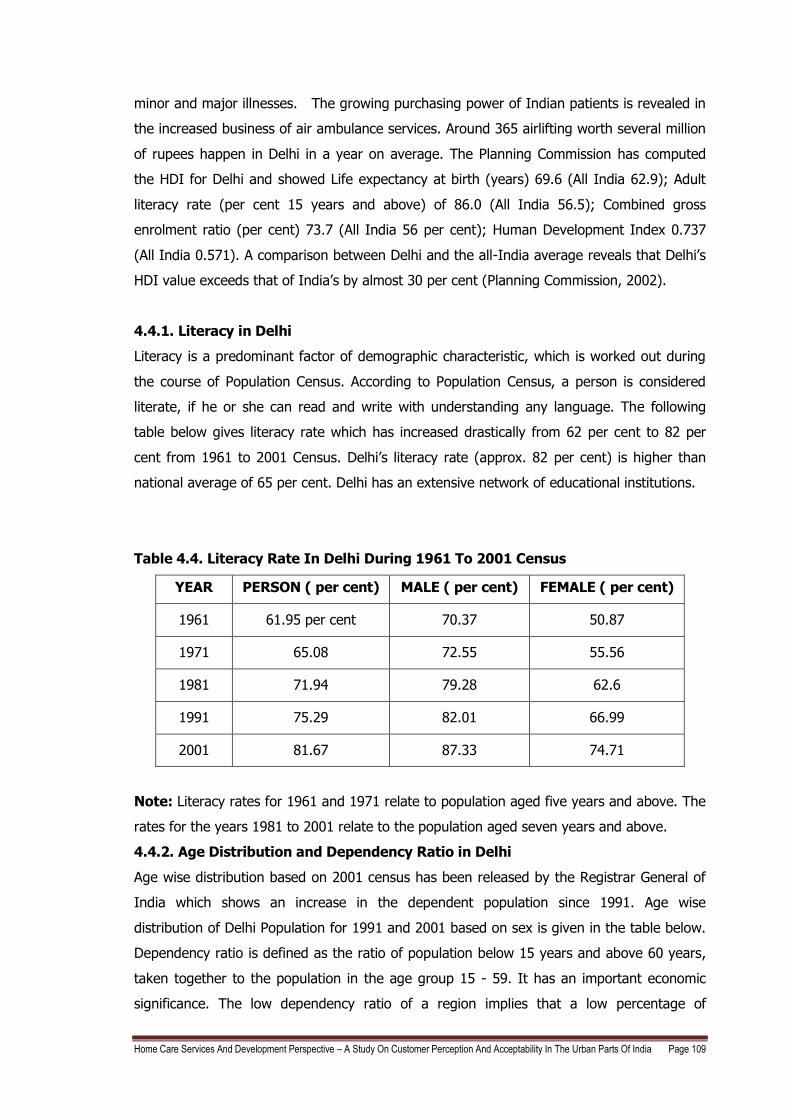
4.4.3. Healthcare Scenario in Delhi
According to 'Delhi Human Development Report (2006), the capital of India has a good
network of medical facilities still the hospital-bed-to-population ratio has remained
unchanged at 2.2 for the last 20 years, which is cause for concern. In short Delhi's economy
shines, quality of life remains poor.
Enjoying good health is an essential constituent of human development. Overcoming
avoidable illnesses and leading a long and healthy life are features of good living that all
people cherish. Ensuring people access to good quality healthcare in Delhi calls for much
more than just catering to the needs of nearly 14 million residents of the city. The city-state
has to additionally satisfy the health requirements of many thousands who come from
outside as tourists, daily visitors and specifically in search of specialized medical care. The
city like many growing urban centres attracts a large inflow of migrants from all over India,
especially from Bihar, Haryana, Rajasthan, and Uttar Pradesh. An interesting yet unusual
feature of Delhi is the large floating population of millions of visitors every year. These
short-term visitors are drawn to the city for a variety of reasons including for work and
business, for accessing healthcare, for sightseeing, studying and to visit friends.
Home Care Services And Development Perspective – A Study On Customer Perception And Acceptability In The Urban Parts Of India Page 111
Delhi offers among the most sophisticated medical care with latest state-of-the-art
technology for treatment and the best-qualified doctors in the country. In addition to well
reputed Government hospitals, Delhi has a flourishing private sector in health. It is therefore
not surprising that close to one-third of those seeking healthcare as in-patients in Delhi‘s
medical institutions come from outside the city-state. Delhi‘s health network has enabled the
city to record significant achievements. For example: Delhi reports a life expectancy at birth
of 69.6 years—nearly six years higher than the national average. Delhi‘s death rate of 5 per
1000 population is among the lowest in India, Delhi‘s infant mortality rate has fallen steadily
from 43 per 1000 live births in 1990 to 28 in 2003. Delhi reports a Total Fertility Rate of
1.6— well below the replacement rate and lower than Kerala‘s 1.8. Delhi is classified as a
low prevalence state for HIV/AIDS. Nevertheless, Delhi‘s health achievements fall short on
many counts. Such as Delhi‘s Infant Mortality Rate (IMR) is almost three times higher than
Kerala‘s IMR of 11 per 1000 live births. (Kerela is found to have the best IMR indicators in
the country).
The bed-population ratio has remained unchanged at 2.2 for over past twenty years. Efforts
to reduce communicable diseases have been inadequate. According to recent estimates,
almost 21 per cent of outdoor patients and 26 per cent of indoor admissions in hospitals are
treated for communicable diseases. Dengue and malaria remain two vector borne diseases
adversely affecting many lives. Many of the communicable diseases can be traced to the
deteriorating quality of water, increasing problems of poor sanitation, inadequate drainage,
and high levels of environmental pollution. Rest of the 75 per cent patients are treated for
lifestyle diseases.
Delhi‘s overwhelmingly urban population—93 per cent—is spread over 9 districts. The North-
West District spread over 440 square kilometres with close to 2.9 million residents is the
largest; and New Delhi covering a mere 35 square kilometres with around 179,000 residents
is the smallest district. The North-East District is the most densely populated (29,468
persons per square kilometre) and South-West the least (4179 persons per square
kilometre). Accessibility of good healthcare for these people is inadequate and they need to
travel long distances to access a good healthcare center which is an extra burden of cost to
the family.
Corporates provide medical insurance to their employees. This too has led to a spurt in
demand for quality healthcare. With more people buying medical insurance, the average
time spent in the hospital has gone up and are also prolonging their post-operative stay in
the hospital. All this translates into higher demand for hospital beds in all cities. Low-cost
treatment is the ultimate factor in Delhi. Medical care costs only one-fifth of the costs in the
West and due to this 150,000 medical tourists came to Delhi in 2008 which gave rise to
medical tourism. Only 10 per cent of payment is done through insurance so there is a lot of
Home Care Services And Development Perspective – A Study On Customer Perception And Acceptability In The Urban Parts Of India Page 112
demand to penetrate the insurance market and rest is through direct payment. This has led
to 62 per cent of healthcare expenditure being financed out-of-pocket. Public health
expenditure by the Government of Delhi, over the past twenty years, has consistently
remained over 6 per cent of the total plan budget. During the Tenth Five-Year Plan period
(2002–07), Delhi allocated 35 per cent of its plan outlay to health—the highest by any state
government in the country. Delhi‘s per capita expenditure on health today is more than
three times the national average.
4.4.4. Hospitals in Delhi
There are approximately 646 hospitals and 993 dispensaries within the city and the total
number of beds in the city is 33,000 to 40,000 beds. Delhi has approximately 380 private
hospitals. 120 nursing homes, 38 trust hospitals and 15 government hospitals. Currently
there are 35,200 beds (14,200 beds in the public sector and the rest in private) in Delhi
hospitals and another 32,000 beds will be added by 2012, bringing bed to thousand
population ratio to 3.96. Out of this total, 24,000 beds will be added by private sector and
the rest will be by the government. The medical infrastructure market will grow at 14.5 per
cent. The total investment needed to reach the target of bed to thousand population of 3.96
will be US$2,000 Million (Rs. 10,000 Crores) out of which US$1,500 Million (Rs. 7,500
Crores) will come from the private sector. The revenues currently generated by the private
hospitals in Delhi are US$400 Million (Rs.2,000 Crores) and are likely to increase to US$765
Million (Rs.3,830 Crores) by the year 2012 at a CAGR of 18 per cent.
Figure 4.1. Private hospitals based on Bed Capacity
Source: Delhi Hospital Report, 2010
Home Care Services And Development Perspective – A Study On Customer Perception And Acceptability In The Urban Parts Of India Page 113
4.4.5. Demand for number of beds/1000 population in Delhi
Number of beds/1000 population is 2.2 and the world average requirement is 3.96
beds/1000 population but this should increase to 7beds/1000 population with the increasing
population and growing healthcare diseases. So approximately, 31,000 beds needs to be
added in order to reach the ratio of 3.96 beds/1000 population (Delhi Hospital Report,
2010).
4.4.6. Demand for number of patients in Delhi
Average occupancy ratio for private hospitals is 95-100 per cent in most of the good
hospitals. In some hospitals there is a waiting list for patients to get a bed for admission.
With bed strength of 1000 beds, the average number of out-patients visiting the
hospital/day is about 1530, and the number of in-patients admitted/day is 900. With bed
strength of 200 beds, the average number of out-patients visiting the hospital/day is about
350, and the number of in-patients admitted/day is 190. Occupancy ratio of 60-70 per cent
is good enough to break even. So there is a demand to increase the beds and occupancy
ratio which will increase the number of out-patients and in-patients visiting the hospital/day.
4.4.7. Supply and Demand Scenario in Delhi
There are 6400 doctors which works out to 0.4 doctors per 1000 population but requires 1.5
doctors per 1000 population to meet the demand. There are 3200 nurses in Delhi which is 2
nurses per 1000 population will require 3.45 nurses. There are 11,200 physicians which is
0.7 per 1000 population of Delhi but will need 1.8 physicians per 1000 population. In Delhi
there are 35,200 beds which works out as 2.2 beds per thousand population but will require
3.96 beds per 1000 population (Delhi Hospital Report, 2010).
Home Care Services And Development Perspective – A Study On Customer Perception And Acceptability In The Urban Parts Of India Page 114
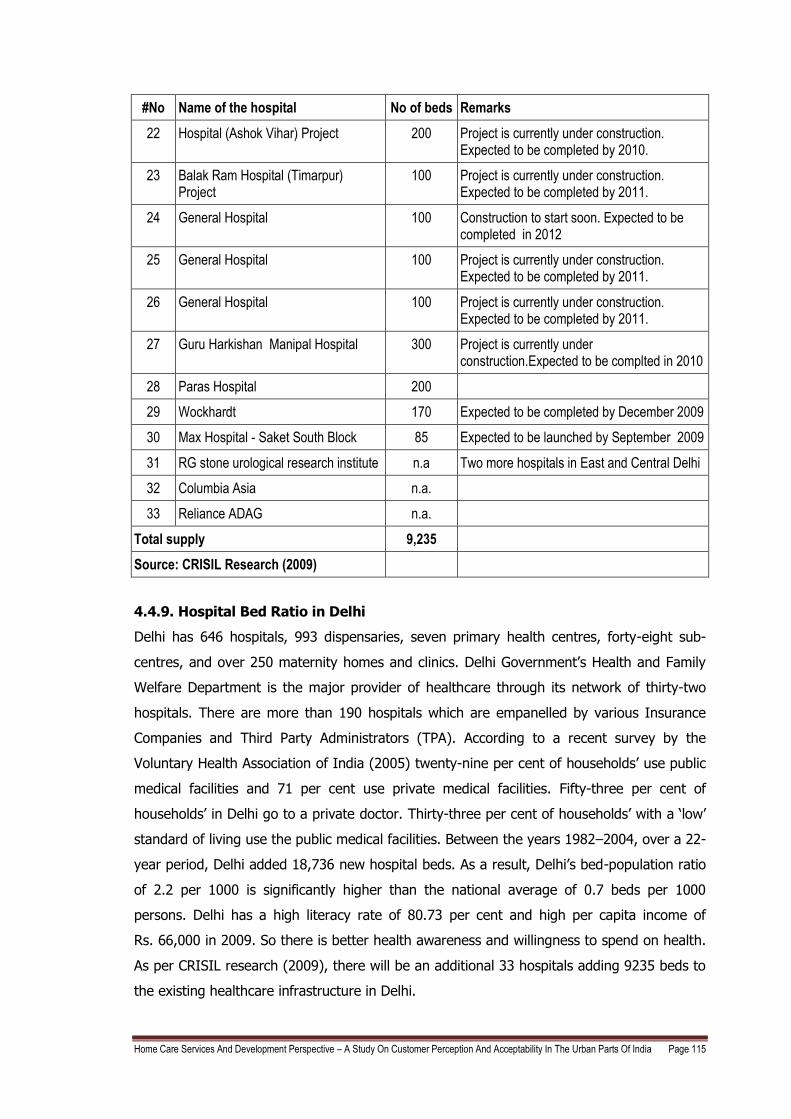
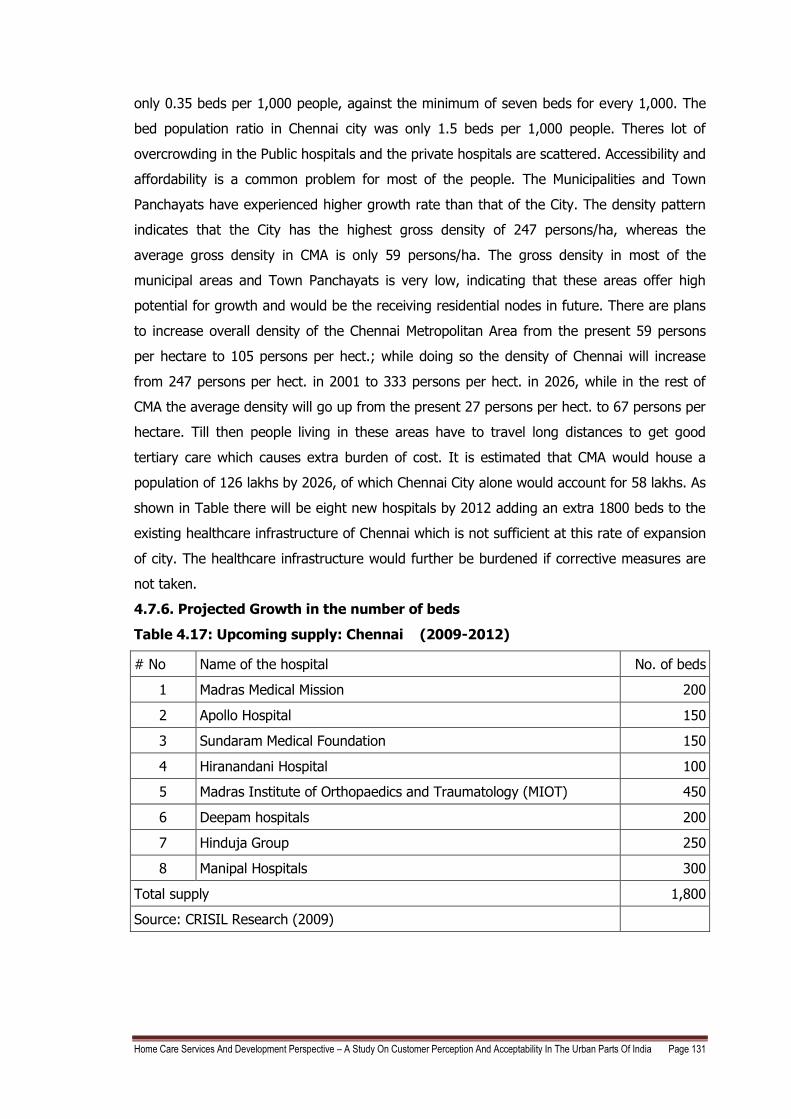
4.4.8. Projected Growth in the number of beds in Delhi
Table 4.6: Upcoming hospitals in Delhi (2009-2012)
Sr.No Name of the hospital No of beds Remarks
1 Rockland Hospital 300 Setting up a hospital in Manesar
2
Rockland Hospital 60 Setting up a hospital in Dwarka-Delhi and to operational by 2010
3 Rockland Hospital 250 Setting up a hospital in Greater Noida and to operational by 2011
4 Pushpanjali Crosslay Hospital 400 The hospital will be operational in 2010. Located at Ghaziabad
5 Fortis Healthcare (Gurgaon Hospital Project)
950 First phase with 350 beds would be ready by the first half of fiscal 2010
6 Fortis - Medicity 800 Located in Gurgaon
7 Manipal 600 Located in Delhi
8 Fortis Healthcare Limited 550 First phase will have 258 beds which will be completed by end of 2009
9 GM Modi Hospital 550
10 DLF Universal Ltd (Gurgaon) 350
11 Paras Hospital 350
12 Max Hospital - Shalimar Bagh 300 Expected to be launched by 2011
13 Max Balaji Hospital (Patparganj,New Delhi)
270 Expected to be launched by August 2009
14 Metro Multispeciality Hospital 250 Expected to be completed by 2009. Located in Delhi
15 Metro Multispeciality Hospital 200 New hospital will be coming up in place of the 80 bedded hospital in Faridabad. The hospital is nearing completion
16 Artemis Health Sciences Pvt Ltd 250
17 Hospital (Jwala Puri) Project 200
18 Hospital (Siras Pur) Project 200
19 Hospital (Madi Pur) Project 200
20 Rajiv Gandhi Super-Specialty Hospital 650 The project is under construction and nearing completion.
21 Metro Multispeciality hospital 200 Expected to be completed by 2009. Located at Greater Noida
Home Care Services And Development Perspective – A Study On Customer Perception And Acceptability In The Urban Parts Of India Page 115
#No Name of the hospital No of beds Remarks
22 Hospital (Ashok Vihar) Project 200 Project is currently under construction. Expected to be completed by 2010.
23 Balak Ram Hospital (Timarpur) Project
100 Project is currently under construction. Expected to be completed by 2011.
24 General Hospital 100 Construction to start soon. Expected to be completed in 2012
25 General Hospital 100 Project is currently under construction. Expected to be completed by 2011.
26 General Hospital 100 Project is currently under construction. Expected to be completed by 2011.
27 Guru Harkishan Manipal Hospital 300 Project is currently under construction.Expected to be complted in 2010
28 Paras Hospital 200
29 Wockhardt 170 Expected to be completed by December 2009
30 Max Hospital - Saket South Block 85 Expected to be launched by September 2009
31 RG stone urological research institute n.a Two more hospitals in East and Central Delhi
32 Columbia Asia n.a.
33 Reliance ADAG n.a.
Total supply 9,235
Source: CRISIL Research (2009)
4.4.9. Hospital Bed Ratio in Delhi
Delhi has 646 hospitals, 993 dispensaries, seven primary health centres, forty-eight sub-
centres, and over 250 maternity homes and clinics. Delhi Government‘s Health and Family
Welfare Department is the major provider of healthcare through its network of thirty-two
hospitals. There are more than 190 hospitals which are empanelled by various Insurance
Companies and Third Party Administrators (TPA). According to a recent survey by the
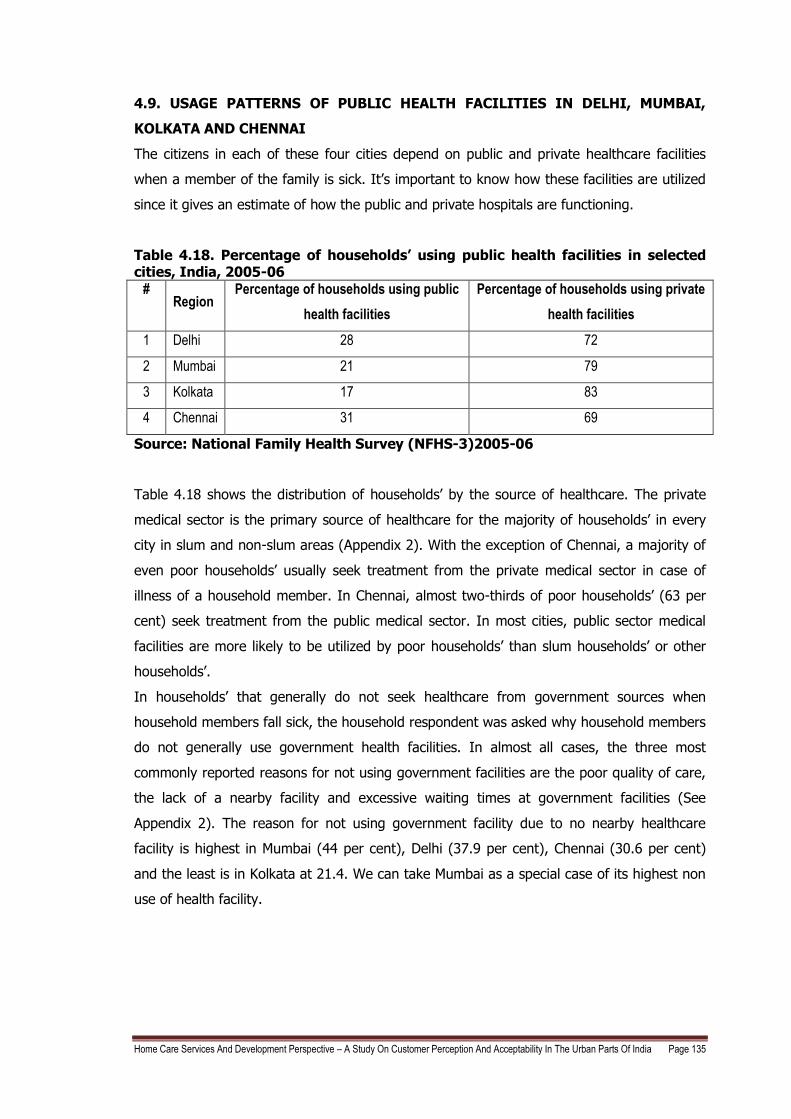
Voluntary Health Association of India (2005) twenty-nine per cent of households‘ use public
medical facilities and 71 per cent use private medical facilities. Fifty-three per cent of
households‘ in Delhi go to a private doctor. Thirty-three per cent of households‘ with a ‗low‘
standard of living use the public medical facilities. Between the years 1982–2004, over a 22-
year period, Delhi added 18,736 new hospital beds. As a result, Delhi‘s bed-population ratio
of 2.2 per 1000 is significantly higher than the national average of 0.7 beds per 1000
persons. Delhi has a high literacy rate of 80.73 per cent and high per capita income of
Rs. 66,000 in 2009. So there is better health awareness and willingness to spend on health.
As per CRISIL research (2009), there will be an additional 33 hospitals adding 9235 beds to
the existing healthcare infrastructure in Delhi.
Home Care Services And Development Perspective – A Study On Customer Perception And Acceptability In The Urban Parts Of India Page 116
4.5. MUMBAI
Mumbai, the capital of Maharashtra, is the financial hub and financial capital of India. It is
also proudly one of the world`s fourth largest urban agglomerations. The Mumbai Stock
Exchange is one of the most vital Stock Exchanges amongst the 23 Stock Exchanges of the
country. Mumbai is also the abode of all famous personalities of bollywood, home to one of
the supreme cinema industry of the world. A number of Indian financial institutions have
headquarters based in Mumbai. Mumbai has been ranked as the world`s biggest centres of
commerce in terms of the financial flow volumes in a survey compiled by MasterCard
Worldwide. The McKinsey study (2010) presents the aspirations for Mumbai and its
benchmarking in order to transform to a world class city. Mumbai needs a make a quantum
leap on two fronts: economic growth and quality of life. In order to achieve this vision, the
government must set certain concrete targets. Quantitative aspirations have therefore been
formulated for the six core areas and one of it is healthcare that Mumbai must focus.
4.5.1. Literacy in Mumbai
The approximate rate of literacy in Mumbai is about 77 per cent. The rate of female literacy
in Mumbai is about 71.6 per cent and the rate of male literacy in the city is about 82 per
cent. The Birth Rate, Death rate and Infant Mortality rates have significantly come down
which is a good indicator of health in Mumbai. There‘s also a significant increase in the Per
Capita Income of Mumbai residents.
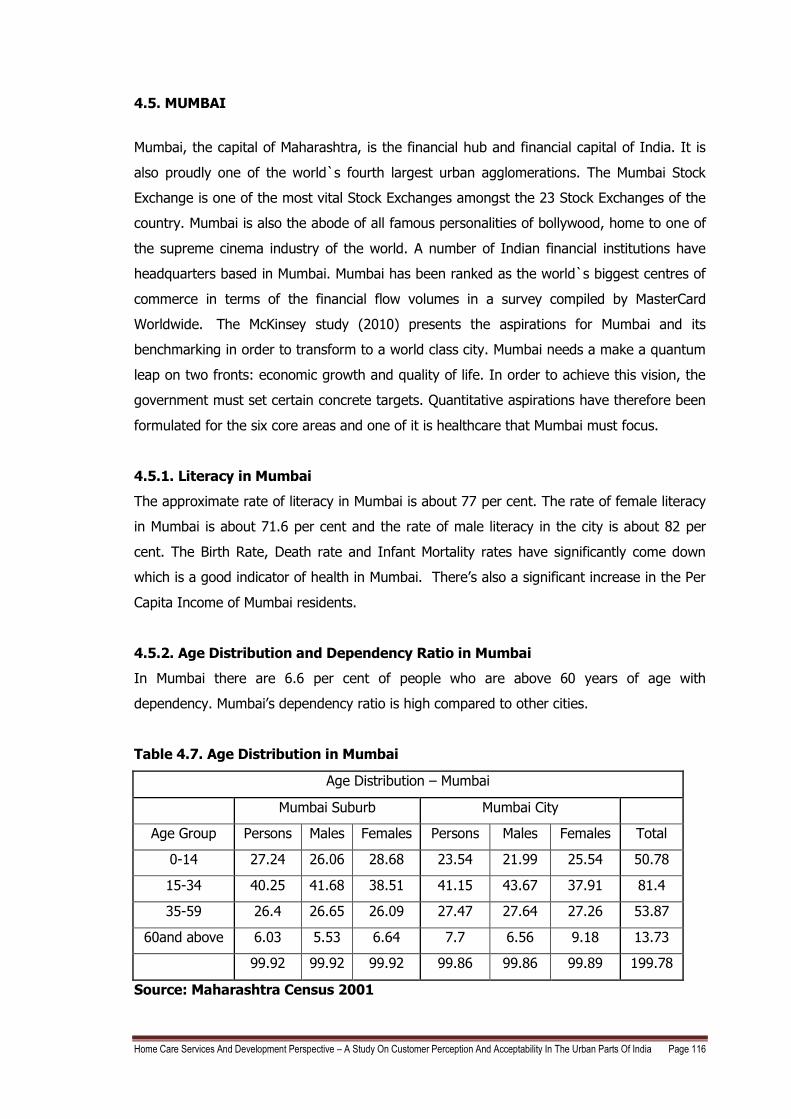
4.5.2. Age Distribution and Dependency Ratio in Mumbai
In Mumbai there are 6.6 per cent of people who are above 60 years of age with
dependency. Mumbai‘s dependency ratio is high compared to other cities.
Table 4.7. Age Distribution in Mumbai
Age Distribution – Mumbai
Mumbai Suburb Mumbai City
Age Group Persons Males Females Persons Males Females Total
0-14 27.24 26.06 28.68 23.54 21.99 25.54 50.78
15-34 40.25 41.68 38.51 41.15 43.67 37.91 81.4
35-59 26.4 26.65 26.09 27.47 27.64 27.26 53.87
60and above 6.03 5.53 6.64 7.7 6.56 9.18 13.73
99.92 99.92 99.92 99.86 99.86 99.89 199.78
Source: Maharashtra Census 2001
Home Care Services And Development Perspective – A Study On Customer Perception And Acceptability In The Urban Parts Of India Page 117
4.5.3. Healthcare scenario in Mumbai
The Mumbai Human Development Report gives a clear picture of healthcare scenario in
Mumbai. Due to better spread healthcare facilities in Mumbai the common understanding is
that Urbanization is strongly linked to and higher levels of education and delayed marriages
and smaller families. Good birth control is there in Mumbai. Yet early marriages seem to be
the trend in the city despite high levels of urbanization. This paradox should cause concern.
The average life expectancy is the average number of years a person is expected to live
assuming that the current mortality rates continue. The average life expectancy at birth in
Mumbai is 56.8 years in 2007 (Life Expectancy for India is 67.7 as per Human Development
Report, 2007-2008). With economic growth the death rate (Crude death rate in 2000 was
7.6 in 2000 and came down to 7.1 in 2003) declines but because of better health facilities,
birth rate remains same, therefore the increase in population of Mumbai.
Heart attacks caused the maximum deaths in Mumbai. Increased number of heart disease is
due to sedentary life styles with lack of exercise and poor eating habits in Mumbai. Non
communicable diseases dominate over communicable diseases. Tuberculosis which is widely
known as poor man‘s disease also has a very high incidence due to poor unhygienic
conditions.
Infant mortality rate (IMR) in Mumbai is 36.66 in 2007 an increase from 2003 which was
34.57 (37.5 for Maharastra and National average is 57). Maternal mortality occurs due to
complications during pregnancy and child birth and is related to the availability and access
to institutional and skilled personnel at the time of delivery. A higher number of institutional
births actually reduces the instances of maternal mortality and this is what is happening in
Mumbai, Statewide and nationally. Adequate nutrition is critical for health and productivity
of the people. Malnutrition can result in greater susceptibility to infections, risk of adverse
pregnancy outcomes for women and growth retardation among children. 45.4 per cent of
children below 5 years of age had stunted growth. 32.6 were underweight. More than half
of children between the age 6-35 months and pregnant women are anaemic.
Against this backdrop of birth rate, death rate, infant and maternal mortality rate and
nutritional status of the population a review of the provision of health services in Mumbai
would be seen. The public healthcare system falls woefully short when it comes to issues of
quality and responsiveness of service. A large part of this is explained by the considerable
over-burdening of the 20 or more municipal hospitals. At the same time, utilization of
primary healthcare facilities (i.e., around 150 municipal out-patient dispensaries and
Home Care Services And Development Perspective – A Study On Customer Perception And Acceptability In The Urban Parts Of India Page 118
maternity homes) is abysmal. To correct this imbalance, the Municipal Corporation of
Greater Mumbai (MCGM) needs to upgrade primary healthcare facilities (e.g., ensure that an
adequate stock of medicines is available, as are anesthetists) while discouraging patients
from going directly to the municipal hospitals (e.g., by significantly increasing the difference
in case-paper fees between municipal hospitals and primary healthcare facilities). In
addition, the Government should encourage public private partnerships in hospitals and
should hand over a few hospitals to reputed trusts and NGOs, without withdrawing any
funding and by putting in place more appropriate user charges.
Mumbai is a strong contender for promoting medical tourism owing to its potential strength
of experts‘ across various disciplines. Although Mumbai has a stronghold in secondary and
tertiary healthcare it has witnessed limited development in the sector. With a focused
approach the inherent strength of Mumbai can be directed to promote development of
health city and a slew of new hospitals that would support medical tourism. Within the
existing framework and with limited modifications, the MCGM should exploit this potential to
develop a Health city in the suburbs. To develop capacity, it could also grant public hospitals
the autonomy to enter into public-private partnerships and become global centers of
excellence in important fields such as cardiac care and diabetes.
The yearly per capita health expenditure of Municipal Corporation in Mumbai is Rs. 210. It is
greater than the per capita expenditure in Maharastra which is at 142.62 as per 2004 -05
figures but less than per capita national expenditure of Rs. 275.
4.5.4. Hospitals in Mumbai
There are altogether approximately 539 hospitals in Mumbai and 48 per cent of these are
the nursing homes, followed by private hospitals which are 28 per cent whereas 21 per cent
are trust hospitals and only 3 per cent are government hospitals. As per Table 4.9 there are
approximately 35,595 beds in Mumbai.
Home Care Services And Development Perspective – A Study On Customer Perception And Acceptability In The Urban Parts Of India Page 119
Table 4.8: No. of beds in Mumbai in 2008
Hospitals with no. of beds No of hospitals Total no of beds
>= 1000 beds 6 8,290
500 to 999 beds 15 8,711
300 to 499 beds 19 6,884
200 to 299 beds 15 3,721
100 to 199 beds 31 4,025
50 to 99 beds 25 1,594
25 to 49 beds 39 1,314
< 25 beds 64 1,056
Total no. of beds 214 35,595
Source: CRISIL Research (2009)
4.5.5. Demand for number of beds/1000 population in Mumbai
Number of beds/1000 population is 2 and the world average requirement is 3.96 beds/1000
population but this should increase to 7 beds/1000 population with the increasing
population and growing healthcare diseases. So approximately 35,000 beds needs to be
added in order to reach the ratio of 3.96 beds/1000 population.
4.5.6. Demand for number of patients in Mumbai
Average occupancy ratio for private hospitals is 95-100 per cent in most of the good
hospitals. In some hospitals there is a waiting list for patients to get a bed for admission.
With bed strength of 1000 beds, the average number of out-patients visiting the
hospital/day is about 1600, and the number of in-patients admitted/day is approximately
950. With bed strength of 200 beds, the average number of out-patients visiting the
hospital/day is about 400, and the number of in-patients admitted/day is 200. Occupancy
ratio of 40-45 per cent is good enough to break even. So there is a demand to increase the
beds and occupancy ratio which will increase the number of out-patients and in-patients
visiting the hospital/day.
Home Care Services And Development Perspective – A Study On Customer Perception And Acceptability In The Urban Parts Of India Page 120
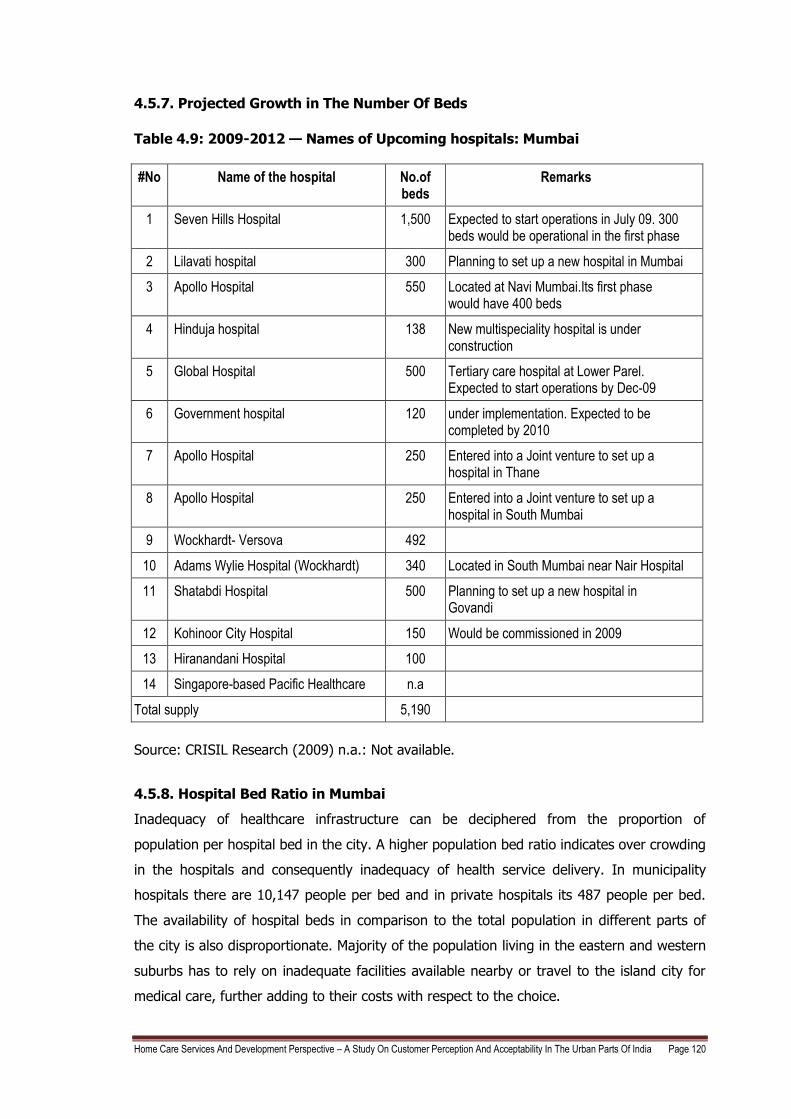
4.5.7. Projected Growth in The Number Of Beds
Table 4.9: 2009-2012 — Names of Upcoming hospitals: Mumbai
#No Name of the hospital No.of beds
Remarks
1 Seven Hills Hospital 1,500 Expected to start operations in July 09. 300 beds would be operational in the first phase
2 Lilavati hospital 300 Planning to set up a new hospital in Mumbai
3 Apollo Hospital 550 Located at Navi Mumbai.Its first phase would have 400 beds
4 Hinduja hospital 138 New multispeciality hospital is under construction
5 Global Hospital 500 Tertiary care hospital at Lower Parel. Expected to start operations by Dec-09
6 Government hospital 120 under implementation. Expected to be completed by 2010
7 Apollo Hospital 250 Entered into a Joint venture to set up a hospital in Thane
8 Apollo Hospital 250 Entered into a Joint venture to set up a hospital in South Mumbai
9 Wockhardt- Versova 492
10 Adams Wylie Hospital (Wockhardt) 340 Located in South Mumbai near Nair Hospital
11 Shatabdi Hospital 500 Planning to set up a new hospital in Govandi
12 Kohinoor City Hospital 150 Would be commissioned in 2009
13 Hiranandani Hospital 100
14 Singapore-based Pacific Healthcare n.a
Total supply 5,190
Source: CRISIL Research (2009) n.a.: Not available.
4.5.8. Hospital Bed Ratio in Mumbai
Inadequacy of healthcare infrastructure can be deciphered from the proportion of
population per hospital bed in the city. A higher population bed ratio indicates over crowding
in the hospitals and consequently inadequacy of health service delivery. In municipality
hospitals there are 10,147 people per bed and in private hospitals its 487 people per bed.
The availability of hospital beds in comparison to the total population in different parts of
the city is also disproportionate. Majority of the population living in the eastern and western
suburbs has to rely on inadequate facilities available nearby or travel to the island city for
medical care, further adding to their costs with respect to the choice.
Home Care Services And Development Perspective – A Study On Customer Perception And Acceptability In The Urban Parts Of India Page 121
4.6. KOLKATA
Kolkata is the capital of West Bengal and also touted artistically as the `City of Joy`, making
it India`s third-largest city and urban agglomeration. The urban agglomeration of Kolkata
covers several municipal corporations, municipalities, city boards and villages and is the
third largest urban agglomeration in India after Mumbai and Delhi. The city is also classified
as the eighth largest urban agglomeration in the world. As per the census of 2001, the
urban agglomeration's population was 13,216,546 while that of the city (Municipal
Corporation of Kolkata) was 4,580,544. Kolkata city's population growth has been pretty low
in the last decade. It is the main business, commercial and financial hub of Eastern India.
Kolkata is a multicultural, cosmopolitan city. Kolkata witnessed an economic decline from
the late sixties till the late nineties. The city's economic fortunes turned the tide as the early
nineties economic liberalization in India reached Kolkata‘s shores during late nineties.
Kolkata is home to many industrial units, of large Indian corporations, whose product range
is varied and includes - engineering products, electronics, electrical equipment, cables, steel,
leather, textiles, jewellery, frigates, automobiles, railway coaches, wagons. Several industrial
estates like Taratolla, Kalyani, Uluberia, Dankuni, Kasba, Howrah are spread throughout the
urban agglomeration. A huge leather complex has come up at Bantolla. An export
processing zone has been set up in Falta. Specialized setups like the country's first Toy Park,
and a Gem and Jewellery Park have also been established. The city is the major business,
commercial and financial hub of eastern India and also of the north-eastern states. India`s
second largest bourse - the Kolkata Stock Exchange is based here. Some notable companies
and business magnets established in Kolkata are ITC Limited, Bata India, Birla Corporation,
Coal India Limited, Damodar Valley Corporation, United Bank of India, UCO Bank, Allahabad
Bank and Vijaya Bank.
Size of population and its distribution over space play a very significant role in spatial
planning. According to 2001 Census, 13.22 million people were distributed over 1851.41 sq.
km. of Kolkata Metropolitan Area (KMA) forming an overall density of 7950 persons per sq.
km. Area category-wise distribution: Kolkata Municipal Corporation (KMC), the largest
component of KMA with 197.54 sq. km. of area, accounts for 10.6 per cent of KMA‘s area
and with 45.73 lakh residents accounts for 31.1 per cent of KMA‘s population. Other two
municipal corporations viz. Chandannagore and Howrah extend over 3.9 (1.2 + 2.7) per
cent of KMA‘s land accounting for 7.9 (1.1 + 6.8) per cent of KMA‘s population. The 38
municipal towns of KMA extend over 33.2 per cent KMA‘s land and shelter 45.1 per cent of
KMA‘s residents. The 77 CTs occupy only 10.8 per cent of KMA‘s area providing home to 6.7
Home Care Services And Development Perspective – A Study On Customer Perception And Acceptability In The Urban Parts Of India Page 122
per cent of KMA‘s population. A vast chunk of KMA‘s land i.e. 40.3 per cent is rural in nature
accounting for only 8.7 per cent of KMA‘s population. The accessibility of care to these areas
is always a problem. There are inadequate tertiary care facilities in these areas outside
Kolkata Municipal area. They need to travel long distances to avail quality care which leads
to cost burden on the family. If Home Care services are started, it will be a boon for them.
4.6.1. Kolkata's literacy rate
Kolkata has a very good literacy rate of 81 per cent which exceeds the all-India average of
66 per cent. With high literacy rate and high per capita income there is high health
awareness and the willingness to spend more.
4.6.2. Age Distribution and Dependency Ratio in Kolkata
Dependency ratio is defined as the ratio of population below 15 years and above 60 years
taken together to the population in the age group 15 - 59. It has an important economic
significance. The low dependency ratio of a region implies that a low percentage of
population depends on its working force for economic wealth to consume. The dependency
ratio for KMA and KMC are found to be 0.53 and 0.49 respectively. The dependent
population is very large.
Table 4.10. Age Distribution in Kolkata
Age Pyramid - Kolkata 2005
Age group (Years) Male
Female
Number Percentage Number Percentage
0 to 4 132,500 5.32 per cent 124,400 6.02 per cent
5 to 9 176,600 7.09 per cent 161,200 7.80 per cent
10 to 14 212,200 8.51 per cent 192,800 9.33 per cent
15 to 19 229,100 9.19 per cent 195,000 9.43 per cent
20 to 24 243,400 9.77 per cent 195,200 9.44 per cent
25 to 29 236,400 9.48 per cent 198,800 9.62 per cent
30 to 39 432,500 17.35 per cent 356,000 17.22 per cent
40 to 49 357,700 14.35 per cent 263,100 12.73 per cent
50 to 59 231,900 9.30 per cent 168,400 8.15 per cent
60 to 69 141,300 5.67 per cent 122,000 5.90 per cent
70 to 79 69,300 2.78 per cent 61,400 2.97 per cent
80+ 29,500 1.18 per cent 29,200 1.41 per cent
Total 2,492,400 100.00 per
cent 2,067,500 100.00 per
cent
Source: CIA Factbook 2007, USA
Home Care Services And Development Perspective – A Study On Customer Perception And Acceptability In The Urban Parts Of India Page 123
4.6.3. Healthcare Scenario in Kolkata
The Human Development Indices for Kolkata is as follows: Health Index 0.82; Income Index
0.73; and human development index of 0.78 which is the highest in West Bengal. Kolkata
ranks first in human development ranking of West Bengal.
Several outcome indicators for health and nutrition suggest that while average conditions
could have improved more rapidly, there is substantially more equality of access across the
population than in other parts of India. In the context of the high population density in the
city, the extent of reduction of the decennial growth rate of population in West Bengal has
been quite impressive at nearly 7 per cent as compared to the Indian average of 2.5 per
cent. This has occurred in a scenario of both birth rates and death rates declining quite
rapidly. The improvement in the sex ratio in West Bengal has been considerable, at the rate
of 1.86 per cent as compared to the average Indian improvement of 0.6 per cent. Sex ratios
also show district wise differences, with Medinipur being the best and Kolkata being the
worst. Of course, high rates of male in-migration into Kolkata may explain this difference to
some extent; however, the sex ratio for 0-6 years is also the lowest in Kolkata.
Kolkata has improved on Infant Mortality Rate (IMR) and Maternal Mortality Rates (MMR) as
compared to West Bengal which ranks third in India with respect to infant mortality rates.
Even in terms of reduction over time, between the 1982-1992 period and the 1992-2002
period West Bengal appears to have done much better than India as a whole, which clearly
suggests a gradual improvement in health facilities over the years in the state. Infant
mortality is nearly 42 per cent of the deaths occur within the first week, the control of early
neonatal mortality would lead to a much improved IMR.
The data on nutrition overall indicates that the average level of nutrition in the city, and
especially among women, is low by several criteria. However, malnutrition among children is
lower than the national average, and severe malnutrition is also low, suggesting that
distribution is better than in most other states. The overall anaemia status of children in
Kolkata and West Bengal is very poor as it ranks as low as nineteenth among 25 states. The
proportion of children with anaemia (78 per cent) is higher compared to the Indian average
of 74 per cent. In the rural areas, 82 per cent of children are estimated to have anaemia,
compared to 64 per cent in urban West Bengal and 60 per cent in Kolkata. Severe anaemia
is also higher in rural West Bengal, at 5.3 per cent compared to 4.6 per cent in the urban
areas and 0.7 per cent in Kolkata.
Home Care Services And Development Perspective – A Study On Customer Perception And Acceptability In The Urban Parts Of India Page 124
The incidence of anaemia among women is much higher than in many other parts of the
country. Compared with the national average of 52 per cent Kolkata has high incidence of
Anaemia. Once again, rural women tend to be worse off in terms of anaemia, although the
incidence of severe anaemia shows the opposite pattern, being the lowest in the rural areas
at 1.4 per cent, compared to 1.8 per cent in all urban areas and 2 per cent in Kolkata.
The data on morbidity among the general population indicate very high incidence of asthma
and jaundice. These are diseases which are affected by the extent of atmospheric pollution
and the availability of safe water and sanitation, so these are clear areas for public health
intervention. More of lifestyle disease than communicable disease are showing up gradually.
The public hospitals in Kolkata, such as Kolkata Medical College or Nil Ratan Sarkar Medical
College, were a melting pot for the best clinical acumen and a crucible for medical treatment
and research, in the heydays of 1960s, which set new benchmarks for other institutes. Not
just West Bengal, but patients from Bihar, Orissa, and the seven North Eastern states
flocked to Kolkata for treatment. However, in the period from '70s to the '80s, healthcare
services in Kolkata began a downward spiral from their position of strength. As political
turmoil and union uprisings derailed development and complacency set in, the overloaded
public healthcare system failed to cope with the enormous inflow of patients. While the
South emerged as a hub for medical care, public hospitals in Kolkata started lagging behind
in technology and clinical acumen.
The darkness that engulfed the healthcare vista of the city for two decades started clearing
only by the mid-'90s with the advent of hospitals like Peerless Hospital, Ruby Hospital, AMRI
and BM Birla (the cardiac wing of GP Birla group that was already running CMRI). The city's
healthcare landscape got a further boost in the decade beginning 2000 with the
establishment of hospitals like Apollo Gleneagles, Wockhardt (now Fortis), Bhagirathi Neotia
Woman and Child Care Centre, Desun, Sankara Nethralaya and Columbia Asia.
4.6.4. Hospital Beds in Kolkata
There are approximately 200 hospitals within the city and the total number of beds in the
city is 20,000 to 25,000 beds for an estimated population of 51 Lakh. Out of these 72 per
cent are in private sector, 20 per cent are trust hospitals, 15 per cent are government
hospitals and only 10 per cent are nursing homes.
Home Care Services And Development Perspective – A Study On Customer Perception And Acceptability In The Urban Parts Of India Page 125
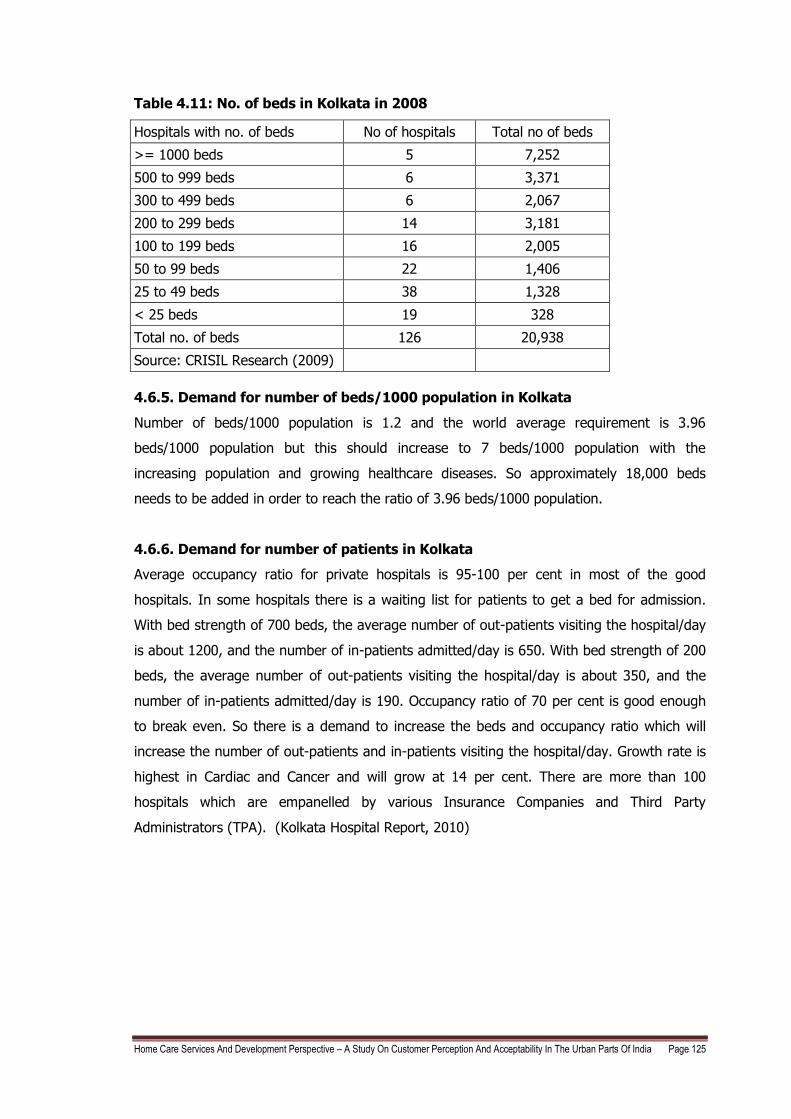
Table 4.11: No. of beds in Kolkata in 2008
Hospitals with no. of beds No of hospitals Total no of beds
>= 1000 beds 5 7,252
500 to 999 beds 6 3,371
300 to 499 beds 6 2,067
200 to 299 beds 14 3,181
100 to 199 beds 16 2,005
50 to 99 beds 22 1,406
25 to 49 beds 38 1,328
< 25 beds 19 328
Total no. of beds 126 20,938
Source: CRISIL Research (2009)
4.6.5. Demand for number of beds/1000 population in Kolkata
Number of beds/1000 population is 1.2 and the world average requirement is 3.96
beds/1000 population but this should increase to 7 beds/1000 population with the
increasing population and growing healthcare diseases. So approximately 18,000 beds
needs to be added in order to reach the ratio of 3.96 beds/1000 population.
4.6.6. Demand for number of patients in Kolkata
Average occupancy ratio for private hospitals is 95-100 per cent in most of the good
hospitals. In some hospitals there is a waiting list for patients to get a bed for admission.
With bed strength of 700 beds, the average number of out-patients visiting the hospital/day
is about 1200, and the number of in-patients admitted/day is 650. With bed strength of 200
beds, the average number of out-patients visiting the hospital/day is about 350, and the
number of in-patients admitted/day is 190. Occupancy ratio of 70 per cent is good enough
to break even. So there is a demand to increase the beds and occupancy ratio which will
increase the number of out-patients and in-patients visiting the hospital/day. Growth rate is
highest in Cardiac and Cancer and will grow at 14 per cent. There are more than 100
hospitals which are empanelled by various Insurance Companies and Third Party
Home Care Services And Development Perspective – A Study On Customer Perception And Acceptability In The Urban Parts Of India Page 126
4.6.7. Projected Growth in the number of beds in Kolkata
Table 4.12: 2009-2012 — Names of Upcoming hospitals: Kolkata
No. Name of the hospital
No. of beds
Remarks
1 Global Hospitals 700 Global Hospitals has tied up with the Surekha group for the project. Expected to come up in two phases of 350 beds each. Project is still at a planning stage.
2 AMRI Hospitals 500 500 Bed Hospital at New Town Rajarhat. Land acquisition is underway.
3 Medica Synergie Pvt. Ltd.
500 Construction of the 500 bed project located on EM Bypass is underway.
4 Neotia Elbit Healthcity
500 Project at planning stage, to be located at chakgheria on EM Bypass.
5 Wockhardt Hospital 342 Expected to specialise in cardiology and cardiac surgery besides urology and nephrology. Construction is underway.
6 Ruby General Hospital Limited
300 Plans to set up a 300-bed unit for oncology and neurology spread over 2.5 acres adjacent to its building on EM Bypass
7 AMRI Hospitals 275 275 bed hospital to be located at Mukundpur Road. Construction is underway.
8 Tata Memorial Cancer Hospital
150 Located near New Town Rajarhat, the facility is expected to become operational in 2009.
Total supply 3,267
n.a.: Not available
Source: CRISIL Research (2009)
4.6.8. Hospital Bed Ratio in Kolkata
With population served per bed ratio being at 1.88 as against three to four beds per 1,000
populations in developed countries extra beds are required urgently. The city just does not
cater to the city's population alone. The catchment area is the entire state, neighboring
states and neighboring countries like Bangladesh, Nepal, and Bhutan as well. Kolkata is
projected to face a massive shortage of 13,735 beds in 2011(Express Healthcare, July
2010).
Home Care Services And Development Perspective – A Study On Customer Perception And Acceptability In The Urban Parts Of India Page 127
4.7. CHENNAI
Chennai, formerly Madras, is the capital of Tamil Nadu and is located on the Coromandel
Coast of the Bay of Bengal. Its the fourth largest metropolitan area of India. The urban
agglomeration of Chennai has an estimated population over 6.43 million in the year 2001,
making it one of the largest urban agglomerations in India. The city is a large commercial
and industrial centre, and is known for its cultural heritage and temple architecture.
Approximately 40 per cent of the automobile industries have their base in Chennai and
hence the place is proudly recognized as the Automobile Capital of India. Major software
companies like Accenture, Cognizant Technology Solutions (CTS), Infosys, Satyam, Sun
Microsystems, Symantec, TCS (Tata Consultancy Services Ltd.), Verizon, Wipro have
development centres in the city. The city is now the second largest exporter of Information
Technology (IT) and IT Enabled Services in the country after Bangalore.
4.7.1 Literacy Levels in Chennai
Census figures indicate that the literacy rates in Chennai City and the CMA are more or less
equal and these figures compare favorably with the overall literacy rate in urban Tamil
Nadu. The literacy rate has been increasing since 1961 from 55 per cent to 74 per cent. The
table below gives the comparative picture.
Table 4.13: Literacy Levels in CMA in percentage
1961 1971 1981 1991 2001
City 59.47 62.01 68.68 72.54 76.81
CMA 54.82 58.64 66.56 70.32 76.09
Urban TN 21.06 30.92 40.43 51.33 73.51
Source: Chennai Demography 2009
4.7.2. Age Structure and Dependency Ratio in Chennai
Age structure of a population in a city / metropolis plays a major role in urban planning. It
gives an idea about dependent population, working population, jobs to be created, the
present and future requirements of educational, health and other facilities and amenities. It
depends on birth rate, death rate and also migration. Age structure of population in CMA as
per Census 1971 to 2001 is given in the table below where the dependent population is
seen to be increasing.
As per Table 4.15 the dependent ratio is 479 and is having a disability percentage of 2.2.
Home Care Services And Development Perspective – A Study On Customer Perception And Acceptability In The Urban Parts Of India Page 128
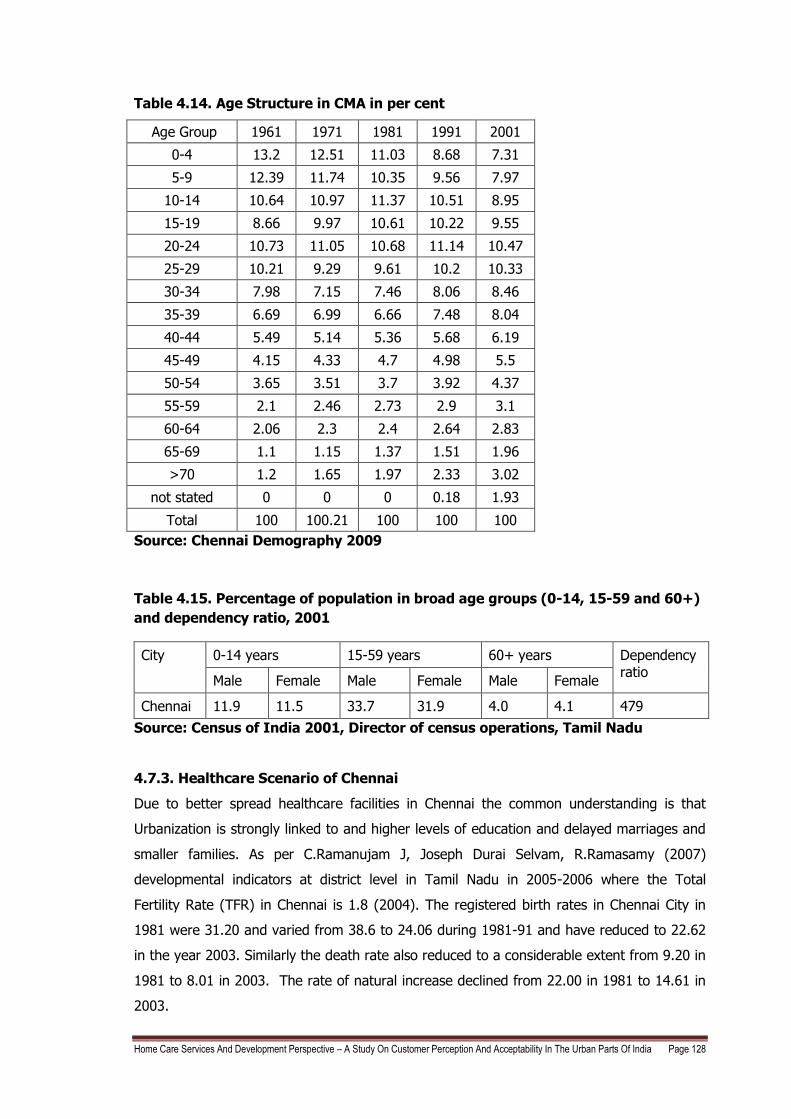
Table 4.14. Age Structure in CMA in per cent
Age Group 1961 1971 1981 1991 2001
0-4 13.2 12.51 11.03 8.68 7.31
5-9 12.39 11.74 10.35 9.56 7.97
10-14 10.64 10.97 11.37 10.51 8.95
15-19 8.66 9.97 10.61 10.22 9.55
20-24 10.73 11.05 10.68 11.14 10.47
25-29 10.21 9.29 9.61 10.2 10.33
30-34 7.98 7.15 7.46 8.06 8.46
35-39 6.69 6.99 6.66 7.48 8.04
40-44 5.49 5.14 5.36 5.68 6.19
45-49 4.15 4.33 4.7 4.98 5.5
50-54 3.65 3.51 3.7 3.92 4.37
55-59 2.1 2.46 2.73 2.9 3.1
60-64 2.06 2.3 2.4 2.64 2.83
65-69 1.1 1.15 1.37 1.51 1.96
>70 1.2 1.65 1.97 2.33 3.02
not stated 0 0 0 0.18 1.93
Total 100 100.21 100 100 100
Source: Chennai Demography 2009
Table 4.15. Percentage of population in broad age groups (0-14, 15-59 and 60+)
and dependency ratio, 2001
City 0-14 years 15-59 years 60+ years Dependency ratio
Male Female Male Female Male Female
Chennai 11.9 11.5 33.7 31.9 4.0 4.1 479
Source: Census of India 2001, Director of census operations, Tamil Nadu
4.7.3. Healthcare Scenario of Chennai
Due to better spread healthcare facilities in Chennai the common understanding is that
Urbanization is strongly linked to and higher levels of education and delayed marriages and
smaller families. As per C.Ramanujam J, Joseph Durai Selvam, R.Ramasamy (2007)
developmental indicators at district level in Tamil Nadu in 2005-2006 where the Total
Fertility Rate (TFR) in Chennai is 1.8 (2004). The registered birth rates in Chennai City in
1981 were 31.20 and varied from 38.6 to 24.06 during 1981-91 and have reduced to 22.62
in the year 2003. Similarly the death rate also reduced to a considerable extent from 9.20 in
1981 to 8.01 in 2003. The rate of natural increase declined from 22.00 in 1981 to 14.61 in
2003.
Home Care Services And Development Perspective – A Study On Customer Perception And Acceptability In The Urban Parts Of India Page 129
The neonatal mortality rate is 7.2 in 2004. The average life expectancy is the average
number of years a person is expected to live assuming that the current mortality rates
continue. The average life expectancy at birth in Chennai is 67 years for Males and 69.8 for
females in 2001 (Life Expectancy for India is 67.7 as per Human Development Report, 2007-
2008). With economic growth the death rate declined but since better health facilities birth
rate remains same therefore the increase in Population of Chennai. Between the years
1991-2001, Chennai had a decadal growth rate of 13.07 with a life expectancy of 74.2 in the
year 1997. Chennai ranked first in Human Development Rank and Gender Development
Rank in Tamil Nadu.
In 2005-2006, Heart attacks (8487) caused the maximum deaths. Increased number of
heart disease is due to sedentary life styles with lack of exercise and poor eating habits in
Chennai. Deaths due to Cancer were 677 and Diabetes 296. Non communicable diseases
dominate over communicable diseases. Deaths due to Cholera were 13 and due to Jaundice
908. Prevalence rate of Tuberculosis in one lakh population is 311 and for Malaria its 78.
Tuberculosis which is widely known as poor mans disease also has a very high incidence
due to poor unhygienic conditions.
Infant mortality rate (IMR) in Chennai is 13.73 in 2005-2006 (In 2002 it was 44 for Tamil
Nadu). Maternal mortality occurs due to complications during pregnancy and child birth and
is related to the availability and access to institutional and skilled personnel at the time of
delivery. A higher number of institutional births actually reduces the instances of maternal
mortality and this is what is happening in Chennai, Statewide and nationally. The maternal
mortality ratio (Number of maternal deaths due to pregnancy causes occurring during
pregnancy within 42 days after termination of pregnancy per one lakh live births) of Chennai
is 0.4 (In 2002 it is 112 for Tamil Nadu) only.
Adequate nutrition is critical for health and productivity of the people. Malnutrition can result
in greater susceptibility to infections, risk of adverse pregnancy outcomes for women and
growth retardation among children. 51.9 had good 90 per cent of standard weight but the
other percentage of 49.9 per cent of children had between 60-90 per cent of standard
weight. 96.5 per cent of adolescent girls were having anaemia in 2002-2004.
Against this backdrop of birth rate, death rate, infant and maternal mortality rate and
nutritional status of the population a review of the provision of health services in Chennai
would be seen. The summary of all the health indicators is given as a comparision between
these cities in Appendix 11.
There are 15 Government hospitals and a large number of private hospitals which provide
medical and healthcare. The Government General hospital, popularly referred to as "G.H.",
is the biggest government run hospital in the city. There are many large private hospitals,