CHAPTER IV RESEARCH FINDING AND DISCUSSION This chapter is aimed to find out whether any difference between the use of problem sticks as teaching media on students’ speaking skill at second grade of SMPI Brawijaya Pungging, Mojokerto. This chapter presents the result of research findings which is intended to answer the problem of the study and research discussion. This chapter is divided four subheadings: data presentation, data analysis and discussion. Besides, this chapter analyzes statistically the data gained from the result of pre-test and post-test of both experimental and control group. For this case, the t-test was applied. A. Data presentation Problem sticks was used to improve the student’ speaking ability in learning process. This study was conducted to find out whether there is difference between the students who are taught using problem sticks and those are taught without using problem sticks. This study used quasi experimental designed which consists of two subject experimental and control group. One class, VIII A consists of 38 students’, was selected and split up into two groups as the sample of the research. From such class, the researcher got VIII B as the experimental group and VIII A as the control group. This study was conducted by the researcher to find out how the teacher uses problem sticks in teaching and learning English, how problem sticks improves students’ speaking skill and whether students who are taught through 1
Transcript
1
CHAPTER IV
RESEARCH FINDING AND DISCUSSION
This chapter is aimed to find out whether any difference between the use
of problem sticks as teaching media on students’ speaking skill at second grade of
SMPI Brawijaya Pungging, Mojokerto. This chapter presents the result of
research findings which is intended to answer the problem of the study and
research discussion. This chapter is divided four subheadings: data presentation,
data analysis and discussion. Besides, this chapter analyzes statistically the data
gained from the result of pre-test and post-test of both experimental and control
group. For this case, the t-test was applied.
A. Data presentation
Problem sticks was used to improve the student’ speaking ability in
learning process. This study was conducted to find out whether there is
difference between the students who are taught using problem sticks and those
are taught without using problem sticks. This study used quasi experimental
designed which consists of two subject experimental and control group. One
class, VIII A consists of 38 students’, was selected and split up into two groups
as the sample of the research. From such class, the researcher got VIII B as the
experimental group and VIII A as the control group.
This study was conducted by the researcher to find out how the teacher
uses problem sticks in teaching and learning English, how problem sticks
improves students’ speaking skill and whether students who are taught through
1
2
problem sticks have better speaking skill than those who are not taught through
problem sticks. The data was collected from the students’ pretest and posttest
score and questionnaire. The pretest was conducted first to the experimental
and control group. The result of the pretest provides information about both of
groups’ ability in speaking. The posttest was administered then to both of
groups after the experimental group got the treatments and the control group
taught through conventional teaching. The analytical scoring adapted from
Arthur Hughes is used to score the students’ speaking skill. The components on
the scoring which are used in this test are pronunciation, grammar, vocabulary,
fluency and comprehension.
1. The Result of Pre-Test and Post-Test of Experimental Group
The data was collected from two groups; the experimental and control
groups. The pretest was administrated before the problem sticks was
implemented in experimental group.
Pretest was conducted on Tuesday, June 11th
2013. The pretest in
experimental group was given on the first meeting, while the control group
was given pretest on the second meeting. Pretest was conducted by the
researcher as the replacement of the English teacher. The researcher asked
the students to tell material from book entitled “Describing People”. The
pretest was conducted to determine the students’ English speaking ability.
1) The Result of Experimental Group’s Pretest Score
In this study, the experimental group was the students of VIII A. The
researcher took 20 students as the sample of the experimental group. In
3
the experimental groups, the students were given treatments by teaching
them using problem sticks. The main data of the experimental group
were collected from pretest and posttest.
The data from pretest was aimed to measure the students’ speaking
skill before they got the treatments. The pretest of the experimental
group was done on Tuesday, June 11th
2013. In pretest, students were
asked to use the problem sticks. The topic was describing people. So,
the students were free to choose one of the describing people. The
whole scoring of the students’ speaking skill was adapted from Arthur
Hughes. There were five categories with five levels to score the
students’ speaking skill. The whole of the students’ pretest score are
presented as follows:
Table 4.1
Students of the Experimental Group’s Pretest Score
Student Pretest
G V C F P Score
1 8 8 12 8 12 48
2 12 12 12 12 12 60
3 8 12 8 8 12 48
4 8 12 12 8 12 52
5 8 12 12 8 12 52
6 12 12 12 12 12 60
7 8 12 12 8 8 48
8 12 16 12 12 12 64
9 8 12 12 8 16 56
10 12 12 12 12 12 60
11 8 8 12 8 12 48
12 12 12 12 12 12 60
13 12 16 16 12 12 68
14 8 12 12 8 12 52
15 12 12 12 12 12 60
4
16 12 12 12 12 12 60
17 8 12 12 8 12 52
18 8 12 16 12 12 60
19 8 12 12 8 8 48
20 8 12 12 12 12 56
∑ 192 240 244 200 236 1112
9.6 12 12.2 10 11.8 55.6
In which:
G : Grammar
V : Vocabulary
C : Comprehension
F : Fluency
P : Pronunciation
2) The Activities during Treatment of Experimental Groups
a) The first treatment was held on Wednesday, June 12th
2013. The
process of first treatment is presented as follows:
(1) Open the lesson.
(2) Elaborate what problem sticks are and show the examples of
problem sticks.
(3) Explain and present problem sticks to the students before they are
asked to use problem sticks.
(4) Divide students into some groups.
(5) Prepare the tools which are be able to speak up about material of
asking for and giving suggestion in problem sticks.
(6) View the students’ problem sticks in front of the class.
5
(7) Evaluate and discuss problem sticks to find which part should be
improved.
(8) Give the feedback and conclusion of what have been learned.
(9) Close the lesson.
b) The second treatment was held on Wednesday, June 19th
2013. The
process of second treatment is presented as follows:
(1) Open the lesson.
(2) Elicit the students and remind the previous meeting about the
evaluation and discussion of problem sticks.
(3) Gather in their groups.
(4) The researcher observes to the students for each groups.
(5) Evaluate and discuss problem sticks to find which part should be
improved.
(6) Give the feedback and conclusion of what have been learned.
(7) Close the lesson.
3) The Result of Experimental Group’s Pretest Score
While, after the researcher gave treatments by teaching them using
problem sticks, the researcher conducted posttest to find out whether
there was improvement of the students’ speaking skill or not. The
posttest was administered on Friday, June 21st 2013. The students were
also asked to use of problem sticks, but the topic was describing people.
So, the result of the students’ posttest score is presented as follows:
Table 4.2
Students of the Experimental Group’s Posttest Score
6
Student
Posttest
G V C F P Score
1 18 16 12 14 12 72
2 12 16 16 12 16 72
3 12 16 12 12 16 68
4 12 16 12 12 12 64
5 16 16 18 14 16 80
6 12 16 16 12 12 68
7 12 12 12 12 12 60
8 20 16 16 12 16 80
9 24 20 16 12 16 88
10 16 16 16 16 12 76
11 12 16 16 12 16 72
12 18 16 20 12 16 82
13 16 16 16 16 12 76
14 14 12 16 12 16 70
15 12 16 16 16 16 76
16 16 24 16 12 16 84
17 16 16 16 12 16 76
18 12 16 12 16 12 68
19 16 16 20 12 16 80
20 14 16 12 16 16 74
∑ 300 324 306 264 292 1486
15 16.2 15.3 13.2 14.6 74.3
2. The Result of Pre-Test and Post-Test of Control Group
1) The Result of Control Group’s Pretest Score
The members of control group were the students of VIII B. The
students consisted of 38 students as the sample. In the control group,
the students were not taught through problem sticks. But, the students
were taught through conventional teaching which is usually done by the
7
teacher. The main data of the control group’s scores were collected
from pretest and posttest.
The pretest was aimed to know the students’ speaking skill at the
control group. The pretest of the control group was administered on
Tuesday, June 11th
2013. The scoring which was used was adapted
from Arthur Hughes. There were five categories with five levels. The
result of the students’ pretest score is presented as follows:
Table 4.3
Students of the Control Group’s Pretest Score
Students Pretest
G V C F P Score
1 8 12 12 12 12 56
2 8 12 12 12 12 56
3 8 12 12 12 12 56
4 8 12 12 12 12 56
5 12 12 16 12 12 64
6 8 12 12 8 12 52
7 12 12 12 8 12 56
8 8 12 12 12 12 56
9 8 12 12 8 12 52
10 8 12 12 12 12 56
11 8 12 12 12 12 56
12 8 12 12 12 12 56
13 8 12 12 12 12 56
14 12 12 12 12 12 60
15 12 12 12 12 12 60
16 12 12 12 12 12 60
17 8 12 12 8 12 52
18 12 16 12 16 12 68
19 8 12 12 12 12 56
20 8 8 12 8 8 44
∑ 184 240 244 224 236 1128
9.2 12 12.2 11.2 11.8 56.4
8
2) The Activities of Control Groups
a) The first of control group was held on Wednesday, June 12th
2013.
The activities in control groups as follow:
(1) Open the class
(2) Give greeting to students
(3) Ask students to open the students’ book (LKS).
(4) Teach the students using conventional teaching.
(5) Give exercise
(6) Give feedback to students.
(7) Close the class.
b) The second of control group was held on Wednesday, June 19th
2013. The activities have similarity same the first meeting of
control group. The activities in control groups as follow:
(1) Open the class
(2) Give greeting to students
(3) Teach the students using conventional teaching.
(4) Give exercise
(5) Give feedback to students
(6) Close the class.
3) The Result of Control Group’s Pretest Score
After the researcher taught the students using conventional
teaching, the post-test was administered. It was aimed to be compared
to the posttest score of the control group. The posttest was conducted
9
on Friday, June 21st 2013. The whole students’ posttest score is
presented as follows:
Table 4.4
Students of the Control Group’s Posttest Score
Students
Posttest
G V C F P Score
1 16 20 16 16 14 82
2 8 12 12 12 12 56
3 12 16 16 12 16 72
4 12 16 18 16 14 76
5 16 16 18 16 12 78
6 18 18 16 16 16 84
7 12 8 12 12 12 56
8 12 16 12 16 16 72
9 12 16 16 12 16 72
10 18 16 16 16 16 82
11 16 12 16 16 14 74
12 12 16 16 12 16 72
13 12 16 16 12 14 70
14 12 16 16 12 16 72
15 12 16 16 12 12 68
16 16 16 16 12 12 72
17 12 18 16 12 16 74
18 16 16 16 12 12 72
19 12 16 16 12 16 72
20 12 16 18 12 16 74
∑ 268 312 314 268 288 1450
13.4 15.6 15.7 13.4 14.4 72.5
2) Data Analysis of the Students’ Scores
a. The Analysis of the Experimental Group’s Scores
10
After giving the pretest, treatments, and posttest to the
experimental group, the researcher got the result from pretest and
posttest scores presented as follows:
Table 4.5
Total and Mean of Pretest and Posttest Score of
Experimental Group
Test G V C F P Total
PRE ∑
192 240 244 200 236 1112
9.6 12 12.2 10 11.8 55.6
POST ∑
300 324 306 264 292 1486
15 16.2 15.3 13.2 14.6 74.3
Improvement 5.4% 4.2% 3.1% 3.2% 2.8% 18.7%
From the table 4.5 above, it can be seen that there is progress of
the students speaking skill. In pretest, the means of the students’ score
is 9.6 for grammar, 12 for vocabulary, 12.2 for comprehension, 10 for
fluency, and 11.8 for pronunciation. So, the means of the students’
total score is 55.6. It shows that the students’ speaking skill was still
low. Therefore, the researcher taught the students through problem
sticks as the treatment for the experimental group to improve the
students’ speaking skill. While in posttest, the means of the students’
score is 15 for grammar, 16.2 for vocabulary, 15.3 for comprehension,
13.2 for fluency, and 14.6 for pronunciation. So, the means of the
students' total score is 74.3.
11
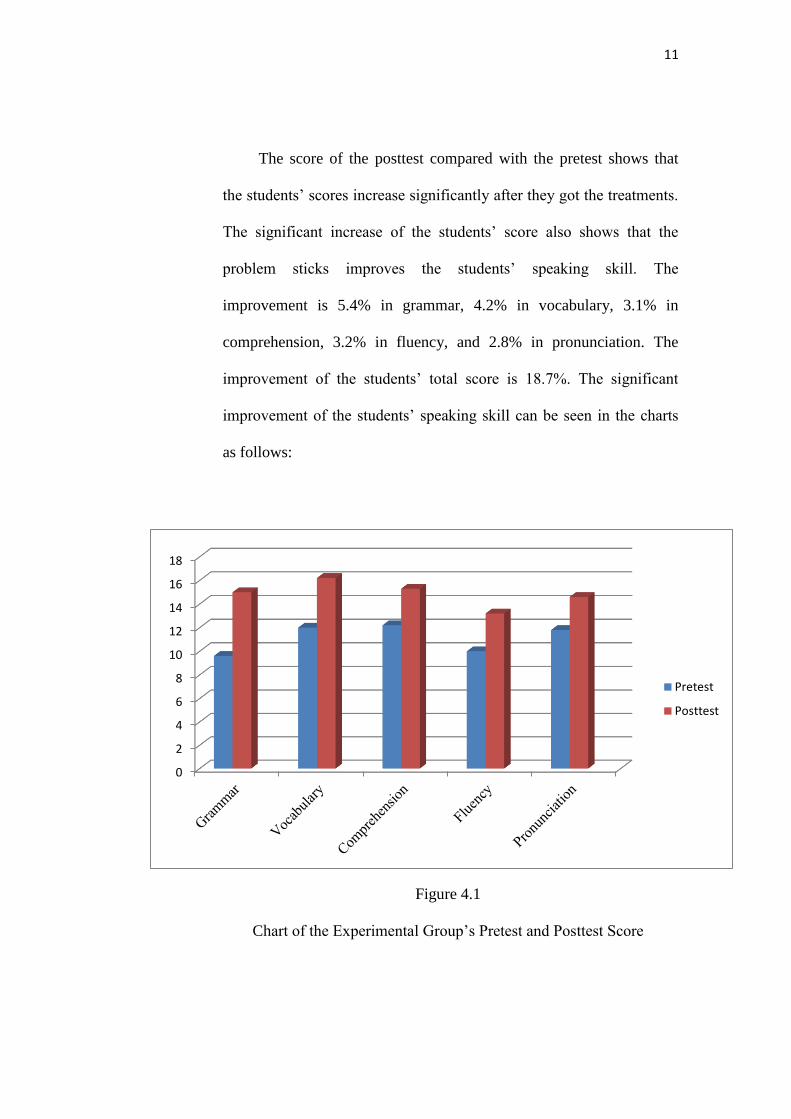
The score of the posttest compared with the pretest shows that
the students’ scores increase significantly after they got the treatments.
The significant increase of the students’ score also shows that the
problem sticks improves the students’ speaking skill. The
improvement is 5.4% in grammar, 4.2% in vocabulary, 3.1% in
comprehension, 3.2% in fluency, and 2.8% in pronunciation. The
improvement of the students’ total score is 18.7%. The significant
improvement of the students’ speaking skill can be seen in the charts
as follows:
Figure 4.1
Chart of the Experimental Group’s Pretest and Posttest Score
0
2
4
6
8
10
12
14
16
18
Pretest
Posttest
12
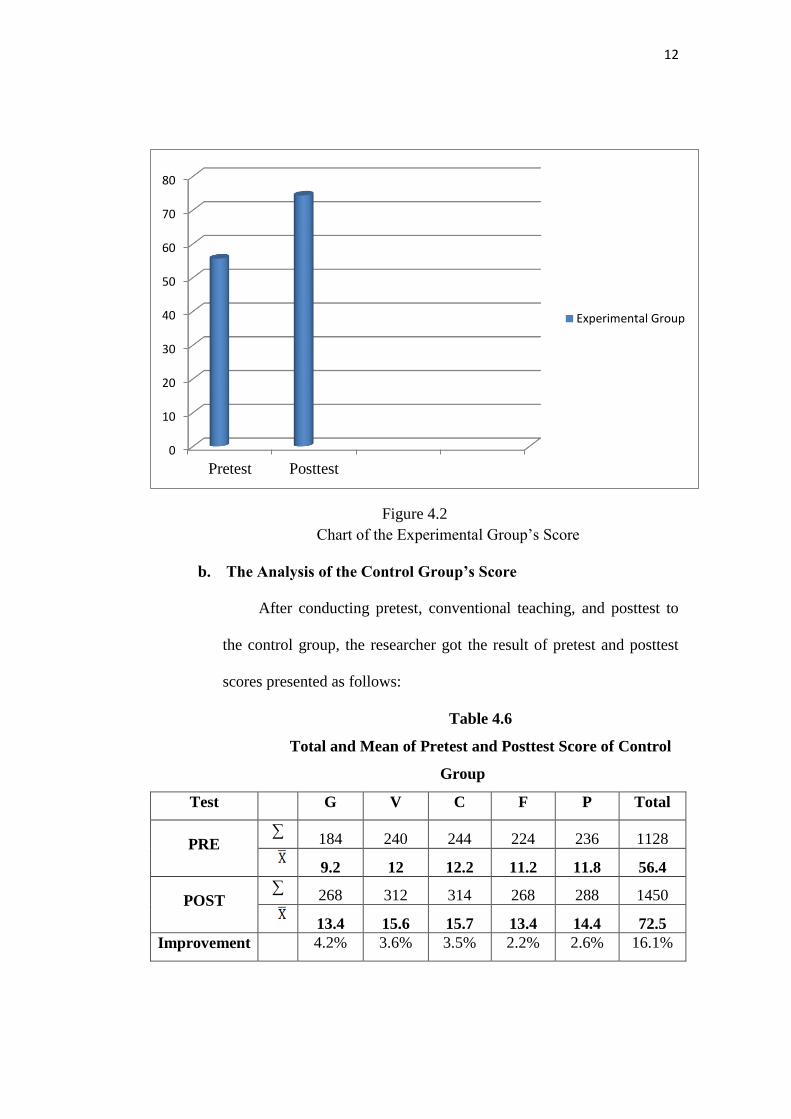
Figure 4.2
Chart of the Experimental Group’s Score
b. The Analysis of the Control Group’s Score
After conducting pretest, conventional teaching, and posttest to
the control group, the researcher got the result of pretest and posttest
scores presented as follows:
Table 4.6
Total and Mean of Pretest and Posttest Score of Control
Group
Test G V C F P Total
PRE ∑
184 240 244 224 236 1128
9.2 12 12.2 11.2 11.8 56.4
POST ∑
268 312 314 268 288 1450
13.4 15.6 15.7 13.4 14.4 72.5
Improvement 4.2% 3.6% 3.5% 2.2% 2.6% 16.1%
0
10
20
30
40
50
60
70
80
Pretest Posttest
Experimental Group
13
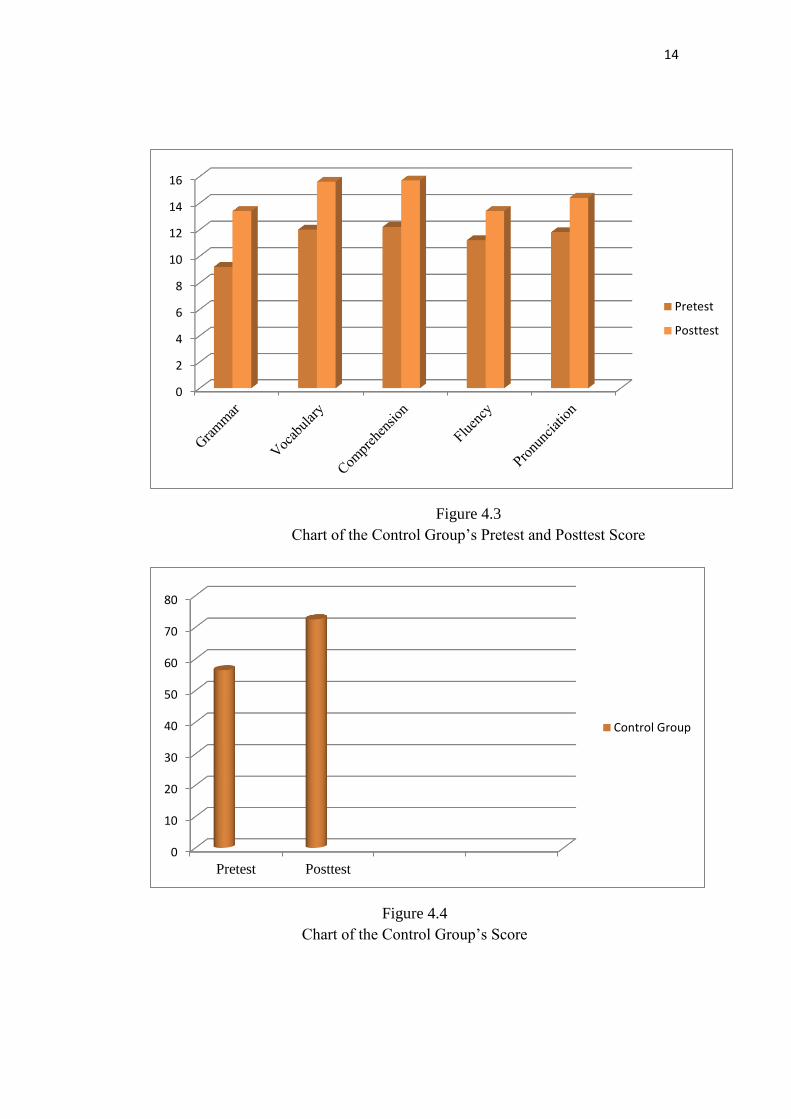
From the table 4.6 above, it can be seen that there is progress of
the students’ speaking skill. In pretest, the means of the students’ score
is 9.2 for grammar, 12 for vocabulary, 12.2 for comprehension, 11.2
for fluency, and 11.8 for pronunciation. So, the means of the students’
total score is 56.4. The students of control group have the same level
of speaking skill as the students of experimental group. But, the
researcher did not teach control group through problem sticks. They
were taught using conventional teaching which is usually used by the
teacher. Meanwhile, the means of the students’ posttest score is 13.4
for grammar, 15.6 for vocabulary, 15.7 for comprehension, 13.4 for
fluency, and 14.4 for pronunciation. So, the mean of the students’ total
score is 72.5.
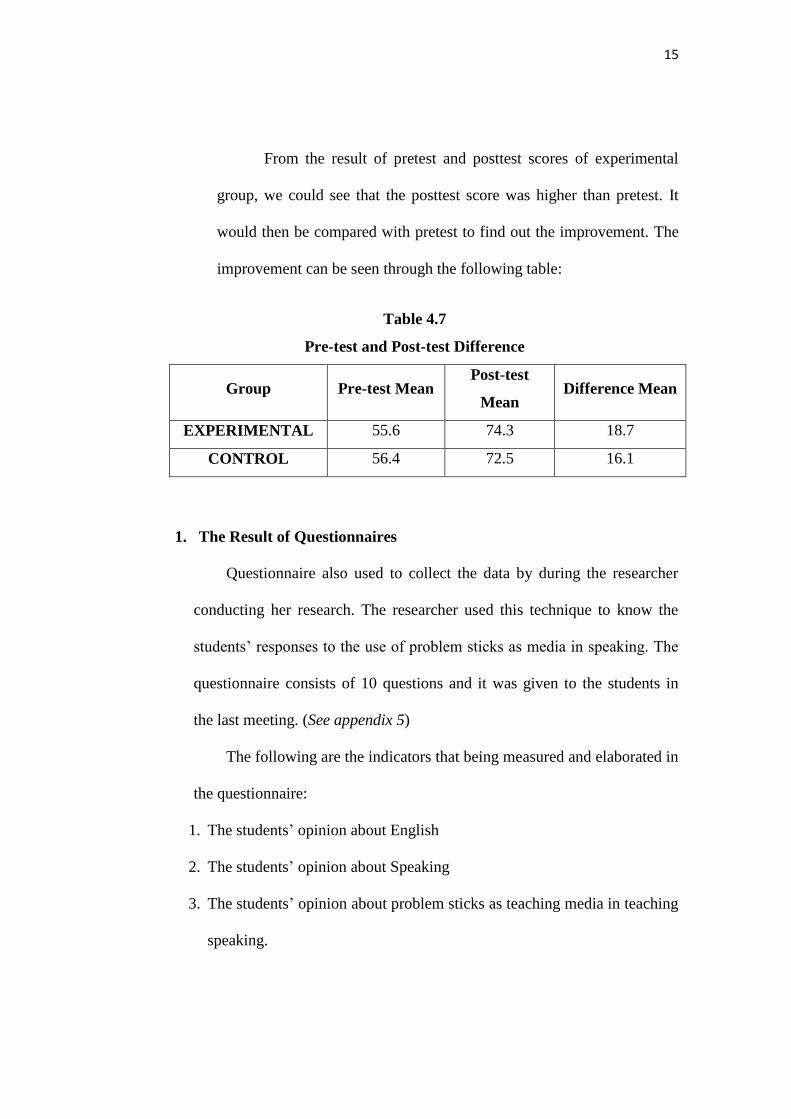
The posttest score, compared with the pretest, shows that the
students’ scores increase. The increase of the students’ score means that
there’s also improvement of students’ speaking skill at control group.
The improvement is 4.2% in grammar, 3.6% in vocabulary, 3.5% in
comprehension, 2.2% in fluency, and 2.6% in pronunciation. The
improvement of the students’ total score is 16.1%. The improvement of
the students’ speaking skill at control group can be seen in the charts
below:
14
Figure 4.3
Chart of the Control Group’s Pretest and Posttest Score
Figure 4.4
Chart of the Control Group’s Score
0
2
4
6
8
10
12
14
16
Pretest
Posttest
0
10
20
30
40
50
60
70
80
Pretest Posttest
Control Group
15
From the result of pretest and posttest scores of experimental
group, we could see that the posttest score was higher than pretest. It
would then be compared with pretest to find out the improvement. The
improvement can be seen through the following table:
Table 4.7
Pre-test and Post-test Difference
Group Pre-test Mean Post-test
Mean Difference Mean
EXPERIMENTAL 55.6 74.3 18.7
CONTROL 56.4 72.5 16.1
1. The Result of Questionnaires
Questionnaire also used to collect the data by during the researcher
conducting her research. The researcher used this technique to know the
students’ responses to the use of problem sticks as media in speaking. The
questionnaire consists of 10 questions and it was given to the students in
the last meeting. (See appendix 5)
The following are the indicators that being measured and elaborated in
the questionnaire:
1. The students’ opinion about English
2. The students’ opinion about Speaking
3. The students’ opinion about problem sticks as teaching media in teaching
speaking.
16
4. The students’ opinion about the use of problem sticks as teaching media
in teaching speaking.
The result of the students’ answer of questionnaire is presented in the
following table:
NUMBER OF
QUESTIONS
NUMBER OF ANSWERS NUMBER OF
STUDENTS A B C D
1 2 16 2 - 20
2 2 14 4 - 20
3 4 5 10 1 20
4 5 7 6 2 20
5 4 11 3 2 20
6 3 9 7 1 20
7 - 13 5 2 20
8 5 9 6 - 20
9 1 11 3 5 20
10 4 12 3 1 20
After the analyzing them, the frequency of occurrence of each opinion
type is counted to know the proportion of each opinion type. It is calculated
using percentage formula:
The score = The Total of opinion of each type x 100%
Total of students
a. The students’ opinion about English (1)
17
No. A B C D
1 10% 80% 10% -
b. The students’ opinion about Speaking (2)
No. A B C D
2 10% 70% 20% -
c. The students’ opinion about problem sticks as teaching media in
teaching speaking (3,4,5,6)
No. A B C D
3 20% 25% 50% 5%
4 25% 35% 30% 10%
5 20% 55% 15% 10%
6 15% 45% 35% 5%
d. The students’ opinion about the use of problem sticks as teaching
media in teaching speaking (7,8,9,10)
No. A B C D
7 - 65% 25% 10%
8 25% 45% 30% -
9 5% 55% 15% 25%
10 20% 60% 15% 5%
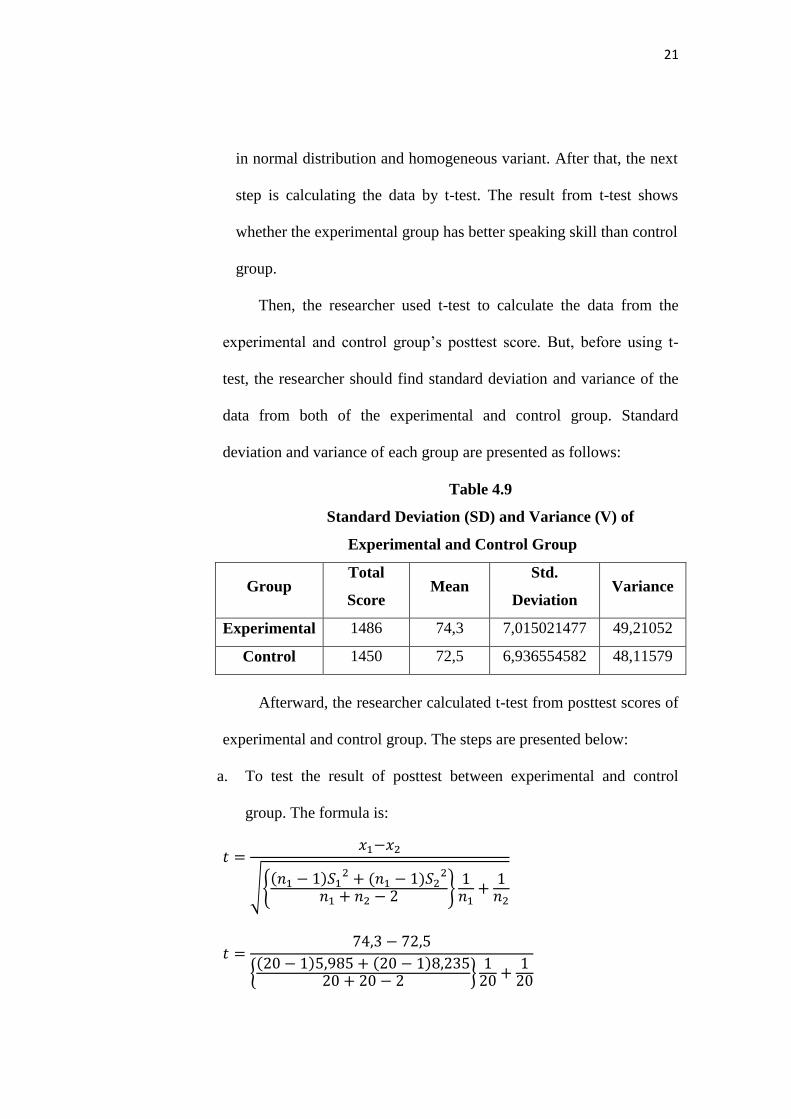
B. The Data Analysis
1. T-test
After all the data of the students’ score had been collected, the
researcher analyzed the data through t-test. T-test is a tool which is used for
18
comparative hypothesis of two samples if the data is in interval or ratio.1 It
is aimed to find out whether the students who are taught through problem
sticks have better speaking skill or not. Before that, the researcher was did
normality test and homogeneities test. The normality test was used to check
whether the posttest score of experimental group and control group were
normally distribution or not. While homogeneity test was used to calculate
the homogeneity of variance of both experimental and control group
posttest score.2 The procedure is as follows:
a. Normality Test
The researcher uses normality test to check whether the posttest score
of experimental group and control group are normally distributed or
not. There are some steps to calculate the normality test. The steps are:3
Determine the length of interval class, the formula is:
( )
1. Arrange the data into a frequency distribution table