CHAPTER IV RESEARCH FINDING AND DISCUSSION This chapter presents about the result of the finding in the field. The data of the study are gained during the research. The result is the answer of the research questions at the chapter I. A. Research findings The researcher discusses the data analysis by determining the result of the students’ comprehension skill in understanding narrative text. The result is viewed from the score of the students’ test. These scores are used to know the difference of students’ comprehension skill in understanding narrative text based on their different sex and school background. There are two tests which are given to the students. The first test consists of 25 multiple choices and 25 True/False questions. The researcher gives 0 score for the wrong answer and 1 score for the correct answer. This scoring technique is applied for all of questions in the first test (test 1). 59 Then, the second test consists of 10 essay questions. The researcher gives scoring based on the scoring rubric. This scoring technique is applied for all of questions in the second test (test 2). 60 59 It is shown in Appendix 5 60 It is shown in Appendix 6
Transcript
49
CHAPTER IV
RESEARCH FINDING AND DISCUSSION
This chapter presents about the result of the finding in the field. The data of
the study are gained during the research. The result is the answer of the research
questions at the chapter I.
A. Research findings
The researcher discusses the data analysis by determining the result of
the students’ comprehension skill in understanding narrative text. The result is
viewed from the score of the students’ test. These scores are used to know the
difference of students’ comprehension skill in understanding narrative text
based on their different sex and school background.
There are two tests which are given to the students. The first test
consists of 25 multiple choices and 25 True/False questions. The researcher
gives 0 score for the wrong answer and 1 score for the correct answer. This
scoring technique is applied for all of questions in the first test (test 1).59
Then, the second test consists of 10 essay questions. The researcher gives
scoring based on the scoring rubric. This scoring technique is applied for all
of questions in the second test (test 2).60
59 It is shown in Appendix 5 60 It is shown in Appendix 6
50
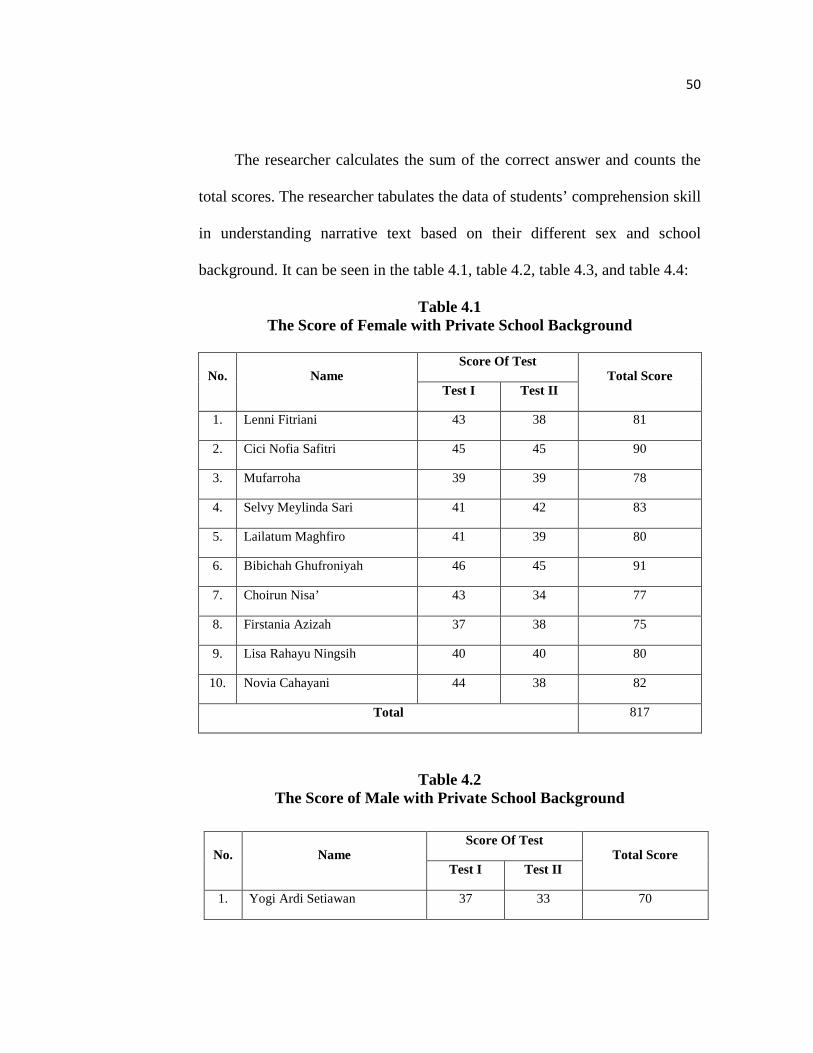
The researcher calculates the sum of the correct answer and counts the
total scores. The researcher tabulates the data of students’ comprehension skill
in understanding narrative text based on their different sex and school
background. It can be seen in the table 4.1, table 4.2, table 4.3, and table 4.4:
Table 4.1 The Score of Female with Private School Background
No. Name Score Of Test
Total Score Test I Test II
1. Lenni Fitriani 43 38 81
2. Cici Nofia Safitri 45 45 90
3. Mufarroha 39 39 78
4. Selvy Meylinda Sari 41 42 83
5. Lailatum Maghfiro 41 39 80
6. Bibichah Ghufroniyah 46 45 91
7. Choirun Nisa’ 43 34 77
8. Firstania Azizah 37 38 75
9. Lisa Rahayu Ningsih 40 40 80
10. Novia Cahayani 44 38 82
Total 817
Table 4.2 The Score of Male with Private School Background
No. Name Score Of Test
Total Score Test I Test II
1. Yogi Ardi Setiawan 37 33 70
51
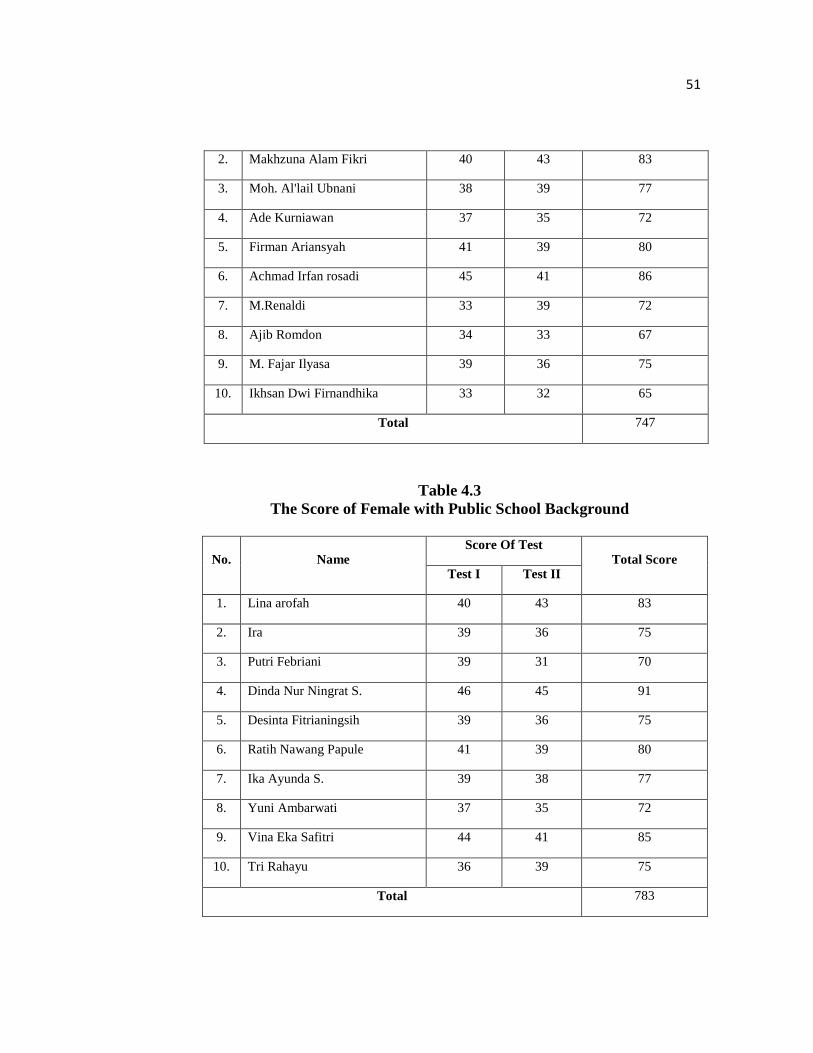
Table 4.3 The Score of Female with Public School Background
No. Name Score Of Test
Total Score Test I Test II
1. Lina arofah 40 43 83
2. Ira 39 36 75
3. Putri Febriani 39 31 70
4. Dinda Nur Ningrat S. 46 45 91
5. Desinta Fitrianingsih 39 36 75
6. Ratih Nawang Papule 41 39 80
7. Ika Ayunda S. 39 38 77
8. Yuni Ambarwati 37 35 72
9. Vina Eka Safitri 44 41 85
10. Tri Rahayu 36 39 75
Total 783
2. Makhzuna Alam Fikri 40 43 83
3. Moh. Al'lail Ubnani 38 39 77
4. Ade Kurniawan 37 35 72
5. Firman Ariansyah 41 39 80
6. Achmad Irfan rosadi 45 41 86
7. M.Renaldi 33 39 72
8. Ajib Romdon 34 33 67
9. M. Fajar Ilyasa 39 36 75
10. Ikhsan Dwi Firnandhika 33 32 65
Total 747
52
Table 4.4 The Score of Male with Public School Background
No. Name Score Of Test
Total Score Test I Test II
1. Surya Fathur Ramadhan 39 36 75
2. Mohammad Tofa 35 32 67
3. Rifqi Laksma W. 31 38 69
4. M.Chabib Asrorudin 39 34 73
5. Rifa Dwi Permana P. 45 42 87
6. Dendy Wahyu W. 40 40 80
7. Iqbal Firmansyah 33 37 70
8. Muh. Lukman Ardiansyah 37 38 75
9. Muh. Yudha Firdaus 32 33 65
10. Dendi Rahmat Fahrezi 34 36 70
Total 731
The data from table 4.1, table 4.2, table 4.3, and table 4.4 show the
students’ result in reading comprehension skill of narrative text. The total
score is the sum up of the students’ score in the first test (test 1) and the
second test (test 2). Test 1 is about fairy tale and test 2 is about fable. There
are two types of questions in test 1, they are 25 multiple choices and 25
True/False questions. In test 2, there are 10 essay questions. The questions are
covering the narrative text either the content which is the generic structure
(orientation, complication, and resolution) consist of events, actors, time and
location or the way how the narrative is told.
53
B. Data Analysis
The result of the students’ ability in comprehending narrative text shown
in table 4.1, table 4.2, table 4.3, and table 4.4 are used by the researcher to
analyze the data further by using Two-Way ANOVA. It is used to verify the
hypothesis. There are several steps which are used in analyzing the data. First,
the researcher finds the quadrate of the score and the mean of it. It can be seen
in table 4.5, table 4.6, table 4.7, and table 4.8:
Table 4.5 The Score of Female with Private School Background
No. Name Score
(X) (X²)
1. Lenni Fitriani 81 6561
2. Cici Nofia Safitri 90 8100
3. Mufarroha 78 6084
4. Selvy Meylinda Sari 83 6889
5. Lailatum Maghfiro 80 6400
6. Bibichah Ghufroniyah 91 8281
7. Choirun Nisa’ 77 5929
8. Firstania Azizah 75 5625
9. Lisa Rahayu Ningsih 80 6400
10. Novia Cahayani 82 6724
Total ∑X= 817
= 81.7
∑X= 66993
= 6699.3
54
Table 4.5 presents the score of female students with private school
background which consists of 2 students who get ≥ 90-100, 5 students who
get ≥80-89, and 3 students who get ≥70-79. Based on the table 4.5, the highest
score is 91 and the lowest score is 77. The total scores of female students with
private school background is 817 and the total of the quadrate of the score is
66993. Furthermore, the researcher also calculates the mean from the data
of table 4.5. In result, the mean of female students with private school
background is ∑X/N = 817/10= 81.7 and the mean of quadrate total is
2)/N = 66993/10= 6699.3.
Table 4.6 Male with Private School Background
No. Name Score
(X) (X2)
1. Yogi Ardi Setiawan 70 4900
2. Makhzuna Alam Fikri 83 6889
3. Moh. Al'lail Ubnani 77 5929
4. Ade Kurniawan 72 5184
5. Firman Ariansyah 80 6400
6. Achmad Irfan rosadi 86 7396
7. M.Renaldi 72 5184
8. Ajib Romdon 67 4489
9. M. Fajar Ilyasa 75 5625
10. Ikhsan Dwi Firnandhika 65 4225
Total ∑X= 747 ∑X²= 56221
55
=74.7 2) = 5622.1
Table 4.6 presents the score of male students with private school
background. Based on the table 4.6 above there is none of students who get ≥
90-100. However, it consists of 3 students who get ≥80-89, 5 students who get
≥70-79 and 2 students who get ≥ 60-69. Based the table 4.6 above, the highest
score is 86 and the lowest score is 65. The total of the score of female students
with public school background is 747 and the total of the quadrate of the score
is 56221. Besides, the researcher also calculates the mean from the data of
table 4.6. In result, the mean of male students with private school background
is ∑X/N = 747/10 = 74.7 and the mean of quadrate total is 2)/N =
56221/10 = 5622.1.
Table 4.7 Female with Public School Background
No. Name Score
(X) (X2)
1. Lina arofah 83 6889
2. Ira 75 5625
3. Putri Febriani 70 4900
4. Dinda Nur Ningrat S. 91 8281
5. Desinta Fitrianingsih 75 5625
6. Ratih Nawang Papule 80 6400
7. Ika Ayunda S. 77 5929
56
T
h
e
Table 4.7 presents the score of female students with public school
background which consists of only 1 student who gets ≥ 90-100, 3 students
who get ≥80-89, 6 students who get ≥70-79 and none of the students who get
≥ 60-69. Based the table 4.7 above, the highest score is 91 and the lowest
score is 70. The total of the score of female students with public school
background is 783 and the total of the quadrate of the score is 61683.
Furthermore, the researcher also calculates the mean from the data of
table 4.7. In result, the mean of female students with public school
background is ∑X/N = 783/10 = 78.3 and the mean of quadrate total is
2)/N = 61683/10 = 6168.3.
Table 4.8 Male with Public School Background
No. Name Score
(X) (X2)
1. Surya Fathur Ramadhan 75 5625
2. Mohammad Tofa 67 4489
3. Rifqi Laksma W. 69 4761
8. Yuni Ambarwati 72 5184
9. Vina Eka Safitri 85 7225
10. Tri Rahayu 75 5625
Total ∑X= 783
= 78.3
∑X²= 61683
2) = 6168.3
57
4. M.Chabib Asrorudin 73 5329
5. Rifa Dwi Permana P. 87 7569
6. Dendy Wahyu W. 80 6400
7. Iqbal Firmansyah 70 4900
8. Muh. Lukman Ardiansyah 75 5625
9. Muh. Yudha Firdaus 65 4225
10. Dendi Rahmat Fahrezi 70 4900
Total ∑X= 731
) = 73.1
∑X²= 53823
2) = 5382.3
Table 4.8 presents the score of male students with public school
background. Based on the table 4.8 above there is none of students who get ≥
90-100. However, it consists of 2 students who get ≥80-89, 5 students who get
≥70-79 and 3 students who get ≥ 60-69. Based the table 4.8 above, the highest
score is 87 and the lowest score is 65. The total of the score of male students
with public school background is 731 and the total of the quadrate of the score
is53823. Furthermore, the researcher also calculates the mean from the
data of table 4.8. In result, the mean of female students with public school
background is ∑X/N = 731/10 = 73.1 and the mean of quadrate total is
2)/N = 53823/10 = 5382.3
Since this research compares the students’ comprehension skill in
understanding narrative text based on their different sex and school
background, there are some variables which include in the study. They are
58
independent variable (students’ different sex and school background) and
dependent variable (students’ comprehension skill in understanding narrative
text).
Therefore, in analyzing the data using Two-Way ANOVA, the
researcher finds the main effect of A (the students’ different sex), main
effect of B (the students’ different school background), and interaction of A
and B. Thus the researcher partitions variance into parts caused by IVA, IVB,
IntAxB, and Error.
The researcher compares the variance associated with each thing of
interest to error variance to see if each effect is meaningful. Therefore, to
make the analysis easy, the second step is tabulating the data above in one
IV : The independent variable. A : Students’ different Sex (A1: Female students and A2: Male
students) B : Students’ different School Background (B1: Private School
Background and B2: Public School Background)
60
X : The score of the students in reading comprehension skill of narrative text.
X² : The quadrate of the score ∑X: Sum of the scores ∑X2: Sum of the quadrate of the score N : Total of respondent. n : Total of respondent in each variable Table 4.9 presents the calculation from the score of students’ test. In
table 4.9, the researcher gets the data from the table 4.5- 4.8. The researcher
puts the data of the female-male students based on their school background.
Then, the researcher sums up the scores based on their effects (A and B), they
are: ∑XA and ∑XB. ∑XA based on the students’ different sex (look in
horizontal way or column). It consists of two parts which are female (∑XA1=
∑Xtp1,1 + ∑Xtp1,2) and male (∑XA2= ∑Xtp2,1 + ∑Xtp2,2). Whereas, ∑XB
based on the students’ different school background (look in vertical way or
row).it consists of two parts which are private school background (∑XB1=
∑Xtp1,1 + ∑Xtp2,1) and public school background (∑XB2= ∑Xtp1,2 +
∑Xtp2,2).
After that, the researcher finds the mean of each effect, they are: A
and B. A is the mean of the students’ different sex (look in horizontal way
or column). It consists of two parts which are female ( A1 = ∑XA1/n) and
male ( A2 = ∑XA2/n). Whereas, B is the mean of the students’ different
school background (look in vertical way or row). It consists of two parts
61
which are private school background ( B1 = ∑XB1/n) and public school
background ( B2 = ∑XB2/n). The last, the researcher sums up all the score
(∑Xtot= ∑XA1 + ∑XA2 or ∑Xtot= ∑XB1 + ∑XB2) and sums up all the
quadrate of the score (∑Xtot2 = ∑XA1 + ∑XA2 or ∑Xtot= ∑XB1 + ∑XB2).
The data from the table of 4.9 above is then used to get the variance. The
researcher goes through several steps to get the variance. Variance is SS/df,
SS is the sum of the squared deviations and df is the degrees of freedom.
These things are based on the math way of looking at the main effects and