28
129 CHAPTER IV RESEARCH METHODOLOGY

129
CHAPTER IV
RESEARCH METHODOLOGY
130
This research study is based on the survey conducted to answer the research
objectives pertaining to various facets of employee engagement. Primary and
secondary data sources were used by the researcher.
4.1 SOURCES OF DATA
Primary and secondary data sources were used to collect information about
aspects of employee engagement and their effect on engaging sales
professionals and the various strategies used by organizations to engage their
workforce and its effect on attrition. Primary data collection tool used was
survey.
Survey conducted involved personal face-to face interviews, telephonic
interviews as well as email correspondence with sales / marketing as well as
Human Resource (HR) professionals across Mumbai. 500 sales / marketing
employees responded to the survey. These included employees who belonged
to senior / middle / lower managerial level, having different number of years of
experience within organization and were / were not a part of mentoring
relationship. To understand the employee engagement strategies used by
organizations, professionals from 114 organizations were surveyed out of
which 50 were from manufacturing and 64 were from service industry.
Classification was also made based on the number of employees working for
the organization.
131
Information collected from secondary data sources included books, magazines,
journals, newspaper articles, reports and research databases like EBSCO and
Proquest. Reports from consulting houses like Towers Perrin, Mercer, Gallup,
Chartered Institute of Personnel and Development (CIPD) were systematically
reviewed to understand employee engagement and its various facets existing
globally as well as in India. Data from various reports by consulting houses is
widely used by organizations and individual researchers (Saunders et. al,
2003). The researcher while accessing the secondary data excluded the data
which was not relevant to the researcher‘s objectives and questions.
The researcher made a quick assessment of the reliability and validity of the
data by looking at the source of the data as outlined by Dochartaigh (2002). It
is referred to as assessing the reputation of the source. Although secondary
data provides a useful resource with which to compare or set in context the
researcher‘s own findings, it should not be accepted at face value (Saunders,
2003). The reason is that such data may be erroneous in many respects due to
bias, inadequate size of the sample, substitution, errors of definition, arithmetic
errors etc. (Gupta,2005). Keeping this in mind, the researcher ensured that the
secondary data used was suitable for the research. The suitability of data was
judged in the light of the nature and scope of investigation as well as the
requirement of the survey.

132
4.2 SAMPLING
Technique of data collection was sample technique. A sample is defined as the
portion of a population that has been selected for analysis. Rather than
selecting every item in the population, statistical procedures focus on collecting
a small representative group of the larger population. The results of the sample
are then used to estimate characteristics of the entire population (Levine et. al,
2009). There are three main reasons for selecting a sample:
a) Selecting a sample is less time consuming than selecting every item in
the population.
b) Selecting a sample is less costly than selecting every item in the
population.
c) An analysis of a sample is less time cumbersome and more practical
than analysis of the entire population. (Levine et. al, 2009).
4.2.1 Sampling Design
Sampling design is a definite plan for obtaining a sample from a given
population. It refers to the technique that the researcher adopts in selecting
items for the sample (Kumar, 2008).
i) Outlining the universe and defining the sample unit: While developing
the sample design the first step undertaken by the researcher was to clearly
outline and identify the set of objects to be studied. In this case it was the
Human Resource professionals or anyone in the organization who is a part
of employee engagement initiatives by the company; the second group that

133
was outlined for the survey was sales / marketing professionals in the city
of Mumbai.
ii) Sample Frame: It is the actual listing of items that make up the population
(Shahjahan, 2005). Frames are data sources such as population lists,
directories, or maps. Samples are drawn from frames. Inaccurate or biased
results can emerge if a frame excludes certain portions of the population.
Using different frames to generate data can lead to opposite conclusions.
In this study the sample frame consists of Human Resource professionals
in Mumbai or for companies having their branches in Mumbai and sales /
marketing professionals working in these organizations.
The researcher took care to ensure that the source list is as representative of the
population as possible. Here the source list was prepared by the researcher
which was comprehensive, reliable and appropriate. For this purpose, the
sample frame was devised after going through the various lists of organizations
operating in Mumbai region. The researcher also ensured that the organizations
were involved in employee engagement initiatives as was the requirement of
the study.
In terms of sales / marketing professionals, the researcher attempted to study
their employee engagement as mediated by personal and organizational
variables. Care was taken to ensure that responses received only from
professionals operating in Mumbai and Navi Mumbai region were included.
134
It was essential to arrive at an appropriate sampling frame which helped in
avoiding systematic bias (Kumar, 2008). The researcher carried out a careful
investigation of the frame to be adopted since the defects are not apparent until
a detailed investigation has been made.
Kish (1965) (as cited by Kumar, 2008) posited four basic problems of sampling
frames:
Missing elements: Some members of the population are not included in
the frame.
Foreign elements: The non-members of the population are included in the
frame.
Above mentioned errors were avoided as the researcher extensively
reviewed and verified the list of organizations operating in Mumbai
region. The problem of foreign elements was taken care of as only those
organizations operating in Mumbai and involved in employee engagement
initiatives were surveyed. Organizations which did not have employee
engagement initiatives and were not located in Mumbai were excluded
from the study.
Duplicate entries: A member of the population is surveyed more than
once. Researcher avoided surveying any member of the population twice
and also verified the entries to avoid duplication.

135
Groups or clusters: The frame lists clusters instead of individuals.
Although employees from the same organization were surveyed, they in
any way did not form any cluster or group.
iii) Sample Size:
A study that is insufficiently precise or lacks the power to reject a false null
hypothesis is a waste of time and money. In contrast a study that collects too
much data is also wasteful. Therefore, before collecting data, it is essential to
determine the sample size requirements of a study. According to Kumar
(2008), sample size is one which fulfills the requirements of efficiency,
representativeness, reliability and flexibility for the research work. Care was
taken that the sample of organizations and sales / marketing professionals truly
and adequately represented the universe / population. The researcher
interviewed 500 sales / marketing professionals and 114 human resource
professionals as they represented the organization as a unit of study in the city
of Mumbai. The size of the sample was considered to be optimum because it
fulfilled the requirements of representativeness and reliability as will be
discussed further in the chapter.
4.3 PROBABILITY SAMPLING METHODS
The principles of probability help bridge the worlds of descriptive statistics and
inferential statistics. Probability is the numeric value representing the chance,
likelihood or possibility that a particular event will occur. Probability sampling
136
is the preferred sampling method as items selected are based on known
probabilities. Unbiased inferences are possible based on probability samples.
Since it is difficult and often impossible to take probability samples in practice,
it is always advised that one work towards achieving it and acknowledge any
bias that might exist. (Levine et.al, 2009) The type of probability sampling
method used for the study is random sampling and stratified random sampling.
4.3.1 Random Sampling
This technique is the most preferred technique of data collection as every item
from the frame has the same chance of selection as every other sample of the
same size (Levine et.al, 2009). To ensure balanced representativeness of sales
/ marketing professionals, this method was used. According to Gupta (2005),
personal bias of the researcher does not influence the selection of individuals
thus eliminating bias due to personal judgment.
4.3.2 Stratified Sampling
In order to answer research questions pertaining to employee engagement
strategies and its effect on attrition, organizations were chosen as the unit of
study. Stratified sampling method was used. In this method of sampling, the
population embraces a number of distinct categories; the frame can be
organized by these categories into separate ―strata‖ (Gupta, 2005). This method
could be used because of the possibility to partition the population into smaller
137
sub groups. Creating strata helped the researcher in forming homogeneous sub
groups of the population based on the particular characteristic of interest.
A strata is defined by some common characteristic (Levine et. al, 2009) and the
units within each stratum are as homogeneous as possible (Shahjahan, 2005).
In this case based on the requirement, the researcher created strata based on
industry type i.e. manufacturing and services and number of employees in the
organization (i.e. 51-100, 101 – 500, 501 – 1000, more than 1000). Although
industry type could be a wide range, in order to avoid confusion and arrive at a
broad understanding of distinctive strategies used, the broad classification
based on manufacturing and service industry was used. Classification for
number of employees reflected the size of the organization and also the varied
challenges that organizations would face to deal with their employees.
Stratified sampling is considered to be appropriate for this study because it
reduces sampling error and also ensures that variability within strata is
minimum while variability between strata is maximum, thus balancing the bias
of deliberate selection (Gupta, 2005). It also reduced the possibility of
exclusion of any group as the population is first divided into various strata and
then the sample is drawn from each stratum, thus ensuring representation of
items across entire population. Further, homogeneity of items within each
stratum provided greater precision in the estimates of underlying population
parameters (Levine et. al, 2009).

138
4.4 SAMPLE JUSTIFICATION
Mumbai is the most important economic and commercial center. It has been
reported as the power center of business in India. The businesses existing in
Mumbai and Navi Mumbai region are diversified in terms of industry and size
of the organization based on the number of employees which best suited the
purpose of this research. Considering the receptivity and cooperation from
participants in Mumbai and Navi Mumbai as compared to other cities, survey
for the study was conducted in this region.
Larger samples are better than smaller samples (all other things being equal)
because larger samples tend to minimize the probability of errors, maximizing
the accuracy of population estimates, and increase the generalizability of the
results. Comfrey and Lee (1992) suggest that sample size of: 50 – very poor;
100 – poor; 200 – fair; 300 – good; 500 – very good; 1000 or more – excellent.
They urge researchers to obtain sample sizes of 500 or more observations
whenever possible.
Krejcie & Morgan (1970) suggested a table for easy referencing of sample size
determination. This was based on the formula provided by National Education
Association. The formula is given below:
Where s = required sample size
= the table value of chi-square for 1 degree of freedom at the desired
139
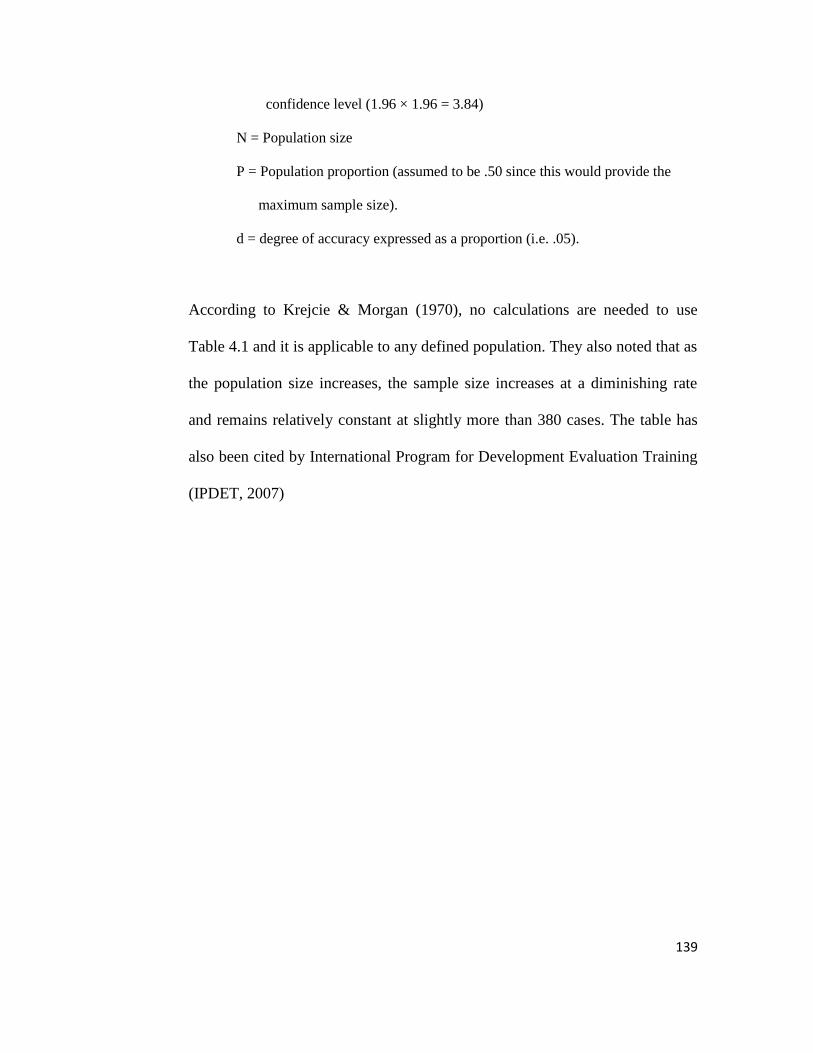
confidence level (1.96 × 1.96 = 3.84)
N = Population size
P = Population proportion (assumed to be .50 since this would provide the
maximum sample size).
d = degree of accuracy expressed as a proportion (i.e. .05).
According to Krejcie & Morgan (1970), no calculations are needed to use
Table 4.1 and it is applicable to any defined population. They also noted that as
the population size increases, the sample size increases at a diminishing rate
and remains relatively constant at slightly more than 380 cases. The table has
also been cited by International Program for Development Evaluation Training
(IPDET, 2007)
140
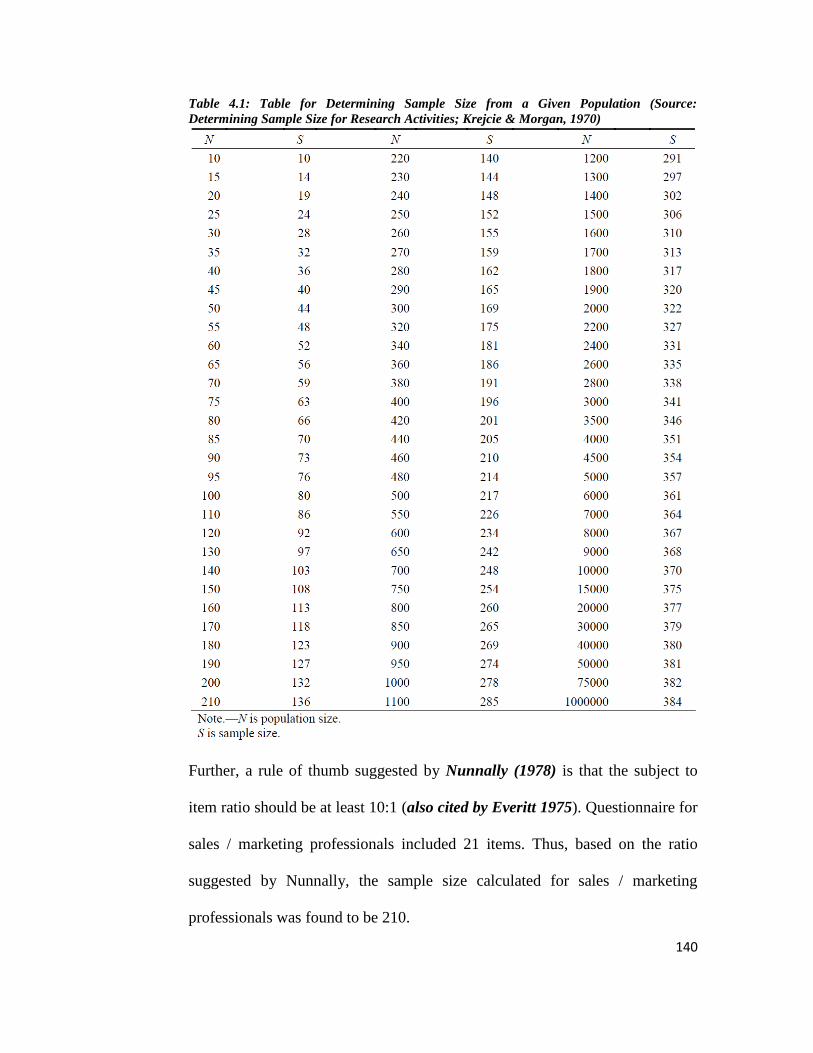
Table 4.1: Table for Determining Sample Size from a Given Population (Source:
Determining Sample Size for Research Activities; Krejcie & Morgan, 1970)
Further, a rule of thumb suggested by Nunnally (1978) is that the subject to
item ratio should be at least 10:1 (also cited by Everitt 1975). Questionnaire for
sales / marketing professionals included 21 items. Thus, based on the ratio
suggested by Nunnally, the sample size calculated for sales / marketing
professionals was found to be 210.

141
Subject Item
10 1
210 21
Based on the above mentioned researches on sample size determination and
consideration of the fact that the population of sales / marketing professionals
in Mumbai region is wide, the sample size for the survey was decided to be
500.
The unit of analysis to understand employee engagement strategies and its
effect on attrition were organizations. Care was taken by the researcher to
ensure that only organizations which implemented employee engagement
practices were surveyed. As the advance of Human Resource activities is not
uniform, the population of organizations for the selection of sample was
limited, thus justifying the sample size of 114 organizations.
4.5 RESPONSE RATE:
Response rate in survey research refers to the number of people who answered
the survey divided by the number of people in the sample. It is usually
expressed in the form of a percentage and is also known as completion rate or
return rate.
Response Rate = Number of individuals who completed the questionnaire X 100
Total number of individuals contacted

142
Response rates are strongly affected by the method of data collection. In
general, the more interaction between the potential respondents and the
researcher, the higher is the response rate. The researcher used multiple
methods of data collection i.e. face to face interviews, emails, telephonic
interviews for both sales / marketing as well as human resource
professionals. Need was felt to use multiple methods considering the
convenience of respondents. Many respondents preferred an initial interview
where the researcher briefed them about the purpose of the research and
ensured them of the confidentiality of responses. This was followed by the
respondent sending the completely filled questionnaire via email or through a
telephonic interview. This was true in case of respondents from both sales /
marketing and human resource professionals.
The researcher approached 160 Human Resource professionals (to study
employee engagement strategies implemented by organizations) out of which
125 responded by filling the questionnaire. Responses from 11 HR executives
had to be discarded as the questionnaire was not duly completed. Thus,
response rate for the questionnaire for HR executives was 71.25 %.
Response Rate = 114 X 100 = 71.25%
160
143
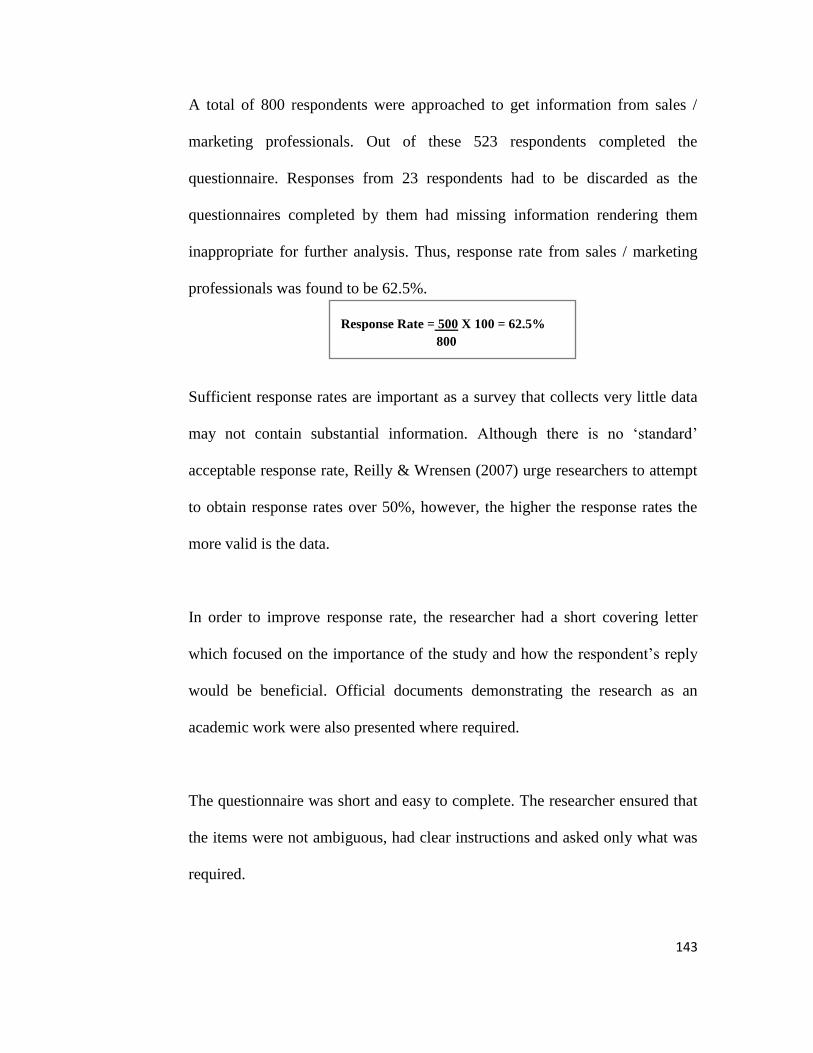
A total of 800 respondents were approached to get information from sales /
marketing professionals. Out of these 523 respondents completed the
questionnaire. Responses from 23 respondents had to be discarded as the
questionnaires completed by them had missing information rendering them
inappropriate for further analysis. Thus, response rate from sales / marketing
professionals was found to be 62.5%.
Response Rate = 500 X 100 = 62.5%
800
Sufficient response rates are important as a survey that collects very little data
may not contain substantial information. Although there is no ‗standard‘
acceptable response rate, Reilly & Wrensen (2007) urge researchers to attempt
to obtain response rates over 50%, however, the higher the response rates the
more valid is the data.
In order to improve response rate, the researcher had a short covering letter
which focused on the importance of the study and how the respondent‘s reply
would be beneficial. Official documents demonstrating the research as an
academic work were also presented where required.
The questionnaire was short and easy to complete. The researcher ensured that
the items were not ambiguous, had clear instructions and asked only what was
required.
144
4.6 QUESTIONNAIRE DESCRIPTION
The research involved using questionnaires which enabled in getting relevant
information to test the hypothesis under consideration. The role of
questionnaire is to provide the researcher with standardized information from
all respondents. It is important in any survey of more than just a few people
that all respondents are asked the same questions in exactly the same way. It is
an important element in the success of data collection and facilitates data
processing (Hague, 1993). The survey through questionnaire was administered
using face-to – face interviews, emails and telephonic interviews.
4.6.1 Theoretical Background
The researcher reviewed a number of existing models which have been
discussed in literature review (Section 2.1).The questionnaire developed was
based on Robinson‘s (2004) model of the drivers of employee engagement.
Sample questionnaires from the internet also helped in framing the statements
used in the questionnaire.
The statements framed in the questionnaire were related to the following
factors: Company Perception, Information / Communication, Working
Conditions, Compensation & Benefits, Job Assignment, Development
Opportunities and Work – Life Balance. Need was felt to develop a
questionnaire as the researcher wanted to include work-life balance as one of

145
the factors and explore whether it positively contributes to employee
engagement.
4.6.2 Questionnaire Description & Reliability Tests (Sales/Marketing)
The questionnaire developed for sales / marketing professionals had 21
statements (Three statements were framed related to each of the factors
mentioned above to measure participant responses) which were to be rated on a
five point scale ranging from 1 – strongly disagree to 5 – strongly agree. A
five-point rating scale typically gives sufficient discrimination and is easily
understood by survey participants. This is usually recommended for most
survey settings (Brace, 2004). Some statements included were negatively
worded so as to remove the effects of response set and rater bias.
The questionnaire was further tested for Cronbach Alpha α reliability with a
sample of 500 sales / marketing respondents. This was done to test the internal
consistency of items used in the questionnaire. SPSS 15 was used to analyze
the data. Cronbach Alpha α reliability coefficient for the questionnaire was
found to be 0.741 (See table4.2) which is within the acceptable range (George
& Mallery, 2003 and Nunnally & Bernstein, 1994). (Cited by Gliem & Gliem,
2003)
Table 4.2: Cronbach Alpha Reliability for 21 item questionnaire
Cronbach's
Alpha
Cronbach's Alpha Based
on Standardized Items N of Items
.731 .741 21
146
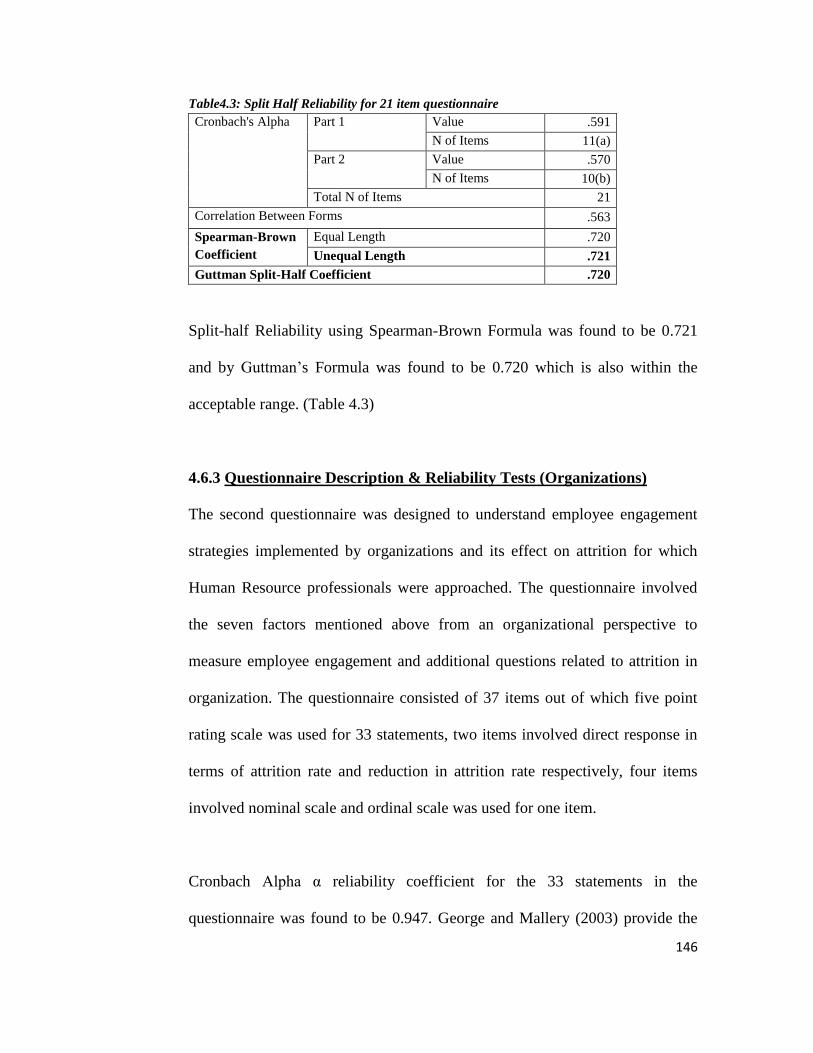
Table4.3: Split Half Reliability for 21 item questionnaire
Cronbach's Alpha Part 1 Value .591
N of Items 11(a)
Part 2 Value .570
N of Items 10(b)
Total N of Items 21
Correlation Between Forms .563
Spearman-Brown
Coefficient
Equal Length .720
Unequal Length .721
Guttman Split-Half Coefficient .720
Split-half Reliability using Spearman-Brown Formula was found to be 0.721
and by Guttman‘s Formula was found to be 0.720 which is also within the
acceptable range. (Table 4.3)
4.6.3 Questionnaire Description & Reliability Tests (Organizations)
The second questionnaire was designed to understand employee engagement
strategies implemented by organizations and its effect on attrition for which
Human Resource professionals were approached. The questionnaire involved
the seven factors mentioned above from an organizational perspective to
measure employee engagement and additional questions related to attrition in
organization. The questionnaire consisted of 37 items out of which five point
rating scale was used for 33 statements, two items involved direct response in
terms of attrition rate and reduction in attrition rate respectively, four items
involved nominal scale and ordinal scale was used for one item.
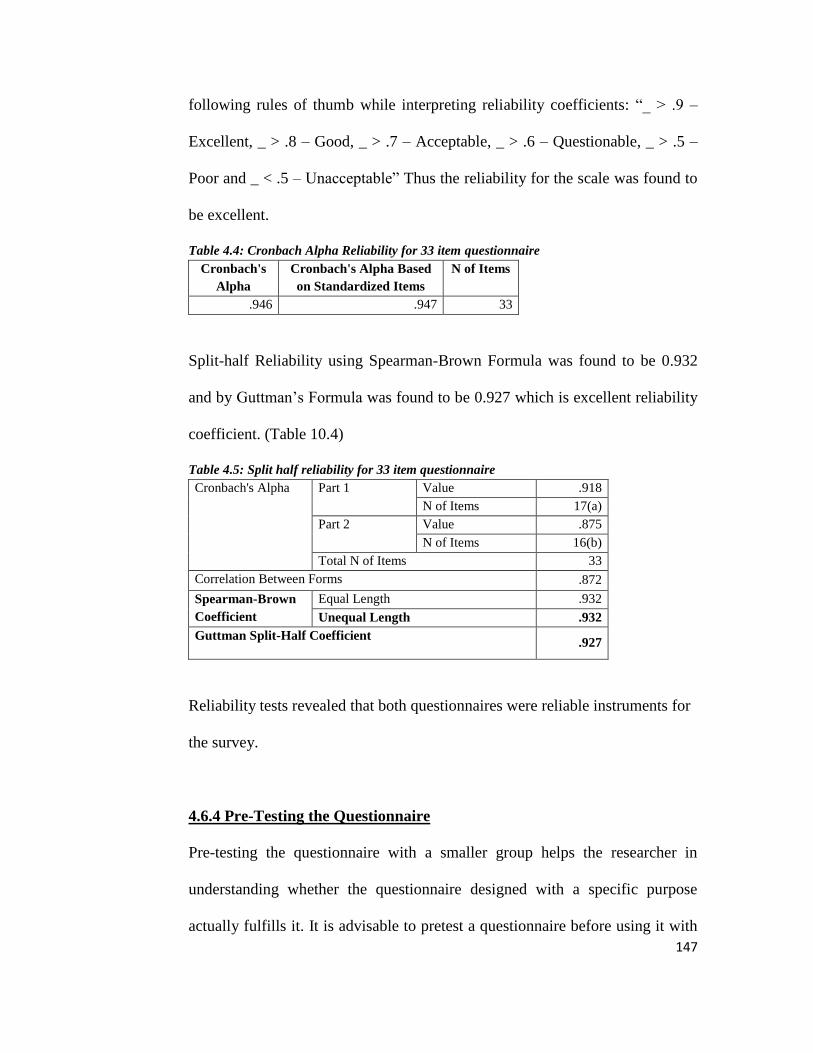
Cronbach Alpha α reliability coefficient for the 33 statements in the
questionnaire was found to be 0.947. George and Mallery (2003) provide the
147
following rules of thumb while interpreting reliability coefficients: ―_ > .9 –
Excellent, _ > .8 – Good, _ > .7 – Acceptable, _ > .6 – Questionable, _ > .5 –
Poor and _ < .5 – Unacceptable‖ Thus the reliability for the scale was found to
be excellent.
Table 4.4: Cronbach Alpha Reliability for 33 item questionnaire
Cronbach's
Alpha
Cronbach's Alpha Based
on Standardized Items
N of Items
.946 .947 33
Split-half Reliability using Spearman-Brown Formula was found to be 0.932
and by Guttman‘s Formula was found to be 0.927 which is excellent reliability
coefficient. (Table 10.4)
Table 4.5: Split half reliability for 33 item questionnaire
Cronbach's Alpha Part 1 Value .918
N of Items 17(a)
Part 2 Value .875
N of Items 16(b)
Total N of Items 33
Correlation Between Forms .872
Spearman-Brown
Coefficient
Equal Length .932
Unequal Length .932
Guttman Split-Half Coefficient .927
Reliability tests revealed that both questionnaires were reliable instruments for
the survey.
4.6.4 Pre-Testing the Questionnaire
Pre-testing the questionnaire with a smaller group helps the researcher in
understanding whether the questionnaire designed with a specific purpose
actually fulfills it. It is advisable to pretest a questionnaire before using it with
148
a larger sample. The advantage of pre-testing is that the shortcomings of the
questionnaire are avoided (Saunders et.al, 2003). Pretesting allowed the
researcher to test the acceptability of the questionnaire to the target sample.
The acceptability of the survey in terms of the length of the questionnaire or
the time commitment required by the respondents was also tested.
The researcher got an idea about the extent of non – response that was likely to
take place. Based on the response rate expected, the researcher prepared for
data collection with a larger sample.
Comprehension of items, respondent interest and fatigue due to length of
questionnaire was also assessed. It was found that some respondents were
uneasy answering some statements as they enquired about their attitudes
towards organizational practices. This was taken care of by ensuring
confidentiality by the researcher. In cases where the respondent was
uncomfortable even after reassurance were excluded from the study. There was
no major difficulty in comprehension of items.
The researcher felt the need to create categories (i.e. senior managerial level,
middle managerial level and lower managerial level) for designation of
respondents in sales / marketing questionnaire. This was done to enable coding
and further analysis for the particular item. In the questionnaire for HR
professionals need was felt to include the category of number of employees in

149
organization and size of the organization which would help in analyzing the
research objective in greater detail.
Further Cronbach Alpha reliability of pretesting was also found to be within
acceptable limits.
4.7 RELATING THE QUESTIONNAIRE TO RESEARCH
OBJECTIVES
The questionnaire was designed keeping in mind the theoretical background of
employee engagement and the aspects that were of interest to the researcher for
the purpose of the study. Care was taken to include items which would help the
researcher in getting relevant information in answering the research objectives
at the same time giving minimal scope for error to occur at data collection as
well as analysis stage.
4.8 OVERCOMING ERRORS:
Drop out is a function of length of questionnaire, as respondents become bored
and fatigued. To overcome the danger of respondents continuing reluctantly till
end providing potentially unreliable data, the researcher stuck to relevant
questions and kept the length of the questionnaire in mind.
The researcher took care that the inclusion of data from human resources and
sales /marketing professionals was from within the population only thereby
150
reducing the fear of over coverage; it was also ensured that the sampling frame
included all the relevant elements of the population thus overcoming the
problem of under coverage.
To deal with the problem of non – response error in terms of the refusal of the
respondent to answer a particular item or multiple items in the questionnaire,
the researcher ensured that questionnaires where a number of responses were
left blank were not included in the final analysis of data set. Care was also
taken by the researcher to ensure whenever possible that the respondents don‘t
leave items unanswered.
Sampling error reflects the variation or ―chance differences‖, from sample to
sample based on the probability of particular individuals or items being
selected in particular samples (Levine et. al, 2009). The researcher ensured
adequate representation of the population by taking a large sample. How the
researcher arrived at the sample size surveyed has been discussed in the section
on sample justification.
In order to overcome the issue of measurement error, the researcher ensured
that the questionnaire items were related to the research objectives and also
clarified the items to the respondents whenever necessary. Further, data entry
was verified and rechecked in order to reduce processing error.

151
4.9 TIME PERIOD OF STUDY
The researcher designed the questionnaire for sales / marketing respondents
and pre-tested it in 2009. In 2010, questionnaire for Human Resource
professionals was designed. Researcher completed data collection by October
2011. Recent researches that were relevant for the study were included in
literature review.
4.10 STATISTICAL ANALYSIS TECHNIQUES
Statistical Analysis refers to a wide range of techniques to describe, explore,
understand, prove and predict based on sample datasets collected from
populations, using some sampling strategy. To test the general trend and
distribution of the sample surveyed descriptive statistics was used. Inferential
statistical tools such as t – test, analysis of variance, correlation, regression and
multiple regression were used to test the various hypotheses formulated by the
researcher and to enhance understanding of the topic.
4.10.1 Correlation
The coefficient of correlation measures the relative strength of a linear
relationship between two numeric variables (Levine et. al, 2009). The values
range from -1 for a perfect negative relation to + 1 for a perfect positive
relationship with 0 representing a lack of association or relationship. It is
important to remember that correlation analysis deals with the association
between two or more variables (Gupta, 2005) and cannot prove a causation
152
effect. Additional analysis is required to establish cause – and – effect
relationship.
Correlation was used for statistical analysis as the researcher wanted to know
whether a negative relationship existed between employee engagement
practices and attrition rate in organization. In case of sales / marketing
professionals, the researcher wanted to know whether any association existed
between employee engagement scores and work experience within
organization.
Pearson‘s product moment correlation coefficient method was used by the
researcher in both cases. This method was selected as the variables to be tested
were measured using an interval scale.
4.10.2 Regression
Once the correlation is established, regression output is obtained to determine
statistically significant causal relationships between independent and
dependent variables. It enables the researcher in developing a model to predict
the values of a numerical variable, based on the value of other variables. Here
the value of r2 which is the value of coefficient of determination determines the
explainable part of the dependent variable by variation in the independent
variable. Any value was accepted as statistically significant only if it has a
minimum significance of .05 or 95% confidence level.

153
According to Levine et. al. (2009) regression analysis attempts to establish the
nature of relationship (causal etc.) between variables – that is, to study the
functional relationship between the variables and thereby provide a mechanism
for prediction, or forecasting. The researcher used regression output to
formulate a predictive model using the value of independent variable of
employee engagement to predict the value of dependent variable i.e. attrition
rate in organization.
4.10.3 Independent Samples t – test
This is probably the most widely used statistical test of all time, and certainly
the most widely known. It is simple, straightforward, easy to use, and adaptable
to a broad range of situations. It is a statistical tool used by researchers to
determine whether the means of the two groups of samples are significantly
different.
The researcher used the t test to identify whether employee engagement
strategies differed significantly across manufacturing and services industry and
to determine whether employee engagement scores of sales / marketing
professionals who are a part of mentoring relationship is significantly different.
Independent samples t-test was chosen as the population from which the
sample was chosen in both cases was different for each sample group.
154
4.10.4 One Way Analysis of Variance (ANOVA)
Many instances require researchers to examine differences among more than
two groups. One way ANOVA is an extension of t test for the difference
between two means. ANOVA is used to simultaneously compare the difference
between the means of more than two groups. By analyzing the variation among
and within the groups, conclusions can be made about the possible differences
in group means.
In the study, one way ANOVA was used to study whether employee
engagement strategies differ with number of employees in organizations (the
categories were organizations having employees 51-100 / 101 – 500 / 501-1000
/ more than 1000). The researcher also used this tool to find whether employee
engagement differs significantly across designation of employees (i.e. higher
managerial / middle managerial / lower managerial).
4.10.5 Multiple Regression Analysis
While simple linear regression uses one numeric independent variable (X) to
predict the value of a numeric dependent variable (Y), better predictions can be
made using more than one numeric independent variable. Multiple regression
models use two or more than two independent variables to predict the value of
a dependent variable. The strength of association in multiple regression is
measured by the square of the multiple correlation coefficient r2
which is also
called the coefficient of multiple determination. r2
is adjusted for the number of
155
independent variables and the sample size to account for diminishing results.
After the first few variables, the additional independent variables do not make
much contribution.
The researcher has used step-wise regression method to the data set of 500
sales / marketing respondents. This was done with a view to understand the
order of importance of the seven factors of engagement. The purpose of
stepwise regression is to select from a large number of predictor variables, a
small subset of variables that account for most of the variation in the dependent
variable.
4.11 ETHICAL CONSIDERATIONS
Ethical considerations involve issues of confidentiality of the respondents,
breach of contract and deception. Researcher ensured that respondents in the
survey knew the nature of survey, its purpose and that the respondents
participated of their own free will. Nowhere during the data collection process
were the respondents forced to answer any item in the questionnaire.
Confidentiality of responses was ensured by the researcher to the respondents
by including a short note in the questionnaire regarding anonymity of
responses. Considering the sensitive nature of the survey, an additional letter
by the guide was presented. This enabled the data collection process. Any
queries arising were clarified by the researcher. This encouraged respondent to

156
give frank and honest responses once they were assured that their identity and
the identity of their organization would be protected. The researcher also
emphasized that any findings of the survey would be made available in the
form of aggregate results, thus making it impossible to identify replies of any
individual or firm. In addition to this, the researcher also outlined to what use
the findings will be put to.
The researcher tried to give an honest indication of the time commitment
involved as this is an important concern of individuals deciding whether to
participate or not.


