Page 1
72
CHAPTER NO. III
INTRODUCTORY ASPECTS OF TECHNICAL EFFICIENCIES
3.1 Introduction :
This Chapter is concerned with Technical Parameter for eg. Duration of
season, Crushing capacity and its utilization, Lost hours %, Cane quality, Pol % Cane,
Fiber % Cane, Brix of primary juice, Purity, Sugar recovery, Milling performance,
Boiling house efficiency, RBHR, molasses purity etc.
The management of the sugar factory bears the responsibility of efficient
working of his factory in all aspects. One such aspects is processing of sugarcane for
the manufacture of sugar. Commercial visibility of a sugar factory depends upon
crushing a certain quantity of sugarcane in the season and producing a certain quantity
of sugar and this sugar must be produced at the minimum cost. The cost of production
depends upon various factors such as the cost of raw material, manufacturing cost and
overheads.
3.2 Outline of the process of sugar Manufacture :
1) The sugarcane is crushed in a which calls Mill Tandem whereby we get juice
and bagasse.
2) The bagasse goes to the boilers and is used as the fuel for the boilers for
generation of steam. Extra bagasse is sold or used for by product industries or
power generation.
3) The juice is chemically treated with a view to purifying or clarifying it. The
juice contains sugar as well as some dissolved salts and some suspended
matter. The purpose of purification or clarification is to remove the salts called
"Non-sugar" as much possible so as to facilitate crystallisation of sugar as well
as to reduce the colour present in the cane juice as this colour, if not removed,
affects, the whiteness of the sugar produced.
4) The clarified juice is evaporated by the application of heat to obtain thicker
juice called "Syrup".
5) The syrup is bleached in order to obtain white sugar.
6) The treated syrup is further concentrated under vacum to the extent that the
crystallization of sugar takes place.
Page 2
73
7) From the crystallized mass, crystals of sugar are separated. The remaining
portion of the mass called "Molasses" is also separated.
8) The separated crystals are washed, dried graded and bagged as commercial
sugar.
9) The molasses is reboiled to effect further crystallization of sugar which is
again taken out. In reboiling molasses, a stage is reached when further
crystallization of sugar is not longer practically and economically feasible and
such molasses is called "Find Molasses" or "Waste Molasses" and is
discharged. However, it still contains some sugar.
3.3 The Efficiency Indicators :
The sugar industry is known, a very closely controlled industry and the
variables effecting its performance both technical and commercial are too many.
Following are the efficiency indicators at control points with target or norms figures
indicated against each.
1) Cane Quality :
The quality of cane is of paramount importance in getting higher sugar
recovery. It also affects the productivity and efficiency of a sugar factory. The quality
of cane is dependent on values of (i) Pol % cane (ii) Fibre % cane (iii) Brix % primary
juice and (iv) primary juice purity.
2) Crushing Capacity and its utilization :
The crushing capacity utilization is the most important factor in reducing the
production cost. Optimum crushing capacity utilization results in reducing the use of
oil lubricants and process chemicals like lime, Sulphur, Phosphoric acid, etc. Further
with uniform and continuous operation, the higher capacity utilization can be
achieved which ultimately results in reducing sugar losses, consumption of bagasse
and steam.
3) Time Efficiency :
The basis in the present system of time accounting is the physical running of
the mill and therefore this system suffers with a serious drawback in assessment of
time utilization efficiency in relation to the throughput or the loss thereof particularly
when the mills do not stop but are worked on low crush and vice versa. In this
background may be we now consider introducing the system of computing Time Loss
Page 3
74
from the tonnage loss. This issue needs consideration. However, even in the
conventional as below.
Time Loss percent Available Time
a) Including general cleaning Max. 10 percent.
b) Excluding general cleaning Max. 4.5 percent.
4) Energy :
Electrical energy is an important input in the cost of conversion with incidence
that can be estimated to be an equivalent of Rs. 15 to Rs. 30 per bag. In the system of
accounting this is not even accounted for, for the reasons that power is generated by
the mills as by product. It must be realised that savings in power consumed will in one
way or other contribute to economy in conversion cost. There is need to visualise a
normal / target consumption of power in unit production of sugar.
1) Electrical Energy Norm - 18 KWH per QL of sugar.
5) Steam and Fuel :
In present system of control the steam and fuel consumed are expressed on
percent cane basis. This does not give a direct idea of the cost incidence thereof in
cost of unit sugar. Going by the consumption of steam and fuel by average factory and
rating bagasse at about Rs. 250.00 per ton, the incidence of fuel alone in the cost of
sugar works out to be of the order of Rs. 75.00 Pr.QL. This does surely call for our
attention to economies the same. Other relevant view here is the potential Value
added use of saved bagasse1. A target and norm of steam consumption will in this
light be very useful and following is suggested. Norm steam consumption per QL of
sugar 0.5 tons.
6) Man Power Productivity :
There are no relationships between wages and productivity. As the manpower
cost place quite a significant role in the cost of conversion and as these costs continue
to rise with periodical wage rises and other related costs to the industry, there is
serious need to consider introduction of some norms of productivity which could be
expressed in terms of Mandays per unit of sugar produced.
Way back the Gundu Rao committee had analyzed the productivity in the
Indian sugar Industry and a comparison there of with the same of several other sugar
producing countries of the world to find that productivity in Indian Industry was at the
order of 10.5 Mandays per ton of sugar as compared to 0.58 Hawaii, 0.98 of
Louisiana and 2.10 of Philippines and 3.3 of Venezuela1. Several countries have
Page 4
75
introduced programmes of increasing productivity and reducing labour input costs per
unit of sugar produced and norm of manpower is following.
Productivity - Mandays / Ton Sugar
7) Water :
Use of water in the process of sugar manufacturer has multidirectional
incidences on cost, Viz.
a) Direct cost of water.
b) Importation of Scale / Molasses forming salts.
c) Consumption of heat and steam.
d) Generation of effluent.
Presently water consumption per unit sugar is not forming a part of the
reporting system.
Conventions seem to have run deep to accept that a normal size sugar mill
does need about 50,000 gph of ground or natural water and on the other side it must
produce nearly similar quantity of effluent. Both of these practices would appear to be
wrong if one pauses to reflect over following two facts.
a) Sugar cane carriers its own fuel and water.
b) The process of manufacture of sugar from cane by DS process does not
produce effluent at any stage.
In view of the above it would appear that the water consumed and liquid
effluent generated/ discharged by a Mill will tend to indicate the inefficiency of the
plant management or inadequacy of technology or systems design. In view of this,
Author Mangalsingh suggest following norms relating to this item :
Water consumed per ton of sugar 3 M3.
8) Liquid Effluent :
This would indicate that fixation of tolerance limit for discharge at level of 30
would only be a target or norm unachievable and thus both the quantity and tolerance
need to be reviewed.
Suggestion
Effluent norm _ _ _ _ _ _ _ per ton sugar _ _ _ _ _ _ _ 2-3 M3.
Tolerance _ _ _ _ _ _ _ BOD 50 PPM.
9) Air pollution (Boiler Flues)
In present standards the tolerance limit of solids ejected is fixed at 300
Mg/NM3. But this is not based on any techno-economic study and cost incidence
Page 5
76
under conditions of Indian Sugar Industry and the investment preference that
following suggestion.
Tolerance limit _ _ _ _ _ _ _ 500 Mg/NM3.
Temperature _ _ _ _ _ _ _ 175ºC
10) Factory Milling Station.
Following efficiency indicators with suggested norms/targets in bracket should
be adopted for efficient control of Milling operations.
a) Preparation Index (85)
b) Primary Extraction (85)
c) Mill Extraction (70)
d) R.M.E. _ _ _ _ _ _ _ (96)
e) Pol percent Bagasse (2)
f) Moisture percent Bagasse (49)
g) J.R. _ _ _ _ _ _ _ (75)
h) Imbibition Efficiency (65)
i) P.J. Lost/ Fiber (40)
j) Imbibition percent fiber option (180)
11) Boilers
Under the equipment specifications the performance of boilers is supposed to
be indicated by achievement of rated through put at contracted thermal efficiency of
67.5 percent (+2 percent) Due to problems of fuel weighment the efficiency tests are
proven only in very few cases and bagasse is considered to be cumbersome and
expensive.
It is with this view following operational norms are suggested1.
(All at M.C.R.)
a) Thermal efficience _ _ _ _ _ _ _ _ _ 67
b) Excess air _ _ _ _ _ _ _ _ _ _ _ _ 40
c) Feed temperature _ _ _ _ _ _ _ _ _ _ _ _ 105ºC
d) CO2_ _ _ _ _ _ _ _ _ _ _ _ 15
e) Flues _ _ _ _ _ _ _ _ _ _ _ _ _ _ 175ºC
12) Power House :-
P.F. _ _ _ _ _ _ _ _ _ 0.9
Specific steam consumption _ _ _ _ _ _ _ _ _ _ _ 9 kg/kw/Hr.
Page 6
77
13) Boiling House
i) Clarification efficiency _ _ _ _ (5)
ii) Pol percent Cake _ _ _ _ _ (1.0)
iii) Moist percent Cake _ _ _ _ _ (70)
iv) Syrup Brix _ _ _ _ _ _ (65)
v) Massesuite Production _ _ _ A _ _ _ _ _ _ _ 2.2 times recovery
B _ _ _ _ _ _ equal to recovery
C _ _ _ _ 2.0 times molasses reduced to 90°C B.
vi) Pan exhoustion _ _ _ _ _ A _ _ _ _ 15
B _ _ _ _ _ _ _ _ 20
C _ _ _ _ _ 25
vii) Final Molasses _ _ _ _ _ _ Bx _ _ _ _ 95
viii) B.H.R. _ _ _ _ _ _ _ _ _ 88
ix) R.B.H.R. _ _ _ _ _ _ _ _ 93
14) Pol Balance :
The present system is based on percent cane which needs to be shifted to
percent basis on sugar in cane. Following are indicative norms.
Pol lost in bagasse ( percent sugar in cane) _ _ _ _ _ (5)
Pol lost P. Mud _ _ _ _ _ _ _ (0.4)
Pol lost Molasses _ _ _ _ _ _ _ (8.5)
Pol lost Unknown _ _ _ _ _ _ _ (1.0)
Pol lost Total _ _ _ _ _ _ _ _ _ (15)
15) Reduced overall Extraction ; (85)
16) Sugar Quality
As per ISI and Government notification 15-1086-SPY D. II of 8-6-1987.
17) Consummables
Under present system of control and reporting, all consummables are
expressed in terms of percent cane which does not bear a direct relationship to the
conversion cost per unit of sugar. This system needs to be changed to an expression of
all these in relation to unit sugar, i.e. per QL of sugar. Following norms are indicative:
Lime
Sulphur
Lubricants
Soda Ash
Caustic Soda
Biocides
Coal
Firewood
Fuel Oil
Boiler Feed Water chemicals.
Page 7
78
18) Lime :
CaO _ _ _ _ _ _ _ 85
Milk of Lime _ _ _ _ _ _ _ 8ºBe
Grit and Sand _ _ _ _ _ _ _ _ 1.0 percent Max.
19) So2 Gas
Temperature Maximum _ _ _ _ _ _ 52º.
Gas percent Minimum _ _ _ _ _ _ _ 10 percent.
So2 in stack _ _ _ _ _ _ _ 0.5 percent.
20) Field Productivity
Yield ton/ha/yr.
Sugar ton/ha/yr.
3.4 Norms and Incentives
The Government of India have determined the norms for fulfillment of the
national objective of augmenting Sugar Production and cost reduction through
possible economics in processing and improvement in the operating technical
efficiencies. Further, in order to enforce the same, the achievement of norms has been
made obligatory and a precondition to the entitlement of full incentives allowed by
way of higher percentage of free sale sugar quota under the dual pricing system in
vogue and concessional rates of excise duty for the factories undertaking licensed
expansion of capacity and the new factories to be established. Ref. Government of
India, Directorate of sugar, No. F3(7)/88-pc of 31-01-90 and No. F3-4-89/pc of 19-2-
90.
Table No. : 3.1
Efficiency Levels to be Achieved for Entitlement to Full Incentives.
Sr.
No. Item
Expansion
Projects
New
Factories
1) Reduced Mill Extraction (RME) (Minimum) 94 % 95 %
2) Reduced Boiling House Recovery (RBHR)
(Minimum)
90 % 90 %
3) Total Sugar Loss % cane (Maximum) 2.2 % 2.0 %
4) Steam % Cane (Maximum) 35 % 50 %
5) Down Time
a) Including general cleaning (Maximum)
b) Excluding general cleaning
10 % 10 %
Sources :- Indian sugar year Book 2010.
Page 8
79
Table No. : 3.2
Quantum of Reduction in Incentive for Failure to Achieve Efficiency Norms.
Sr.
No. Item
Expansion Project New Factory
Level of
Achievement
(%)
Scale of
Reduction
(%) in
percentage
of Free
Sale Quota
Level of
Achievement
(%)
Scale of
Reduction
(%) in
percentage
of Free
Sale Quota
1.
Reduced Mill
Extraction
Below 92
92 � above
but below 94
1
0.5
Below 93
93 � above
but below 95
1
0.5
2.
Reduced Boiling
House Recovery
Below 88
88 � above
but below go
1
0.5
Below 88
88 � above
but below 90
1
0.5
3.
Total Sugar Loss 2.5 � above
Above 2.2
but below 2.5
1
0.5
2.3 above
Above 2 but
below 2.3
1
0.5
4.
Steam percent
cane
Above 57
above 55 but
below 57
1
0.5
Above 53
Above 50 but
below 53
1
0.5
5.
Down time
including general
cleaning
More than 15
Above 10 but
below 15
1
0.5
More than 15
Above 10 but
below 15
1
0.5
Source :- Indian Sugar year Book - 2010.
Efficiency does always have its reward however the obligations as above have
quantified the savings and gains that the factories can realise and it is hoped that the
efficiency improvement programmes will have high priorities with the managements.
3.5 Technical Control - Maximum & Minimum Figure :
It is to fix up the maximum and minimum norms with respect to Brix, pol
temperature, PH etc. at various stages and to make efforts by all the departments to
bring and maintain the aforesaid safe limits by efficiently controlling the operational
parameters.
Page 9
80
By doing so, excessive or inadequate treatment of any stage may be avoided,
For example, the norms for PH of sulphited juice has been fixed as ;
Maximum : 7.1
Minimum : 6.9
So operator have to maintain the PH in the range 6.9 - 7.1. If he maintains this
PH from 6-8, the average value may come to about 7.0 but the harmful effects due to
PH as low as 6.00 and as high as 8.0 cannot be avoided. Similar is the case with other
parameters. BHL, Gola and Palia, we have fixed up certain norms, a typical report of
which is enclosed for reference. The main objective of this exercise of fixing up the
maximum and minimum efficiency norms and to execute the same in practice is to
arrest and minimize the deviations and fluctuations.
To avoid the short - Comings of simple arithmetic average of process
parameters it is advised to calculate to "variance" in place of arithmetic average.
Variance is the square root of arithmetic average of square of variations of
control parameter from prescribed norms. It will give more accurate idea of deviations
from the specified process parameters.
3.6 Basic concepts for sugar Evaluation
There are some basic concepts for sugar evaluation as follows.
i) Brix ii) Pol and iii) Purity
Brix is defined as the percent by weight of solid matter present in a solution.
That is to say if we take 20 grams of sugar and dissolve it in 80 grams of water,
making 100 grams of sugar solution the Brix of the solution would be 20. Again if we
take 20 grams of sugar and 5 grams common salt and 75 grams of water to get a sugar
and salt solution of 100 grams the Brix of this solution would be 25.
In a sugar factory, sugar (sucrose) solutions are almost always associated with
some other substances in dissolved state which we may call "non-sugar".
If we evaporate such a solution to dryness some solid matter will result.
The percentage by weight of this solid matter is denoted by the term "Brix" or
Gravity solids. Brix can be measured in a solution by means of hydrometer which is
called "Brix - Hydrometer" or "Brix Spindle". In a very pure solution of sugar that is a
solution which contains nothing else but sugar, the Brix reading on the hydrometer
will indicate the percentage of sugar itself.
Page 10
81
ii) Pol or polarization
Pol is defined as "the value determined by direct or single polarization of
normal weight solution on in a saccharimeter. This needs a little explanation.
It we taste a substance and find it to be sweet we know that the substance
contains sugar. This is because sweetness is an attribute of sugar. Another attribute of
sugar (sucrose) is that if "Polarised light" is passed through a solution of sucrose the
plane of polurisation is turned towards the right by a certain number of degrees. The
number of degrees by which plane gets rotated is directly proportional to the
percentage of sugar (sucrose) present in the solution. Here it is necessary to clarify the
term sugar itself. Strictly speaking glucose' fructose, lactose, etc. are all called
"Sugars" but what we mean by sugar is sucrose which is recovered in crystal form in a
sugar factory. The term Pol derived from Polarisation therefore denotes for all
practical purposes only sucrose which we normally call sugar.
iii) Purity - The term purity denotes the percentage by weight of sugar (sucrose) in
solid matter (Brix) or
Pol
Brix
Purity is the short term for co-efficient of purity or quotient of purity.
Supposing we buy ghee and find that it is not 100 percent pure. In order to find out
how pure it is or what is its purity we take 100 gms. of it and analyse.
We find it contains 90 gms. of butter fat (ghee) and 20 gms of Dalda. We then
know that the purity of ghee is only 80. Similarly the term purity will indicate in a
sugar factory, the proportion of sucrose present in the total dissolved solids by weight.
If we take fresh cane juice and analyze it (i.e. determine its Pol and Brix) and find that
its purity is 80. We allow the juice to stay over for sometime during which bacterial
action takes place and it ferments, that is bacteria have eaten some part of the sucrose.
We again analyse it. We will find that its purity is not 80, but only 75. A fall in purity
indicates loss of sugar. Conversely, if from the sugar solution some non-sugar is
removed the purity of that solution will increase. This is broadly the significance of
the term "purity".
3.7 Factory Control
Factory control may be divided into two main parts.
a) Mill House control or Milling Control.
b) Boiling House Control.
Purity = --------- X 100
Page 11
82
a) Milling Control
The control of the milling plant is concerned mainly with the determination of
the quantity of juice and sugar extracted from the cane with an eye on the efficiency
of the milling operations. As mentioned earlier, the purpose of crushing sugarcane in
a series of Mills is to extract maximum possible juice present in the sugarcane. In fact,
sugar present in the cane and that extracted in the juice both have to be determined.
The sugar in cane or Pol percent cane may in a simple manner be determined
as follows.
Take a few sticks of cane, cut them into pieces, weight them accurately pass
these pieces of sugarcane through a hand mill, collect the juice expressed out and it.
Collect also the bagasse coming out of the hand Mill and weight it.
Then analyze the juice, i.e. determine its polarization and analyse the bagasse
i.e. determine its polarization,
Then
Pol % cane = Pol in juice % cane + Pol in bagasse % cane
Wt. of juice X 100 Pol % Juice
Wt. of cane 100
Wt. of bagasse X 100 Pol % Juice
Wt. of cane 100
In a sugar factory however, a few sticks of cane will not constitute a
representative sample. Therefore the weight is recorded of the entire cane that is
crushed and the weight is also recorded at the entire juice that is extracted. The
analysis of the juice for sugar content is done from two hourly samples. The bagasse
coming out from the mill is continuously going to the boiler and it is not practically
possible to weight it, A further complication is that we add some water on the milling
train and circulate the dilute juice in order to extract the maximum amount of sugar.
This process is called 'Imbibitions'. In such a situation, the weight of the bagasse has
to be determined indirectly as follows :
It is evident that the weight of cane + the weight of water added for
imbibitions purposes will be equal to the weight of juice extracted plus the weight of
bagasse.
In other words, cane + water = Juice + Bagasse
In a sugar factory, the term "Mixed Juice" is a mixture of primary juice and
secondary juice. Primary juice is the juice that comes out of the first Mill, that is
Pol % juice % cane = -------------------------- X ------------------
Pol in bagasse % cane = ------------------------------ X ------------------
Page 12
83
before the juice gets diluted. Secondary juice is the juice coming out of subsequent
Mills which has been diluted by dilute juice.
The efficiency of sugar extraction by a milling plant is termed "Mill
Extraction" denoted by the symbol 'e'. Mill Extraction is the ratio of sugar extracted in
mixed juice percent cane to sugar percent cane or in other words.
Pol in mixed juice percent cane
Pol percent cane
Mixed juice % cane X Pol % mixed juice
Pol percent cane
The proportion of juice and fibre in sugarcane varies from variety to variety as
also in different period of the season, Mill extraction will also very according to the
variation in the fibre content of cane.
In order to compare the milling efficiency that is the Mill extraction figure of
one factory with that of another having a different fibre content in cane or of the same
factory during different periods of the seasons, it becomes obligatory to reduce the
Mill Extraction to a common fibre basis.
Fibre can be determined (a) directly (b) indirectly. The direct method consists
of shredding the bagasse to a fine state of sub-division, taking a known weight of the
fine stuff into a linen bag and washing it in running water, until the washings are clear
and free from sugar then squeezing water out, drying it and weighting it and fibre
percent cane can be calculated.
But direct method is nor representative it is not used and indirect method is
use in sugar factories for chemical control purposes. This method is as follows.
Bagasse = Fibre + solids in retained juice + water or moisture in bagasse.
If bagasse is 100 and fibre % bagasse = F then F = 100 - moisture % bagasse -
juice solids % bagasse.
Now moisture percent bagasse is determined by drying a known weight of
bagasse is an oven to constant weight. Juice solids percent begasse (by analysis) and
determining the purity of the residual juice. It is assumed that the purity of the
residual juice is the same as the purity of the last expressed juice (L.E.J.) Last
expressed juice (from last Mill) is sampled and analysed for Brix and Pol and Purity is
found out.
Pol % bagasse
Purity LEJ
Mill extraction = ------------------------------------------ X 100
= ----------------------------------------------------- X 100
Solids or Brix in Bagasse = --------------------- X 100
Page 13
84
Apart from Mill Extraction, Juice lost % Fibre and reduiced Mill Extraction
the figures which are required for day to day control purposes are :
i) Pol percent bagasse
ii) Moisture percent bagasse
iii) Difference in the purities of Primary juice and mixed juice.
These figures should be determined and recorded daily. Pol percent bagasse
will indicate how much sugar is being lost in bagasse. If at any time this figure shows
an abnormal value of Pol which depends upon the moisture content of bagasse the
Endeavour always is to reduce the Value of moisture content of bagasse.
Due to extraction of more non-sugar in the secondary juice, the purity of
Mixed juice is always lower than that of the Primary juice for a Particular Mill, under
good conditions of working, the difference between the two purities would be more or
less of the same order from day to day. It at any time the difference is found to be
large, then a loss of sucrose by bacterial action must be suspected.
b) Boiling House Control :
As in the case of Milling control Mill Extraction (e) is the efficiency indicator,
in Boiling House control. Boioling House Extraction is the criteria for judging Boiling
House Efficiency. It is nothing but the sugar recovered percent the sugar present in
the Juice delivered to the Boiling House.
Since in the Boiling House we do not extract anything in the sense of
extracting juice from cane in a mill but we only recover the sugar in crystal form from
that present in the mixed juice. Boiling House Extraction is more appropriately
termed Boiling House Recovery (BHR).
To be accurate it is the sucrose (Pol) recovered in sugar from the sucrose or
Pol present in Juice. For the purpose of determining Boiling House Recovery we must
know the weight of sugar produced and its Pol. We must also know the weight of
mixed juice (MJ) and Pol percent mixed juice1.
The importance of Boiling House Recovery as an efficiency indicator will
therefore be obvious. During periodical shutdown of the factory, While the total cane
crushed in the period is correctly known, the total weight of sugar produced from that
cane is not know. The weight of sugar actually baggad during the period is known but
Page 14
85
there is some sugar still left in the material that is in process. At the time of the shut
down there may be some massecuite in the crystallisers which is yet to be processed.
In such circumstances the recovery percent, cane has to be estimated by calculating
out the sugar that can be recovered from the material in process.
The relationship has been established for calculating the available sugar from
the material in process on the basis of the purity of the original material to be
processed, on the purity of the sugar produced and on the purity of the final Molasses
that is discarded. This relationship is derived as follows :
Let the material to be processed contain J sugar per unit weight of the dry
substance.
Then,
j = (c + d) s + (1 - c - d)m
j = cs + ds + m - cm - dm
j - m = c (s - m) + d (s - m)
= (s - m) (c + d)
or
(c + d) = j - m
s - m
Multiply both sides by s / j then
s (c + d) s (j - m)
j j (s - m)
Now s (c + d) is the sucrose in the product and j is the sucrose in the original
material and s (c + d) is the sucrose recovered in the product per unit weight of
sucrose in the original material which is the "Avoilable Sugar" we want to calculate.
Thus,
s (j - m)
j (s - m)
This is known as the SJM formula.
Just as Mill extraction is dependent on fibre and it has to be reduced to a
common fibre of 12.5 percent, so is boiling House Recovery dependent on initial
Mixed juice purity and it must also be reduced to a common purity if the results of
two factories have to be compared. This common purity has been accepted as 85. So
we shall have to reduce the recorded BHR to Reduced Boiling House Recovery at 85
juice purity i.e. RBHR 85.
------------- = --------------
-------------
Available sugar = --------------
Page 15
86
Apart from the influence of juice purity, the BHR would also be influenced if
sugars produced have different values of polarization. For examples, one factory
produces raw sugar of 98 pol and another factory produces raw sugar of 99.8 Pol and
even if both the factories are handling a mixed juice of the same purity, the Boiling
house Recoveries in the two cases would be different.
In order to eliminate the influence of different polarisation of the sugar
produced, the Late Mr. Noel Derr, a world renowned sugar Technologist, introduced a
concept called "Equivalent Standard Granulated" or "E.S.G.". This ESG is the
quantity of sucrose which could theoretically be obtained from a sugar of purity at an
ideal final molasses purity of 28.57.
a) Reduced Recovery ESG
When a factory is handling juice of higher purity it obtains a higher recovery.
The effect of juice purity on recovery is annalogous to that of fibre on extraction. The
figure reduced recovery has accordingly been established analogous to reduced
extraction Choosing as standard purity the figure of j = 85. This formula for reduced
Boiling House Recovery.
ESG (or RBHR) or more simply rg has been established by Shri. S. N. Gundu Rao.
We may indicate the Reduced Recovery ESG at 85 juice purity calculated according
to Gundu Rao Formula as r 85 GR.
Let r85 GR be the Recovery which we wish to find and the actual Recovery
ESG be denoted as rg. Then the total losses in the boiling house will be Total sugar
losses = 1 - rg
These comprise sugar loss in (a) Molasses and (b) Other losses such as sugar
loss in filter - cake and unknown loss.
According to SJM formula, Ix (j - m)
(in unit terms) sugar recovery j (I - m)
b) Overall Extraction :
Another objective is to judge the performance of the factory as a whole. For
this purpose we find out overall Extraction and Reduced Overall Extraction1
Mill Extraction X Boiling House Recovery
100
for eg.
Overall Extraction (percent) = -------------------------------------------------------
= ----------------
Page 16
87
Mill Extraction (M.E.) = 93.0
Reduced Mill Extraction (RME) = 94.0
Boiling House Recovery (BHR) = 84.0
Reduced Boiling House Recovery (RBHR) = 85.0
93 X 84
100
= 78.12
94 X 85
100
= 79.90
3.8 Cost Reduction sugar Production.
The only way to run a sugar factory without loss is by reduction the cost of
production. Various aspects for reduction of cost of production is as follows.
1) Harvesting :
Harvesting of sugarcane in fields is an arduous task which is carried out by
manual labour in India but in many countries particularly the developed countries like
U.S.A. Australia etc. the entire crop harvesting is a mechanized operations, where in
huge power driven machines execute the job of labour. Harvesting machines which
are quite expensive require careful maintenance and consume fuel oil. Manual
harvesting is preferable to machine harvesting under Indian conditions both from the
point of view of feeding clean cane to factory and energy saving. But recent
unfavourable trends in procurement of labour for harvesting sugar cane despite, good
wages offered in many parts of the country, may render partial mechanization of this
operation essential in regions where labour availability has posed serious problems.
Nevertheless there are limitations to large scale mechanized cane harvesting under
Indian conditions as form sizes are small in most cases and full mechanization calls
for high fuel consumption and high capital investment.
2) Transport :
Cane after harvest has to be speedily transported to the factory year. In the
case of factories which have cane fields within a radius of 20 - 25 km, the time lag,
between harvest and processing can be controlled to 16-18 hrs. In India mode of
transport is determined by the distance of fields from factory. the condition of roads
and the size of farms. The time lag between harvest and supply to factory has to be
Overall Extraction (percent) = ------------
Reduced Overall Extraction (percent) = ------------
Page 17
88
minimum hrs to avoid deterioration of cane which has adverse effect on sugar
recovery. This calls for communication between factory and the fields is very
essential for this purpose.
Processing of fresh cane has vital role in cost reduction. In this context it is
worth nothing that improving the harvest and transport system of cane to ensure
harvest to crush time not exceeding 16 hrs.The Australian sugar Mills have improved
their recovery to 14 %. with land productivity at 11 tones of sugar per Hectare/year.
Recoveries of the order of 16 % have also been recorded. Even in Maharashtra Some
factories have been successful in containing the time elasped below 16 hrs. to book
over 13 % recovery.2
3) Engineering :
As for as the Engineering department concern, cost of production reduction
can be achieved by higher extraction, effective utilization of man and machineries
procurement of quality material and inventory control. The major contribution by
engineering department is the bagasse savings and power export.
A) Higher Extraction :
For higher extraction the following parameters are involved such as,
i) Cane preparation :
Higher extraction depends on good preparation. The preparatory devices such
as kicker, leveller and heavy duty fibrizer will improve the preparatory index. For eg.
the mean Pol % bagasse is 1.3 the good preparation should 0.8 % and poor
preparation should 3 %. This shows inspectacular fashin the effect of preparation on
extraction.3
ii) Roller Grooving
New technique of differential angle grooving of rollers other than same angle
grooving will improve the Mill extraction as in the same angle grooving, juice
drainage will not effective than the differential angle grooving. In differential angle
grooving Mills, after extraction its imbibition is effectively implemented RME will
easily achieved to tune of 95 % for 4 Mill tandem.
Fine grooving rollers gives better extraction.
iii) Specific Pressure
The extraction Mill increase rapidly as the pressure increases 20 to 25 t/dm2.
Length of Tandem if no. of compression increases the extraction will increase. i.e. the
Juice loss in bagasse decreases.3
Page 18
89
iv) Roller Speed
If the same thickness of bagasse blanket is maintained the extraction decreases
as the speed of rotation increases, for which lower speed of rotation will give better
extraction.
v) Specific Fibre Loading :
If the specific fibre loading increase the Milling efficiency will decrease. If a
Mill is capable of crushing 100 TCH and if its reduced extraction in 95. This should
drop 394.83 if the rate in increases to 110 TCH.3
vi) Mill setting :
For optimizing the Mill setting periodical measure of brix curve and setting
accordingly will improve the extraction. A good setting in indispensible for obtaining
good operation of the Mill, that is regular operation without checking with better
extraction.
vii) Imbibitions :
One of the major contribution in achieving the Mill extraction will be
imbibitioin. The compound imbibition system is best system that other system. This
system improves penetration resulting higher extraction.
4) Process :
The cost of production reduction can be achieved by optimization of chemical
dosage, perfect maintenance of PH and temperature effective use of exhaust and
vapour, adopting proper massecuite boiling technique and effective use of
machineries.
A) Optimization of chemical Dosage :
The major chemicals used in sugar industry is lime and Sulphur. Basically the
selection or purchase of chemical is to be in the basis of quality. The specification of
the chemical to be used as follows,
i) Lime :
Active Cao content - min 80 %
Grit max - 2 %.
Density of milk of lime to be equal to density of mixed juice.
ii) Sulphur
Purity - min 98 %.
Grit - max 2 %.
Page 19
90
Other chemical such as phosphoric acid, hydrogen peroxide, antiscalent and
descale chemicals, sanitation chemicals, lab chemicals, Caustic Soda, Hcl for DM
water preparation are to be purchased according to the programme of crushing to
minimise the inventory.
iii) pH and temperature :
The major sugar loss in sugar industry is by inversion and caramalisation,
these two can be avoided to the maximum by strictly maintaining the pH and
temperature of process material in always keeping the juice material under process at
a neutral pH and process temperature below 120°C will minimise the sugar loss.
Beyond this retention time of the juice at various vessels are to be strictly optimised to
avoid sugar loss. pH and temperature maintenance of clear juice in Dorr at the time of
any long duration stoppage will prevent sugar losses. Not below 80°C and 8 pH.
iv) Effective Utilization of Exhaust and Vapour :
The use of exhaust as heating media is to be at minimum points and media is
to be at minimum points and vapour is to be used to the max extent 80 that energy can
be saved which contributes a major gain to the sugar industry. Useage of SK bodies,
vapour lime J. H. or dynamic J. H. can be saved energy.
v) Masseculte Boiling Techniques :
According to the purity of the syrup either three massecuite or three and half
massecuite system is to be adopted. So that the 'C' massecuite purity can be kept
around 50, final molasses purity around 28. Now - a - days a graining of techniques
gives better quality of sugar of ICUMSA value below 50.
vi) Effective use of C/F Machines :
Sugar loss in the process can be minimised by effectively using the
centrifugals. Perfect separation of A light and A heavy in a centrifugals will reduce
the recirculation of molasses and increase the capacity of crushing to about 15 %
perfect adoptation of cycle time in A curing will improve the power savings.
5) By-product :
i) Bagasse :
Saving, timely selling, perfect storing of by-product will contribute more to
the production cost.
Minimizing the steam % cane, bagasse moisture, avoiding steam leakage,
steam traps, avoiding safety lifting, perfect maintenance of best recovery units, perfect
maintenance of boiler steam pressure, running only the required pumps and avoiding
Page 20
91
the usage of stand-by pumps at the time of regular pump running will improve the
bagasse saving.
Maintenance of bagasse yard at minimum area will decrease the bagasse from
spoilage and timely selling of bagasse will reduce the loss of bagasse due to drying,
rain spoilage.
ii) Molasses :
Storing of molasses in steel tanks avoiding earth pits, timely selling of
molasses, controlled temperature maintenance of storage tank will minimize the
molasses loss.
iii) Filter Cake -
Educating the riots to use the press mud as manure timely, dispatching press
mud from the factory premises to be used as manure will minimize the loss of filter
cake.
6) Roll of Management :
For installation of a cane sugar factory the site is be selected as to its 30 kms
surroundings abundant cane is available, good water source, road and rail facilities,
communication facility, near by town facility are to be burn in mind. Strictly
following cane plantation cutting order issued and transportation of cane with in 24
hrs. for crushing.
Quality material section is to be adopted instead of thinking the cost of the
material which will reduce the repair and maintenance cost. Miscellaneous
expenditure is to be minimized to the maximum to reduce the cost of production.
Well preplanned starting and closing of season with continuous crushing and
timely selling of sugar and by products will lead to omission of unwanted
expenditure.
For better utilization of the by-products the sugar industry can be converted in
to sugar complex. i.e. apart from sugar manufacturing, paper manufacturing, alcohol
manufacturing and fertilizer, manufacturing from press mud and effluent water can be
adopted, At the time of sugar industry off season the other industries may made to
run. By that time the excess bagasse saved can be utilised as fuel for Electricity
production to export power. This type of running a sugar complex will elevate the by
product lose. At this juncture sugar will be by product and other material is bagasse,
press mud and molasses will turn us main product.
Page 21
92
1. Cost of product = Cost of Raw material + cost of consumables +
overhead expenses.
2. Cost of product = Selling price of sugar + selling price of by product.
is showing a wealthy management.
7) Preventive maintenance :
Under this system operation parameter of the plant are kept under constant
watch through a Well - planned systematic inspection so as to under take time repair/
replacement of the components / part undergoing wear and tear to avoid downtime
due to failure which may hampar working. Procedure is laid to minimize wear and
tear, corrosion, scale formation etc. Similarly the quality of lubricants, water steam
gland, packing, joining and other consumables should be specified and recorded so as
to exercise regular checks.
Schedules for regular inspection, periodical inspection of stand by units should
be properly drawn so that production is not hampered on this account otherwise the
very purpose of keeping stand by units shall be defeated, similarly periodical
inspection through planned stoppages during crushing operation for examining
number of critical units, moving equipments at rest position at time should be carried
out to take timely corrective measures.
3.9 Technical Performance of sugar factories in Maharashtra.
The sugar production in 2009-10 was 156.56 million tonnes. Which was 4.95
million tonnes more than that in 2008-09. For various reasons many sugar producing
countries had to make revisions in the estimated figures and similarly adjustment had
to be made in India. Initially, it was estimated that India would produce 15 million
tonnes of white sugar but ultimately a sugar production of 18.7 million tonnes was
reached. The substantial increase was noticed in the two major sugar producing states
viz. Maharashtra and Uttar Pradesh. Maharashtra produced 50.21 % more sugar while
in Uttar Pradesh production was more by 38 % as compared to their earlier estimates.
The countries opening stock of sugar at the beginning of 2009-10 season was 3.35
million tonnes and the production during the season was 18.7 million tonnes which
was 28.61 % more as compared to the last season.4
Page 22
93
The technical performance of sugar factories in Maharashtra for the last seven
years has been given in Table No. 3.3.
Table No. : 3.3
Technical performance of sugar factories in Maharashtra (2003-04 to 2009-10)
Sr.
No. Particulars
2003
-04
2004
-05
2005
-06
2006
-07
2007
-08
2008
-09
2009
-10
1) No. of sugar factories in
operation 136 102 142 163 174 147 142
2) Gross days 90 82 121 189 182 107 170
3) Cane crushed
(Lakh M. tonnes) 290.38 194.58 445.71 798.83 761.82 400.26 613.89
4) Sugar Production
(Lakh M. tonnes) 31.71 22.16 51.97 90.99 90.70 45.78 70.66
5) Capacity utilization % 94.38 84.07 98.85 94.98 92.00 97.41 95.03
6) Recovery % cane 10.95 11.42 11.68 11.39 11.94 11.46 11.54
7) Lost hrs. % to available hrs. 14.94 20.15 13.85 14.56 15.77 15.30 15.63
8) Pol % cane 12.88 13.30 13.58 13.42 13.90 13.36 13.45
9) R.M.E. (mit) 94.96 95.00 95.12 94.97 95.13 94.91 95.22
10) RBER (G.Rao) 90.68 90.47 90.63 90.08 90.55 90.70 90.70
11) R.O.E. (M-G Rao) 86.11 85.96 86.21 85.56 86.14 86.09 86.36
12) Total Losses 1.946 1.897 1.931 2.049 1.988 1.916 1.931
Source : Technical performances of V.S.I. year : 2006-07 to 2009-10.
Table No. 3.3 shows state Technical performance of sugar factories. In the year 2006-
07 sugar production is highest (90.99 Lakh M.T.) as compared to other years and
highest Recovery % is (11.94) in the year 2007-08, at that time 174 sugar factories
were in operation. But in the year 2009-10 No. of Sugar factories decreased. up to
142. The condition of sugar factories indicates from above table capacity utilization %
shows inefficiency of sugar factories. Lost hrs. percentage to available hrs shows
adequacy of sugar cane and other some reasons.
Page 23
94
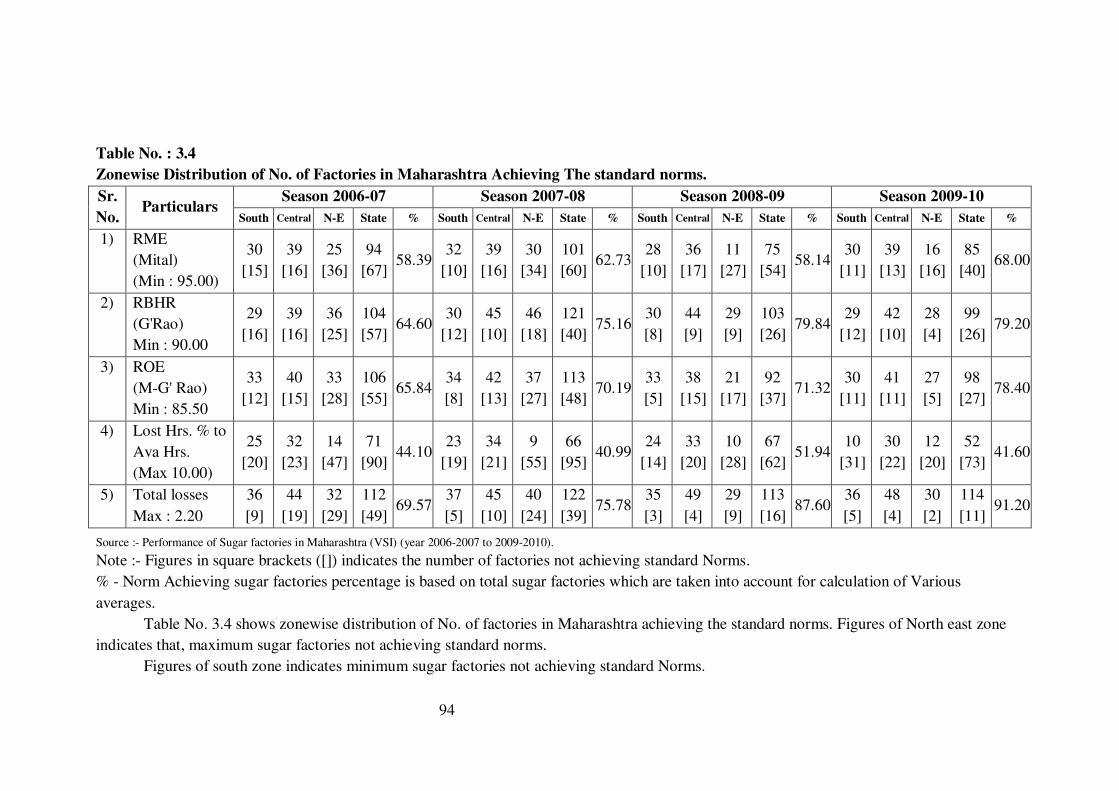
Table No. : 3.4
Zonewise Distribution of No. of Factories in Maharashtra Achieving The standard norms.
Sr.
No. Particulars
Season 2006-07 Season 2007-08 Season 2008-09 Season 2009-10
South Central N-E State % South Central N-E State % South Central N-E State % South Central N-E State %
1) RME
(Mital)
(Min : 95.00)
30
[15]
39
[16]
25
[36]
94
[67] 58.39
32
[10]
39
[16]
30
[34]
101
[60] 62.73
28
[10]
36
[17]
11
[27]
75
[54] 58.14
30
[11]
39
[13]
16
[16]
85
[40] 68.00
2) RBHR
(G'Rao)
Min : 90.00
29
[16]
39
[16]
36
[25]
104
[57] 64.60
30
[12]
45
[10]
46
[18]
121
[40] 75.16
30
[8]
44
[9]
29
[9]
103
[26] 79.84
29
[12]
42
[10]
28
[4]
99
[26] 79.20
3) ROE
(M-G' Rao)
Min : 85.50
33
[12]
40
[15]
33
[28]
106
[55] 65.84
34
[8]
42
[13]
37
[27]
113
[48] 70.19
33
[5]
38
[15]
21
[17]
92
[37] 71.32
30
[11]
41
[11]
27
[5]
98
[27] 78.40
4) Lost Hrs. % to
Ava Hrs.
(Max 10.00)
25
[20]
32
[23]
14
[47]
71
[90] 44.10
23
[19]
34
[21]
9
[55]
66
[95] 40.99
24
[14]
33
[20]
10
[28]
67
[62] 51.94
10
[31]
30
[22]
12
[20]
52
[73] 41.60
5) Total losses
Max : 2.20
36
[9]
44
[19]
32
[29]
112
[49] 69.57
37
[5]
45
[10]
40
[24]
122
[39] 75.78
35
[3]
49
[4]
29
[9]
113
[16] 87.60
36
[5]
48
[4]
30
[2]
114
[11] 91.20
Source :- Performance of Sugar factories in Maharashtra (VSI) (year 2006-2007 to 2009-2010).
Note :- Figures in square brackets ([]) indicates the number of factories not achieving standard Norms.
% - Norm Achieving sugar factories percentage is based on total sugar factories which are taken into account for calculation of Various
averages.
Table No. 3.4 shows zonewise distribution of No. of factories in Maharashtra achieving the standard norms. Figures of North east zone
indicates that, maximum sugar factories not achieving standard norms.
Figures of south zone indicates minimum sugar factories not achieving standard Norms.
Page 24
95
Table No. : 3.5
Region wise comparative statistics of Maharashtra.
Sr.
No. Regions Season
Fact.
in
Oper.
Cane
crushing
(Tonnes)
Sugar
production
(Qt's)
Rec %
Cane
Pol %
Cane
Fibre %
Cane
Gross
days
total
losses
Lost
Hrs. %
Cap. utiz
%
RME
mit.
RBHR
G'Rao
ROE M-
G Rao
1) Kolhapur 2003-04
2004-05
2005-06
2006-07
2007-08
2008-09
2009-10
31
25
33
35
36
33
33
7968935
8385101
13510442
17781139
16806004
11938629
15680056
8975457
9960934
16672906
21295484
21239979
14606577
19156160
11.29
11.94
12.34
11.98
12.70
12.25
12.22
13.16
13.77
14.25
13.95
14.59
14.09
14.07
13.78
13.53
13.72
13.66
13.67
13.40
13.46
87
99
123
150
153
108
151
1.89
1.85
1.93
2.00
1.92
1.87
1.88
12.01
13.12
11.41
10.50
12.43
10.35
18.45
103.11
98.42
103.32
104.17
96.90
101.11
94.07
95.01
95.13
95.25
95.15
95.46
95.34
95.35
90.86
90.50
90.59
90.52
90.71
90.80
90.72
86.33
86.09
86.28
86.13
86.60
86.57
86.50
2) Pune 2003-04
2004-05
2005-06
2006-07
2007-08
2008-09
2009-10
35
29
39
40
42
40
43
8894481
5922820
16905118
26260561
25642514
16741109
25774245
9706953
6798985
20207807
30330555
30886427
19203618
29809929
10.92
11.48
11.96
11.55
12.05
11.48
11.57
12.79
13.32
13.81
13.50
13.94
13.34
13.46
14.04
13.79
13.95
13.99
13.87
13.61
13.72
83
77
133
204
197
129
202
1.89
1.87
1.88
1.97
1.91
1.88
1.91
11.04
15.77
7.89
9.54
10.33
9.77
12.27
97.51
77.65
106.45
100.31
98.55
103.60
96.14
95.28
95.52
95.55
95.40
95.55
95.25
95.46
90.85
90.83
90.99
90.58
90.88
91.00
90.81
86.56
86.77
86.94
86.41
86.84
86.68
86.68
3) Ahmednagar 2003-04
2004-05
2005-06
2006-07
2007-08
2008-09
2009-10
21
15
22
25
25
23
22
5066540
1676988
6867549
13797208
13788192
5575920
9363968
5367072
1711372
7504777
15412093
16214681
5921546
10177860
10.60
10.21
10.93
11.17
11.76
10.62
10.88
12.60
12.20
12.89
13.21
13.78
12.65
12.88
13.89
13.76
13.56
13.84
13.74
13.66
13.47
100
62
121
207
213
101
169
2.02
2.01
1.98
2.06
2.05
2.05
2.03
12.91
19.47
12.97
11.54
10.80
15.56
15.19
89.29
61.80
91.40
98.26
95.99
89.86
90.15
94.93
94.63
95.02
94.99
95.08
94.50
94.84
90.25
89.73
90.26
90.33
90.55
90.30
90.29
85.67
84.92
85.76
85.80
86.10
85.33
85.63
Page 25
96
Sr.
No. Regions Season
Fact.
in
Oper.
Cane
crushing
(Tonnes)
Sugar
production
(Qt's)
Rec %
Cane
Pol %
Cane
Fibre %
Cane
Gross
days
total
losses
Lost
Hrs. %
Cap. utiz
%
RME
mit.
RBHR
G'Rao
ROE M-
G Rao
4) Aurangabad 2003-04
2004-05
2005-06
2006-07
2007-08
2008-09
2009-10
17
13
19
25
28
17
17
2723919
1285778
3365765
9416526
8596021
2185705
3625831
2895344
1327699
3522834
10055532
9340880
2257629
3838740
10.75
10.62
10.50
10.68
10.92
10.37
10.69
12.72
12.57
12.46
12.80
13.04
12.37
12.62
14.22
14.01
13.83
14.13
14.18
13.80
13.76
99
88
110
198
180
88
148
1.99
1.96
1.98
2.13
2.14
2.02
1.96
17.35
35.17
23.10
21.75
22.15
35.13
24.00
87.30
67.16
79.29
81.78
78.88
68.74
85.84
94.87
94.93
94.67
94.67
94.59
94.43
95.10
90.49
90.50
90.58
89.78
90.21
90.30
90.79
85.85
85.93
85.75
85.01
85.33
85.27
86.34
5) Nanded 2003-04
2004-05
2005-06
2006-07
2007-08
2008-09
2009-10
24
14
23
30
32
26
23
3452207
1866727
3616217
11227604
9507968
3278659
6690417
3741201
1945638
3772735
12420268
11049351
3507362
7427186
10.88
10.71
10.46
11.07
11.72
10.81
10.22
12.90
12.70
12.45
13.25
13.73
12.73
13.17
14.15
13.69
13.89
14.12
13.97
13.50
13.66
88
83
106
202
171
90
161
2.05
2.01
2.01
2.18
2.06
1.93
1.97
21.54
25.77
23.31
19.41
21.36
20.43
14.29
93.80
96.97
80.20
90.32
87.02
86.68
101.70
94.62
94.32
94.65
94.70
95.07
94.70
95.11
90.78
90.73
90.50
89.24
90.32
90.75
90.81
85.90
85.60
85.67
84.52
85.87
85.95
86.37
6) Amaravati 2003-04
2004-05
2005-06
2006-07
2007-08
2008-09
2009-10
5
3
5
6
8
6
3
580391
299587
297688
1195750
1521654
244649
222565
629652
315811
286515
1286725
1641448
231345
228766
11.03
10.54
10.27
10.76
10.81
9.87
10.35
13.18
12.66
12.34
13.12
12.99
11.99
12.40
14.34
14.42
13.58
14.12
14.03
14.00
14.04
98
71
91
160
164
58
82
2.17
2.14
2.09
2.38
2.20
2.15
2.06
20.61
32.89
40.37
24.26
27.89
44.38
51.56
78.21
86.16
60.82
68.66
67.72
39.71
47.43
94.76
94.56
94.57
94.22
94.08
93.89
94.07
89.63
89.67
90.30
89.16
90.16
90.29
90.90
84.93
84.80
85.39
84.02
84.82
84.78
85.51
7) Nagpur 2003-04
2004-05
2005-06
2006-07
2007-08
2008-09
2009-10
3
3
1
2
2
2
1
352387
61148
8449
204538
320298
62288
32735
397951
58800
4520
195896
330598
59275
28652
11.29
10.25
5.35
9.04
10.32
9.64
8.75
13.23
12.44
9.15
11.80
12.86
11.76
11.21
14.02
13.87
15.65
14.68
14.29
13.86
15.56
97
62
75
160
181
80
131
1.96
2.21
3.82
2.78
2.56
2.14
2.47
32.86
75.69
87.93
43.80
55.42
61.53
86.45
67.23
21.99
4.17
28.73
32.68
27.84
9.24
93.95
94.01
88.39
91.41
93.30
93.33
93.05
91.27
89.71
71.69
86.78
90.30
90.72
89.32
85.76
84.35
63.37
79.33
84.24
84.67
83.11
Source :- Performance of Sugar factories in Maharashtra (VSI) year 2003-04 to 2009-10.
Page 26
97
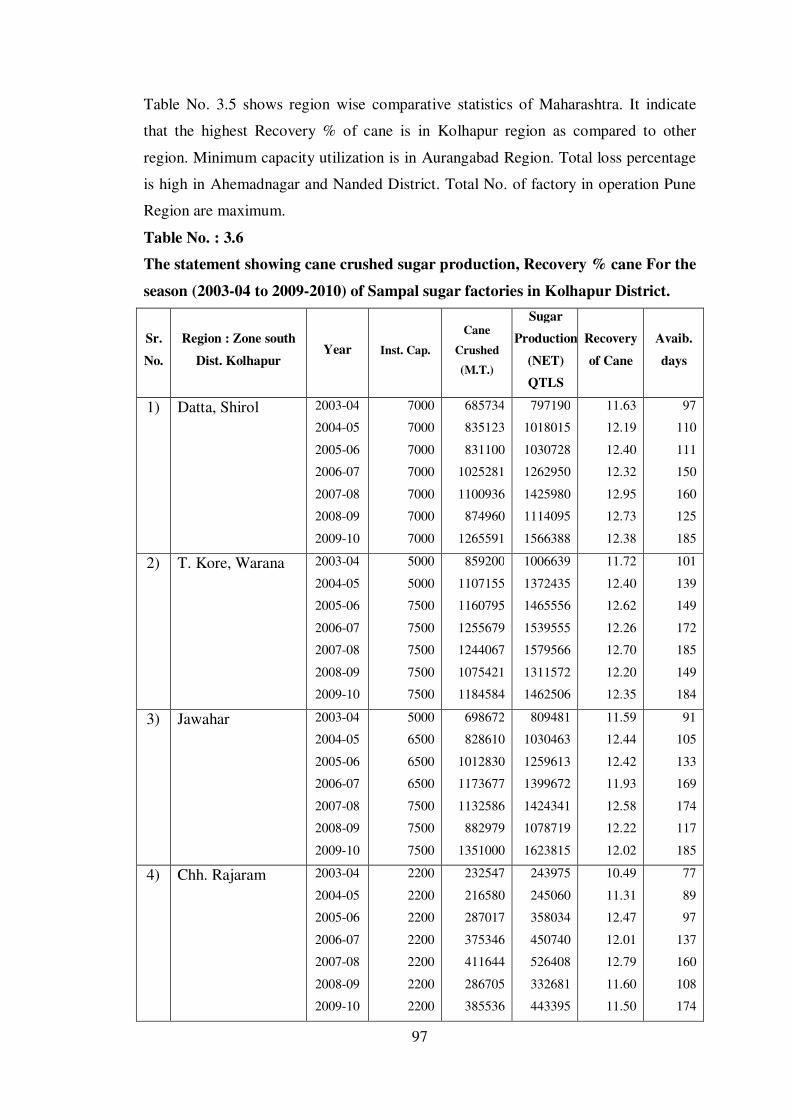
Table No. 3.5 shows region wise comparative statistics of Maharashtra. It indicate
that the highest Recovery % of cane is in Kolhapur region as compared to other
region. Minimum capacity utilization is in Aurangabad Region. Total loss percentage
is high in Ahemadnagar and Nanded District. Total No. of factory in operation Pune
Region are maximum.
Table No. : 3.6
The statement showing cane crushed sugar production, Recovery % cane For the
season (2003-04 to 2009-2010) of Sampal sugar factories in Kolhapur District.
Sr.
No.
Region : Zone south
Dist. Kolhapur Year Inst. Cap.
Cane
Crushed
(M.T.)
Sugar
Production
(NET)
QTLS
Recovery
of Cane
Avaib.
days
1) Datta, Shirol 2003-04
2004-05
2005-06
2006-07
2007-08
2008-09
2009-10
7000
7000
7000
7000
7000
7000
7000
685734
835123
831100
1025281
1100936
874960
1265591
797190
1018015
1030728
1262950
1425980
1114095
1566388
11.63
12.19
12.40
12.32
12.95
12.73
12.38
97
110
111
150
160
125
185
2) T. Kore, Warana 2003-04
2004-05
2005-06
2006-07
2007-08
2008-09
2009-10
5000
5000
7500
7500
7500
7500
7500
859200
1107155
1160795
1255679
1244067
1075421
1184584
1006639
1372435
1465556
1539555
1579566
1311572
1462506
11.72
12.40
12.62
12.26
12.70
12.20
12.35
101
139
149
172
185
149
184
3) Jawahar 2003-04
2004-05
2005-06
2006-07
2007-08
2008-09
2009-10
5000
6500
6500
6500
7500
7500
7500
698672
828610
1012830
1173677
1132586
882979
1351000
809481
1030463
1259613
1399672
1424341
1078719
1623815
11.59
12.44
12.42
11.93
12.58
12.22
12.02
91
105
133
169
174
117
185
4) Chh. Rajaram 2003-04
2004-05
2005-06
2006-07
2007-08
2008-09
2009-10
2200
2200
2200
2200
2200
2200
2200
232547
216580
287017
375346
411644
286705
385536
243975
245060
358034
450740
526408
332681
443395
10.49
11.31
12.47
12.01
12.79
11.60
11.50
77
89
97
137
160
108
174
Page 27
98
Sr.
No.
Region : Zone south
Dist. Kolhapur Year Inst. Cap.
Crushed
(M.T.)
Sugar
(NET)
Recovery
of Cane
Avaib.
days
5) Kumbhi Kasari 2003-04
2004-05
2005-06
2006-07
2007-08
2008-09
2009-10
3000
3000
3000
3000
3000
3000
3000
313112
432459
525671
514162
549650
457970
627085
346211
538416
669280
662135
723108
593741
798318
11.06
12.45
12.74
12.88
13.16
12.96
12.73
92
114
147
146
157
127
194
6) Sharad 2003-04
2004-05
2005-06
2006-07
2007-08
2008-09
2009-10
2500
2500
2500
2500
2500
2500
2500
265213
230443
348075
414734
410586
309303
537077
306851
274199
440198
510789
516358
378464
649647
11.57
11.90
12.65
12.32
12.58
12.24
12.10
86
83
105
130
142
99
164
Source :- R.T. (8) C of sugar factories. year 2003-04 to 2009-10 and yearly reports.
Note : In Kolhapur district, Total sugar factories are 20 out of 18 sugar factories are
co-operative and 2 sugar factories are private.
Page 28
99
References :
1) Mangal Singh, 'Training manual for sugar Mills', Published by T.V. Kunhi
Krishan for Somaiya Publications Pvt. Ltd. New Delhi. 1998, P.P. 367, 368.
2) 'Indian Sugar', April 1995, P.P. 10
3) 'Sista' sugar Journal April 1995 P.P. 65
4) 34th
Annual Report 2009-10 P.P. 16
Others
1) R.T 8 (C) of sugar factories (2003-04 to 2009-10)
2) Annual Reports, of sugar factories (2003-04 to 2009-10)
3) Performance of sugar factories in Maharashtra, seasons- (2003-04 to 2009-10)
4) Indian Sugar year book 2010.