Page 1
i
TH
E S
TU
DE
NT
NA
ME
: BA
CH
EL
OR
201
8
Libya
Ministry of Higher Education
Bright Star University – Braga
Bright Star University – Braga
Faculty of Technical Engineering
Department of Chemical Engineering
Reducing Heavy Hydrocarbons in Fuel Gas
Prepared by:
Hawa Fawzi Moftah 21141016
Fatma Hussin Gaith Awad 21141095
Esra Mohamed El-malkey 21152824
Aya Salah Al-den Jalloul 21152845
Supervised by:
Hussin GH. Awad Awami
DEGREE OF BACHELOR IN CHEMICAL ENGINEERING
FACULTY OF TECHNICAL ENGINEERING
CODE OF PROJECT ……………………….
Page 2
ii
Reducing Heavy Hydrocarbons in Fuel Gas
Prepared by:
Hawa Fawzi Moftah 21141016
Fatma Hussin Gaith Awad 21141095
Esra Mohamed El-malkey 21152824
Aya Salah Al-den Jalloul 21152845
Supervised by:
Hussin Awami
Project Report Submitted as Partial Fulfillment of the Requirements for the
Degree of Bachelor in Chemical Engineering
January, 2019
Page 3
iii
ABSTRACT
There are various methods of conditioning fuel which aim to reduce the fuel’s energy
content and increase its molecular percent in methane and ethane. This allows for the engine to burn
off a cleaner fuel. In many shale-gas plays, especially wet- and/or condensate-rich shale gas plays,
only raw and heavy shale gas is available as fuel for compressor drives and power generation
turbines. As a result of the considerable richness (High Btu Value) of the raw gas in such shale-gas
plays, operators are finding it increasingly challenging to meet the regulatory requirements on the
emissions levels for the local compressor stations apart from having to run their engines running on
substantial de-rates especially for the larger high pressure (HP( range machines. Membrane Fuel
Gas Conditioning Units are completely passive and the feed gas requires no pretreatment, except for
standard filtration. Practical cases of how these units have helped in resolving issues with
problematic fuel gas will be discussed in the paper. In addition, heavy hydrocarbons rich gas can
damage or foul engine components, causing mechanical reliability issues & reduced
compressor/engine efficiencies, even leading to engine or turbine shutdown. Within these days,
there is a proposal to supply Sitre Oil Company power stations (I and II) by Hatieba gas as
alternative source in presence of any shortage in the existing sources, but the power plants
generators don't matching with the gas composition without conditioning. So, establish of Knockout
vertical drum separator and membrane technology for conditioning Hatieba gas is very important to
keep the power plants away of blackout.
Keywords: Heavy shale gas, standard filtration, emissions levels.
Page 4
iv
DEDICATION
To the utmost knowledge lighthouse, to our greatest and most honored prophet Mohamed
May peace and grace from Allah be upon him. To the spring that never stops giving, to who weaves
my happiness with strings from her merciful heart? " To my mother ". To whom he strives to bless
comfort and welfare and never stints what he owns to push me in the success way who taught me to
promote life stairs wisely and patiently, to my dearest father. To whose love flows in my veins, and
my heart always remembers them, to my brothers and sisters. To those who taught us letters of gold
and words of jewel of the utmost and sweetest sentences in the whole knowledge. Who reworded to
us their knowledge simply and from their thoughts made a lighthouse guides us through the
knowledge and success path, to our honored teachers and professors.
Page 5
v
ACKNOWLEDGEMENTS
We would like to take this opportunity first of all, submit thank Allah who made all the
things possible. For provided us strength determination and ability for achievement this project.
We would like to express our sincerely appreciation to our supervisor (Special Process Engineer,
Mr. Hussin GH El Awami) for his guidance and constant supervision as well as for providing
necessary information regarding the project & also for his support in completing the project, and
many thanks or gave us the golden opportunity to do this wonderful project on the topic of
(Reducing Heavy Hydrocarbons in Fuel Gas), which also helped us in doing a lot of Research and
we came to know about so many new nice things.
We have taken efforts in this project. However, it would not have been possible without the kind
support and help of many individuals and organizations. We would like to extend our sincere thanks
to all of them.
Words mean nothing to thank the person who were by our side throughout the study period and
especially in this project was supporting us in all its periods from beginning to end, we would like
to say thank you very much , and we know it is not enough to thank you.
Page 6
vi
APPROVAL
This project report is submitted to the Faculty of Technical Engineering, Bright Star University –
Braga, and has been accepted as partial fulfillment of the requirement for the degree of bachelor in
Chemical Engineering. The members of the Examination Committee are as follows:
________________________________________
Supervisor
Hussin GH. Awad Awami …………………….
Department of Chemical Engineering
Faculty of Technical Engineering
Bright Star University – Braga
____________________________________________
Examiner 1
…………………………........ …………………….
Department of Chemical Engineering
Faculty of Technical Engineering
Bright Star University – Braga
____________________________________________
Examiner 2
…………………………… ….................................
Department of Chemical Engineering
Faculty of Technical Engineering
Bright Star University – Braga
Page 7
vii
DECLARATION
I hereby declare that the project report is my original work except for quotations and
citations, which have been duly acknowledged. I also declare that it has not been previously, and is
not concurrently, submitted for any other degree at Bright Star University – Braga or at any other
institution.
By:
Hawa Fawzi Moftah 21141016
Fatma Hussin Gaith Awad 21141095
Esra Mohamed El-malkey 21152824
Aya Salah Al-den Jalloul 21152845
Date of Submitted: Monday, 21/01/2019 Time, 10:00
Date of Presentation: Monday, 28/01/2019 Time, 10:00
Page 8
viii
TABLE OF CONTENTS
ABSTRACT III
DEDICATION IV
ACKNOWLEDGEMENTS V
APPROVAL VI
DECLARATION VII
TABLE OF CONTENTS VIII
NOMENCLATURES XIV
CHAPTER 1 1
1.1 Introduction 1
1.2.Membrane Background 2
1.3.How Membranes Work 2
1.4.Membrane Structure 3
1.5. Background 4
1.6. Problem Statement 5
1.7. Objectives 5
1.8. Aims of Project: 6
1.9. Types of Gas-Liquid Separations 8
1.9.1.Gravity Settling 8
1.9.2.Cyclone Flow 8
1.9.3.Inertial Precipitation: De-Misting, Scrubbing 9
1.9.4.Electrostatic Precipitation 9
1.9.5.Coalescence 9
1.9.6.Foam-Breaking 10
1.10.Gas engine application: 12
Page 9
ix
1.11.Membrane Benefits [21] [22]
14
1.12.Other Applications of Membrane Technology 15
1.13.Membrane technology is an umbrella term referring to the mechanical separation
processes of gaseous or liquid streams with the use of membranes. 15
CHAPTER 2 16
2.MATERIAL AND ENERGY BALANCE 16
2.1. Calculation of dew and bubble points: 23
2.2. The Energy Balance data: 24
2.3. The Energy Balance Error: 24
CHAPTER 3 29
3. SEPARATOR UNIT PROCESS DESIGN 29
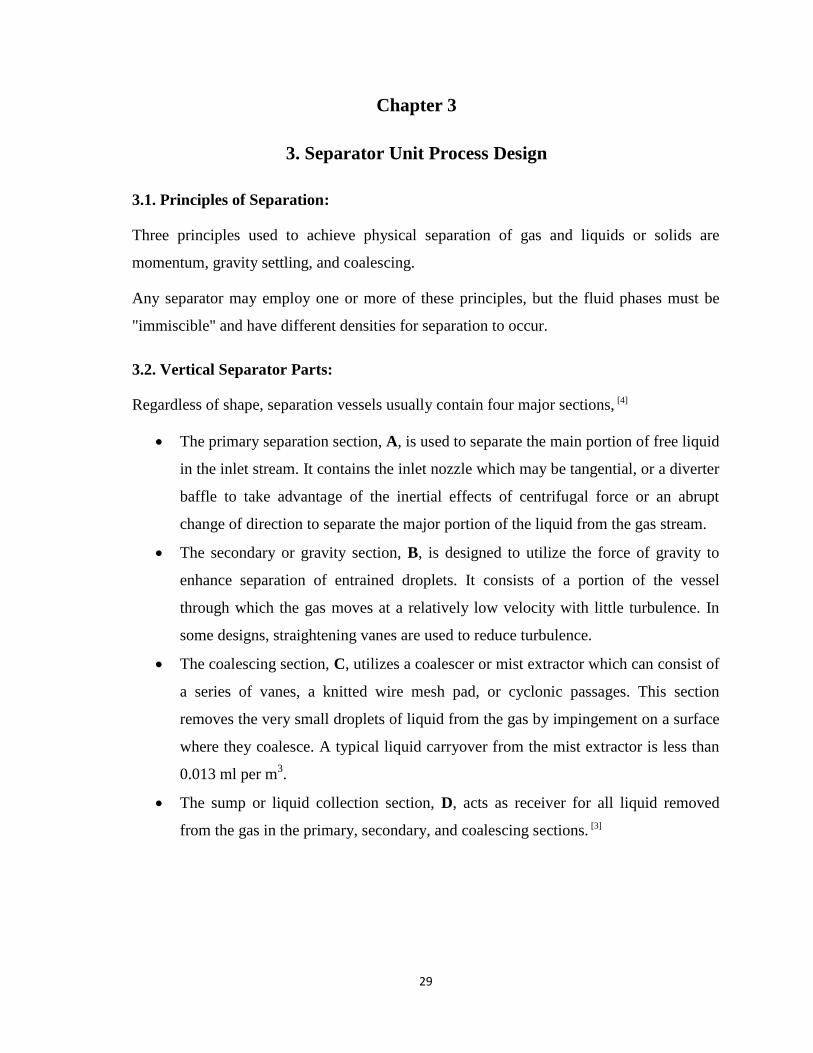
3.1. Principles of Separation: 29
3.2. Vertical Separator Parts: 29
3.3. Gas-Liquid Separator Design 30
3.3.1. Specifying Separators 30
3.4. Vertical separators 31
3.4.1. Basic Design Equations 31
3.5. Thickness of the Shell: 33
3.6.Design for the Atorispherical dished closure (cover) 33
CHAPTER 4 34
4.INSTRUMENTATION AND CONTROL 34
4.1 Instrumentation and control objectives 34
4.2 Safe plant operation: 34
4.3 Production rate: 34
4.4 Product quality: 35
Page 10
x
4.5 Typical control systems 35
CHAPTER 5 38
5.COST ESTIMATION 38
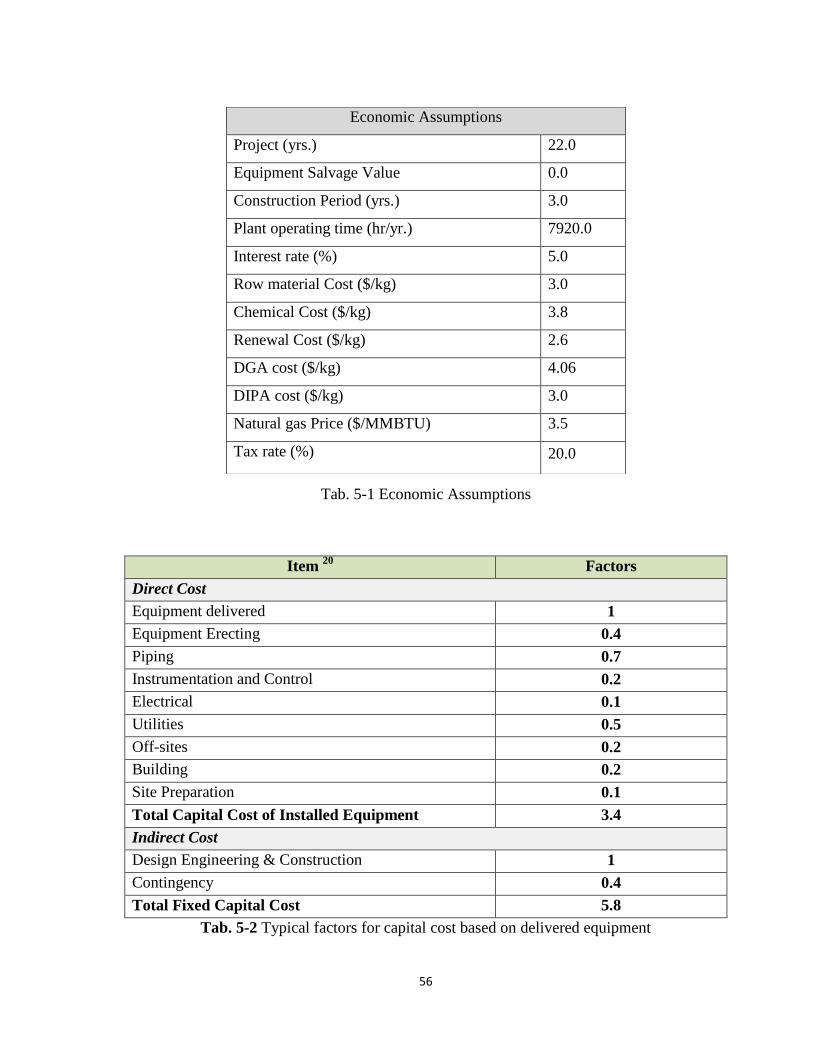
5.1.Economic Assumptions and methodology 38
5.2.Capital Costs 38
5.3.Operating costs 39
5.4.The cost of some project equipment : 39
CHAPTER 6 40
SAFETY 40
6.1. Natural gas 40
6.2. Types of Protection Equipment 40
6.2.1. Work Clothing 40
6.2.2. Head Protection 41
6.2.2.1. HARD HAT 41
6.2.3. Face Protection 41
6.2.3.1. Face Shield 41
6.2.3.2. Acid Suit 41
6.2.3.3. Eye Protection 42
6.3. Types of Eye Protection Equipment: 42
CHAPTER 7 44
CASE STUDY 44
7.HATIEBA GAS AS FUEL TO THE COMPANY POWER STATIONS: 44
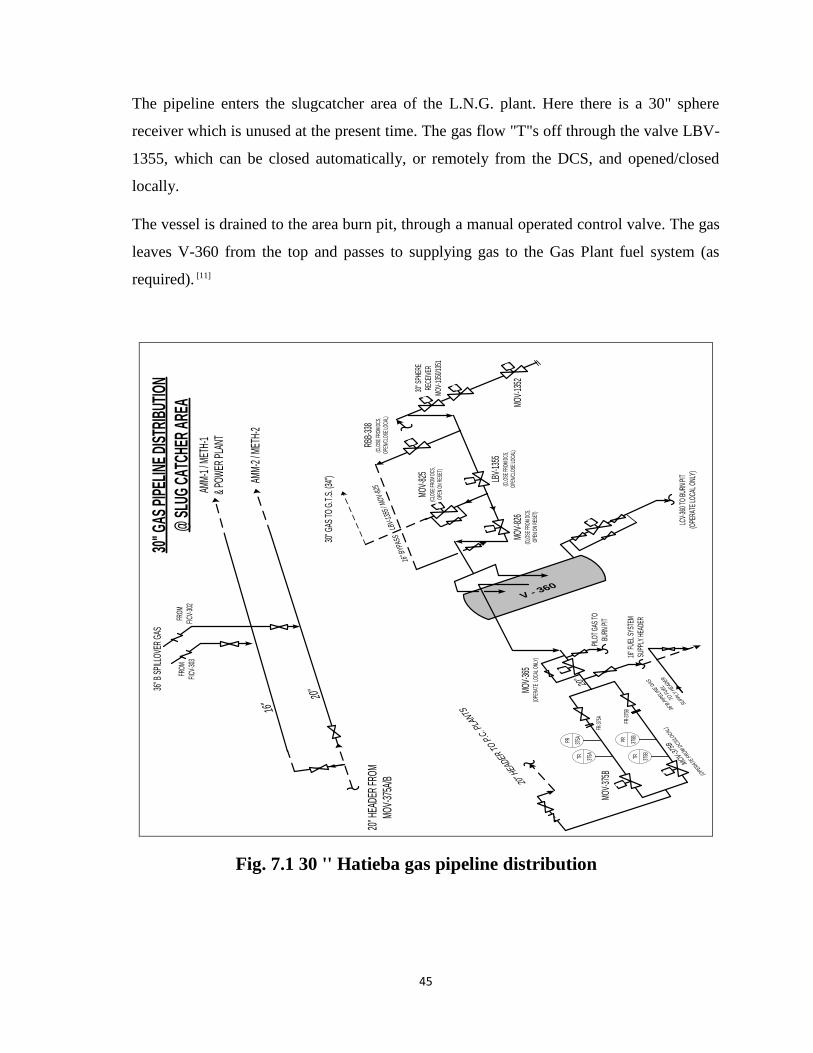
7.1. Abstract 44
7.2.Introduction. 44
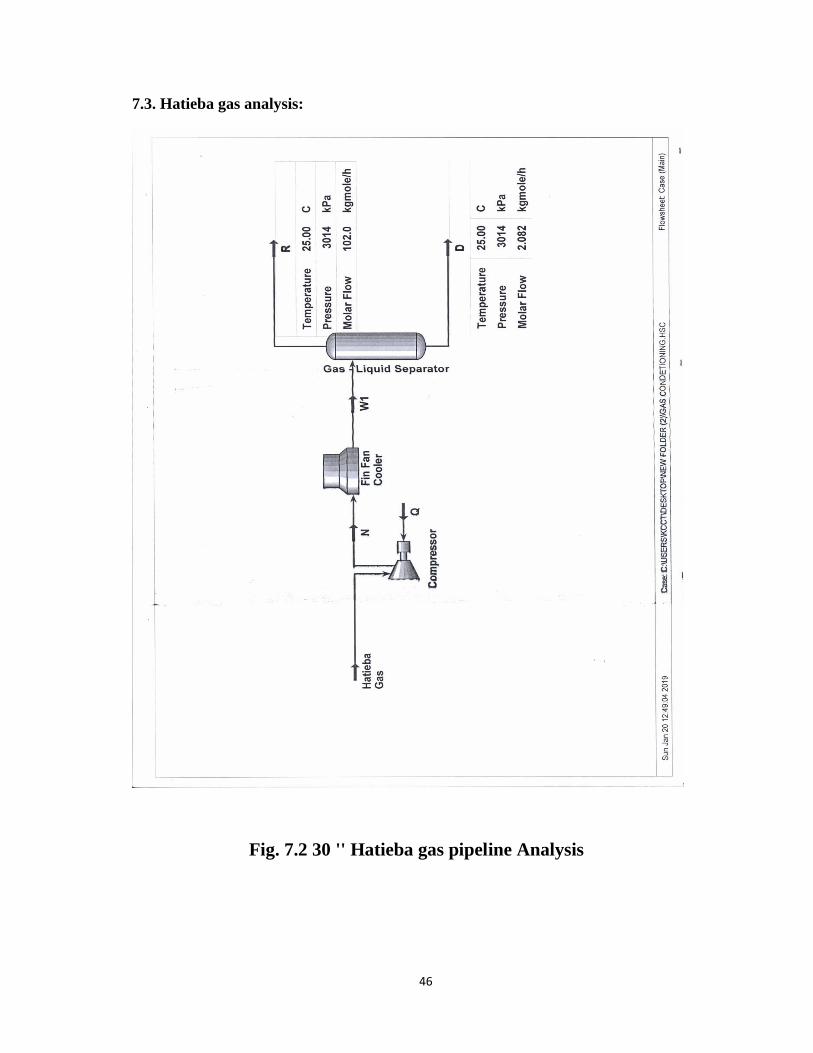
7.3. Hatieba gas analysis: 46
Page 11
xi
7.4. Conclusion: 50
7.5. Recommendation: 50
CHAPTER 8 51
8.1. Plant Layout: 51
APPINDIX A 52
APPENDIX B 55
REFERENCES: 59
Page 12
xii
List of Figures
Figure 1.1 Module Housing…….………………………………………………………….4
Figure 1.2 Conditioning fuel gas..………………………………………………………….6
Figure 1.3 Fuel gas conditioning for gas Engine...………………………………..……….13
Figure 1.4 Fuel gas conditioning for gas Turbine...………………………………..………14
Figure 2.1 Material Balance Diagram...……………………………………………………16
Figure 2.2 Overall Material Balance……………………………………………………….18
Figure 2.3 Mixing point Material Balance...……………………………………………….20
Figure 2.4 Stream (D) Mole Fraction...........……………………………………………….21
Figure 2.5 Stripper…………………………………………………………………………22
Figure 2.6 Membrane Energy Balance…………………………………………………….24
Figure 3.1 Separation Cross Section View………………………………………………..30
Figure 3.2 Gas-Liquid Separator Flow Diagram…………………………………………..31
Figure 4.1 Common Control System………………………………………………………36
Figure 4.2 Flow Control Valve…………………………………………………………….37
Figure 6.1 Indicate hard hat helmet………………………………………………………..41
Figure 6.2 Full-Face splash shield…………………………………………………………42
Figure 7.1 Hatieba 30'' gas pipeline distribution…………………………………………..45
Figure 7.2 Hatieba 30'' gas pipeline analysis………………………………………………46
Figure 7.3 Gas-Liquid separation connection……………………………………………..47
Figure 7.4 Hatieba 30'' gas properties……………………………………………………..48
Figure 8.1 power Station plant suppling with NCG………………………………………51
Page 13
xiii
List of Tables
Table 1.1 Emissions Testing Data……………………………………………………………......6
Table 2.1 Streams mole fractions Calculation…………………………………………………...19
Table 2.2 Stream (W1) Calculation……………………………………………………………....20
Table 2.3 Stream (D) Calculation………………………………………………………………..21
Table 2.4 Stream (M) mole fraction Calculation………………………………………………...22
Table 2.5 Stream (D) Bubble point Calculation………………………………………………….23
Table 2.6 Stream (P) Dew point Calculation…………………………………………………….23
Table 2.7 Hf Calculation……………………………………………………………………….25
Table 2.8 HD Calculation ……………………………………………………………………..26
Table 2.9 HP Calculation………………………………………………………………………27
Table 2.10 HM Calculation…………………………………………………………………….27
Table 2.11 Energy Balance Error Calculation…………………………………………………...28
Table 3.1 Volumetric flow rate…………………………………………………………………..32
Table 5.1 Cost of Project………………………………………………………………………...39
Table 7.1 Cross and net heating value…………………………………………………………...49
Page 14
xiv
NOMENCLATURES
Symbol Description Unit
NOx Nitrogen Oxides
CO Carbon Monoxide
NMHC Non-methane Hydrocarbons
BTU British Thermal Unit
VOC Volatile Organic Hydrocarbon
SOx Sulphur Oxides
MTR Membrane Technology and Research
BTEX Aromatic (Benzene, toluene, and three xylenes
EQT Membrane Manufacturing Company Name
MMscfd Million Standard Cubic Feet per Day
HP High Pressure
OPEX Operating Expense
Cp Heat Capacity
LCV Level Control Valve
PCV Pressure Control Valve
FCV Flow Control Valve
TCV Temperature Control Valve
S/W Sea Water Cooling System
Page 15
1
Chapter 1
1.1. Introduction
Raw unprocessed natural gas is widely used to power field turbines and engines that
drive compressors or generate power. Compressor engine exhausts are a major source of a
variety of strictly regulated emissions including Nitrogen Oxides (NOx(, CO, unburned
non-methane hydrocarbons etc. Operators have to meet several stringent emissions
requirements to remain within the thresholds of allowable emissions limits of the above
mentioned components. The situation is highly aggravated when the raw fuel gas is rich in
heavy hydrocarbons. High levels of heavy hydrocarbons content in the fuel gas are
responsible for incomplete combustion and/or pre-detonation in the gas engines which lead
to increased CO and unburned non-methane hydrocarbons emissions (NMHC) beyond the
acceptable limits1. NOx emissions are also affected by high levels of heavy hydrocarbons
due to the richer BTU content of the fuel gas. [1]
Oftentimes the raw gas composition does not meet the minimum requirements of engine or
turbine suppliers. An excess of ethane, propane and C4+ hydrocarbons results in too low a
methane number for gas engines, or too high a Wobbe Index for turbines. Specifically, high
levels of heavy hydrocarbon components lead to pre-detonation in reciprocating gas
engines. This requires derating of the engines so that they can run smoothly. In turbines,
coking on the nozzles and in the combustion chamber leads to reduced efficiencies due to
fouling or damage to the blades. In both gas engines and turbines, increased emissions of
unburned VOCs will result if the inlet gas is too rich. [3]
Presence of high levels of sulfur, especially H2S, in the fuel gas directly impacts the
Sulphur Oxides (SOx( emissions. Sour fuel gas containing sizeable proportion of H2S will
lead to proportionately higher levels of SOx emissions. Apart from high SOx emissions
levels, an excess of acid gases, specifically carbon dioxide or hydrogen sulfide, can corrode
engine and turbine components, increasing maintenance needs and resulting in unscheduled
downtime. The amount of gas used by field engines is usually in the 0.5 to 5.0 MMscfd
range—too small to make treatment of the gas by conventional amine-based technology
economical. As a consequence, many engine users are forced either to live with the
Page 16
2
problem gas and the resulting low reliability and high maintenance costs, or to install
costly-to-operate chemical scavenging systems. [1] [2]
The above-described problems can be ameliorated by processing the gas using a special
type of membrane that is more permeable to heavy hydrocarbons and acid gases than to
methane. Early work in this area was performed at Phillips Petroleum almost thirty years
ago.2 Over the last few years, one company, Membrane Technology and Research, Inc.
(MTR), of Menlo Park, CA, has developed commercial systems and processes
incorporating specialized membrane technology to treat heavy or sour fuel gas streams3.
The process, known as FuelSep™, is in use at a number of sites and for a variety of
upstream fuel gas streams. To date, these membranes have been installed at more than sixty
sites for heavy hydrocarbons separation from natural gas. Skid–mounted compact
membrane units make the Fuel Seperation process particularly suitable for remote
wellheads and compression stations where high levels of heavy hydrocarbons present in the
fuel gas are reduced significantly to remain within the emissions threshold limits. This
paper describes and compares two case studies and process configurations. [2] [4] [5]
1.2.Membrane Background
In the mid-1980s, membrane systems to remove carbon dioxide were introduced to the
natural gas processing industry. These membranes separate gases primarily by molecular
size. They permeate the small carbon dioxide molecules faster than the relatively larger
methane molecules, but retain the even larger heavy hydrocarbon molecules in the gas
stream. In contrast, recent advances in membrane technology have allowed development of
membranes that utilize differences in gas solubility to permeate heavy hydrocarbons,
carbon dioxide and water vapor simultaneously though the membrane. [3]
1.3.How Membranes Work
Membranes used to filter liquids are often finely microporous, but membranes used to
separate gases have only transient pores so small they are within the range of the thermal
motion of the polymer chains that make up the selective polymer layer. Permeation through
gas separation membranes is therefore best described by a process called solution-diffusion.
Gas molecules dissolve in the polymer membrane as in a liquid and then diffuse across the
membrane and then desorb from the polymer on the opposite interface which is typically
Page 17
3
maintained at a lower pressure as compared to the feed. The rate of gas permeation is a
product of a solution term (how many molecules dissolve in the membrane), and a diffusion
term (how fast each individual molecule diffuses across the membrane). [5]
Fuel gas-
conditioning membranes are chosen from materials that maximize the effect of the solution
term. Although each individual molecule of butane, for example, diffuses more slowly
across the membrane than each individual molecule of methane, the very high solubility of
butane more than compensates for the slower diffusion. Fuel gas conditioning membranes
therefore preferentially permeate water, carbon dioxide, hydrogen sulfide, C2+
hydrocarbons and BTEX aromatics, while retaining methane. Because most of us are
familiar with conventional filtration, this result feels counter-intuitive. Nevertheless, these
unique properties are what make the membranes particularly useful in fuel gas conditioning
applications. [7]
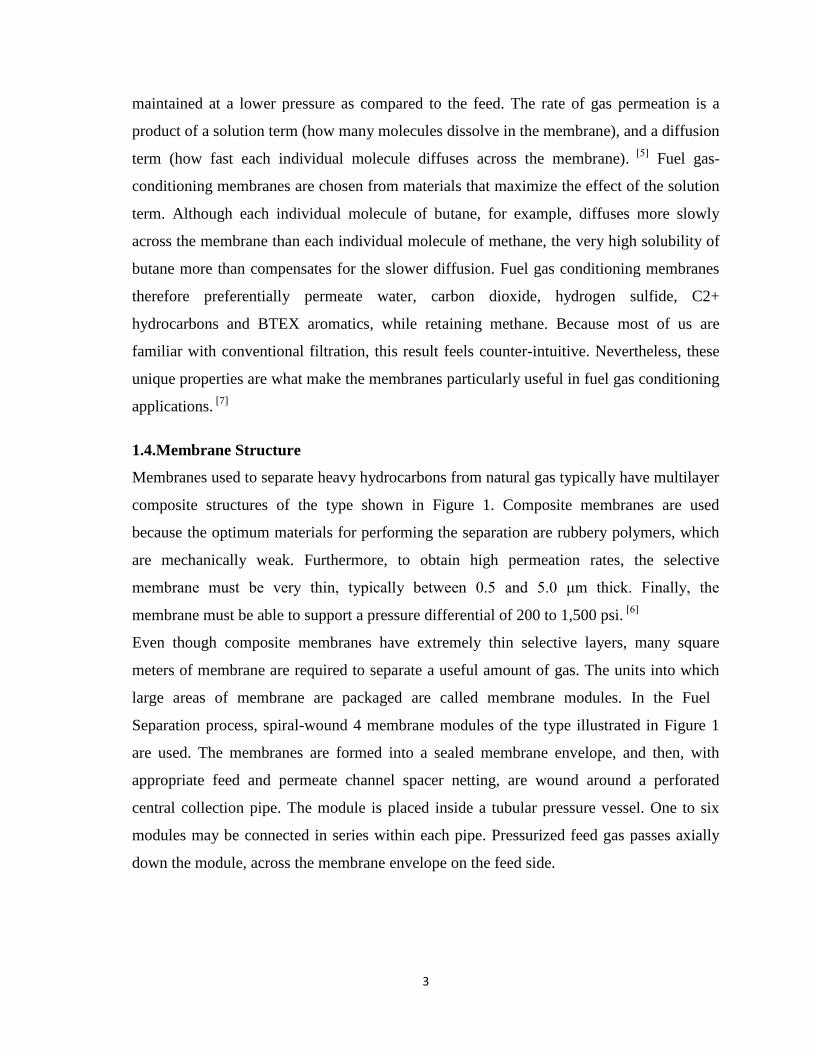
1.4.Membrane Structure
Membranes used to separate heavy hydrocarbons from natural gas typically have multilayer
composite structures of the type shown in Figure 1. Composite membranes are used
because the optimum materials for performing the separation are rubbery polymers, which
are mechanically weak. Furthermore, to obtain high permeation rates, the selective
membrane must be very thin, typically between 0.5 and 5.0 μm thick. Finally, the
membrane must be able to support a pressure differential of 200 to 1,500 psi. [6]
Even though composite membranes have extremely thin selective layers, many square
meters of membrane are required to separate a useful amount of gas. The units into which
large areas of membrane are packaged are called membrane modules. In the Fuel
Separation process, spiral-wound 4 membrane modules of the type illustrated in Figure 1
are used. The membranes are formed into a sealed membrane envelope, and then, with
appropriate feed and permeate channel spacer netting, are wound around a perforated
central collection pipe. The module is placed inside a tubular pressure vessel. One to six
modules may be connected in series within each pipe. Pressurized feed gas passes axially
down the module, across the membrane envelope on the feed side.
Page 18
4
A selective portion of the feed permeates into the membrane envelope, where it spirals
towards the center and is collected through the perforated permeate collection pipe. The
treated gas is withdrawn from the feed side at the residue end of the module. [8]
Fig. 1.1. Module Housing
1.5. Background
The Reduce Emissions for Compressor Stations in Condensate-rich Shale Gas Plays by
Reducing Heavy Hydrocarbons in Fuel Gas.In many shale-gas plays, especially wet- /or
condensate-rich shale gas plays, only raw and heavy shale gas is available as fuel for
compressor drives and power generation turbines.[11] As a result of the considerable
richness (High Btu Value) of the raw gas in such shale-gas plays, operators are finding it
increasingly challenging to meet the regulatory requirements on the emissions levels for the
local compressor stations apart from having to run their engines running on substantial de-
rates especially for the larger HP range machines. In addition, heavy hydrocarbons rich gas
can damage or foul engine components, causing mechanical reliability issues & reduced
compressor/engine efficiencies, even leading to engine or turbine shutdown.[9] The
immediate impact of this is loss of gas and oil production until the components are replaced
or fixed. This paper describes the use of unique reverse-selective membranes which
preferentially removes heavy hydrocarbons components from the raw shale-gas to produce
clean fuel gas at these sites. Numerous fuel gas conditioning units have been installed in
Page 19
5
several shale-gas plays across the country by companies like EQT Midstream (Marcellus
and Devonian), Peregrine Pipeline (Barnett Shale) and in the Eagle Ford shale area for
reducing the heavy & sour contents from the fuel gas & subsequently also meet the
emissions requirement on the Volatile Organic Compound )VOC) levels.[12] These systems
have no moving parts, are designed for simple, unattended operation and are virtually
maintenance-free. By effectively reducing the heavy hydrocarbons content, Membrane Fuel
Gas Conditioning Units reduces the volume of unburned VOC’s emissions caused due to
incomplete combustion of hydrocarbons in the firing chamber. These units have been used
to fix derate and high maintenance problems due to poor fuel gas quality for Wartsila,
Caterpillar, Waukesha, Superior and other reciprocating engine makers and also for turbine
fuel gas conditioning. Skids have been used to produce from 0.1 to 110 million scfd
(MMscfd) of clean gas. Membrane Fuel Gas Conditioning Units are completely passive and
the feed gas requires no pretreatment, except for standard filtration. Practical cases of how
these units have helped in resolving issues with problematic fuel gas will be discussed in
the paper.
1.6. Problem Statement
To accommodate the significant increase in natural gas production in the oil and gas
industry is expanding the infrastructure needed to transport natural gas to its customers.
Compressor stations are a key component to transporting gas through pipelines.
The problem with using directly produced natural gas as fuel is that, typically, it is very
rich, or abundant in heavier hydrocarbons. The leaner the fuel, meaning fuel consisting of
lighter hydrocarbons such as methane and ethane, burn better and have several benefits
which are discussed later in this chapter. [10]
1.7. Objectives
There are various methods of conditioning fuel which aim to reduce the fuel’s energy
content and increase its molecular percent in methane and ethane. This allows for the
engine to burn off a cleaner fuel.
Analyzing for the main goal of this study is the Membrane Technology for Fuel Separation
system will be used as the method of fuel conditioning.
Page 20
6
The MTR Fuel Separation system functions with the use of membranes, and this
experiment was designed to validate its function, characterize its performance map,
determine if it is economical to use, and discover any other benefits such as emission
reduction. After gathering over 44 hours of testing data, a performance map was created
which associated the differential pressure across the membrane with its performance index
as well as its rate of return. [10]
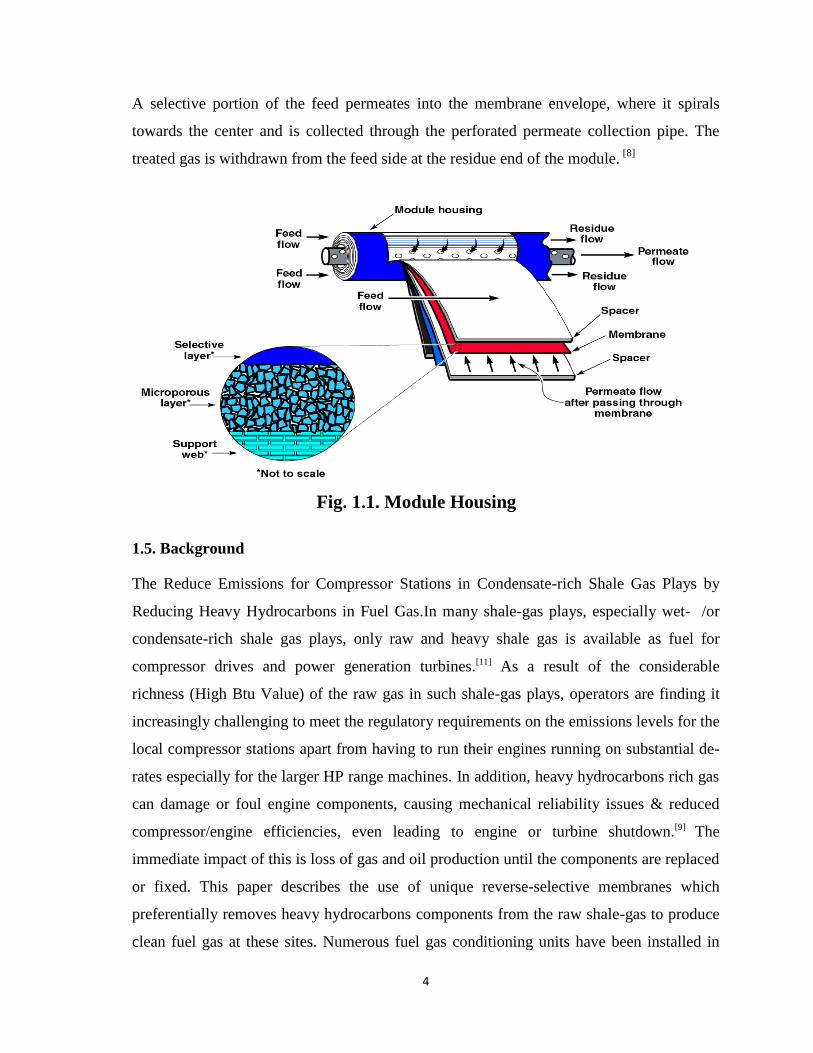
Providing Throughout this report more information will be provided on membrane
technology, the design procedures, the results of the testing, and discussion of the unit’s
performance as well as performance in the future.
Fig. 1-2 Conditioning Fuel Gas
1.8.Aims of Project:
1. Study the possibility of purification the shale-gas from heavy hydrocarbon.
2. The purification of natural gas reducing the emissions of unwanted exhaust.
3. Providing the clean fuel gas allow getting high heat value and reducing the high rate
of maintenance cost and replacing spare parts. [7]
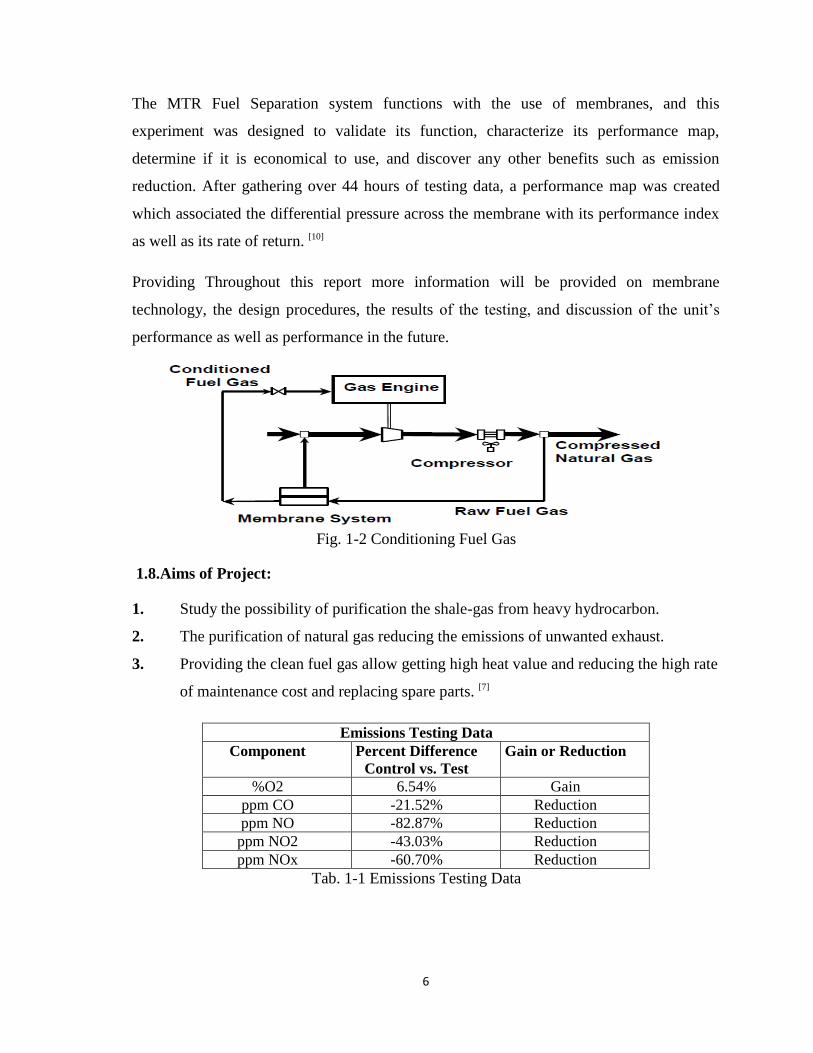
Emissions Testing Data
Component Percent Difference
Control vs. Test
Gain or Reduction
%O2 6.54% Gain
ppm CO -21.52% Reduction
ppm NO -82.87% Reduction
ppm NO2 -43.03% Reduction
ppm NOx -60.70% Reduction
Tab. 1-1 Emissions Testing Data
Page 21
7
Membranes have gained an important place in chemical technology and are being used
increasingly in a broad range of applications. The key property that is exploited in every
application is the ability of a membrane to control the permeation of a chemical species in
contact with it. This article provides a general overview of the entire membrane area. After
a review of the historical development of membranes, the principal types of membrane are
described briefly. The manufacture of the more important types of membrane and the
packaging of membranes in modules to exploit their properties are discussed. The principal
membrane applications, including microfiltration, ultrafiltration, reverse osmosis,
pervaporation, gas separation, and controlled drug delivery are described. The particular
focus is on the use of membranes to solve separation problems. A detailed section on
membrane reactors is included. More complete descriptions of some of the important
specific applications of membranes are given elsewhere.
The gas has a high heating value, high hydrocarbon dew point, and low octane number,
which can cause operating problems. In gas engines, the rich fuel may pre detonate which
can severely damage the internals of the firing chamber. Also, the condensation of
hydrocarbons (due to day-night temperature variations) may damage combustion chambers
in gas engines and gas turbines, increasing maintenance cost and downtime.
Since the engines drive and turbines drive other machinery, any disruption in their
operation will reduce production resulting in significant revenue loss. [11]
To increase the reliability and reduce unscheduled downtime of such key equipment, fuel
conditioning through membrane technology is a simple way to solve this problem.
The conditioned fuel gas is significantly depleted in the higher hydrocarbons, is
completely dehydrated, and still retains the heating value needed to drive a compressor.
The feed gas is first compressed and sent to a condenser where it is cooled. A portion of the
heavy hydrocarbon fraction condenses and is recovered as a liquid. [13]
The non-condensed portion of the gas, which still contains a significant fraction of the
heavy hydrocarbon components, passes across the surface of the membrane.
Page 22
8
1.9. Types of Gas-Liquid Separations
Two general situations are liquid-dispersed-in-gas and gas-dispersed-in-liquid. The first
situation arises for instance when
Vapor from a boiling or sparged pool of liquid carries (entrains) liquid droplets
Vapor emerges from a flashing two-phase flow
A gas-vapor mixture is cooled.
The second situation may arise when
Gas passes through, or vapor is generated within, a liquid, and is particularly
pronounced if the liquid is viscous
A liquid is agitated vigorously.
In general these gas-liquid mixtures are undesired and require separation. [14]
The liquid-in-gas situation is examined first. The method of separation depends on the size
of the liquid droplets and also on the loading in the gas. We examine the methods starting
with the largest droplets and the highest loadings.
1.9.1. Gravity Settling
Two-phase mixtures emerging from gas-liquid pipelines often have large liquid loadings
and gross dispersion of liquid in the gas. A typical liquid concentration is 50 litres per
cubic meter of gas. A simple ‘knock-out’ pot can do the initial separation of gas and liquid
and should be installed ahead of any more sophisticated device. Gas leaves at the top and
liquid leaves at the bottom, both streams probably containing some amount of the other
phase. [15]
1.9.2. Cyclone Flow
For liquid content in the range 1 to 50 litres per cubic meter a cyclone is effective in
separating liquid from gas, especially if the liquid droplets are larger than 10-50 microns.
However, smaller droplets are carried out with the gas stream. [16]
Page 23
9
1.9.3. Inertial Precipitation: De-Misting, Scrubbing
For droplets greater than 5-50 microns, passage of the gas-liquid through a wire-mesh pad
can remove most of the liquid. The gas passes around the wire elements but the liquid,
having more inertia, collides with the wire and collects (precipitates) on it. The liquid runs
together (i.e., coalesces) and forms droplets that are large enough to detach and fall back
against the main flow. The cut size of the droplets removed (i.e., the diameter of droplet
such that 50 percent are removed from the gas) may be estimated from the formula.
Cut size = 2.302 x 10⁶ x [(gas viscosity x wire diameter) / (liquid density x gas velocity)]
1/2
It is common to install a mesh pad at the top of a knock-out pot, to remove some of the
liquid that still remains in the gas.
Another variety of inertial precipitation is the scrubber where the droplets which it is
desired to remove collide with larger drops of liquid sprayed into the path of the gas. These
drops are large enough to settle by gravity. This type of system is used for droplets 20
microns or less. There are several styles of scrubbers, some of them very thorough.
1.9.4. Electrostatic Precipitation
Droplets as small as 2 microns may be removed from a stream of gas by being given a
charge through (ionization of the gas) and then being collected on an electrode. The
method works better at larger sizes, e.g., above 50 microns. [16]
1.9.5. Coalescence
When droplet size is very small, say less than a micron, the inertial techniques become
ineffective. Mists and fogs comprise droplets in this size range. Small particles follow the
motion of the gas so closely that there is little chance for capture by impingement. In this
case the phenomenon of choice is coalescence. The gas-liquid mixture is passed through a
bed of fine fibers onto which the liquid droplets adhere in passing and on which they grow
to a size that lets them separate after the gas-liquid mixture leaves the coalescer. The bed is
typically a hollow cylinder, either vertical or horizontal. Gas and liquid enter at one end and
emerge from the outside of the cylinder all along its length. The fibers are sized to enhance
the growth of droplets. [17]
Page 24
10
They may have a non-wetting fluoropolymer coating which preserves the captured droplets
as droplets and enhances their ability to unite with one another. [4]
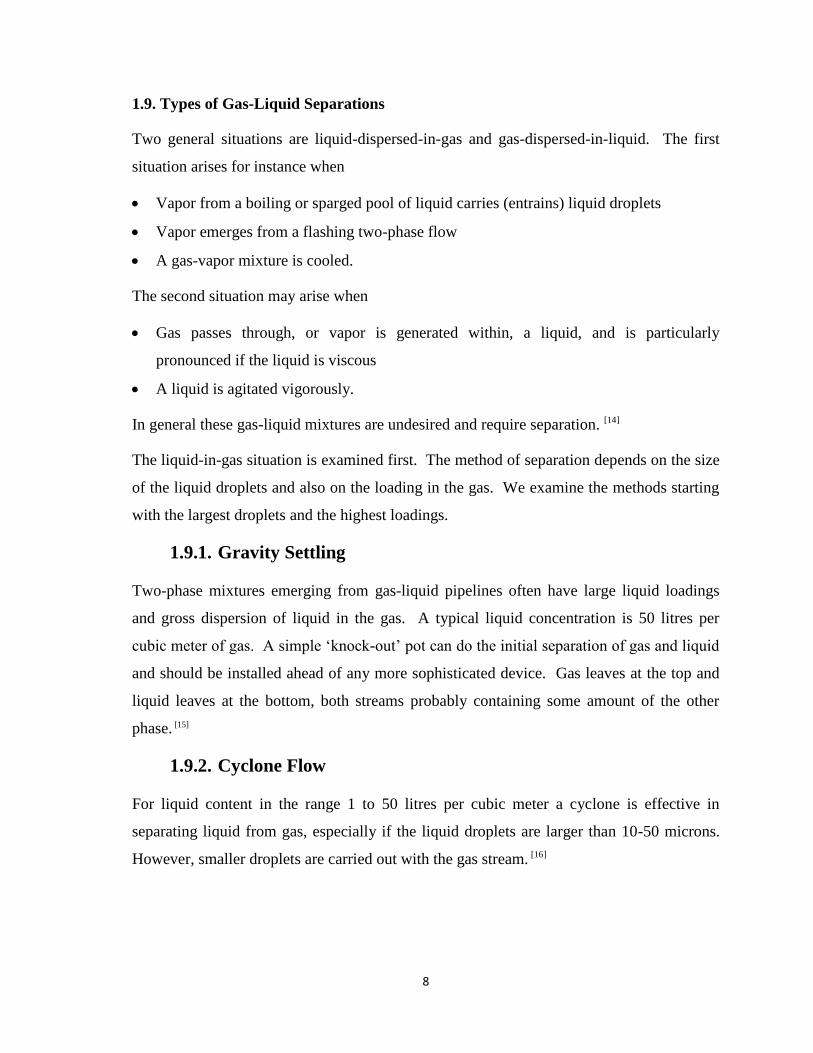
1.9.6. Foam-Breaking
The other type of gas-liquid mixture sometimes requiring separation is the mixture where
the liquid forms the continuous phase, i.e., froths and foams. Sometimes it is essential to
separate the liquid components from the gas components. Often however, the problem is
just that the foam takes up space in a reactor or in the stages of a distillation column. In the
extreme, foam may start issuing from the vessel where gas was expected. There are three
situations. [15]
1. A liquid is boiling or gas is being passed through it. Even though the gas separates from
the liquid by leaving the top surface it still occupies space within the bubbly mixture. The
in situ liquid volumetric fraction in the mixture is generally described by an expression of
form. [18]
Gas & liquid, in
Gas,
out
Coalesced
liquid
Page 25
11
vol frac. liquid = 1 / ( 1 + a * US )
Where, US is the superficial velocity of the gas (volumetric flow divided by cross-sectional
area) and (a) is a constant the value of which depends on the system and particularly on
liquid viscosity. This behavior is simply a fact of life: the expansion of the liquid into a
bubbly mixture has to be taken into account when designing or filling a vessel. [5]
2. A gas has been introduced into the liquid during part of a process but that part is over.
While most of the bubbles have risen and disappeared, a population of small slowly-rising
bubbles remains. This situation occurs most commonly with viscous liquids. The rise
velocity is proportional to bubble diameter squared and inversely to liquid viscosity. If the
gas must be removed and if it is not practical to wait long enough, then a vacuum may be
applied in order to increase the size of the bubbles or the liquid may be heated to reduce its
viscosity. [19]
3. A true foam is present, i.e., a layer of stable bubbles at the top of the liquid pool.
Generally a third, trace component is responsible for the stability of the bubbles.
Mechanical means, like rotating bars or paddles, are sometimes used to stir and break the
bubbles. More commonly a chemical, generally at low concentration (a few parts per
million), is added as an anti-foam. The nature and operative mechanism of these
substances varies but it is thought that they may substitute their activity for that of the
component causing the foam. In any case they cause the liquid membrane between the
bubbles to rupture or to thin and drain back into the pool, thus allowing the gas in the
bubbles to escape. Silicones are a popular anti-foam, as are several different organic
compounds and a few inorganics. Anti-foams are chosen for their effectiveness in the
system at hand and also for the lack of any adverse effects on the process or product. For
instance, some anti-foams are unacceptable in food or in packaging materials that will come
in contact with food. [6]
Page 26
12
1.10. Gas engine application:
The membrane separates the gas into two streams: a permeate stream enriched in heavy
hydrocarbons and a residue stream which is depleted of heavy hydrocarbons.
A- The permeate stream is recycled to the compressor inlet while the residue stream (which
is maintained at pressure) is the treated natural gas stream. [2]
B- Natural gas is commonly used as a fuel in gas engines and turbines in the hydrocarbon
processing industry.
C- Frequently, raw natural gas is the only fuel available to operate compressor stations in
remote locations and on offshore platforms. This gas has a high heating value, high
hydrocarbon dew point, and low octane number, which can cause operating problems.
D- In gas engines, the rich fuel may pre-detonate which can severely damage the internals
of the firing chamber.
E- In addition, condensation of hydrocarbons (due to day-night temperature variations) may
damage the combustion chambers in gas engines and gas turbines, increasing
maintenance costs and downtime. [18]
F- Since the engines and turbines drive other machinery, any disruption in their operation
will reduce production resulting in significant revenue loss.
G- Fuel gas conditioning is particularly important for gas turbines on offshore platforms,
where this equipment is the only source of power.
H- To increase the reliability and reduce unscheduled downtime of such key equipment, a
simple technology that conditions fuel gas is required. [19]
Page 27
13
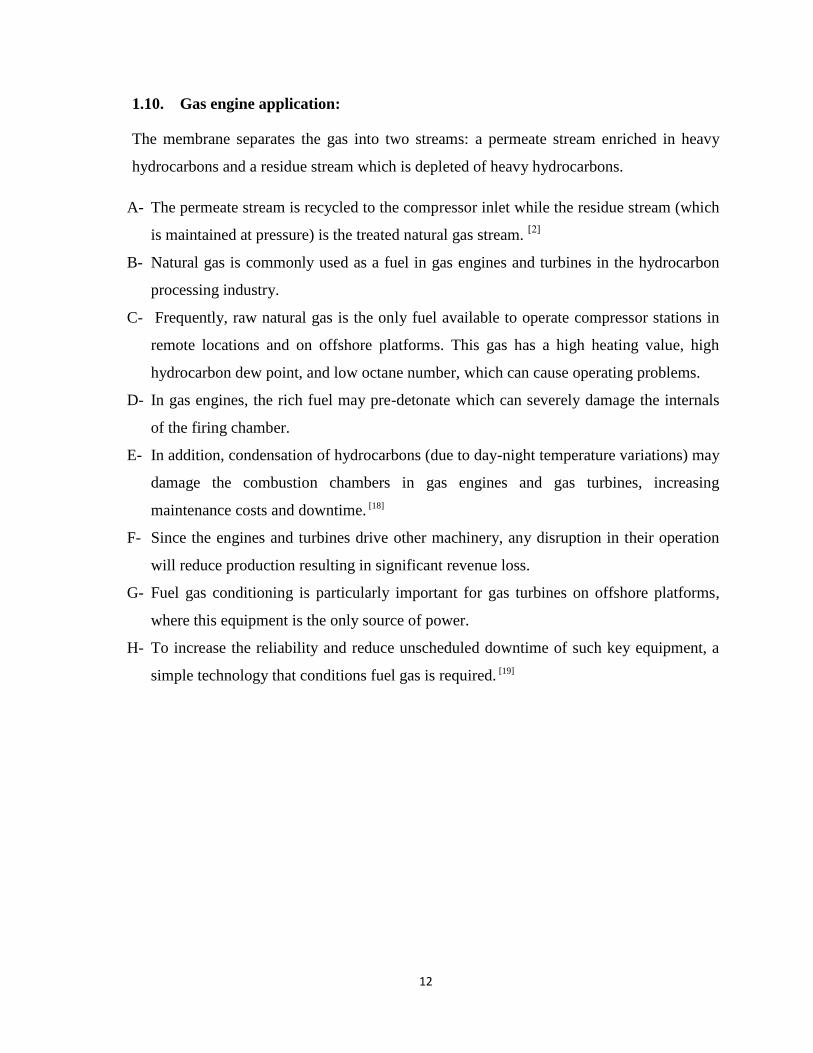
A flow diagram of the membrane to condition raw natural gas is shown in Fig. 1.4.
Fig. 1.3. Fuel gas conditioning for gas Engine
The gas, at a pressure of 100 psig, is compressed to 1000 psig and cooled in an air cooled
after cooler.
The heavy hydrocarbons are condensed and recovered as a liquid. The high-pressure gas,
saturated in heavy hydrocarbons, contains 6.2% of C4+ hydrocarbons and over 5000 ppm
hydrogen sulfide. [17]
This gas is not an ideal engine fuel. To improve the gas quality, the pressurized fuel stream
is sent to the membrane system which reduces the total C4+ hydrocarbon content to 2.1%
and removes about 80% of the hydrogen sulfide.
The treated gas is then routed to the gas engine as fuel. The heavy hydrocarbon rich
permeate stream is sent to the feed side of the compressor. The fuel conditioning system is
completely passive. The power to drive the separation is provided by the existing
compressor, so that no new rotating equipment is required. In addition, the conditioning
occurs at ambient temperature, avoiding the issues of hydrate formation. [20]
The turbines are frequently powered by raw, associated gas produced with the oil. This raw
gas is typically rich in condensable hydrocarbons and at low pressure.
Fig. 1.4. Shows process flow diagram of a fuel conditioning system for gas turbine. The
fuel is compressed in a screw compressor from 35 to 285 psig.
Page 28
14
The gas is then cooled, partially condensing the heavier hydrocarbons, which are removed
from the gas in a separator. Since the gas from the separator is fully saturated, condensation
may occur in the fuel line to the turbine. [21]
Moreover, this gas is very rich in hydrocarbons and may not meet the fuel specifications of
the turbine manufacturer.
Rich fuel tends to burn less efficiently in the combustors, leading to carbon formation,
which fouls and damages the turbine blades. Injection of liquid hydrocarbons and
incomplete combustion of the rich fuel can lead to unscheduled downtime and lost
production.
Fig. 1.4. Fuel gas conditioning for gas Turbine
1.11. Membrane Benefits [21] [22]
Removes heavy components such as C3+ to clean up fuel gas.
Removes significant portions of acid gases such as H2S and CO2 that will reduce
acid formation in the turbine or engine exhaust and reduce emissions.
Increases reliability of gas engines and turbines.
Operates at ambient conditions with no external heating required to prevent hydrate
formation.
Eliminates need to de-rate gas engine.
Decreases maintenance costs and reduces unscheduled downtime.
Increases recovery of liquids.
Contains no moving parts, simple to operate and maintain
Page 29
15
1.12. Other Applications of Membrane Technology
1.13. Membrane technology is an umbrella term referring to the mechanical
separation processes of gaseous or liquid streams with the use of membranes.
Although it is a relatively young technology, it proves to have many benefits to a variety of
industries.
Membrane systems can be found in water treatment using reverse osmosis, in waste water
purification because of ultra and microfiltration that can be achieved with membranes,
filtration in the food industry, for medical applications such as artificial kidneys and lungs,
as fuel cells, in gas separation processes, and these are just a few examples.
One of the reasons this technology is becoming more useful is because membranes use less
energy than other separation processes. [23]
Page 30
16
Chapter 2
2. Material and Energy Balance
Fig.2-1 Material Balance Diagram
The base of calculation is 100 Kmol/hr of raw natural gas. Stream (F)
Assume that 2 % of raw natural gas containing heavy hydrocarbon. Stream (W1)
For overall material balance:
Then, from the feed gas composition we can calculate:
Then from the feed gas composition we can calculate:
F = P + D + M ……………………………………………………………………………..(2-1)
Where, F= 100 Kmol/hr
We assume the separation conversion is 98%
Then, F + N = W1 ……………………………………………………………………….…(2-2)
Then, W1 = D + R …………………………………………………………………………(2-3)
Fin Fan
Cooler
Membrane System 94%
Conditioned Fuel Gas74% C1
9% C217% C3+
Permeate
Separator
Heavy Hydrocarbonesand Water
Natural Gas
Raw Gas
To Supply Power Stations
Membrane Technology for Fuel Gas Conditioning
CO2= 0.0130H2S= 0.0050
C1= 0.7250C2= 0.0950C3= 0.0990i-C4= 0.0240
n-C4= 0.0250n-C5= 0.0130H2O= 0.0010
C3+
D = 2.082466 Kmol/hr
P = 93.877551 Kmol/hr
Conversion = 98 %
W1
W2 = 8.163265 Kmol/hr
Stripper
Off GasesM= 4.039983 Kmol/hr
N= 4.123282 Kmol/hr
F= 100.00 Kmol/hr
Page 31
17
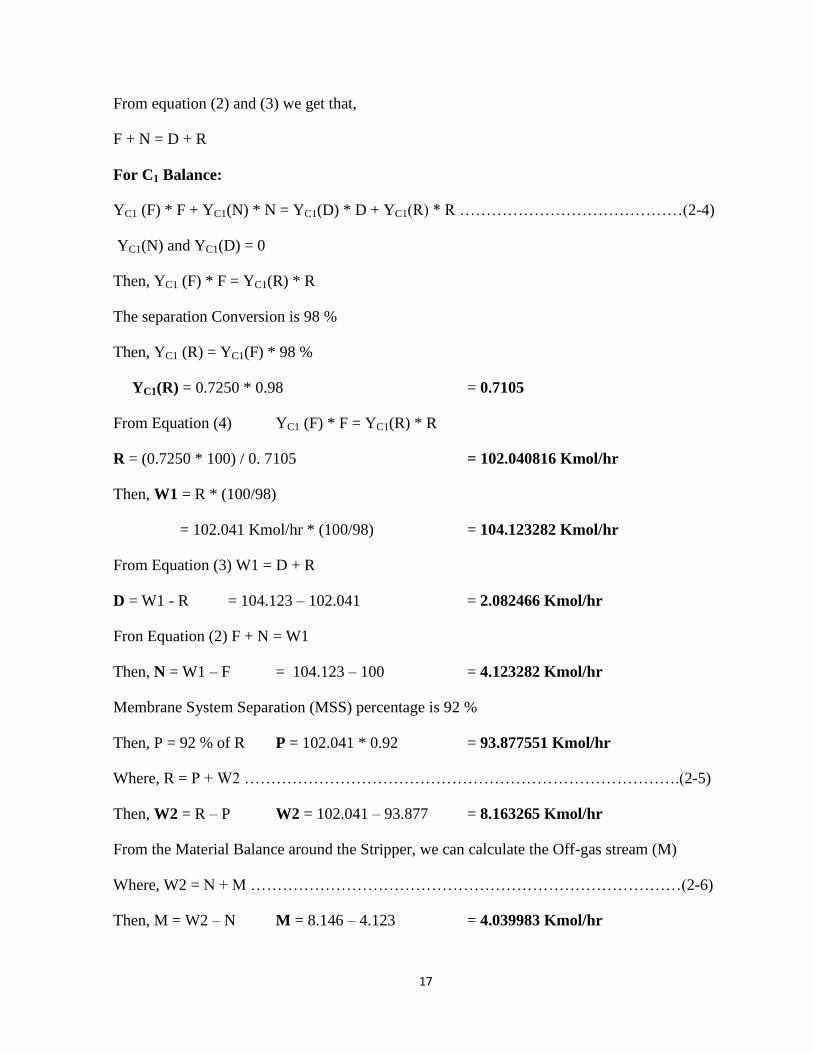
From equation (2) and (3) we get that,
F + N = D + R
For C1 Balance:
YC1 (F) * F + YC1(N) * N = YC1(D) * D + YC1(R) * R ……………………………………(2-4)
YC1(N) and YC1(D) = 0
Then, YC1 (F) * F = YC1(R) * R
The separation Conversion is 98 %
Then, YC1 (R) = YC1(F) * 98 %
YC1(R) = 0.7250 * 0.98 = 0.7105
From Equation (4) YC1 (F) * F = YC1(R) * R
R = (0.7250 * 100) / 0. 7105 = 102.040816 Kmol/hr
Then, W1 = R * (100/98)
= 102.041 Kmol/hr * (100/98) = 104.123282 Kmol/hr
From Equation (3) W1 = D + R
D = W1 - R = 104.123 – 102.041 = 2.082466 Kmol/hr
Fron Equation (2) F + N = W1
Then, N = W1 – F = 104.123 – 100 = 4.123282 Kmol/hr
Membrane System Separation (MSS) percentage is 92 %
Then, P = 92 % of R P = 102.041 * 0.92 = 93.877551 Kmol/hr
Where, R = P + W2 ……………………………………………………………………….(2-5)
Then, W2 = R – P W2 = 102.041 – 93.877 = 8.163265 Kmol/hr
From the Material Balance around the Stripper, we can calculate the Off-gas stream (M)
Where, W2 = N + M ………………………………………………………………………(2-6)
Then, M = W2 – N M = 8.146 – 4.123 = 4.039983 Kmol/hr
Page 32
18
Fig.2-2 Overall Material Balance
We assume that the percentage of stream P which is:-
C1= 74 % Y(C1) = 0.74
C2 = 09 % Y(C2) = 0.09
C3+ = 17 % Y(C3
+) = 0.17
Total 1.0000
Then, the moles of the stream P components are:-
𝑪𝟏 = 𝑃 ∗ 𝐶1% = 93.877551𝐾𝑚𝑜𝑙
ℎ𝑟 ∗
74
100 = 69.469388 Kmol/hr
𝑪𝟐 = 𝑃 ∗ 𝐶2% = 93.877551𝐾𝑚𝑜𝑙
ℎ𝑟 ∗
9
100 = 8.448979 Kmol/hr
𝑪𝟑+ = 𝑃 ∗ 𝐶3+% = 93.877551𝐾𝑚𝑜𝑙
ℎ𝑟 ∗
17
100 = 15.959183 Kmol/hr
Total 93.877551 Kmol/hr
C1 = 0.74
C2 = 0.09
C3+= 0.17
1.00
F = P + D + M
Overall M. BF= 100 Kmol/hr
P= 93.877551 Kmol/hr
D= 2.082466 Kmol/hr
CO2 = 0.0130H2S = 0.0050
C1 = 0.7250C2 = 0.0950C3 = 0.0990i-C4 = 0.0240
n-C4= 0.0250n-C5= 0.0130H2O = 0.0010
M = 4.039983 Kmol/hr
Page 33
19
Then, 15.959183 Kmol/hr of (C3+) in stream (P) is consisting of the following percentage:-
C3 mole fraction = 94% of (C3+) X 0.17 = 0.1598
C3 quantity = 0.1598 𝑋 𝟏𝟓.𝟗𝟓𝟗𝟏𝟖𝟑
0.17 = 15.001632 Kmol/hr
iC4 mole fraction = 2.4% of (C3+) X 0.17 = 0.00408
iC4 quantity = 0.00408 𝑋 𝟏𝟓.𝟗𝟓𝟗𝟏𝟖𝟑
0.17 = 0.383020 Kmol/hr
nC4 mole fraction = 2.6% of (C3+) X 0.03 = 0.00442
nC4 quantity = 0.00442 𝑋 𝟏𝟓.𝟗𝟓𝟗𝟏𝟖𝟑
0.17 = 0.414938 Kmol/hr
nC5 mole fraction = 0.9% of (C3+) X 0.17 = 0.00153
nC5 quantity = 0.00153 𝑋 𝟏𝟓.𝟗𝟓𝟗𝟏𝟖𝟑
0.17 = 0.143633 Kmol/hr
H2O mole fraction = 0.01 of (C3+) X 0.17 = 0.000017
H2O quantity = 0.000017 𝑋 𝟏𝟓.𝟗𝟓𝟗𝟏𝟖𝟑
0.17 = 0.001596 Kmol/hr
C3+ in stream (P):- i) Total Mole fraction = 0.17
ii) Total Moles = 15.959183 Kmol/hr
To calculate Stream (W1) mole fraction we have to calculations stream (N) mass and
mole fraction as following:-
Streams (F) (Kmol/hr) (N) (Kmol/hr) (N) Mole Frac.(Kmol/hr)
C3 = YC3 x 100 = 9.9 𝑁
𝐹 𝑥 C3(F) = 2.519784
𝐶3 (𝑁)
𝑇𝑜𝑡𝑎𝑙 =
2.519784
4.123282 = 0.611111
iC4 = YiC4 x 100 = 2.4 𝑁
𝐹 𝑥 iC4(F) = 0.610856
𝑖𝐶4 (𝑁)
𝑇𝑜𝑡𝑎𝑙 =
0.610856
4.123282 = 0.148148
nC4 = YnC4 x 100 = 2.5 𝑁
𝐹 𝑥 nC4(F) = 0.636309
𝑛𝐶4 (𝑁)
𝑇𝑜𝑡𝑎𝑙=
0.636309
4.123282 = 0.154321
nC5 = YnC5 x 100 = 1.3 𝑁
𝐹 𝑥 nC5(F) = 0.330881
𝑛𝐶5 (𝑁)
𝑇𝑜𝑡𝑎𝑙=
0.330881
4.123282 = 0.080247
H2O = YH2O x 100 = 0.1 𝑁
𝐹 𝑥 H2O(F) = 0.025452
𝐻2𝑂 (𝑁)
𝑇𝑜𝑡𝑎𝑙=
0.025452
4.123282 = 0.006173
Total 16.2 4.123282 1.000000
Tab. 2-1 Streams Mole. Fractions Calculation
Page 34
20
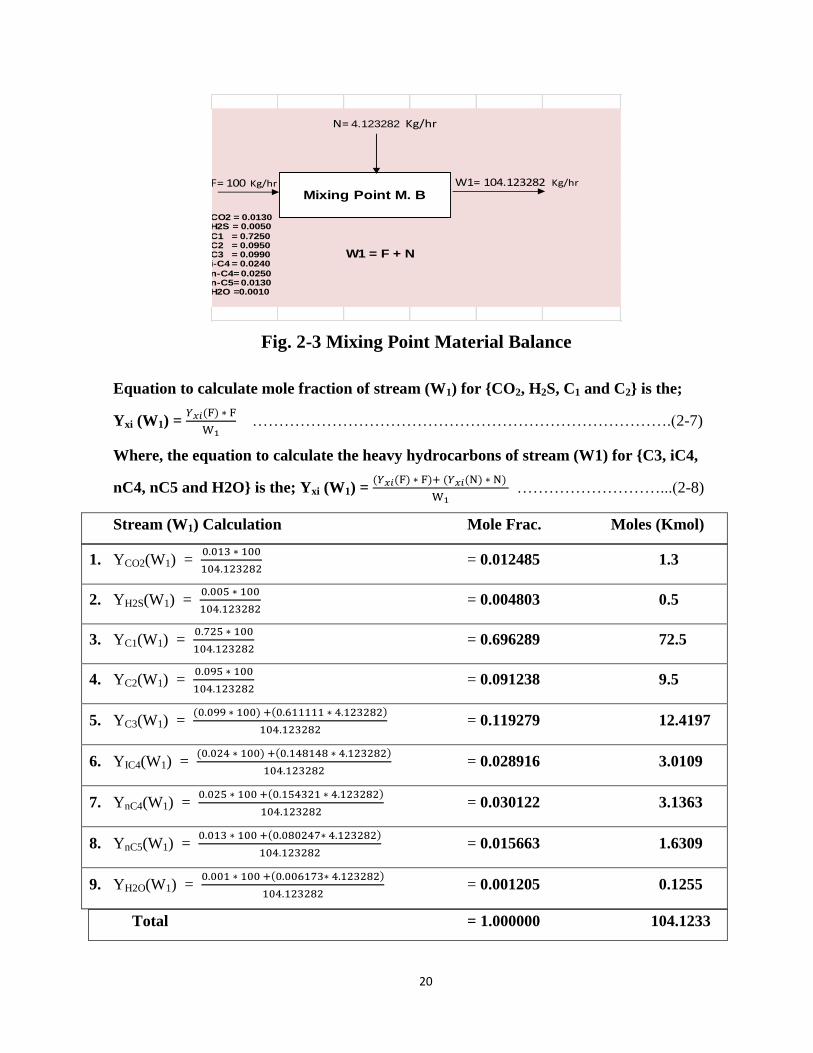
Fig. 2-3 Mixing Point Material Balance
Equation to calculate mole fraction of stream (W1) for {CO2, H2S, C1 and C2} is the;
Yxi (W1) = 𝑌𝑥𝑖(F) ∗ F
W1 …………………………………………………………………….(2-7)
Where, the equation to calculate the heavy hydrocarbons of stream (W1) for {C3, iC4,
nC4, nC5 and H2O} is the; Yxi (W1) = (𝑌𝑥𝑖(F) ∗ F)+ (𝑌𝑥𝑖(N) ∗ N)
W1 ………………………...(2-8)
Stream (W1) Calculation Mole Frac. Moles (Kmol)
1. YCO2(W1) = 0.013 ∗ 100
104.123282 = 0.012485 1.3
2. YH2S(W1) = 0.005 ∗ 100
104.123282 = 0.004803 0.5
3. YC1(W1) = 0.725 ∗ 100
104.123282 = 0.696289 72.5
4. YC2(W1) = 0.095 ∗ 100
104.123282 = 0.091238 9.5
5. YC3(W1) = (0.099 ∗ 100) +(0.611111 ∗ 4.123282)
104.123282 = 0.119279 12.4197
6. YIC4(W1) = (0.024 ∗ 100) +(0.148148 ∗ 4.123282)
104.123282 = 0.028916 3.0109
7. YnC4(W1) = 0.025 ∗ 100 +(0.154321 ∗ 4.123282)
104.123282 = 0.030122 3.1363
8. YnC5(W1) = 0.013 ∗ 100 +(0.080247∗ 4.123282)
104.123282 = 0.015663 1.6309
9. YH2O(W1) = 0.001 ∗ 100 +(0.006173∗ 4.123282)
104.123282 = 0.001205 0.1255
Total = 1.000000 104.1233
W1 = F + N
Mixing Point M. BF= 100 Kg/hr W1= 104.123282 Kg/hr
CO2 = 0.0130H2S = 0.0050
C1 = 0.7250C2 = 0.0950C3 = 0.0990i-C4 = 0.0240
n-C4= 0.0250n-C5= 0.0130H2O =0.0010
N= 4.123282 Kg/hr
Page 35
21
Tab. 2-2 Stream (W1) Calculation
Stream (D) mole fraction calculations:-
Fig. 2-4 Stream (D) mole fraction calculations
Streams (W1) (Kmol/hr) (D) (Kmol/hr) (D) Mole Frac
YCO2(W1) = 1.3 YCO2(D) = 1.3 x 0.02 = 0.0260 𝐶𝑂2 (𝐷)
𝑇𝑜𝑡𝑎𝑙= 0.012466
YH2S(W1) = 0.5 YH2S(D) = 0.5 x 0.02 = 0.0100 𝐻2𝑆 (𝐷)
𝑇𝑜𝑡𝑎𝑙= 0.004806
YC1(W1) = 72.5 YC1(D) = 72.5 x 0.2 = 1.4500 𝐶1 (𝐷 )
𝑇𝑜𝑡𝑎𝑙= 0.696314
YC2(W1) = 9.5 YC2(D) = 9.5 x 0.02 = 0.1900 𝐶2 (𝐷)
𝑇𝑜𝑡𝑎𝑙= 0.091248
YC3(W1) = 12.4197 YC3(D) = 12.4197 x 0.02 = 0.2484 𝐶3 (𝐷)
𝑇𝑜𝑡𝑎𝑙= 0.119285
YIC4(W1) = 3.0109 YIC4(D) = 3.0109 x 0.02 = 0.0602 𝑖𝐶4 (𝐷)
𝑇𝑜𝑡𝑎𝑙= 0.028911
YnC4(W1) = 3.1363 YnC4(D) = 3.1363 x 0.02 = 0.0627 𝑛𝐶4 (𝐷)
𝑇𝑜𝑡𝑎𝑙= 0.030112
YnC5(W1) = 1.6309 YnC5(D) = 1.6309 x 0.02 = 0.0326 𝑛𝐶5 (𝐷)
𝑇𝑜𝑡𝑎𝑙= 0.015655
YH2O(W1) = 0.1255 YH2O(D) = 0.1255 x 0.02 = 0.0025 𝐻2𝑂 (𝐷)
𝑇𝑜𝑡𝑎𝑙= 0.001203
Total 104.1233 2.0824 1.000000
Tab. 2-3 Stream (D) Calculation
W1= 104.123282 Kmol/hr
R = 102.041816 Kmol/hr
D = 2.082466 Kmol/hr
Se
pa
rato
r9
8 %
CO2 = 0.012485H2S = 0.004803
C1 = 0.696289C2 = 0.091238C3 = 0.119279i-C4 = 0.028916
n-C4 = 0.030122n-C5 = 0.015663H2O = 0.001205
1.000000
Page 36
22
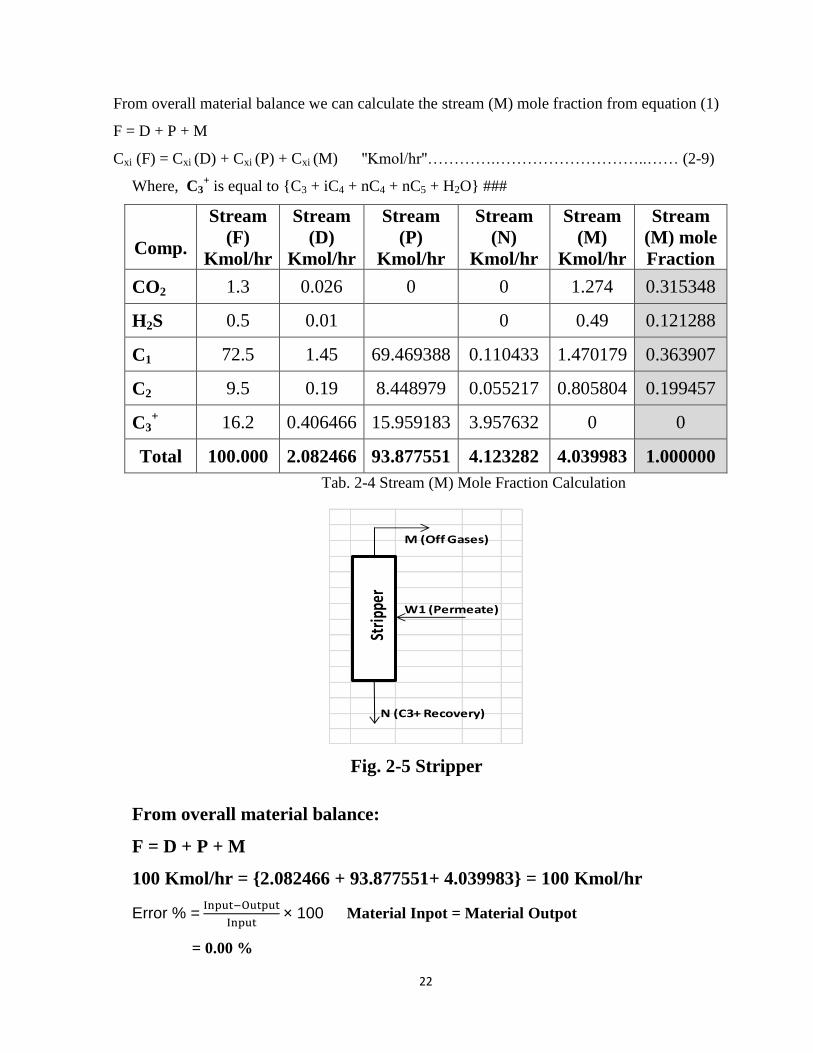
From overall material balance we can calculate the stream (M) mole fraction from equation (1)
F = D + P + M
Cxi (F) = Cxi (D) + Cxi (P) + Cxi (M) ''Kmol/hr''………….………………………..…… (2-9)
Where, C3+ is equal to {C3 + iC4 + nC4 + nC5 + H2O} ###
Comp.
Stream
(F)
Kmol/hr
Stream
(D)
Kmol/hr
Stream
(P)
Kmol/hr
Stream
(N)
Kmol/hr
Stream
(M)
Kmol/hr
Stream
(M) mole
Fraction
CO2 1.3 0.026 0 0 1.274 0.315348
H2S 0.5 0.01 0 0.49 0.121288
C1 72.5 1.45 69.469388 0.110433 1.470179 0.363907
C2 9.5 0.19 8.448979 0.055217 0.805804 0.199457
C3+ 16.2 0.406466 15.959183 3.957632 0 0
Total 100.000 2.082466 93.877551 4.123282 4.039983 1.000000
Tab. 2-4 Stream (M) Mole Fraction Calculation
Fig. 2-5 Stripper
From overall material balance:
F = D + P + M
100 Kmol/hr = {2.082466 + 93.877551+ 4.039983} = 100 Kmol/hr
Error % = Input−Output
Input × 100 Material Inpot = Material Outpot
= 0.00 %
Strip
per
W1 (Permeate)
M (Off Gases)
N (C3+ Recovery)
Page 37
23
2.1. Calculation of dew and bubble points:
Only sufficient trial Calculation will be made to illustrate the method used.
For the same basis in material balance which equals to 100 kmol/hr of feed:
Estimation of dew and bubble points:
Bubble point ∑ xi = ∑ Kixi = 1.0
Dew point ∑ yi = ∑ yi / Ki = 1.0
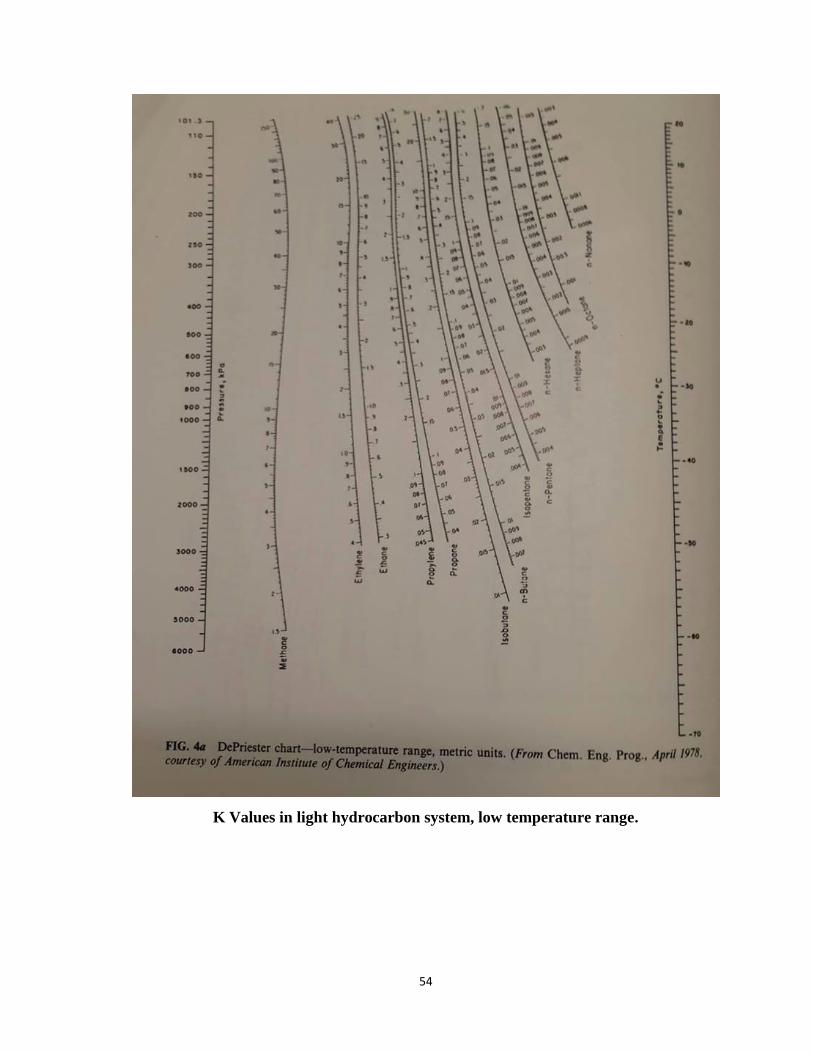
The K values are taken from the DePriester charts. (Appendix – A)
For stream (D)
Tab. 2-5, Stream (D) Bubble Point Calculation
For stream (P)
Tab. 2-6, Stream (P) Dew Point Calculation
com's xi ki @ 80 oC xi * ki ki @ 90 oC xi * ki ki @ 85 oC xi * ki
800 Kpa 800KPa
C1 …… 26 33 32.5
C2 …… 7.2 15 14.9
C3 0.0944 3.1 0.29264 8 0.7552 7.9 0.74576
I-C4 0.0228 1.6 0.03648 5 0.114 4.9 0.11172
N-C4 0.0237 1.2 0.02844 4.3 0.10191 4.4 0.10428
N-C5 0.0123 0.49 0.006027 2.35 0.028905 2.5 0.03075
total 0.363587 1.000015 0.99251
Estimate the Bubble Point of Stream (D)
com's Yi ki @ -25 oC ki @ -20 Oc yi / ki ki @ -15 oC yi / ki
800 Kpa 800 Kpa 800 Kpa
C1 0.7366 12.5 0.058928 13 0.05666154 13.3 0.055383459
C2 0.1508 1.4 0.107714286 1.5 0.10053333 1.6 0.09425
C3 0.0581 0.28 0.2075 0.33 0.17606061 0.38 0.152894737
I-C4 0.0141 0.09 0.156666667 0.18 0.07833333 0.13 0.108461538
N-C4 0.0147 0.054 0.272222222 0.068 0.21617647 0.076 0.193421053
N-C5 0.0076 0.0134 0.567164179 0.016 0.475 0.01921 0.395627277
total 1.370195354 1.10276528 1.000038064
Estimate the Dew Point of Stream (P)
Page 38
24
2.2. The Energy Balance data:
1) The temperature of streams F, P , D and M
2) Enthalpy calculations for gaseous streams are according to the equation:
H= T
T
nCpdT0
(KJ/hr)
Where:
Cp = a + bt + cT2
J/K mol ºC
H = Enthalpy change from T toT0 (KJ/hr)
n = Molar flow rate (K mol/hr)
T = Temperature of stream
To = Reference temperature, taken at 25 ºC
a, b and c = Constants of Heat capacity.
Fig. 2.6 Membrane Energy Balance
Cp= a (T-TO)+ 2b (T
2-TO
2)+ 3
C (T3-TO
3) ……………………………………(2-10)
HF =∑( n * (Cp) *T) ……………………………………………………………(2-11)
See Index (B) Heat Capacity Constants values
25 oC
20 oC R
25 Oc
100 = 100
# # #
Input = Outpot
F = D + P + M
100 = 2.082466 + 93.877551 + 4.039983
Membrane Unit
D = 2.082466 kmol/hr
F = 100 kmol/hr
P = 93.877551 kmol/hr
M = 4.039983 kmol/hr
Page 39
25
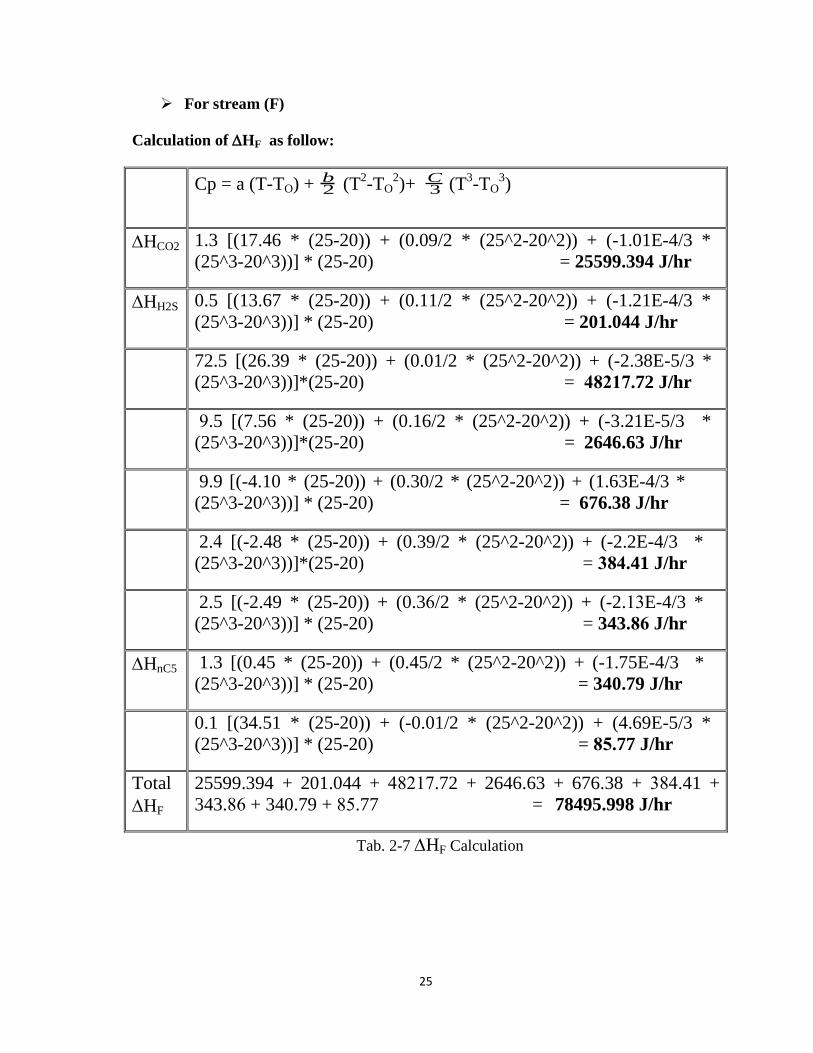
For stream (F)
Calculation of HF as follow:
Cp = a (T-TO) + 2b (T
2-TO
2)+ 3
C (T3-TO
3)
Hf =∑( n * (Cp) *T)
1.3 [(17.46 * (25-20)) + (0.09/2 * (25^2-20^2)) + (-1.01E-4/3 *
(25^3-20^3))] * (25-20) = 25599.394 J/hr HCO2
0.5 [(13.67 * (25-20)) + (0.11/2 * (25^2-20^2)) + (-1.21E-4/3 *
(25^3-20^3))] * (25-20) = 201.044 J/hr HH2S
72.5 [(26.39 * (25-20)) + (0.01/2 * (25^2-20^2)) + (-2.38E-5/3 *
(25^3-20^3))]*(25-20) = 48217.72 J/hr
HC1 9.5 [(7.56 * (25-20)) + (0.16/2 * (25^2-20^2)) + (-3.21E-5/3 *
(25^3-20^3))]*(25-20) = 2646.63 J/hr
HC2 9.9 [(-4.10 * (25-20)) + (0.30/2 * (25^2-20^2)) + (1.63E-4/3 *
(25^3-20^3))] * (25-20) = 676.38 J/hr
HC3 2.4 [(-2.48 * (25-20)) + (0.39/2 * (25^2-20^2)) + (-2.2E-4/3 *
(25^3-20^3))]*(25-20) = 384.41 J/hr
HiC4 2.5 [(-2.49 * (25-20)) + (0.36/2 * (25^2-20^2)) + (-2.13E-4/3 *
(25^3-20^3))] * (25-20) = 343.86 J/hr
HnC4 1.3 [(0.45 * (25-20)) + (0.45/2 * (25^2-20^2)) + (-1.75E-4/3 *
(25^3-20^3))] * (25-20) = 340.79 J/hr HnC5
0.1 [(34.51 * (25-20)) + (-0.01/2 * (25^2-20^2)) + (4.69E-5/3 *
(25^3-20^3))] * (25-20) = 85.77 J/hr
HH2O 25599.394 + 201.044 + 48217.72 + 2646.63 + 676.38 + 384.41 +
343.86 + 340.79 + 85.77 = 78495.998 J/hr
= 78.495998 KJ/hr
Total
HF
Tab. 2-7 HF Calculation
Page 40
26
For stream (D)
Calculation of HD as follow:
Cp = a (T-TO) + 2b (T
2-TO
2) + 3
C (T3-TO
3)
HD = ∑( n * (Cp) *T)
0.026 [(17.46 * (20-25)) + (0.09/2 * (20^2-25^2)) + (-1.01E-4/3 *
(20^3-25^3))] * (20-25) = 12.632 J/hr HC O2
0.01 [(13.67 * (20-25)) + (0.11/2 * (20^2-25^2)) + (-1.21E-4/3 *
(20^3-25^3))] * (20-25) = 3.402 J/hr HH2S
1 .45 [(26.39 * (20-25)) + (0.1/2 * (20^2-25^2)) + (-2.38E-5/3 *
(20^3-25^3))] * (20-25) = 9758.1345 J/hr HC1
0.19 [(7.56 * (20-25)) + (0.16/2 * (20^2-25^2)) + (-3.21E-5/3 *
(20^3-25^3))] * (20-25) = 52.933 J/hr HC2
0.2484 [(-4.1 * (20-25)) + (0.3/2 * (20^2-25^2)) + (1.63E-4/3 *
(20^3-25^3))] * (20-25) = 16.772 J/hr
HC3
0.0602 [(-2.48 * (20-25)) + (0.39/2 * (20^2-25^2)) + (-2.2E-4/3 *
(20^3-25^3))] * (20-25) = 9.306 J/hr HiC4
0.0627 [(-2.48 * (20-25)) + (0.39/2 * (20^2-25^2)) + (-2.2E-4/3 *
(20^3-25^3))] * (20-25) = 9.692 J/hr HnC4
0.0326 [(0.45 * (20-25)) + (0.45/2 * (20^2-25^2)) + (-1.75E-4/3 *
(20^3-25^3))] * (20-25) = 8.5462 J/hr HnC5
0.0025 [(34.51 * (20-25)) + (-0.01/2 * (20^2-25^2)) + (4.69E-5/3 *
(20^3-25^3))] * (20-25) = 2.1443 J/hr HH2O
11.789 + 3.402 + 9758.1345 + 52.933 + 16.772 + 9.306 + 9.692 +
8.5462 + 2.1443 = 9872.719 J/hr
= 9.872719 KJ/hr
Total
HD
Tab. 2-8 HD Calculation
Page 41
27
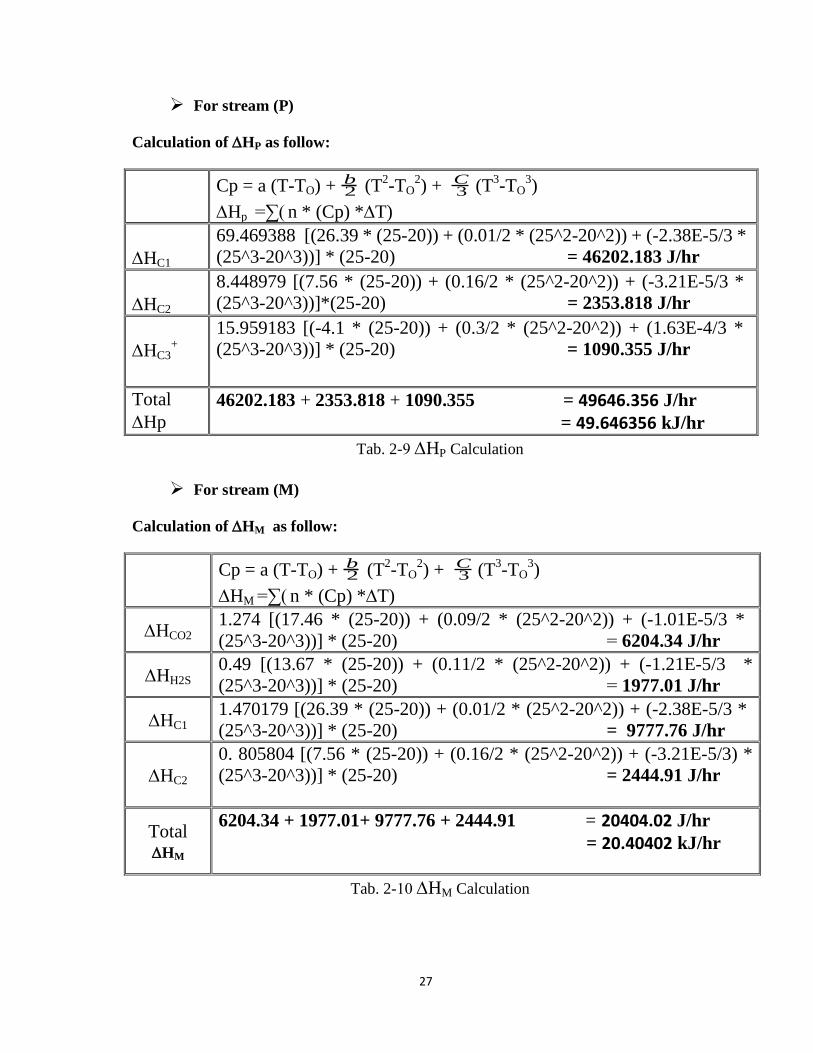
For stream (P)
Calculation of HP as follow:
Cp = a (T-TO) + 2b (T
2-TO
2) + 3
C (T3-TO
3)
Hp =∑( n * (Cp) *T)
69.469388 [(26.39 * (25-20)) + (0.01/2 * (25^2-20^2)) + (-2.38E-5/3 *
(25^3-20^3))] * (25-20) = 46202.183 J/hr
HC1
8.448979 [(7.56 * (25-20)) + (0.16/2 * (25^2-20^2)) + (-3.21E-5/3 *
(25^3-20^3))]*(25-20) = 2353.818 J/hr
HC2
15.959183 [(-4.1 * (25-20)) + (0.3/2 * (25^2-20^2)) + (1.63E-4/3 *
(25^3-20^3))] * (25-20) = 1090.355 J/hr
HC3+
46202.183 + 2353.818 + 1090.355 = 49646.356 J/hr
= 49.646356 kJ/hr
Total
Hp
Tab. 2-9 HP Calculation
For stream (M)
Calculation of HM as follow:
Cp = a (T-TO) + 2b (T
2-TO
2) + 3
C (T3-TO
3)
HM =∑( n * (Cp) *T)
1.274 [(17.46 * (25-20)) + (0.09/2 * (25^2-20^2)) + (-1.01E-5/3 *
(25^3-20^3))] * (25-20) = 6204.34 J/hr HCO2
0.49 [(13.67 * (25-20)) + (0.11/2 * (25^2-20^2)) + (-1.21E-5/3 *
(25^3-20^3))] * (25-20) = 1977.01 J/hr HH2S
1.470179 [(26.39 * (25-20)) + (0.01/2 * (25^2-20^2)) + (-2.38E-5/3 *
(25^3-20^3))] * (25-20) = 9777.76 J/hr HC1
0. 805804 [(7.56 * (25-20)) + (0.16/2 * (25^2-20^2)) + (-3.21E-5/3) *
(25^3-20^3))] * (25-20) = 2444.91 J/hr HC2
6204.34 + 1977.01+ 9777.76 + 2444.91 = 20404.02 J/hr
= 20.40402 kJ/hr Total HM
Tab. 2-10 HM Calculation
Page 42
28
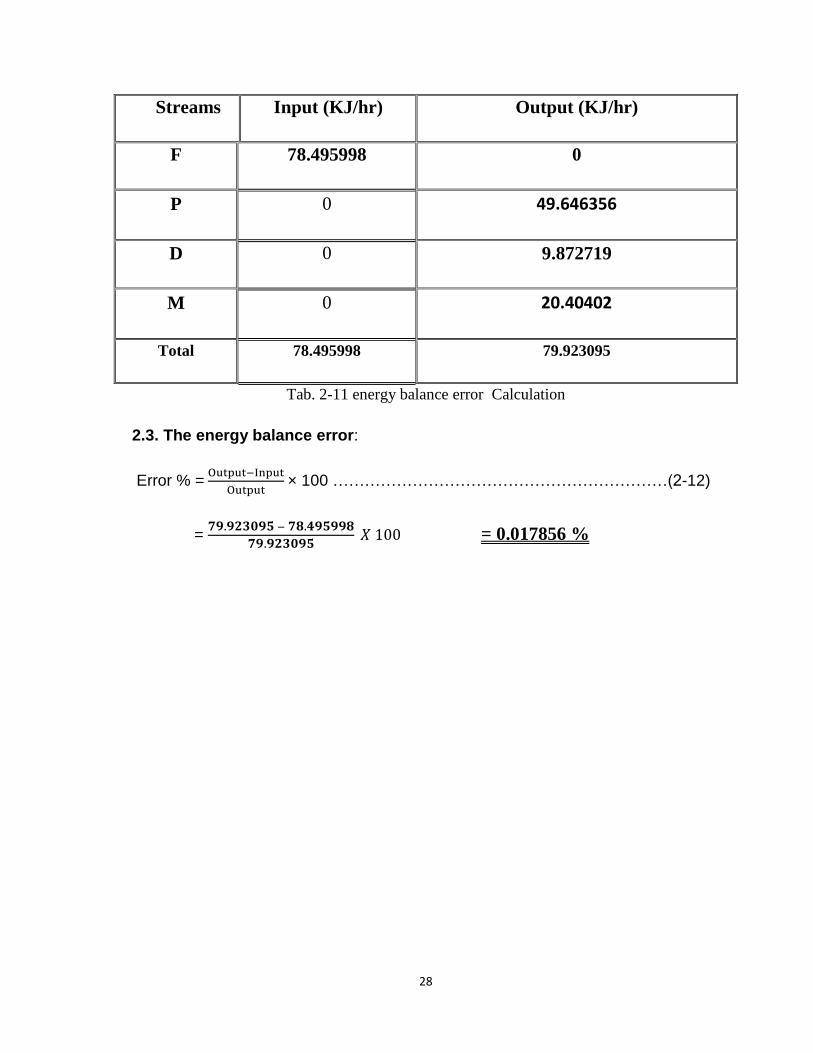
Output (KJ/hr) Input (KJ/hr) Streams
0 78.495998 F
49.646356 0 P
9.872719 0 D
20.40402 0 M
79.923095 78.495998 Total
Tab. 2-11 energy balance error Calculation
2.3. The energy balance error:
Error % = Output−Input
Output × 100 ………………………………………………………(2-12)
= 𝟕𝟗.𝟗𝟐𝟑𝟎𝟗𝟓 − 𝟕𝟖.𝟒𝟗𝟓𝟗𝟗𝟖
𝟕𝟗.𝟗𝟐𝟑𝟎𝟗𝟓 𝑋 100 = 0.017856 %
Page 43
29
Chapter 3
3. Separator Unit Process Design
3.1. Principles of Separation:
Three principles used to achieve physical separation of gas and liquids or solids are
momentum, gravity settling, and coalescing.
Any separator may employ one or more of these principles, but the fluid phases must be
"immiscible" and have different densities for separation to occur.
3.2. Vertical Separator Parts:
Regardless of shape, separation vessels usually contain four major sections, [4]
The primary separation section, A, is used to separate the main portion of free liquid
in the inlet stream. It contains the inlet nozzle which may be tangential, or a diverter
baffle to take advantage of the inertial effects of centrifugal force or an abrupt
change of direction to separate the major portion of the liquid from the gas stream.
The secondary or gravity section, B, is designed to utilize the force of gravity to
enhance separation of entrained droplets. It consists of a portion of the vessel
through which the gas moves at a relatively low velocity with little turbulence. In
some designs, straightening vanes are used to reduce turbulence.
The coalescing section, C, utilizes a coalescer or mist extractor which can consist of
a series of vanes, a knitted wire mesh pad, or cyclonic passages. This section
removes the very small droplets of liquid from the gas by impingement on a surface
where they coalesce. A typical liquid carryover from the mist extractor is less than
0.013 ml per m3.
The sump or liquid collection section, D, acts as receiver for all liquid removed
from the gas in the primary, secondary, and coalescing sections. [3]
Page 44
30
3.3. Gas-Liquid Separator Design
3.3.1. Specifying Separators
Separator designers need to know pressure, temperature, flow rates, and physical
properties of the streams as well as the degree of separation required. It is also prudent
to define if these conditions all occur at the same time or if there are only certain
combinations that can exist at any time. If known, the type and amount of liquid should
also be given, and whether it is mist, free liquid, or slugs. [4]
The following steps were used in mechanical design of the separator that to remove
about 2.082466 Kmol/hr of heavy hydrocarbons and water from the bottom to
condensate bit for tail process and select about 102.040816 Kmol/hr of free gas from
the top of the separator for next gas conditioning process. The total capacity of the
separator is 104.123282 Kmol/hr.
Fig. 3-1 Separator Cross Section View
Gas Inlet
Clean Out
Inspection
Vapor Outlet
Liquid Outlet
104.123282 Kmol/hr
102.040816 Kmol/hr
2.082466 Kmol/hr
98 % Conversion
Page 45
31
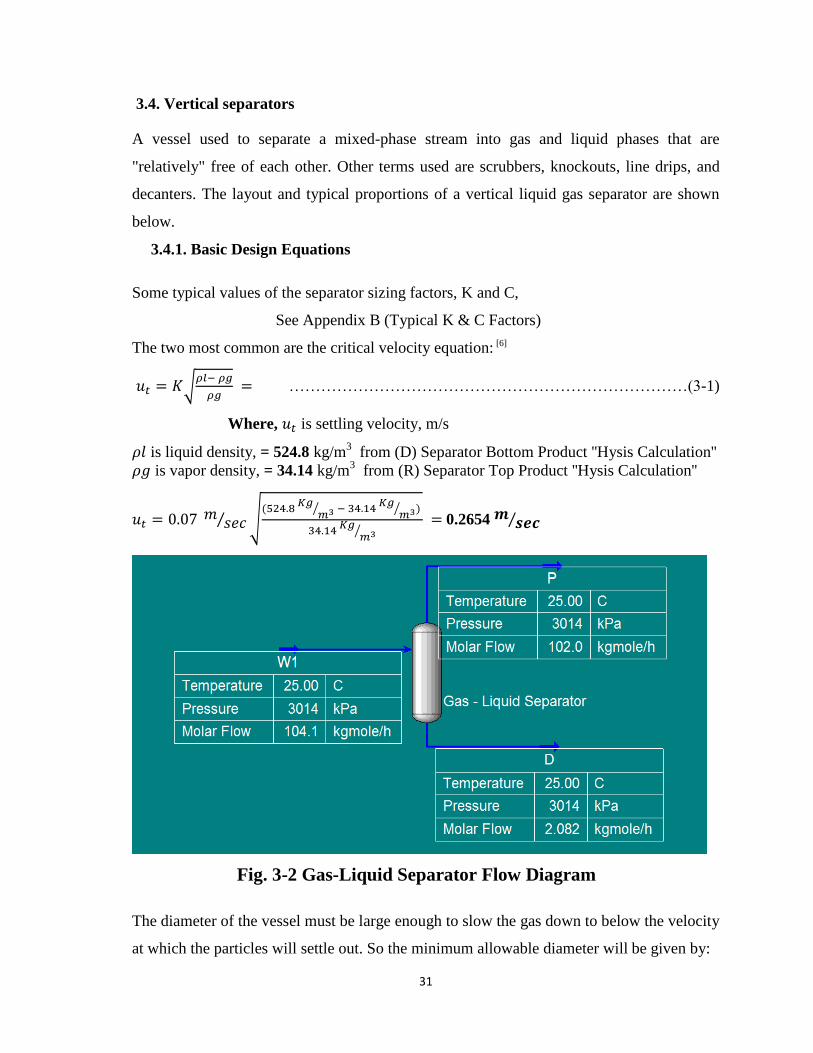
3.4. Vertical separators
A vessel used to separate a mixed-phase stream into gas and liquid phases that are
"relatively" free of each other. Other terms used are scrubbers, knockouts, line drips, and
decanters. The layout and typical proportions of a vertical liquid gas separator are shown
below.
3.4.1. Basic Design Equations
Some typical values of the separator sizing factors, K and C,
See Appendix B (Typical K & C Factors)
The two most common are the critical velocity equation: [6]
𝑢𝑡 = 𝐾√𝜌𝑙− 𝜌𝑔
𝜌𝑔 = …………………………………………………………………(3-1)
Where, 𝑢𝑡 is settling velocity, m/s
𝜌𝑙 is liquid density, = 524.8 kg/m3 from (D) Separator Bottom Product ''Hysis Calculation''
𝜌𝑔 is vapor density, = 34.14 kg/m3 from (R) Separator Top Product ''Hysis Calculation''
𝑢𝑡 = 0.07 𝑚𝑠𝑒𝑐⁄ √
(524.8 𝐾𝑔
𝑚3⁄ − 34.14 𝐾𝑔
𝑚3⁄ )
34.14 𝐾𝑔
𝑚3⁄ = 0.2654 𝒎 𝒔𝒆𝒄⁄
Fig. 3-2 Gas-Liquid Separator Flow Diagram
The diameter of the vessel must be large enough to slow the gas down to below the velocity
at which the particles will settle out. So the minimum allowable diameter will be given by:
Page 46
32
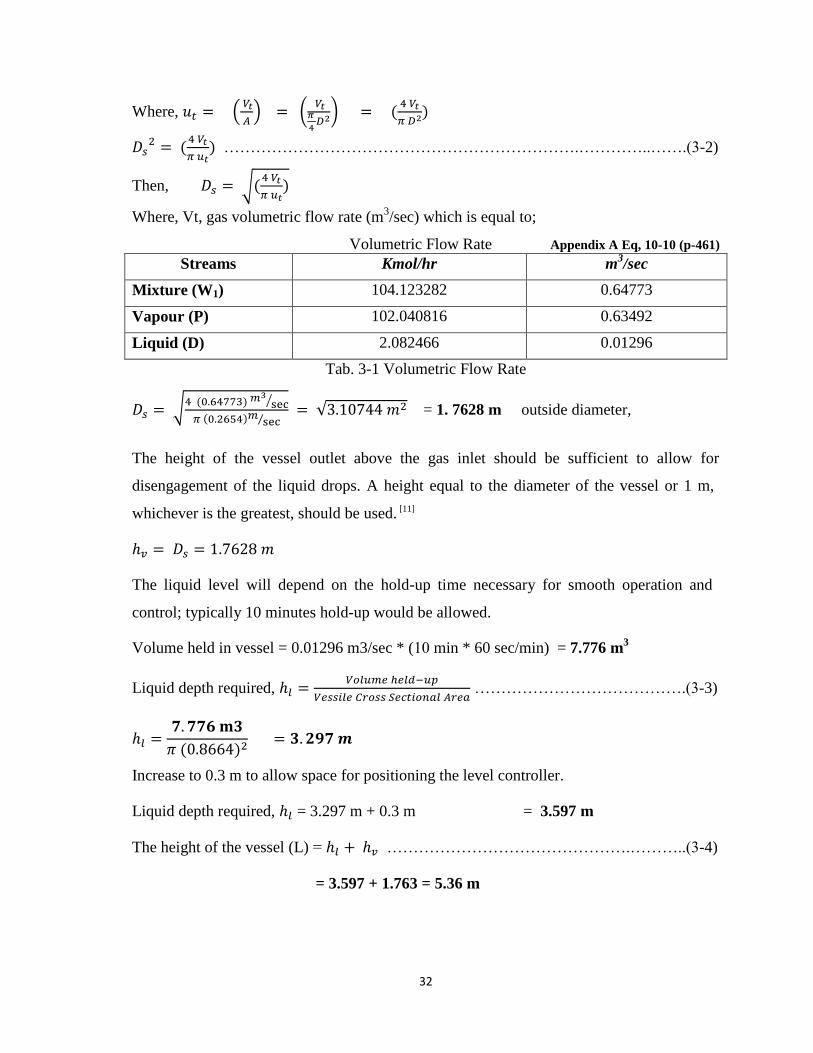
Where, 𝑢𝑡 = ( 𝑉𝑡
𝐴) = (
𝑉𝑡𝜋
4𝐷2
) = (4 𝑉𝑡
𝜋 𝐷2)
𝐷𝑠2 = (
4 𝑉𝑡
𝜋 𝑢𝑡) ………………………………………………………….…………..…….(3-2)
Then, 𝐷𝑠 = √(4 𝑉𝑡
𝜋 𝑢𝑡)
Where, Vt, gas volumetric flow rate (m3/sec) which is equal to;
Volumetric Flow Rate Appendix A Eq, 10-10 (p-461)
Streams Kmol/hr m3/sec
Mixture (W1) 104.123282 0.64773
Vapour (P) 102.040816 0.63492
Liquid (D) 2.082466 0.01296
Tab. 3-1 Volumetric Flow Rate
𝐷𝑠 = √4 (0.64773) 𝑚3
sec ⁄
𝜋 (0.2654)𝑚sec ⁄
= √3.10744 𝑚2 = 1. 7628 m outside diameter,
The height of the vessel outlet above the gas inlet should be sufficient to allow for
disengagement of the liquid drops. A height equal to the diameter of the vessel or 1 m,
whichever is the greatest, should be used. [11]
ℎ𝑣 = 𝐷𝑠 = 1.7628 𝑚
The liquid level will depend on the hold-up time necessary for smooth operation and
control; typically 10 minutes hold-up would be allowed.
Volume held in vessel = 0.01296 m3/sec * (10 min * 60 sec/min) = 7.776 m3
Liquid depth required, ℎ𝑙 =𝑉𝑜𝑙𝑢𝑚𝑒 ℎ𝑒𝑙𝑑−𝑢𝑝
𝑉𝑒𝑠𝑠𝑖𝑙𝑒 𝐶𝑟𝑜𝑠𝑠 𝑆𝑒𝑐𝑡𝑖𝑜𝑛𝑎𝑙 𝐴𝑟𝑒𝑎 ………………………………….(3-3)
ℎ𝑙 =𝟕. 𝟕𝟕𝟔 𝐦𝟑
𝜋 (0.8664)2 = 𝟑. 𝟐𝟗𝟕 𝒎
Increase to 0.3 m to allow space for positioning the level controller.
Liquid depth required, ℎ𝑙 = 3.297 m + 0.3 m = 3.597 m
The height of the vessel (L) = ℎ𝑙 + ℎ𝑣 ……………………………………….………..(3-4)
= 3.597 + 1.763 = 5.36 m
Page 47
33
3.5. Thickness of the Shell:
To calculate the value for the thickness. The following equation ratio was estimated:
4𝐿
𝑑𝑜=
𝑑𝑜
𝑡 ………………………………………….…………………………………..(3-5)
𝑡ℎ𝑒𝑛, 𝑡 = (0.8664)2
4∗5.36 = 𝟎. 𝟎𝟏𝟐𝟑 𝐦 = 12.3 mm
To estimate the pressure, which the thickness assumed can be taken:
𝑃𝑎𝑙𝑙𝑜𝑤 =𝐵
𝑑𝑜 𝑡⁄ …………………………………………………………………..(3-6)
𝑾𝒉𝒆𝒓𝒆: 𝐵= 31000 𝑟𝑜𝑚 𝑡ℎ𝑒 𝑔𝑟𝑎𝑝ℎ 𝑃. 153 is a constant according to the material
of construction with the ratio which were tested at temperature of (158 ℃) in the
evaporator. The value of pressure allowed is close to atmospheric pressure, then
the assumed value of the thickness.
Inside diameter (d) = Outside diameter (do) - Thickness (t)
= 1.7628 – (2 * 0.0123) = 1.7382 m
Height of the separator (L) = 5.36 m
𝑃𝑙𝑙𝑜𝑤 =𝐵
𝑑𝑜 𝑡⁄ ………………………………………………...……………..(3-7)
= 31000
0.8664 0.0123⁄ = 𝟒𝟒𝟎 psig
3.6.Design for the A torispherical dished closure (cover)
The radius of dish (Radius of curvature) ''r''
r = do – 2t …………………………………………………………………………(3-8)
= 0.8664 – 2(0.0123) = 0.8418 m
Dish thickness at atmospheric pressure (tdish) = 𝑝∗ 𝑑𝑜
𝐵 …………………...……….(3-9)
= 14.7 ∗ 0.8664
31000 = 0.0123 m
Since the assumed corrosion thickness = 3 mm
So, the total thickness of dish = 4.1 mm + 3 mm = 7.1 mm
The minimum thickness of the shell constructed from stainless steel were the diameter of
shell is more than (1 m) is equal to (8 mm).
So, the thickness of (7.1 mm) should be taken as (8 mm), and for the allowance of pressure
choosing thickness of (10 mm).
Page 48
34
Chapter 4
4. Instrumentation and Control
Instruments are provided to monitor the key process variables during plant operation. They
may be incorporated in automatic control loops, or used for the manual monitoring of the
process operation. Instruments monitoring critical process variables will be fitted with
automatic alarms to alert the operators to critical and hazardous situations.
It is desirable that the process variable to be monitored be measured directly; often,
however, this is impractical and some dependent variable, that is easier to measure, is
monitored in its place. For example, in the control of distillation columns the continuous,
on-line, analysis of the overhead product is desirable but difficult and expensive to achieve
reliably, so temperature is often monitored as an indication of composition. The
temperature instrument may form part of a control loop controlling, say, reflex flow; with
the composition of the overheads checked frequently by sampling and laboratory analysis.
4.1 Instrumentation and control objectives
The primary objectives of the designer when specifying instrumentation and control
schemes are: [17]
4.2 Safe plant operation:
a) To keep the process variables within known safe operating limits.
b) To detect dangerous situations as they develop and to provide alarms and
automatic shut-down systems.
c) To provide interlocks and alarms to prevent dangerous operating
procedures.
4.3 Production rate:
To achieve the design product output, the material balance shows the up and down
streams rate for on-spike quality production.
Page 49
35
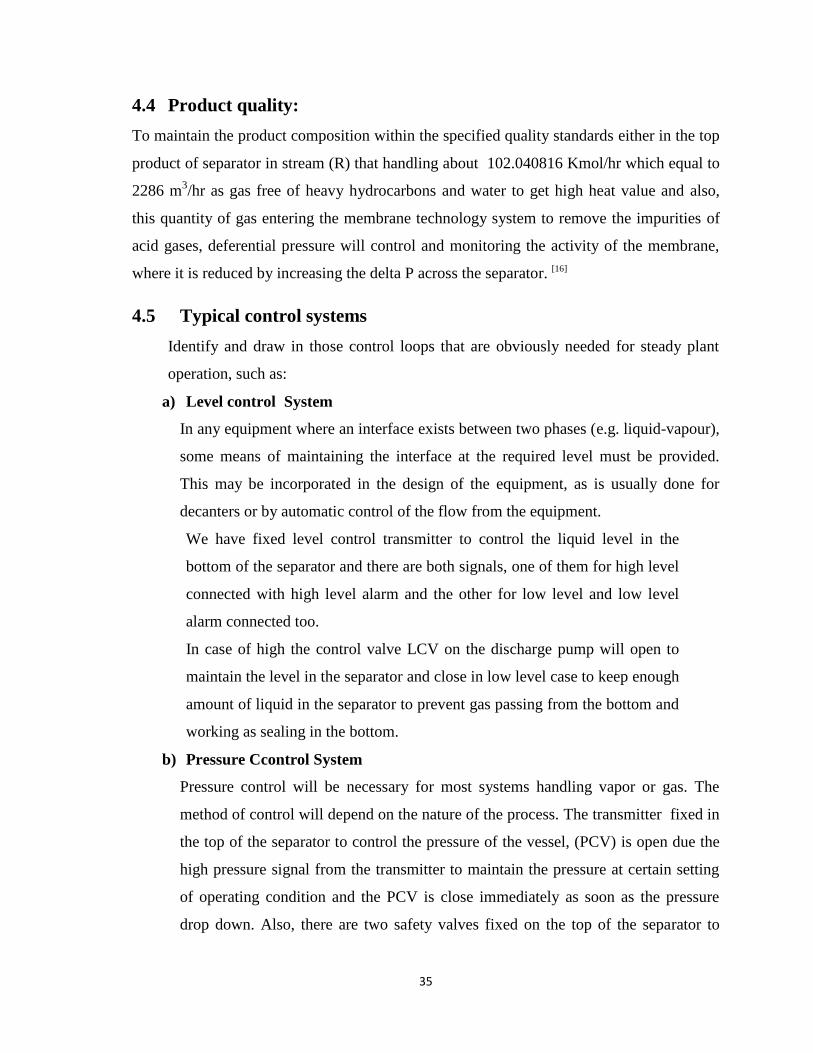
4.4 Product quality:
To maintain the product composition within the specified quality standards either in the top
product of separator in stream (R) that handling about 102.040816 Kmol/hr which equal to
2286 m3/hr as gas free of heavy hydrocarbons and water to get high heat value and also,
this quantity of gas entering the membrane technology system to remove the impurities of
acid gases, deferential pressure will control and monitoring the activity of the membrane,
where it is reduced by increasing the delta P across the separator. [16]
4.5 Typical control systems
Identify and draw in those control loops that are obviously needed for steady plant
operation, such as:
a) Level control System
In any equipment where an interface exists between two phases (e.g. liquid-vapour),
some means of maintaining the interface at the required level must be provided.
This may be incorporated in the design of the equipment, as is usually done for
decanters or by automatic control of the flow from the equipment.
We have fixed level control transmitter to control the liquid level in the
bottom of the separator and there are both signals, one of them for high level
connected with high level alarm and the other for low level and low level
alarm connected too.
In case of high the control valve LCV on the discharge pump will open to
maintain the level in the separator and close in low level case to keep enough
amount of liquid in the separator to prevent gas passing from the bottom and
working as sealing in the bottom.
b) Pressure Ccontrol System
Pressure control will be necessary for most systems handling vapor or gas. The
method of control will depend on the nature of the process. The transmitter fixed in
the top of the separator to control the pressure of the vessel, (PCV) is open due the
high pressure signal from the transmitter to maintain the pressure at certain setting
of operating condition and the PCV is close immediately as soon as the pressure
drop down. Also, there are two safety valves fixed on the top of the separator to
Page 50
36
release any sudden increase in pressure above the set point to prevent damage in the
vessel and recycle the excess gas released to the suction of compressor or to the
flare header.
c) Temperature control System
The temperature controlled by varying the flow of the cooling or heating
medium. So, in our process sea water (S/W) is used as cooling media, it is
control by TCV on the S/W downstream of the gas cooler. [25]
If the temperature of process gas indicated increase the transmitter send
signal to the TCV to open and pass more cooling water to reduce the
temperature to the normal setting on the other hand the TCV close to reduce
the water flow and increase the process gas temperature.
Fig. 4.1 common control system
Stream D
Level Control Valve
LCV
Pressure Control Valve PCV
Liquid Out
Stream R
Sep
arat
or
Cooler
Temperature Control Valve
TCV
Stream W1
S/W In
S/W Out
Page 51
37
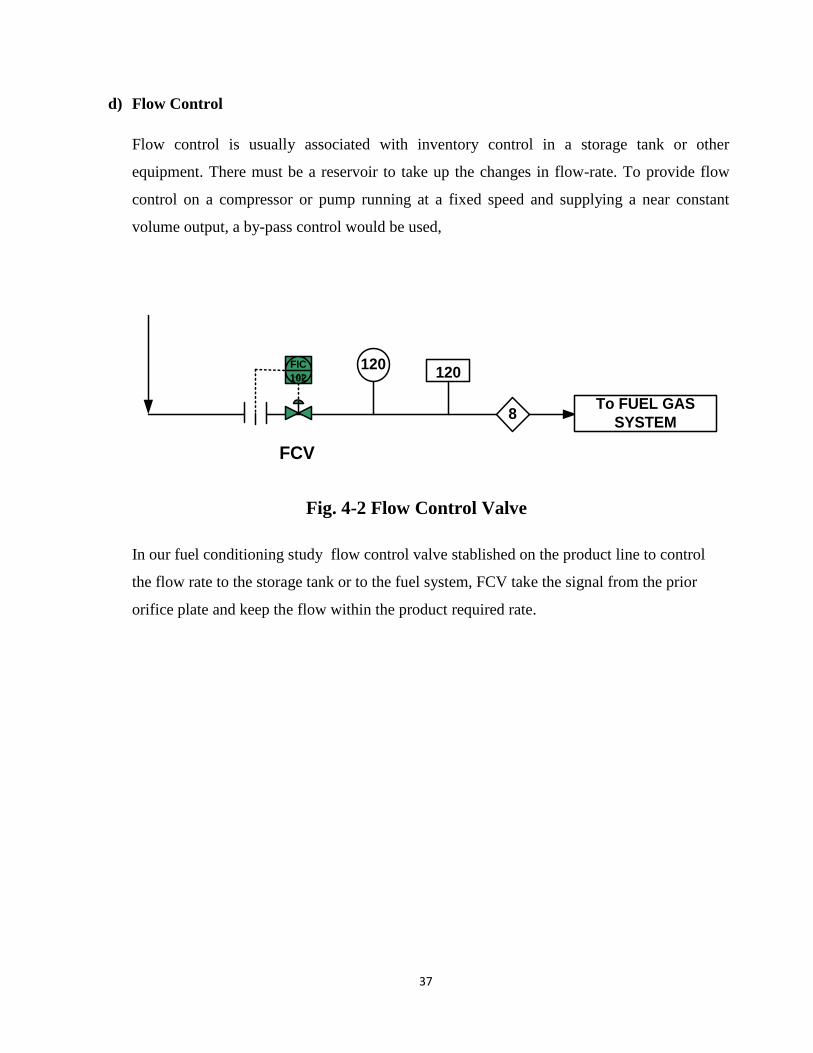
d) Flow Control
Flow control is usually associated with inventory control in a storage tank or other
equipment. There must be a reservoir to take up the changes in flow-rate. To provide flow
control on a compressor or pump running at a fixed speed and supplying a near constant
volume output, a by-pass control would be used,
120
8To FUEL GAS
SYSTEM
120I-61
FIC
102
FCV
Fig. 4-2 Flow Control Valve
In our fuel conditioning study flow control valve stablished on the product line to control
the flow rate to the storage tank or to the fuel system, FCV take the signal from the prior
orifice plate and keep the flow within the product required rate.
Page 52
38
Chapter 5
5. Cost Estimation
5.1.Economic Assumptions and methodology
The capital and operating costs are estimated for the Benfield High Pure process and its
alternatives within the operating and economic environments .The total capital cost
includes all key process equipment shown in the process flow diagrams, plus a general
facilities cost. The design parameters of equipment like absorber columns, flash vessels and
pumps are obtained from the plant design data sheets. The rest of the equipment is sized in
to provide information on equipment’s costs as required by the calculations. The operating
cost includes fixed general maintenance costs comprising labor, local taxes and general
insurance. The process operating expenses are estimated through the unit cost of utilities
and consumables with reference to the techno-economic performance parameters. To
enable complete investigation of the process, information on both equipment and operating
cost is obtained from a number of sources including vendor and public sources. The
assumptions used in carrying out the economic analysis and evaluation are given in table
below. Economic gains for the existing process and its alternatives are compared using the
economic potential and net present value/worth.
For Overview of the Economic Assumptions, See Appendix (B) Tab. 5-1
5.2.Capital Costs
The total capital expense (CAPEX) is divided into two main components:
i) The fixed capital investment.
ii) The working capital investment. All the cost estimates are represented in constant
million US dollars using the 2000 cost. ''Index (B). Tab. 5.1'' gives the cost factors used to
estimate all the costs involved in the construction of the plant basing on the purchase cost
for each individual equipment. ''index (B) Tab. 5.2'' gives an overview of the equipment
cost estimates for the Benfield High Pure process in million US dollars (M$).
The most expensive equipment’s are the absorber and the regenerator, which are
responsible for about 45% of the fixed cost on investment.
Page 53
39
Cost factors for the effects of material of construction, temperature and pressure are also
included in the capital cost estimation of the equipment. Equipment such as valves, steam
jet ejectors and pipes were neglected in this study. As shown in Tab. 5.2 Typical factors for
capital cost based on delivered equipment. [26]
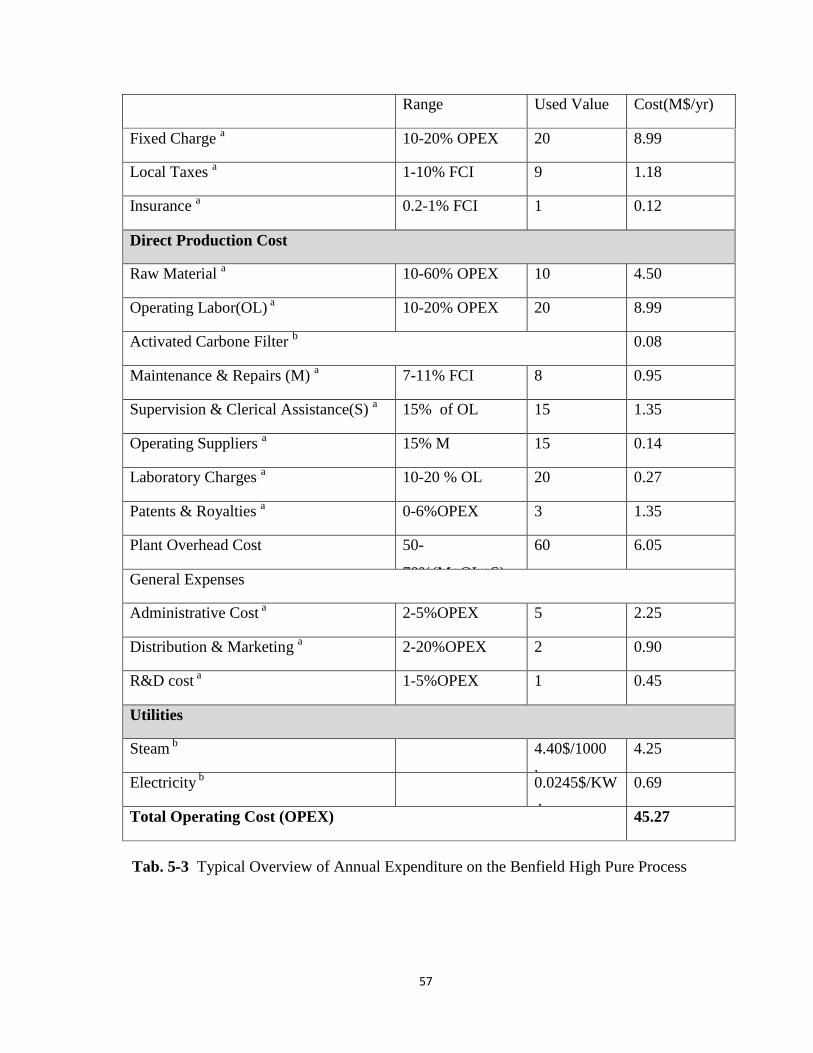
5.3.Operating costs
The total operating expense (OPEX) is divided into five sections:
i) The charges.
ii) Direct production costs.
iii) Plant overhead costs.
iv) General expenses.
v) Utility costs.
Tab. 5.3 Appendix (B) gives an overview of these expenses in million US dollars (M$). 40%
of the operating costs is for the direct production costs and only 11% is spent on utilities
basically steam and electricity.
Tab. 5.3 : Typical Overview of Annual Expenditure. ''Index (B)
5.4.The cost of some project equipment :
Equipment No Discription Cost in
2015 $
Cost in
2019 $
Risk
Fact.
30%
Site Net
Cost $
Compressor 1 Multistag Compressor $350,563.00 515,327.00 1.3 696,925.00
Cooler 1 Water – Gas Cooler $88,440.00 130007.00 1.3 169,009.00
Separator 1 Gas - Liquid Separator 65,286.00 95,970.00 1.3 124,761.00
Membrane 1 73,193.00 107,593.00 1.3 139,871.00
Stripper 1 Gas Recovery 61,248.00 90,035.00 1.3 117,045.00
Total 1,247,611.00
Tab. 5.1 cost of project
Page 54
40
Chapter 6
Safety
6.1. Natural gas
Natural gas is produced from our field and according to its hydrogen sulphide content is
considered either (below 0.5 vol% H2S) or gas (above 0.5 vol.% H2S).
Natural gas typically contains about 70-80% methane (CH4) with some Ethane (C2H6)
propane (C3H8) and Carbon dioxide (CO2) as impurities.
After purification it is colourless odourless non corrosive and lighter than air. As the
purified gas cannot be smelled a trace of a standard strongly smelling substance
(Mecaptan) is added to help detect any gas leaks.
6.2. Types of Protection Equipment
6.2.1. Work Clothing
Work clothing must be suitable for protection. Against common hazards expected
for industrial areas in .General.
Work clothing should be kept as clean as possible. If splashed with Oil or a chemical, it
must be removed as soon as possible. Any Affected part of the body must be washed
with soap and water, and then clean clothing put on. Any con tac t wi th an
Aggres s ive c h e m i ca l , m u s t b e r e p o r t e d t o Supervision Immediately. The
above rules represent the normal minimal requirements. Where necessary,
additional personal protective clothing and Equipment specified by the Company must' be
worn by employees. Exceptions from the above rules which are justified by the nature of
work or Special environment may be permitted if approved by the Superintendent, Safety
& Fire Protection or his substitute. Insulated clothing may be required for work
assignments involving Temperature extremes, such as welding, the handling of
cryogenic liquids, Working in food cold storage facilities etc. [8]
Page 55
41
6.2.2. Head Protection
An approved hard hat consists of a hard impact shell and an adjustable inside cradle'
arid distributed over the head 'surface area. Wearing of safety hard hats (helmets) is
mandatory for:
All employees who Work in industrial area.
Work on a construction site.
work in a hard-hat use designated area, and
In any situation where a hazard exists for head injury from a falling object or
bumping against overhead structure or objects.
6.2.2.1. HARD HAT
Exceptions are the situations where normally no hazard exists for a head injury, such
as working in offices, control rooms, classrooms, etc. A hardhat shell is known to lose
its protection value with t ime .
Fig. 6-1 indicate Hard Hat helmet
6.2.3. Face Protection
6.2.3.1. Face Shield
Provides protection from a corrosive or a hot liquid splash, and from small flying
particles. It is not a substitute for eye protection,' and must be used in addition to
wearing safety glasses or chemical goggles. (Example shown below) [8]
6.2.3.2. Acid Suit
Protects face and head from a splash or .mist o corrosive Liquid. Situations which
require use of a hood 'usually also require protection of the body by an acid or
chemical suit.
Page 56
42
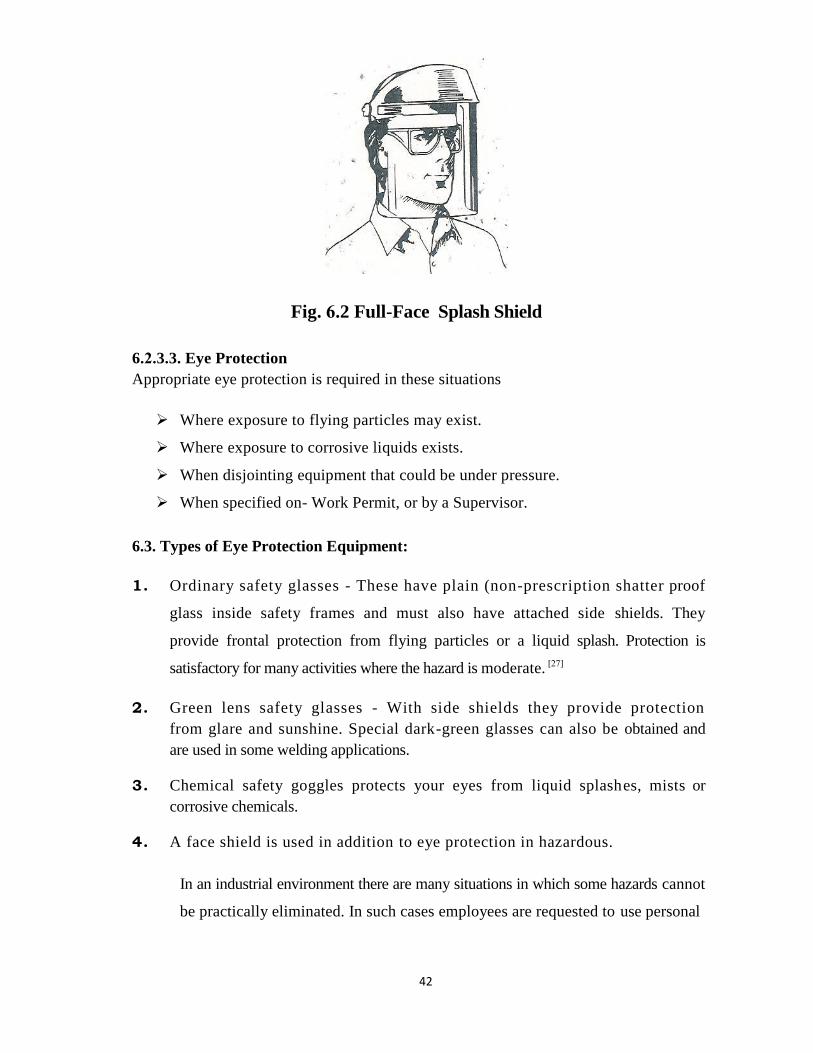
Fig. 6.2 Full-Face Splash Shield
6.2.3.3. Eye Protection
Appropriate eye protection is required in these situations
Where exposure to flying particles may exist.
Where exposure to corrosive liquids exists.
When disjointing equipment that could be under pressure.
When specified on- Work Permit, or by a Supervisor.
6.3. Types of Eye Protection Equipment:
1. Ordinary safety glasses - These have plain (non-prescription shatter proof
glass inside safety frames and must also have attached side shields. They
provide frontal protection from flying particles or a liquid splash. Protection is
satisfactory for many activities where the hazard is moderate. [27]
2. Green lens safety glasses - With side shields they provide protection
from glare and sunshine. Special dark-green glasses can also be obtained and
are used in some welding applications.
3. Chemical safety goggles protects your eyes from liquid splashes, mists or
corrosive chemicals.
4. A face shield is used in addition to eye protection in hazardous.
In an industrial environment there are many situations in which some hazards cannot
be practically eliminated. In such cases employees are requested to use personal
Page 57
43
The basic minimum required with regard to personal protection for
working in any industrial area consists of the following
Hard hat
Work gloves
Safety shoes or boots
Safety glasses or goggles
Hearing protection
Page 58
44
Chapter 7
Case Study
7.Hatieba Gas as fuel to the company power stations:
7.1. Abstract
Hatieba gas plant is the main supplier of gas to the 30" pipeline containing high CO2, and
low of H2S. The gas travels from Hatieba and joins the original 30" pipeline at Km-81.5,
here the pipeline is blanked. The section back to Zelten is used for storage purposes. Also at
km-81.5 are spillover facilities allowing gas from Sahel & Assmoud fields to be used in
making up any gas shortfall. Due to the containing of huge amount of water and heavy
hydrocarbon condensate caring with Hatieba gas in 30 '' pipeline to Brega facilities,
separation process should be done for this type of gas especially during winter season.
Hatieba gas supply only both Ammonia plants (I and II) and Methanol plant (I) as process
and fuel gas.
Within these days, there is a proposal to supply Sitre Oil Company power stations (I and II)
by Hatieba gas as alternative source in presence of any shortage in the existing sources,
but the power plants generators don't matching with the gas composition without
conditioning.
So, establish of Knockout vertical drum separator and membrane technology for
conditioning Hatieba gas is very important to keep the power plants away of blackout.
Key Words; Hatieba gas, Facilities, membrane Technology.
7.2.Introduction.
The case study of using Hatieba gas as power plants fuel gas is to be collecting data for the
composition of gas and try to comparative in between with gas transmission gas that
existing supply to the power plants where, Hatieba gas is deferent, and need to more
separation and conditioning to remove the high content of CO2.
Page 59
45
The pipeline enters the slugcatcher area of the L.N.G. plant. Here there is a 30" sphere
receiver which is unused at the present time. The gas flow "T"s off through the valve LBV-
1355, which can be closed automatically, or remotely from the DCS, and opened/closed
locally.
The vessel is drained to the area burn pit, through a manual operated control valve. The gas
leaves V-360 from the top and passes to supplying gas to the Gas Plant fuel system (as
required). [11]
30" G
AS P
IPEL
INE
DIST
RIBU
TION
@ S
LUG
CATC
HER
AREA
20" H
EADE
R FR
OM
MOV
-375
A/B
16"
20"
FROM
FICV
-303
FROM
FICV
-302
36" B
SPI
LLOV
ER G
AS
AMM
-1 /
MET
H-1
& PO
WER
PLA
NT
AMM
-2 /
MET
H-2
MOV
-375
B
MOV-375
B
(OPERATE
FROM D
CS/LOCAL)
375ATR 375BTR
375APR 375BPR
FR-3
75A
FR-3
75B
20" H
EADER TO P
.C. P
LANTS
20"
16" F
UEL
SYST
EM
SUPP
LY H
EADE
R
36"B
PIP
ELINE G
AS
TO F
UEL
SUPPLY H
EADER
PILO
T GA
S TO
BURN
PIT
V - 360
M
OV-3
65(O
PERA
TE L
OCAL
ONL
Y)
LCV-
360
TO B
URN
PIT
(OPE
RATE
LOC
AL O
NLY)
MOV
-826
(CLO
SE F
ROM
DCS
,
OPEN
ON
RESE
T)
LBV-
1355
(CLO
SE F
ROM
DCS
,
OPEN
/CLO
SE L
OCAL
)
16" B
YPAS
S
LBV-
1355
/ M
OV-8
25
30" G
AS T
O G.
T.S.
(34"
)
MOV
-825
(CLO
SE F
ROM
DCS
,
OPEN
ON
RESE
T)
RBB-
338
(CLO
SE F
ROM
DCS
,
OPEN
/CLO
SE L
OCAL
)
30" S
PHER
E
RECE
IVER
MOV
-135
0/13
51
MOV
-135
2
Fig. 7.1 30 '' Hatieba gas pipeline distribution
Page 60
46
7.3. Hatieba gas analysis:
Fig. 7.2 30 '' Hatieba gas pipeline Analysis
Page 61
47
Fig. 7.3 Gas – Liquids Separation Connections
Page 62
48
Fig. 7.4 30 '' Hatieba gas Properties
Page 63
49
Energy content or calorific value is the same as the heat of combustion, and can
be calculated from thermodynamicc values, or measured in a suitable apparatus:
A known amount of the fuel is burned at constant pressure and under standard
conditions (0°C and 1 bar) and the heat released is captured in a known mass of water in a
calorimeter. If the initial and final temperatures of the water are measured, the energy
released can be calculated using the equation. [27]
H = ΔT mCp …………………………………………………………………………….(7-1)
where H = heat energy absorbed (in J), ΔT = change in temperature (in °C), m = mass of
water (in g), and Cp = specific heat capacity (4.18 J/g°C for water). The resulting energy
value divided by grams of fuel burned gives the energy content (in J/g).
The combustion process generates water vapor and certain techniques may be used to
recover the quantity of heat contained in this water vapor by condensing it.
Higher Calorific Value (= Gross Calorific Value - GCV = Higher Heating Value -
HHV) - the water of combustion is entirely condensed and the heat contained in the
water vapor is recovered
Lower Calorific Value (= Net Calorific Value - NCV = Lower Heating Value -
LHV) - the products of combustion contains the water vapor and the heat in the
water vapor is not recovered
The table below gives the gross and net heating value of fuels gas as well as some
alternative fuels. [4]
Fuel
Density Higher Heating Value (HHV)
(Gross Calorific Value - GCV)
Lower Heating Value (LHV)
(Net Calorific Value - NCV) @32°F, 1bar
Gaseous
fuels [kg/m
3] [MJ/kg] [MJ/m
3] [MJ/kg] [MJ/m
3]
Nat. gas 0.777 52.2 40.6 47.1 36.6
[kg/lit] [MJ/kg] [MJ/l] [MJ/kg] [MJ/l]
LPG* 0.537 49.3 26.5 45.5 24.4
Tab. 7.1 Gross and net heating value
Page 64
50
7.4. Conclusion:
The problem with using directly produced natural gas from Hatieba as fuel is that,
typically, it is very rich, or abundant in heavier hydrocarbons.
The cleaning fuel meaning fuel consist of lighter hydrocarbons such as methane and ethane
which give more heat value than the heavier fuel gas.
The power station burners designed for use lighter hydrocarbons didn't matching with fuel
containing water and heavy hydrocarbons and machine trip may cause due to condensing
small amount of heavy hydrocarbon in the burners.
Fuels which consist of a mixture of several different compounds may vary in quality
between seasons and markets. The given values are for fuels with the given density. The
variation in quality may give heating values within a range 5 -10 % higher and lower than
the given value.
7.5. Recommendation:
1) Established of vertical separator to make sure remove the condensing heavy
hydrocarbons.
2) The feed of fuel gas should be heated before interring the burning system to avoid
condensation during winter season.
3) Hatieba feed gas to the power station should conditioning by new technology of
membrane osmometric system to remove the traces amount of corrosive acidic
gasses such as CO2 and H2S.
Page 65
51
Chapter 8
8.1. Plant Layout:
The philosophy and strategy of plant layout required to determine the equipment locations
in the yard of plant and how they distributed according to their functions.
Main gate is used to employee and small car entrance while the Truck entrance is for
maintenance and emergency escape at any emergence case.
Flaring unit should far away of the plant equipment at least at the end of the corner fence
while the control room, car barking and offices are near the main gate and also, the fire
fitting unit is in the generator house.
The fuel gas line brake valve is in the first equipment at entering point to the plant yard and
the next facilities combine in one skid.
Exhausting stack should be outside the power generator house.
Power Generator House
Compresor
SeparatorCooler
Car Barking
Control Room
Inlet Valve
Membrane
Stripper Condy. Bit
Exaust S
tack
Truck Entrance
Main Gait
Fire
Fighting
House
Tra
nsfo
rm
er
Fla
ring
Unit
Fig. 8.1 Power Station Plant Suppling with Natural Conditioning Gas
Page 66
52
APPINDIX A
(Kmol/hr * 1000 mol/Kmol * 22.4 lit/mol * m3/1000 lit* hr/3600 sec)
Volume flow rate (Tab. 3-2) Page-23
Chapter 5 Symbol Nomenclature
symbol Nomenclature
TI Temperature indicator
TIRC Temperature indicator
recorder controller FC Flow controller
FRC Flow recorder Controller
FI Flow indicator
PI Pressure indicator
PC Pressure controller
XC Ratio controller
FR Flow recorder
LIR Level indicator recorder
PRC Pressure recorder controller
CI Composition indicator
LA Level alarm
PA Pressure alarm
Page 67
53
K Values in light hydrocarbon system, high temperature range.
Page 68
54
K Values in light hydrocarbon system, low temperature range.
Page 69
55
Appendix B
Separator Type
K Factor
(m/s)
C Factor
(m/h)
Horizontal 0.12 to 0.15 430 to 540
Vertical 0.05 to 0.11 200 to 400
Spherical 0.05 to 0.11 220 to 400
Wet Steam 0.076 270
Most vapors under vacuum 0.061 220
Salt & Caustic Evaporators 0.046 160
Atmospheric 100
1000 kPa 90
2000 kPa 85
4000 kPa 80
8000 kPa 75
Typical K & C Factors
Heat Capacity Constants
Heat capacity constants
components a b c
C1 26.39 0.01 -2.38E-05
C2 7.56 0.16 -3.21E-05
C3 -4.1 0.3 1.63E-04
C4 -2.48 0.39 -2.20E-04
C5 0.45 0.45 -1.75E-04
H2O 34.51 -0.01 4.69E-05
CO2 17.46 0.09 -1.01E-04
H2S 13.67 0.11 -1.21E-04
Page 70
56
Tab. 5-1 Economic Assumptions
Item 20
Factors
Direct Cost
Equipment delivered 1
Equipment Erecting 0.4
Piping 0.7
Instrumentation and Control 0.2
Electrical 0.1
Utilities 0.5
Off-sites 0.2
Building 0.2
Site Preparation 0.1
Total Capital Cost of Installed Equipment 3.4
Indirect Cost
Design Engineering & Construction 1
Contingency 0.4
Total Fixed Capital Cost 5.8
Tab. 5-2 Typical factors for capital cost based on delivered equipment
Economic Assumptions
Project (yrs.) 22.0
Equipment Salvage Value 0.0
Construction Period (yrs.) 3.0
Plant operating time (hr/yr.) 7920.0
Interest rate (%) 5.0
Row material Cost ($/kg) 3.0
Chemical Cost ($/kg) 3.8
Renewal Cost ($/kg) 2.6
DGA cost ($/kg) 4.06
DIPA cost ($/kg) 3.0
Natural gas Price ($/MMBTU) 3.5
Tax rate (%) 20.0
Page 71
57
Range Used Value Cost(M$/yr)
Fixed Charge a 10-20% OPEX 20 8.99
Local Taxes a 1-10% FCI 9 1.18
Insurance a 0.2-1% FCI 1 0.12
Direct Production Cost
Raw Material a 10-60% OPEX 10 4.50
Operating Labor(OL) a 10-20% OPEX 20 8.99
Activated Carbone Filter b 0.08
Maintenance & Repairs (M) a 7-11% FCI 8 0.95
Supervision & Clerical Assistance(S) a 15% of OL 15 1.35
Operating Suppliers a 15% M 15 0.14
Laboratory Charges a 10-20 % OL 20 0.27
Patents & Royalties a 0-6%OPEX 3 1.35
Plant Overhead Cost 50-
70%(M+OL+S)
60 6.05
General Expenses
Administrative Cost a 2-5%OPEX 5 2.25
Distribution & Marketing a 2-20%OPEX 2 0.90
R&D cost a 1-5%OPEX 1 0.45
Utilities
Steam b 4.40$/1000
kg
4.25
Electricity b
0.0245$/KW
.hr
0.69
Total Operating Cost (OPEX) 45.27
Tab. 5-3 Typical Overview of Annual Expenditure on the Benfield High Pure Process
Page 72
58
Tab. 5.4 Cost of some project equipment
№ of Pressure
quantity (PSI) € $
1 Heat Exchanger 2 Shell/tube, fixed/U, large Carbon steel 300 249,981 217,484
2 Compressor 1
Centrifugal,
1334(KW) Carbon steel 1000 249,981 217,484
3 Filter 1 Cartrige
Alluminium
56.205(m2) 249,981 217,484
4 Cooling and Refrigeration 2 Cooling pond Carbon steel 4930(kW/hr) 249,981 217,484
5 Centrifugal pump 1 Horizontal1 stag hor. Spilt (Packing)Cast iron ; API610 249,981 217,484
6 Separator 1 Cyclone, wet, NiHard lined, medium0.3(m) Carbon steel 249,981 217,484
Total Equipment Cost 1,499,886 1,304,904
Cost Equepment Type Material
Page 73
59
References:
[1] Membrane Technology: A method of gas separation by Skylar Addicks
[2] Kaaeid A.Lokhandwala and Marc L.Jacobs,Membrane Technology &
Research,Inc.,USA,discuss the use of membrane technology for conditioning fuel gas
for use in gas engines and turbines in the natural gas industry.
[3] Alvarado, Dean, and Douglas E. Gottschlich. "Membrane Matrimony." Hydrocarbon
[4] Wines T H (2000 January) ‘Improve liquid/gas coalescer performance’, Hydrocarbon
processing p.89-96.
[5] Bloch H P (2000 August) ‘Solve your hydrocracker compressor problems’,
Hydrocarbon Processing p.39-42.
[6] Coulson & Richardson's Chemical Engineering. Vol. 6, Chemical Engineering Design,
4th Ed.
[7] Chemical Engineering, Volume 1, Fluid Flow, Heat Transfer and Mass Transfer
(Coulson & Richardson)01
[8] Perry R H and Green D W (1997) Perry’s Chemical Engineers’ Handbook, Seventh
Edition, Chapter 14, p.95-98, McGraw-Hill Book Company, New York.
[9] Phillips H W (2000 September) ‘Select the Proper Gas Cleaning Equipment’, Chemical
Engineering Progress p.19-38.
[10] Ludwig E E (1995) Applied Process Design for Chemical and Petrochemical Plants,
Gulf Publishing Company, Houston.Volume 1, Chapter 4, ‘Mechanical Separations’.
[11] Brown R L and Wines T H (1993 December) ‘Improve suspended water removal from
fuels’, Hydrocarbon Processing p.95-100.
[12] Katona A, Darde T and Wines T H (2001 August) ‘Improve haze removal for FCC
gasoline’, Hydrocarbon Processing p.103-108.
[13] Snow R H and Allen T (1992 May) ‘Effectively Measure Particle-Size-Classifier
Performance’, Chemical Engineering Progress p.29-33.
Page 74
60
.[14] Klumpar I V (1992 April) ‘Control and Scale-up Air Classifiers’, Chemical
Engineering Progress p.50-55.
[15] Hixon L (1992 July) ‘Sizing Up Air Classifiers’, Chemical Engineering Progress p.59-
62.
[16] Crawley G, Malcolmson A, Crosley I and McLeish A (2002 April) ‘Particle
Classification: Making the Grade’, Chemical Engineering p.54-60.
[17] Phillips H W (2000 September) ‘Select the Proper Gas Cleaning Equipment’,
Chemical Engineering Progress p.19-38.
[18] Christian J B (1994 July) ‘Improve Clarifier and Thickener Design and Operation’,
Chemical Engineering Progress p.50-56.
[19] Belhateche D H (1995 August) ‘Choose Appropriate Wastewater Treatment
Technologies’, Chemical Engineering Progress p.32-49.
[20] Zinkus G A, Byers W D and Doerr W W (1998 May) ‘Identify Appropriate Water
Reclamation Technologies’, Chemical Engineering Progress p.19-31.
[21] Hairston D (2002 May) ‘Combing Oil from T.Sands, Ch. Eng p.27- 31.
[22] Gomez J V (1992 April) ‘Correlations Ease Hydrocyclone Selection Part 1’,
Chemical Eng ineering p.167-8; (1992 May) p.161-163.
[23] Salcudean M, Gartshore I and Statie E C (2003 April) ‘Test Hydrocyclones Before
They Are Built’, Chemical Engineering p.66-71.
[24] Engineering (2005): n. pag. Membrane Technology and Research Inc. Web.
[25] MTR_Brochure_FGC
[26] Membranes for fuel gas conditioning
[27] www.IFSolutions.com