PA-1 Chapter PA (Production Analysis) PRODUCTION ANALYSIS OF NORTH SLOPE OIL AND GAS FIELDS by John C. Quinn 1 in The Oil and Gas Resource Potential of the 1002 Area, Arctic National Wildlife Refuge, Alaska, by ANWR Assessment Team, U.S. Geological Survey Open-File Report 98-34. 1999 1 U.S. Geological Survey, MS 939, Denver, CO 80225 This report is preliminary and has not been reviewed for conformity with U.S. Geological Survey editorial standards (or with the North American Stratigraphic Code). Use of trade, product, or firm names is for descriptive purposes only and does not imply endorsement by the U. S. Geological Survey.
Transcript
PA-1
Chapter PA (Production Analysis)
PRODUCTION ANALYSIS OF NORTH SLOPE OIL AND GASFIELDS
by John C. Quinn1
in The Oil and Gas Resource Potential of the 1002 Area, Arctic NationalWildlife Refuge, Alaska, by ANWR Assessment Team, U.S. GeologicalSurvey Open-File Report 98-34.
1999
1 U.S. Geological Survey, MS 939, Denver, CO 80225
This report is preliminary and has not been reviewed for conformity with U.S. Geological Survey editorialstandards (or with the North American Stratigraphic Code). Use of trade, product, or firm names is fordescriptive purposes only and does not imply endorsement by the U. S. Geological Survey.
PA-2
TABLE OF CONTENTS
AbstractAssumptions and Data SourcesFormation Volume FactorPressure versus DepthGas-oil RatioProduction Data from North Slope FieldsReferences
FIGURES
PA1. Data from North Slope oil and gas fields.PA2. Plots showing formation volume factor (Bo) versus: API gravity,
original pressure, reservoir temperature, and depth.PA3. Plots showing: original pressure vs depth with overpressured data,
GOR vs API gravity, original pressure vs depth without overpressureddata, and GOR vs original pressure.
PA4. Plot showing the best single month's production for North Slopewells.
PA5. Plot showing the best consecutive 12 month period's production forNorth Slope wells.
PA-3
Abstract
Production data, pressure data, and fluid characteristics of currentlyproducing Alaska North Slope oil fields are presented. Relationships amongthese are examined. Production from individual wells shows low variabilitywithin pools.
Assumptions and Data Sources
Production data, pressure data, and fluid characteristics of currentlyproducing Alaska North Slope oil fields are presented as the model forproduction in the 1002 area of ANWR. This production analysis concernsreservoir information that affects the calculated volume of oil or gasproduction as it moves from reservoir to stock tank and pipeline conditions.
Data came from two sources: The Alaska Oil and Gas ConservationCommission 1996 Annual Report (Alaska Oil and Gas ConservationCommission, 1997, hereafter referred to as the 1996 AOGCC Report) andPetroleum Information Corporation 1996 PetroROM - Production Data(Petroleum Information Corporation, 1996, hereafter referred to as PI dataor database).
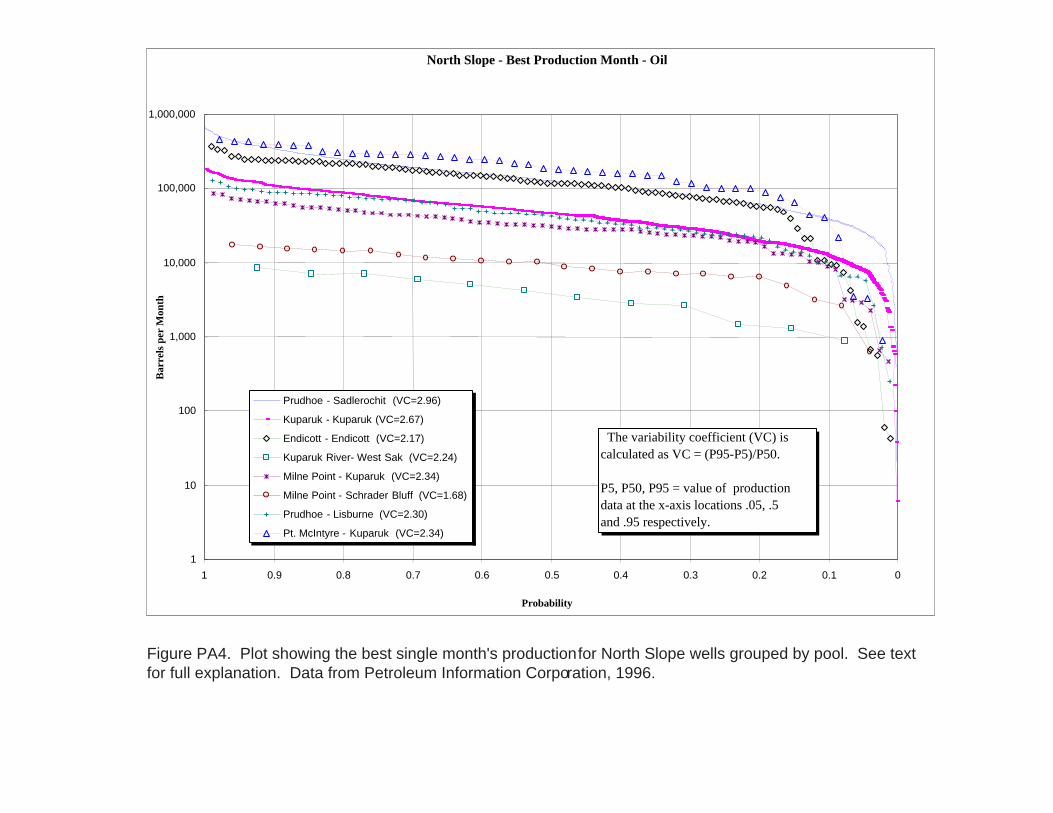
Figure PA1 is a table of the information taken from the 1996 AOGCCReport. The plots in figures PA2 and PA3 are derived from the data infigure PA1. In cases where the tabulated data for a given entry is a rangeof values, a value in the middle of the range was used for plotting. FiguresPA4 and PA5 represent information derived from the PI data. Theproduction data used in figures PA4 and PA5 is from all of the North Slopewells in the PI database. The names in the legends of figures PA4 and PA5are the field and formation names used by the PI database and do notexactly correspond with the naming convention used in the 1996 AOGCCReport.
Formation Volume Factor
The plots in Figure PA2 (A through D) are of the oil formation volumefactor, normally represented as Bo. The units of Bo are defined as reservoirbarrels per stock tank barrel and account for the expansion that thehydrocarbon undergoes as a result of moving from a high-pressure, high-
PA-4
temperature environment to one of standard conditions (14.7 psi, 60°Fahrenheit). Bo is plotted against API gravity, original pressure, reservoirtemperature, and depth. Each of these plots yields a formula for estimatingBo from the other parameter. Depth (Figure PA2 (D)) provides the bestcorrelation, but Bo should be estimated from the value given the mostcredence in a particular application.
Pressure versus Depth
The two data points indicating an overpressured region in the pressureversus depth plot (Figure PA3 (A)) are both from the Thomson Sandstonein the Point Thomson Unit. This unit is directly adjacent to the ANWRboundary and the formation appears to continue into the 1002 area. Toestimate pressures for non-overpressured reservoirs, the formula from theplot (Figure PA3 (C)) with the overpressured data removed should be used.Pressures in the Thomson wells are approximately 3900 psi above valuescalculated by the figure PA3 (C) trend line equation. Addition of 3900 psi tothe calculated value for any reservoir believed to be pressure-connected tothe Point Thomson wells will provide a realistic value for furthercalculations.
Gas-oil Ratio
The correlation for gas-oil ratio (GOR) and API gravity (Figure PA3 (B)) isinsignificant, and should not be used. The plot of gas-oil ratio versuspressure (Figure PA3 (D)) has a better fit but should only be used for ageneral guideline. The ability of an oil reservoir to retain gas and hence ahigh gas-oil ratio is dependent on a seal that is capable of holding the gas.Light end hydrocarbons are very mobile and will migrate out of the oilthrough any escape route. Presence of an effective seal differentiatesdeposits with high gravity oil from those with low gravity oil. When the oilleaves the source rock, a spectrum of hydrocarbons is present. If areservoir has a leaky seal or the seal is temporarily breached, the lighterhydrocarbons escape leaving dead or heavy oil behind. Therefore thequality of a sealing formation in regard to its ability to retain gas is the mostimportant factor in determining feature gas-oil ratios and should overrideany calculation of GOR from the pressure plot.
PA-5
Production Data from North Slope Fields
The data presented in figures PA4 and PA5 represent production valuesfrom all of the wells in the PI database for North Slope fields. The bestmonthly production (Figure PA4) is the single best monthly productionvalue for each of the wells, while the best 12 month value (Figure PA5)represents the best consecutive 12 months with no regard for any particularproduction period such as calendar year.
The data were grouped by pool and then ordered and plotted in the samemanner. Each group was sorted into descending order of productionmagnitude and plotted with a probability value on a linear scale on the x-axis. A probability value is assigned by numbering each data point for eachdata set (such as Kuparuk River - West Sak) and dividing the samplenumber by the highest sample number plus one. Using the Kuparuk River -West Sak data set as an example, there are production values from 12 wellsin this data set. After the data set is sorted into a descending valuesequence starting with the highest value, the values are assigned numbersranging from one (the highest value) to twelve (the lowest value). Each ofthese numbers (not the values) are divided by thirteen, the result being theprobability of that value. This method allows data sets with widely varyingnumbers of values to be plotted on the same graph with a commonhorizontal scale.
After all of the data sets are plotted, the variability coefficient of each dataset can be calculated. The variability coefficient is an indicator of thesteepness of the slope of the data set. It is calculated as the value at .95probability minus the value at .05 probability, all divided by the value at .50probability.
From preliminary research into this concept (Dyman and others, 1996), it isbelieved that the value of variability coefficient is directly related to theheterogeneity of the reservoir. High variability coefficients indicate aheterogeneous reservoir while low values, as found in all of the North Slopepools, indicate a homogeneous reservoir. In the areas studied by Dymanand others (1996), variability coefficients for peak yearly and peak monthlyproduction were mostly less than 10 but reached as high as 12.46. Thehighest for the North Slope pools was 3.92. This limited range of variabilitycoefficients may be the result of regional economics in that veryheterogeneous reservoirs would be less likely to be economically viable on
PA-6
the North Slope. There is quite a bit of variety in the magnitude ofproduction values between the reservoirs. Yet all of the reservoirs haveapproximately the same slope and that slope is very low.
References
Alaska Oil and Gas Conservation Commission, [1997], 1996 Annual Report:Anchorage, Alaska Oil and Gas Conservation Commission, 251 p.
Dyman, T.S., Schmoker, J.W., and Quinn, J.C., 1996, Reservoirheterogeneity as measured by production characteristics of wells –preliminary observations: U.S. Geological Survey Open-File Report96-059, 11 p.
Petroleum Information Corporation, 1996, PetroROM - Production Data1996: Littleton, CO, Petroleum Information Corp., [database availablefrom Petroleum Information Corp., 4100 East Dry Creek Road,Littleton, CO 80122].
Figure PA1. Data from North Slope oil and gas fields used in this production analysis. Data taken from the State of Alaska, Alaska Oil and Gas Conservation Commission 1996 Annual Report.[API = American Petroleum Institute, GOR = gas-oil ratio, RB = reservoir barrels, STB = stock tank barrels, Bo = formation volume factor, OP = original pressure, SCF = standard cubic feet.
Temperature Formation Saturation Original 12/96 Oil OilDepth Original Pressure Gross Pay Net Pay (Degrees Oil Gravity Gas Specific Average Permeability Average Volume Factor Pressure GOR GOR Viscosity Viscosity
Kuparuk River Field Kuparuk River Kuparuk River 6200 3360 150 22.9-29.0 21 35 1.22 228-413 1072West Sak Undefined
Milne Point Field Kuparuk River Kuparuk River 7200 3555 30-75 10-40 178 22 23 20-2000 37 1.16 2140 320 460 3.8 3.25West Sak and Ugnu Schrader Bluff 4267 1940 21 21 65 19 21 143 31 1.06 1507 202 371 52 47Sag River Undefined 9500 4440 60 30 235 35-39 18 4 40 1.41-1.56 3500-3800 784-974 921 .28-.35 .26-.33
North Star Unit Sadlerochit Undefined 11000 5290 246 2000Point McIntyre Field Kuparuk River Point McIntyre 8800 4377 0-450 180 27 22 200 15-65 1.391 4308 806 1002 0.9Prudhoe Bay Field Kuparuk River Kuparuk River 6200 3210 40-95 30-80 150 23 23 3-200 28-47 1.22 2980 450 NA 1.8-4.0 NA
Sag River, Shublik, Ivishak Prudhoe 8800 4390 350-630 0-444 200 28 22 265 20.77 1.4 4390 730 10581 0.81 0.81Wahoo and Alapah Lisburne 8900 4490 0-2000 NA 183 27 10 0.1-2.0 20-40 1.385 4300 830 15302 0.7 NA
Prudhoe Bay Field Kuparuk River Niakuk 8900 4461 110 98 181 24.9 20 500 28 1.31 3835 662 732 1.4Prudhoe Bay Field Ivishak North Prudhoe Bay 9245 3922 42 20 206 35 20 590 38 1.48 3870 923 9467 0.425Prudhoe Bay Field Kuparuk River West Beach 8800 4257 106 71 175 25.7 19 107 35-41 1.356 4160 752 6952 1.04Point Thomson Unit Thomson SS Undefined, Ak St A-1 12500 9850 195 23.1 864-934
Undefined, Pt Th #1 12900 10160 205 18.4 5830Barrow Field Unnamed Jurassic&Cret. S. Barrow Pool 2250 1103 27 63 0.56 20 30 52
Unnamed Jurassic&Cret. E. Barrow Pool 2000 1000 18 58 0.57 22 44 55East Umiat Field Ninuluk / Chandler Undefined 1929 750 73 66 50 0.6 15 15 32Kavik Field Sag River / Sadlerochit Undefined 3500 2391-2400 260-900 40-280 114-127 .587-.588 5-13 2-200 50Kemik Field Shublik Undefined 2678 123 0.6Walakpa Field Walakpa Sandstone Walakpa 1030 27 24 64 0.571 24 187 29
API = American Petroleum Institute GOR = gas-oil ratio RB = reservoir barrels STB = stock tank barrelsBo = formation volume factor OP = original pressure SCF = standard cubic feet Swi = irreduceable water saturationcp = centipoise psia = pounds per square inch absolute SP = saturation pressure
Formation Volume Factor - Original Pressure
y = 0.0001x + 0.7586
R2 = 0.6966
1
1.1
1.2
1.3
1.4
1.5
1.6
1,500 2,000 2,500 3,000 3,500 4,000 4,500 5,000
Original Pressure ( psia)
Bo
(R
B/S
TB
)
B
Formation Volume Factor - Reservoir Temperature
y = 0.0028x + 0.8371
R2 = 0.7604
1
1.1
1.2
1.3
1.4
1.5
1.6
0 50 100 150 200 250 300
Temperature (degrees Fahrenheit)
Bo
(R
B/S
TB
)
C
Formation Volume Factor - API gravity
y = 0.0235x + 0.6866
R2 = 0.8135
1
1.1
1.2
1.3
1.4
1.5
1.6
15 20 25 30 35 40
API Gravity (degrees)
Bo
(R
B/S
TB
)
A
Formation Volume Factor - Depth
y = 8E-05x + 0.7239
R2 = 0.8474
1
1.1
1.2
1.3
1.4
1.5
1.6
3,000 5,000 7,000 9,000 11,000
Depth (feet)
Bo
(R
B/S
TB
)
D
Figure PA2. Plots showing formation volume factor (Bo) versus: (A) API gravity, (B) original pressure, (C) reservoir temperature, and (D) depth. See Figure PA1 for data source and abbreviations.
Original Pressure - DepthOverpressured Data Included
Original Pressure - DepthOverpressured Data Removed
y = 0.4685x + 164.08R2 = 0.9717
0
1,000
2,000
3,000
4,000
5,000
6,000
0 2,000 4,000 6,000 8,000 10,000 12,000
Depth (feet)
Ori
gin
al P
ress
ure
(p
sia )
C
Figure PA3. Plots showing: (A) original pressure vs depth with overpressured data, (B) GOR vs API gravity, (C) original pressure vs depth without overpressured data, and (D) GOR vs original pressure. See Figure PA1 for data source and abbreviations.
North Slope - Best Production Month - Oil
1
10
100
1,000
10,000
100,000
1,000,000
00.10.20.30.40.50.60.70.80.91
Probability
Bar
rels
per
Mon
th
Prudhoe - Sadlerochit (VC=2.96)
Kuparuk - Kuparuk (VC=2.67)
Endicott - Endicott (VC=2.17)
Kuparuk River- West Sak (VC=2.24)
Milne Point - Kuparuk (VC=2.34)
Milne Point - Schrader Bluff (VC=1.68)
Prudhoe - Lisburne (VC=2.30)
Pt. McIntyre - Kuparuk (VC=2.34)
The variability coefficient (VC) is calculated as VC = (P95-P5)/P50.
P5, P50, P95 = value of production data at the x-axis locations .05, .5 and .95 respectively.
Figure PA4. Plot showing the best single month's production for North Slope wells grouped by pool. See text for full explanation. Data from Petroleum Information Corporation, 1996.
North Slope - Best production for 12 consecutive months - Oil
1
10
100
1,000
10,000
100,000
1,000,000
10,000,000
00.10.20.30.40.50.60.70.80.91
Probability
Bar
rels
per
Yea
r
Pt. McIntyre - Kuparuk (VC=3.21)
Prudhoe - Lisburne (VC=2.67)
Milne Point - Schrader Bluff (VC=2.30)
Milne Point - Kuparuk (VC=2.52)
Kuparuk River- West Sak (VC=2.84)
Endicott - Endicott (VC=2.65)
Kuparuk - Kuparuk (VC=3.22)
Prudhoe - Sadlerochit (VC=3.92)
The variability coefficient (VC) is calculated as VC = (P95-P5)/P50.
P5, P50, P95 = value of production data at the x-axis locations .05, .5 and .95 respectively.
Figure PA5. Plot showing the best consecutive 12 month per iod's production for North Slope wells grouped by pool. See text for full explanation. Data from Petroleum Information Corporation, 1996.