26


Chapter
8GDP: Measuring Total Production and Income
Chapter Outline and Learning Objectives
8.1 Gross Domestic Product Measures Total Production, page 239
Explain how total production is measured.
8.2 Does GDP Measure What We Want It to Measure? page 246
Discuss whether GDP is a good measure of well-being.
8.3 Real GDP versus Nominal GDP, page 249
Discuss the difference between real GDP and nominal GDP.
8.4 Other Measures of Total Production and Total Income, page 253
Understand other measures of total production and total income.
M08_HUBB5496_05_SE_C08.indd 236 18/11/13 10:23 AM
本书所示页码为英文原书相关内容所在页码。

3
Economics in Your Life
What’s the Best Country for You to Work In?
Suppose that an airline offers you a job after graduation in 2014. The firm has offices in Canada and China, and because you are fluent in English and Mandarin, you get to choose the country where you will work and live. Gross domestic product (GDP) is a measure of an economy’s total production of goods and services, so one factor in your decision is likely to be the growth rate of GDP in each country. Based on the International Monetary Fund’s forecasts for 2014, GDP would increase by 2.4 percent in Canada but by 8.2 percent in China. What effect do these two very different growth rates have on your decision to work and live in one country or the other? If China’s much larger growth rate does not necessarily lead you to decide to work and live in China, why not? As you read this chapter, try to answer these questions. You can check your answers against those we provide on page 255 at the end of this chapter.
In the more than 100 years that the Ford Motor Company has been in business, its experiences have often mirrored those of the U.S. economy. So, it was no surprise that in 2008, with the U.S. economy suffering from its worst downturn since the 1930s, sales of Ford cars and trucks plummeted. Overall, the automobile industry, which sold 16.1 million new vehicles in 2007, saw sales tum-ble to 13.2 million in 2008. Although Ford was hit hard, General Motors and Chrysler, Ford’s two great American rivals, were even worse off, and both declared bankruptcy. Those firms survived largely because the federal government invested more than $62 billion in them. Ford suffered heavy losses but did not require direct government aid.
In 2013, the economy’s recovery from the downturn was well under way, and Ford’s sales were rising. With these fluctua-tions in sales, Ford and the automobile in-dustry as a whole were experiencing the effects of the business cycle, which refers to alternating periods of economic expansion and recession. Production and employment increase during expansions and decrease during recessions.
Whether the general level of economic activity is increasing is important not just to firms such as Ford but also to workers wondering whether they will be able to keep their jobs and to college students wondering whether they will be able to find jobs when they graduate. One study found that during the slow recovery from the 2007–2009 reces-sion, only 56 percent of those students who graduated from college in the spring of 2010 had found a job a year later. The average sal-ary of those who did find a job was $27,000, down from an average of $30,000 for the classes of 2006 to 2008. What’s more, stu-dents who graduate during recessions will continue to earn less for as long as 15 years after they graduate. The overall state of the economy is clearly important!
Sources: Neal E. Boudette and Jeff Bennett, “U.S. Car Sales Pace Hits Five Year High,” Wall Street Journal, July 2, 2013; Michelle Krebs and Bill Visnic, “2008 U.S. Auto Sales Are Worst Since 1992,” Edmunds Auto Observer, January 5, 2009; Catherine Rampell, “Many with New College Degrees Find the Job Market Humbling,” New York Times, May 18, 2011; and Lisa B. Kahn, “The Long-Term Labor Market Consequences of Graduating from College in a Bad Economy,” Labour Economics, Vol. 17, No. 2, April 2010, pp. 303–316.
Ford Motor Company Rides the Business Cycle
M08_HUBB5496_05_SE_C08.indd 237 18/11/13 10:23 AM

4 C h a P t E R 8 GDP: Measuring Total Production and Income
As we saw in Chapter 1, we can divide economics into the subfields of micro-economics and macroeconomics. Microeconomics is the study of how house-holds and firms make choices, how they interact in markets, and how the government attempts to influence their choices.
Macroeconomics is the study of the economy as a whole, including topics such as inflation, unemployment, and economic growth. In microeconomic analysis, econo-mists generally study individual markets, such as the market for smartphones. In mac-roeconomic analysis, economists study factors that affect many markets at the same time. As we saw in the chapter opener, one important macroeconomic issue is the busi-ness cycle. The business cycle refers to the alternating periods of expansion and reces-sion that the U.S. economy has experienced since at least the early nineteenth century. A business cycle expansion is a period during which total production and total employ-ment are increasing. A business cycle recession is a period during which total produc-tion and total employment are decreasing. In the following chapters, we will discuss the factors that influence the business cycle and policies the government may use to reduce its effects.
Another important macroeconomic topic is economic growth, which refers to the ability of an economy to produce increasing quantities of goods and services. Economic growth is important because an economy that grows too slowly fails to raise living stan-dards. In some countries in Africa, little economic growth has occurred in the past 50 years, and many people remain in severe poverty. Macroeconomics analyzes both what determines a country’s rate of economic growth and the reasons growth rates differ so greatly across countries.
Macroeconomics also analyzes what determines the total level of employment in an economy. As we will see, in the short run, the level of employment is significantly affected by the business cycle, but in the long run, the effects of the business cycle disappear, and other factors determine the level of employment. A related question is why some econo-mies are more successful than others at maintaining high levels of employment over time. Another important macroeconomic issue is what determines the inflation rate, or the per-centage increase in the average level of prices from one year to the next. As with employ-ment, inflation is affected both by the business cycle and by other long-run factors. Finally, macroeconomics is concerned with the linkages among economies: international trade and international finance.
Macroeconomic analysis provides information that consumers and firms need in or-der to understand current economic conditions and to help predict future conditions. A family may be reluctant to buy a house if employment in the economy is declining because some family members may be at risk of losing their jobs. Similarly, firms may be willing to invest in building new factories or to undertake major new expenditures on informa-tion technology only if they expect future sales to be strong. For example, in 2013, Ford announced that it would spend $5 billion to build new factories in China. Ford made that decision because macroeconomic forecasts indicated that the Chinese economy would continue to grow rapidly, expanding the demand for Ford’s cars. Macroeconomic analysis can also aid the federal government in designing policies that help the U.S. economy per-form more efficiently.
In this and the following chapters, we begin our study of macroeconomics by consider-ing how best to measure key macroeconomic variables. As we will see, important issues are involved in measuring macroeconomic variables. We start by considering measures of total production and total income in an economy.
Microeconomics The study of how households and firms make choices, how they interact in markets, and how the government attempts to influence their choices.
Macroeconomics The study of the economy as a whole, including topics such as inflation, unemployment, and economic growth.
Business cycle Alternating periods of economic expansion and economic recession.
Expansion The period of a business cycle during which total production and total employment are increasing.
Recession The period of a business cycle during which total production and total employment are decreasing.
Economic growth The ability of an economy to produce increasing quantities of goods and services.
Inflation rate The percentage increase in the price level from one year to the next.
M08_HUBB5496_05_SE_C08.indd 238 18/11/13 10:23 AM

Gross Domestic Product Measures Total Production 5
Gross Domestic Product Measures total Production
“Is Economy Doing Better Than GDP Suggests?”
“Look to GDP for Clues about the Future”
“Mexico’s First Quarter GDP Down, But Far from Out”
“India’s GDP Growth Slows to a Decade Low”
“Manufacturing Drags on South African GDP”
These headlines are from articles that appeared in the Wall Street Journal during 2013. Why is GDP so often the focus of news stories? In this section, we explore what GDP is and how it is measured. We also explore why knowledge of GDP is important to con-sumers, firms, and government policymakers.
Measuring total Production: Gross Domestic ProductEconomists use gross domestic product (GDP) to measure total production. GDP is the market value of all final goods and services produced in a country during a period of time, typically one year. In the United States, the Bureau of Economic Analysis (BEA) in the Department of Commerce compiles the data needed to calculate GDP. The BEA issues reports on the GDP every three months. GDP is a central concept in macroeconomics, so we need to consider its definition carefully.
GDP Is Measured Using Market Values, Not Quantities The word value is important in the definition of GDP. In microeconomics, we measure production in quantity terms: the number of cars Ford produces, the tons of wheat U.S. farm-ers grow, or the number of caffé lattes Starbucks sells. When we measure total pro-duction in the economy, we can’t just add together the quantities of every good and service because the result would be a meaningless jumble. Tons of wheat would be added to gallons of milk, numbers of caffé lattes, and so on. Instead, we mea-sure production by taking the value, in dollar terms, of all the goods and services produced.
GDP Includes Only the Market Value of Final Goods In measuring GDP, we include only the value of final goods and services. A final good or service is one that is purchased by its final user and is not included in the production of any other good or service. Examples of final goods are a hamburger purchased by a consumer and a computer purchased by a business. Some goods and services, though, become part of other goods and services. For example, Ford does not produce tires for its cars and trucks; it buys them from tire companies, such as Goodyear and Michelin. The tires are an intermediate good, while a Ford truck is a final good. In calculating GDP, we include the value of the Ford truck but not the value of the tire. If we included the value of the tire, we would be double counting: The value of the tire would be counted once when the tire company sold it to Ford and a second time when Ford sold the truck, with the tire installed, to a consumer.
GDP Includes Only Current Production GDP includes only production that takes place during the indicated time period. For example, GDP in 2014 includes only the goods and services produced during that year. In particular, GDP does not include the value of used goods. If you buy a DVD of The Amazing Spider-Man 2 from Amazon.com, the purchase is included in GDP. If six months later you resell the DVD on eBay, that transaction is not included in GDP.
8.1 LearnIng ObjecTIve
explain how total production is measured.
Gross domestic product (GDP) The market value of all final goods and services produced in a country during a period of time, typically one year.
Final good or service A good or service purchased by a final user.
Intermediate good or service A good or service that is an input into another good or service, such as a tire on a truck.
MyEconLab Concept Check
M08_HUBB5496_05_SE_C08.indd 239 18/11/13 10:23 AM

6 C h a P t E R 8 GDP: Measuring Total Production and Income
Solved problem 8.1Calculating GDP
Suppose that a very simple economy produces only four goods and services: eye examinations, pizzas, shoes, and cheese. Assume that all the cheese in this economy is used in the production of pizzas. Use the information in the fol-lowing table to compute GDP for the year 2013:
Production and Price Statistics for 2013
Product
(1) Quantity
(2) Price per Unit
Eye examinations 100 $50.00Pizzas 80 10.00Shoes 20 100.00Cheese 80 2.00
Solving the ProblemStep 1: Review the chapter material. This problem is about GDP, so you may want
to review the section “Measuring Total Production: Gross Domestic Product,” which begins on page 239.
Step 2: Determine which goods and services listed in the table should be included in the calculation of GDP. GDP is the value of all final goods and services. There-fore, we need to calculate the value of the final goods and services listed in the table. Eye examinations, pizzas, and shoes are final goods. Cheese would also be a final good if, for instance, a consumer bought it to use in a meal. However, here we are assuming that restaurants buy all the cheese to use in making pizzas, so the cheese is an intermediate good, and its value is not included in GDP.
Step 3: Calculate the value of the three final goods and services listed in the table. Value is equal to the quantity produced multiplied by the price per unit, so we multiply the numbers in column (1) by the numbers in column (2).
Product(1)
Quantity(2)
Price per Unit(3)
Value
Eye examinations 100 $50 $5,000Pizzas 80 10 800Shoes 20 100 2,000
Step 4: Add the value for each of the three final goods and services to find GDP. GDP = Value of eye examinations produced + Value of pizzas produced +Value of shoes produced = $5,000 + $800 + $2,000 = $7,800.
Your Turn: For more practice, do related problem 1.10 on page 257 at the end of this chapter.MyEconLab Study Plan
MyEconLab Interactive Animation
Production, Income, and the Circular-Flow DiagramWhen we measure the value of total production in the economy by calculating GDP, we are simultaneously measuring the value of total income. To see why the value of total production is equal to the value of total income, consider what happens to the money you spend on a single product. Suppose you buy a pair of New Balance running shoes for $149 at a Foot Locker store. All of that $149 must end up as someone’s in-come. New Balance and Foot Locker will receive some of the $149 as profits, workers at New Balance will receive some as wages, the salesperson who sold you the shoes will re-ceive some as salary, the firms that sell components to New Balance will receive some as profits, the workers for those firms will receive some as wages, and so on. Every penny must end up as someone’s income. (Note, though, that any sales tax on the shoes will be collected by the store and sent to the government, without ending up as anyone’s in-come.) Therefore, if we add up the value of every good and service sold in the economy, we must get a total that is exactly equal to the value of all the income in the economy.
M08_HUBB5496_05_SE_C08.indd 240 18/11/13 10:23 AM

Gross Domestic Product Measures Total Production 7
The circular-flow diagram in Figure 8.1 was introduced in Chapter 2 to illustrate the in-teraction of firms and households in markets. We use it here to illustrate the flow of spending and money in the economy. Firms sell goods and services to three groups: domestic house-holds, foreign firms and households, and the government. Expenditures by foreign firms and households (shown as “Rest of the World” in the diagram) on domestically produced goods and services are called exports. For example, American Airlines sells many tickets to passengers in Europe and Asia. As noted at the bottom of Figure 8.1, we can measure GDP by adding up the total expenditures of these groups on goods and services.
Firms use the factors of production—labor, capital, natural resources, and entrepreneurship—to produce goods and services. Households supply the factors of pro-duction to firms in exchange for income. We divide income into four categories: wages,
Figure 8.1 the Circular Flow and the Measurement of GDP
The circular-flow diagram illustrates the flow of spending and money in the economy. Firms sell goods and services to three groups: domestic households, for-eign firms and households, and the government. To produce goods and services, firms use factors of production: labor, capital, natural resources, and entrepre-neurship. Households supply the factors of production to firms in exchange for income in the form of wages, interest, profit, and rent. Firms make payments of wages and interest to households in exchange for hiring workers and other factors
of production. The sum of wages, interest, rent, and profit is total income in the economy. We can measure GDP as the total income received by households. The diagram also shows that households use their income to purchase goods and ser-vices, pay taxes, and for savings. Firms and the government borrow the funds that flow from households into the financial system. We can measure GDP either by calculating the total value of expenditures on final goods and services or by calcu-lating the value of total income.
GDP can be measured by total expenditures on goods and services by households, firms, government, and the rest of the world.
GDP can be measured by total wages, interest, rent, and profits received by households.
Payments of wages andinterest, andtransfer payments
Taxes
TaxesExpenditures on goods and services
Expenditures by foreign households on exports
Exp
endi
ture
s on
goo
ds a
nd s
ervi
ces
Borro
wing
Exp
endi
ture
s by
dom
estic
households on imports
Borrowing
Saving
Payments of wages, interest, rent, and profit
Firms
Government
Households
Financial SystemRest of the World
MyEconLab Animation
M08_HUBB5496_05_SE_C08.indd 241 18/11/13 10:24 AM

8 C h a P t E R 8 GDP: Measuring Total Production and Income
interest, rent, and profit. Firms pay wages to households in exchange for labor services, interest for the use of capital, and rent for natural resources such as land. Profit is the income that remains after a firm has paid wages, interest, and rent. Profit is the return to entrepreneurs and other business owners for bearing the risk of producing and sell-ing goods and services. As Figure 8.1 shows, federal, state, and local governments make payments of wages and interest to households in exchange for hiring workers and other factors of production. Governments also make transfer payments to households. Transfer payments include Social Security payments to retired and disabled people and unemploy-ment insurance payments to unemployed workers. These payments are not included in GDP because they are not received in exchange for production of a new good or service. The sum of wages, interest, rent, and profit is total income in the economy. As noted at the top of Figure 8.1, we can measure GDP as the total income received by households.
The diagram also allows us to trace the ways that households use their income. House-holds spend some of their income on goods and services. Some of this spending is on domestically produced goods and services, and some is on foreign-produced goods and services. Spending on foreign-produced goods and services is known as imports. House-holds use some of their income to pay taxes to the government. (Note that firms also pay taxes to the government.) Households also use some of the income they earn to save by making deposits in checking or savings accounts in banks or by buying stocks or bonds. Banks and stock and bond markets make up the financial system. The flow of funds from households into the financial system makes it possible for the government and firms to borrow. As we will see, the health of the financial system is vital to an economy. Without the ability to borrow funds through the financial system, firms will have difficulty expand-ing and adopting new technologies. In fact, no country without a well-developed financial system has been able to sustain high levels of economic growth.
The circular-flow diagram shows that we can measure GDP either by calculating the total value of expenditures on final goods and services or by calculating the value of total income. We get the same dollar amount of GDP with either approach.
Components of GDPThe BEA divides its statistics on GDP into four major categories of expenditures: consump-tion, investment, government purchases, and net exports. Economists use these categories to understand why GDP fluctuates and to forecast future GDP.
Personal Consumption Expenditures, or “Consumption” Consumption ex-penditures are made by households and are divided into expenditures on services, such as medical care, education, and haircuts; expenditures on nondurable goods, such as food and clothing; and expenditures on durable goods, such as automobiles and furniture. The spending by households on new houses is not included in consumption. Instead, spend-ing on new houses is included in the investment category, which we discuss next.
Gross Private Domestic Investment, or “Investment” Spending on gross private domestic investment, or simply investment, is divided into three categories. Business fixed investment is spending by firms on new factories, office buildings, and machinery used to produce other goods. Beginning in 2013, this category of investment has included business spending on research and development. The BEA had previously considered this type of spending to be an intermediate good. Residential investment is spending by households and firms on new single-family and multi-unit houses. Changes in business inventories are also included in investment. Inventories are goods that have been produced but not yet sold. If Ford has $200 million worth of unsold cars at the beginning of the year and $350 million worth of unsold cars at the end of the year, then the firm has spent $150 million on inventory investment during the year.
Government Consumption and Gross Investment, or “Government Purchases” Government purchases are spending by federal, state, and local govern-ments on goods and services, such as teachers’ salaries, highways, and aircraft carriers. Again, government spending on transfer payments is not included in government pur-chases because it does not result in the production of new goods and services.
Transfer payments Payments by the government to households for which the government does not receive a new good or service in return.
MyEconLab Concept Check
Consumption Spending by households on goods and services, not including spending on new houses.
Investment Spending by firms on new factories, office buildings, machinery, and additions to inventories, plus spending by households and firms on new houses.
Government purchases Spending by federal, state, and local governments on goods and services.
M08_HUBB5496_05_SE_C08.indd 242 18/11/13 10:24 AM

Gross Domestic Product Measures Total Production 9
Net Exports of Goods and Services, or “Net Exports” Net exports are equal to exports minus imports. Exports are goods and services produced in the United States and purchased by foreign firms, households, and governments. We add exports to our other categories of expenditures because otherwise we would not be including all spending on new goods and services produced in the United States. For example, if a farmer in South Dakota sells wheat to China, the value of the wheat is included in GDP because it represents production in the United States. Imports are goods and services produced in foreign countries and purchased by U.S. firms, households, and governments. We subtract imports from total expenditures because otherwise we would be including spending that does not result in production of new goods and services in the United States. For example, if U.S. consumers buy $1 billion worth of furniture manufactured in China, that spending is included in consumption expendi-tures. But the value of those imports is subtracted from GDP because the imports do not represent production in the United States.
an Equation for GDP and Some actual ValuesA simple equation sums up the components of GDP:
Y = C + I + G + NX.
The equation tells us that GDP (denoted as Y) equals consumption (C) plus investment (I) plus government purchases (G) plus net exports (NX). Figure 8.2 shows the values of the components of GDP for the year 2012. The graph in the figure highlights the fact that consumption is by far the largest component of GDP. The table provides a more detailed breakdown and shows several interesting points:
• Consumer spending on services is greater than the sum of spending on durable and nondurable goods. There has been a continuing trend in the United States and other high-income countries away from the production of goods and toward the produc-tion of services. As the populations of these countries have become, on average, both older and wealthier, their demand for services such as medical care and financial advice has increased faster than their demand for goods.
• Business fixed investment is the largest component of investment. As we will see in later chapters, spending by firms on new factories, computers, and machinery can fluctuate. For example, a decline in business fixed investment played an important role in the 2007–2009 recession.
• Purchases made by state and local governments are greater than purchases made by the federal government. Because basic government activities, such as education and law enforcement, occur largely at the state and local levels, state and local government spending is greater than federal government spending.
Net exports Exports minus imports.
MyEconLab Concept Check
Don’t Let this happen to You Remember What economists Mean by Investment
Notice that the definition of investment in this chapter is nar-rower than in everyday use. For example, people often say they are investing in the stock market or in rare coins. As we have seen, economists reserve the word investment for purchases of machinery, factories, and houses. Economists don’t include purchases of shares of stock or rare coins or deposits in sav-ings accounts in the definition of investment because these activities don’t result in the production of new goods. For ex-ample, a share of Microsoft stock represents part ownership
of that company. When you buy a share of Microsoft stock, nothing new is produced; there is just a transfer from the seller to you of that small piece of ownership of Microsoft. Similarly, buying a rare coin or putting $1,000 into a savings account does not result in an increase in production. GDP is not affected by any of these activities, so they are not included in the economic definition of investment.
MyEconLab Study Plan
Your Turn: test your understanding by doing related
problem 1.11 on page 257 at the end of this chapter.
M08_HUBB5496_05_SE_C08.indd 243 18/11/13 10:24 AM

10 C h a p t e r 8 GDP: Measuring Total Production and Income
• Imports are greater than exports, so net exports are negative. We will discuss in a later chapter why imports have typically been larger than exports for the U.S. economy (see Chapter 18).
adding More of Lady Gaga to GDpThe BEA continually studies ways to improve its measurement of GDP. Recently, the BEA has changed how it accounts for spend-ing on research and development (R&D). Prior to 2013, the BEA considered R&D by firms or the government to be an intermedi-
ate good, just as tires or batteries are considered intermediate goods in automobile manu-facturing. But spending on R&D is similar to investment spending. For example, when Ford buys new machine tools—which are included in investment spending—it does so to help manufacture automobiles now and in the future. Similarly, when Ford spends on R&D to improve the battery in its Ford Focus electric car, it does so to help improve the car now and in the future. In 2013, the BEA decided to begin counting spending on research and development as investment. In other words, the BEA shifted from not counting spending on research and development as part of GDP to counting it.
Typically, the term research and development brings to mind scientists working in labo-ratories trying to develop new pharmaceutical drugs or improved computer chips. But just as firms and the government devote resources to research and development, movie and television studios, book authors, and musicians devote time and resources to producing new movies, television programs, books, and recordings. In past years, the BEA counted spending by firms and individuals on developing entertainment products as part of the cost of producing those products, in the same way that it counted the cost of labor and materials. So the cost of developing entertainment products was not included in GDP. But in 2013, the BEA changed its procedures to include spending on developing entertainment products as part of investment and began including it in GDP. For example, prior to 2013, sales of Lady Gaga’s songs on iTunes and on CDs as well as ticket sales for her concerts were included in GDP, but the cost to Lady Gaga and her record company of writing and recording her songs was not included. Now both types of spending are included in GDP.
MyEconLab Concept Check
Making the
Connection MyEconLab Video
The cost to Lady Gaga and her record company of writing and recording her songs are now part of GDP.
Figure 8.2 Components of GDp in 2012
Consumption accounts for a much larger percentage of GDP than any of the other components. In recent years, net exports have typically been negative, which reduces GDP. Note that the subtotals may not sum to the totals for each category because of rounding.Source:U.S. Bureau of Economic Analysis.
Billionsof dollars
68.6%
15.2%19.5%
3.4%
1,000
0
1,000
2,000
3,000
4,000
5,000
6,000
7,000
8,000
9,000
10,000
11,000
$12,000
Consumption Investment Governmentpurchases
Net exports
COMPONENTS OF GDP(billions of dollars)
Consumption
Durable goods
Nondurable goods
Services
Investment
Business fixed investment
Residential investment
Change in business inventories
Government purchases
Federal
State and local
Net Exports
Exports
Imports
Total GDP
$1,203
2,567
7,380
1,970
439
66
1,296
1,871
2,196
2,743
$11,150
2,475
3,167
–547
$16,245
MyEconLab Real-time data
M08_HUBB5496_05_SE_C08.indd 244 19/11/13 4:11 AM

Gross Domestic Product Measures Total Production 11
By broadening the definition of investment spending, the BEA increased measured GDP in 2013 by about 3 percent. The BEA adjusted its historical data on GDP back to 1929, so while the levels of GDP increased, the changes in GDP from one year to the next were not greatly affected. The BEA makes changes to its calculations of GDP after consulting with government statistical agencies in other countries. The objective is to allow economists, firms, and policymakers to more accurately compare GDP in differ-ent countries. The broadening of the definition of investment was meant to increase the importance of intellectual property (IP), such as software, movies, and books, in GDP. A study by the U.S. Patent and Trademark Office estimated that in the United States, IP-intensive industries, including pharmaceuticals, computers and software, telecom-munications, book publishing, and radio and television broadcasting, account for about 40 million jobs and more than one-third of GDP.
As the economy changes over time, the BEA evaluates whether to adjust how it measures GDP.Sources: David Kestenbaum, “Lady Gaga Writing a New Song Is Like a Factory Investing in a New Machine,” www.npr.org, April 25, 2013; Osagie Imasogie and Thaddeus J. Kobylarz, “Yes, Lady Gaga’s Songs Contribute to GDP,” Wall Street Journal, May 27, 2013; U.S. Bureau of Economic Analysis, “Preview of the 2013 Comprehensive Revision of the National Income and Product Accounts,” Survey of Current Business, Vol. 93, No. 3, March 2013; and U.S. Department of Commerce, Intel-lectual Property and the U.S. Economy: Industries in Focus, March 2012.
Your Turn: Test your understanding by doing related problem 1.12 on page 257 at the end of this chapter.
Measuring GDP Using the Value-added MethodWe have seen that GDP can be calculated by adding together all expenditures on final goods and services. An alternative way of calculating GDP is the value-added method. Value added refers to the additional market value a firm gives to a product and is equal to the difference between the price for which the firm sells a good and the price it paid other firms for intermediate goods. Table 8.1 gives a hypothetical example of the value added by each firm involved in the production of a shirt offered for sale on L.L.Bean’s Web site.
Suppose a cotton farmer sells $1 of raw cotton to a textile mill. If, for simplicity, we ignore any inputs the farmer may have purchased from other firms—such as cot-tonseed or fertilizer—then the farmer’s value added is $1. The textile mill then weaves the raw cotton into cotton fabric, which it sells to a shirt company for $3. The textile mill’s value added ($2) is the difference between the price it paid for the raw cotton ($1) and the price for which it can sell the cotton fabric ($3). Similarly, the shirt com-pany’s value added is the difference between the price it paid for the cotton fabric ($3) and the price it receives for the shirt from L.L.Bean ($15). L.L.Bean’s value added is the difference between the price it pays for the shirt ($15) and the price for which it can sell the shirt on its Web site ($35). Notice that the price of the shirt on L.L.Bean’s Web site is exactly equal to the sum of the value added by each firm involved in the production of the shirt. We can calculate GDP by adding up the market value of every final good
MyEconLab Study Plan
Value added The market value a firm adds to a product.
table 8.1
Calculating Value Added
Firm Value of Product Value Added
Cotton farmer Value of raw cotton = $1 Value added by cotton farmer = 1
Textile mill Value of raw cotton woven into cotton fabric = $3
Value added by textile mill = 1$3 - $12
= 2
Shirt company Value of cotton fabric made into a shirt = $15
Value added by shirt company = 1$15 - $32
= 12
L.L.Bean Value of shirt for sale on L.L.Bean’s Web site = $35
Value added by L.L.Bean = 1$35 - $152
= 20
Total Value Added = $35
M08_HUBB5496_05_SE_C08.indd 245 18/11/13 10:24 AM

12 C h a P t E R 8 GDP: Measuring Total Production and Income
and service produced during a particular period. Or, we can arrive at the same value for GDP by adding up the value added by every firm involved in producing those final goods and services.
Does GDP Measure What We Want It to Measure?Economists use GDP to measure total production in the economy. For that purpose, we would like GDP to be as comprehensive as possible, not overlooking any significant production that takes place in the economy. Most economists believe that GDP does a good—but not flawless—job of measuring production. GDP is also sometimes used as a measure of well-being. Although it is generally true that the more goods and services people have, the better off they are, we will see that GDP provides only a rough measure of well-being.
Shortcomings in GDP as a Measure of total ProductionWhen the BEA calculates GDP, it does not include two types of production: production in the home and production in the underground economy.
Household Production With few exceptions, the BEA does not attempt to es-timate the value of goods and services that are not bought and sold in markets. If a carpenter makes and sells bookcases, the value of those bookcases will be counted in GDP. If the carpenter makes a bookcase for personal use, it will not be counted in GDP. Household production refers to goods and services people produce for them-selves. The most important type of household production is the services a home-maker provides to the homemaker’s family. If a person has been caring for children, cleaning the house, and preparing the family meals, the value of such services is not included in GDP. If the person then decides to work outside the home, enrolls the children in day care, hires a cleaning service, and begins buying the family’s meals in restaurants, the value of GDP will rise by the amount paid for day care, clean-ing services, and restaurant meals, even though production of these services has not actually increased.
The Underground Economy Individuals and firms sometimes conceal the buying and selling of goods and services, in which case their production isn’t counted in GDP. Individuals and firms conceal what they buy and sell for three basic reasons: They are dealing in illegal goods and services, such as drugs or prostitution; they want to avoid paying taxes on the income they earn; or they want to avoid government regulations. This concealed buying and selling is called the underground economy. Estimates of the size of the underground economy in the United States vary widely, but it is probably at most 10 percent of measured GDP, or about $1.7 trillion. The underground economy in some low-income countries, such as Zimbabwe or Peru, may be more than 50 percent of measured GDP.
Is not counting household production or production in the underground economy a serious shortcoming of GDP? Most economists would answer “no” because the most important use of GDP is to measure changes in how the economy is performing over short periods of time, such as from one year to the next. For this purpose, omitting household production and production in the underground economy doesn’t matter be-cause there is not likely to be much change in household production or the size of the underground economy from one year to the next.
We also use GDP to measure how production of goods and services grows over fairly long periods of a decade or more. For this purpose, omitting household produc-tion and production in the underground economy may be more important. For exam-ple, beginning in the 1970s, the number of women working outside the home increased dramatically. Some of the goods and services—such as childcare and restaurant meals—produced in the following years were not true additions to total production; rather, they were replacing what had been household production.
MyEconLab Concept CheckMyEconLab Study Plan
8.2 LearnIng ObjecTIve
Discuss whether GDP is a good measure of well-being.
Underground economy Buying and selling of goods and services that is concealed from the government to avoid taxes or regulations or because the goods and services are illegal.
MyEconLab Concept Check
M08_HUBB5496_05_SE_C08.indd 246 18/11/13 10:24 AM

Does GDP Measure What We Want It to Measure? 13
Why Do Many Developing Countries have Such Large Underground Economies?Recent estimates put the size of the
underground economy at 8 percent of measured GDP in the United States and 13 percent in Western Europe. The under-ground economy is much larger in many developing countries—perhaps 50 percent or more of measured GDP. In developing countries, the underground economy is often referred to as the informal sector, as opposed to the formal sector, in which output of goods and services is measured. Although it might not seem to matter whether production of goods and services is mea-sured and included in GDP or unmeasured, a large informal sector can be a sign of government policies that are retarding economic growth.
Because firms in the informal sector are acting illegally, they tend to be smaller and have less capital than firms acting legally. The entrepreneurs who start firms in the informal sector may be afraid the govern-ment could someday close or confiscate their firms. Therefore, the entrepreneurs limit their investments in these firms. As a consequence, workers in these firms have less machinery and equipment to work with and so can produce fewer goods and services. Entrepreneurs in the informal sector also have to pay the costs of avoiding government authorities. For example, construction firms operating in the informal sector in Brazil have to employ lookouts who can warn workers to hide when government inspectors come around. In many countries, firms in the informal sector have to pay substantial bribes to government officials to remain in business. The informal sector is large in some developing economies because taxes are high and government regulations are ex-tensive. For example, firms in Brazil pay 85 percent of all taxes collected, as compared with 41 percent in the United States. Not surprisingly, about half of all Brazilian workers are employed in the informal sector. In Zimbabwe and Peru, the fraction of workers in the informal sector may be as high as 60 or 70 percent. One estimate puts the size of the informal sector in India at nearly 50 percent.
Many economists believe taxes in developing countries are so high because these countries are attempting to pay for government sectors that are as large relative to their economies as the government sectors of industrial economies. Including transfer pay-ments, government spending in Brazil, for example, is 41 percent of measured GDP, compared to 36 percent in the United States. In the early twentieth century, when the United States was much poorer than it is today, government spending was only about 8 percent of GDP, so the tax burden on U.S. firms was much lower. In countries such as Brazil, bringing firms into the formal sector from the informal sector may require reductions in government spending and taxes. In most developing countries, however, voters are reluctant to see government services reduced.Sources: “Dynamic but Dirty,” Economist, December 2, 2010; “Notes from the Underground,” Economist, April 2, 2009; Mary Anastasia O’Grady, “Why Brazil’s Underground Economy Grows and Grows,” Wall Street Journal, September 10, 2004; and the International Monetary Fund.
Your Turn: Test your understanding by doing related problem 2.8 on page 258 at the end of this chapter.
Shortcomings of GDP as a Measure of Well-BeingThe main purpose of GDP is to measure a country’s total production. GDP is also frequently used, though, as a measure of well-being. For example, newspaper and mag-azine articles often include tables that show for different countries the levels of GDP per person, which is usually called GDP per capita. GDP per capita is calculated by dividing the value of GDP for a country by the country’s population. These articles
MyEconLab Study Plan
Making the
Connection MyEconLab Video
In some developing countries, more than half the workers may be in the underground economy.
M08_HUBB5496_05_SE_C08.indd 247 18/11/13 10:24 AM

14 C h a P t E R 8 GDP: Measuring Total Production and Income
imply that people in the countries with higher levels of GDP per capita are better off. Although increases in GDP often do lead to increases in the well-being of the popula-tion, it is important to be aware that GDP is not a perfect measure of well-being for several reasons.
The Value of Leisure Is Not Included in GDP If an economic consultant de-cides to retire, GDP will decline even though the consultant may value increased leisure more than the income he or she was earning running a consulting firm. The consultant’s well-being has increased, but GDP has decreased. In 1890, the typical American worked 60 hours per week. Today, the typical American works fewer than 40 hours per week. If Americans still worked 60-hour weeks, GDP would be much higher than it is now, but the well-being of a typical person would be lower because less time would be available for leisure activities.
GDP Is Not Adjusted for Pollution or Other Negative Effects of Pro-duction When a dry cleaner cleans and presses clothes, the value of this service is included in GDP. If the chemicals the dry cleaner uses pollute the air or water, GDP is not adjusted to compensate for the costs of the pollution. Similarly, the value of ciga-rettes produced is included in GDP, with no adjustment made for the costs of the lung cancer that some smokers develop.
We should note, though, that increasing GDP often leads countries to devote more resources to pollution reduction. For example, in the United States between 1970 and 2013, as GDP was steadily increasing, emissions of the six main air pol-lutants declined by more than 50 percent. Developing countries often have higher levels of pollution than high-income countries because the lower GDPs of the de-veloping countries make them more reluctant to spend resources on pollution re-
GDP Is Not Adjusted for Changes in Crime and Other Social Problems An increase in crime reduces well-being but may actually increase GDP if it leads to greater spending on police, security guards, and alarm systems. GDP is also not ad-justed for changes in divorce rates, drug addiction, or other factors that may affect peo-ple’s well-being.
GDP Measures the Size of the Pie but Not How the Pie Is Divided Up When a country’s GDP increases, the country has more goods and services, but those goods and services may be very unequally distributed. Therefore, GDP may not provide good information about the goods and services consumed by a typical person.
To summarize, we can say that a person’s well-being depends on many factors that are not considered in calculating GDP. Because GDP is designed to measure to-tal production, it should not be surprising that it does an imperfect job of measuring well-being.
Did World War II Bring Prosperity?The Great Depression of the 1930s was the worst economic downturn in U.S. history. GDP declined by more than 25 per-cent between 1929 and 1933 and did not reach its 1929 level again until 1938. The unemployment rate remained at very
high levels of 10 percent or more through 1940. Then, in 1941, the United States entered World War II. The following graph shows that GDP rose dramatically during the war years of 1941 to 1945. (The graph shows values for real GDP, which, as we will see in the next section, corrects measures of GDP for changes in the price level.) The unemploy-ment rate also fell to very low levels—below 2 percent.
MyEconLab Concept Check
Making the
Connection MyEconLab Video
M08_HUBB5496_05_SE_C08.indd 248 18/11/13 10:24 AM
duction.

Real GDP versus Nominal GDP 15
Traditionally, historians have argued that World War II brought prosperity back to the U.S. economy. But did it? Economist Robert Higgs argued that if we look at the well-being of a typical person, the World War II years were anything but prosperous. Higgs pointed out that increased production of tanks, ships, planes, and munitions accounted for most of the increase in GDP during those years. Between 1943 and 1945, more than 40 percent of the labor force was either in the military or producing war goods. As a result, between 1939 and 1944, production of clothing, radios, books, and other con-sumption goods per person increased only about 2 percent, leaving the quantity of con-sumption goods available to the typical person in 1944 still below what it had been in 1929. With the end of the war, true prosperity did return to the U.S. economy, and by 1946, production of consumption goods per person had risen by more than 25 percent from what it had been in 1929.
World War II
Real GDP(billions of
2009 dollars)
500
700
900
1,100
1,300
1,500
1,700
1,900
2,100
$2,300
1929 1932 1935 1938 1941 1944 1947 1950
World War II was a period of extraordinary sacrifice and achievement by the “great-est generation.” But statistics on GDP may give a misleading indication of whether it was also a period of prosperity.Sources: Robert Higgs, “Wartime Prosperity? A Reassessment of the U.S. Economy in the 1940s,” Journal of Economic History, Vol. 52, No. 1, March 1992; Robert Higgs, “From Central Planning to the Market: The American Transition, 1945–1947,” Journal of Economic History, Vol. 59, No. 3, September 1999; and data from the U.S. Bureau of Economic Analysis.
Your Turn: Test your understanding by doing related problem 2.10 on page 258 at the end of this chapter.
Real GDP versus Nominal GDPBecause GDP is measured in value terms, we have to be careful about interpreting changes over time. To see why, consider interpreting an increase in the total value of pickup truck production from $40 billion in 2014 to $44 billion in 2015. Because $44 billion is 10 percent greater than $40 billion, were 10 percent more trucks pro-duced in 2015 than in 2014? We can draw this conclusion only if the average price of trucks did not change between 2014 and 2015. In fact, when GDP increases from one year to the next, the increase is due partly to increases in production of goods and services and partly to increases in prices. Because we are mainly interested in GDP as a measure of production, we need a way of separating the price changes from the quantity changes.
MyEconLab Study Plan
8.3 LearnIng ObjecTIve
Discuss the difference between real GDP and nominal GDP.
M08_HUBB5496_05_SE_C08.indd 249 18/11/13 10:24 AM
16 C h a P t E R 8 GDP: Measuring Total Production and Income
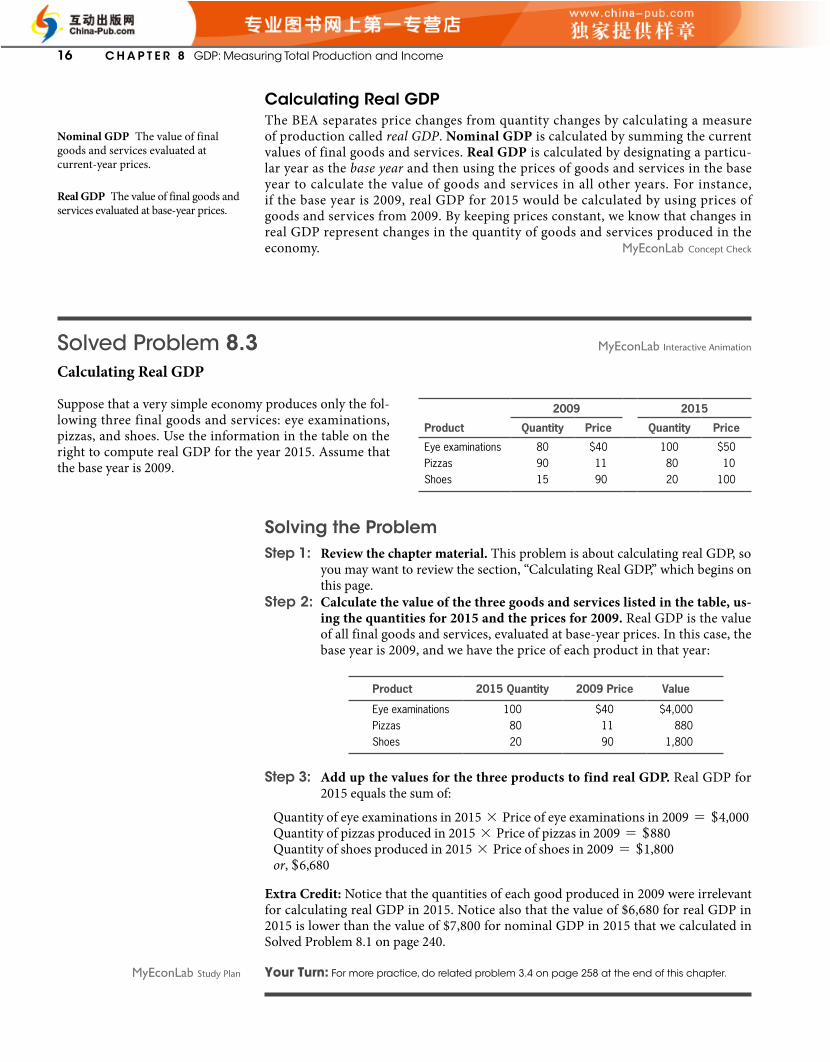
Calculating Real GDPThe BEA separates price changes from quantity changes by calculating a measure of production called real GDP. Nominal GDP is calculated by summing the current values of final goods and services. Real GDP is calculated by designating a particu-lar year as the base year and then using the prices of goods and services in the base year to calculate the value of goods and services in all other years. For instance, if the base year is 2009, real GDP for 2015 would be calculated by using prices of goods and services from 2009. By keeping prices constant, we know that changes in real GDP represent changes in the quantity of goods and services produced in the economy.
Nominal GDP The value of final goods and services evaluated at current-year prices.
Real GDP The value of final goods and services evaluated at base-year prices.
MyEconLab Concept Check
Solved problem 8.3Calculating Real GDP
MyEconLab Interactive Animation
Suppose that a very simple economy produces only the fol-lowing three final goods and services: eye examinations, pizzas, and shoes. Use the information in the table on the right to compute real GDP for the year 2015. Assume that the base year is 2009.
2009 2015
Product Quantity Price Quantity Price
Eye examinations 80 $40 100 $50Pizzas 90 11 80 10Shoes 15 90 20 100
Solving the ProblemStep 1: Review the chapter material. This problem is about calculating real GDP, so
you may want to review the section, “Calculating Real GDP,” which begins on this page.
Step 2: Calculate the value of the three goods and services listed in the table, us-ing the quantities for 2015 and the prices for 2009. Real GDP is the value of all final goods and services, evaluated at base-year prices. In this case, the base year is 2009, and we have the price of each product in that year:
Product 2015 Quantity 2009 Price Value
Eye examinations 100 $40 $4,000Pizzas 80 11 880Shoes 20 90 1,800
Step 3: Add up the values for the three products to find real GDP. Real GDP for 2015 equals the sum of:
Quantity of eye examinations in 2015 * Price of eye examinations in 2009 = +4,000Quantity of pizzas produced in 2015 * Price of pizzas in 2009 = +880Quantity of shoes produced in 2015 * Price of shoes in 2009 = +1,800or, +6,680
Extra Credit: Notice that the quantities of each good produced in 2009 were irrelevant for calculating real GDP in 2015. Notice also that the value of $6,680 for real GDP in 2015 is lower than the value of $7,800 for nominal GDP in 2015 that we calculated in Solved Problem 8.1 on page 240.
Your Turn: For more practice, do related problem 3.4 on page 258 at the end of this chapter.MyEconLab Study Plan
M08_HUBB5496_05_SE_C08.indd 250 18/11/13 10:24 AM

Real GDP versus Nominal GDP 17
One drawback to calculating real GDP using base-year prices is that, over time, prices may change relative to each other. For example, the price of smartphones may fall relative to the price of milk. Because this change is not reflected in the fixed prices from the base year, the estimate of real GDP is somewhat distorted. The further away the current year is from the base year, the worse the problem becomes. To make the calculation of real GDP more accurate, in 1996, the BEA switched to using chain-weighted prices, and it now publishes statistics on real GDP in “chained (2009) dollars.”
The details of calculating real GDP using chain-weighted prices are more com-plicated than we need to discuss here, but the basic idea is straightforward: Starting with the base year, the BEA takes an average of prices in that year and prices in the following year. It then uses this average to calculate real GDP in the year following the base year (currently the year 2009). For the next year—in other words, the year that is two years after the base year—the BEA calculates real GDP by taking an aver-age of prices in that year and the previous year. In this way, prices in each year are “chained” to prices from the previous year, and the distortion from changes in rela-tive prices is minimized.
Holding prices constant means that the purchasing power of a dollar remains the same from one year to the next. Ordinarily, the purchasing power of the dollar falls every year as price increases reduce the amount of goods and services that a dollar can buy.
Comparing Real GDP and Nominal GDPReal GDP holds prices constant, which makes it a better measure than nominal GDP of changes in the production of goods and services from one year to the next. In fact, growth in the economy is almost always measured as growth in real GDP. If a headline in the Wall Street Journal states “U.S. Economy Grew 2.3% Last Year,” the article will report that real GDP increased by 2.3 percent during the previous year.
We describe real GDP as being measured in “base-year dollars.” For example, nomi-nal GDP in 2012 was $16,245 billion, and, with a base year of 2009, real GDP in 2012 was $15,471 billion in 2009 dollars. Because, on average, prices rise from one year to the next, real GDP is greater than nominal GDP in years before the base year and less than nominal GDP for years after the base year. In the base year, real GDP and nominal GDP are the same because both are calculated for the base year using the same prices and quantities. Figure 8.3 shows movements in nominal GDP and real GDP between
GDP (billionsof dollars)
Base year(2009)
5,000
6,000
7,000
8,000
9,000
10,000
11,000
12,000
13,000
14,000
15,000
$16,000
1990 1992 1994 1996 1998 2000 2002 2004 2006 2008 2010 2012
Real GDP
Nominal GDP
Figure 8.3
Nominal GDP and Real GDP, 1990–2012
Currently, the base year for calculating GDP is 2009. In the years before 2009, prices were, on average, lower than in 2009, so nominal GDP was lower than real GDP. In 2009, nominal and real GDP were equal. Since 2009, prices have been, on average, higher than in 2009, so nominal GDP is higher than real GDP.Source: U.S. Bureau of Economic Analysis.
MyEconLab Real-time data
M08_HUBB5496_05_SE_C08.indd 251 18/11/13 10:24 AM

18 C h a P t E R 8 GDP: Measuring Total Production and Income
1990 and 2012. In the years before 2009, prices were, on average, lower than in 2009, so nominal GDP was lower than real GDP. In 2009, nominal and real GDP were equal. Since 2009, prices have been, on average, higher than in 2009, so nominal GDP is higher than real GDP.
the GDP DeflatorEconomists and policymakers are interested not just in the level of total production, as measured by real GDP, but also in the price level. The price level measures the average prices of goods and services in the economy. One of the goals of economic policy is to maintain a stable price level. We can use values for nominal GDP and real GDP to com-pute a measure of the price level called the GDP deflator. We calculate the GDP deflator using this formula:
GDP deflator =Nominal GDP
Real GDP* 100.
To see why the GDP deflator is a measure of the price level, think about what would happen if prices of goods and services rose while production remained the same. In that case, nominal GDP would increase, but real GDP would remain constant, so the GDP deflator would increase. In reality, both prices and production usually increase each year, but the more prices increase relative to the increase in production, the more nominal GDP increases relative to real GDP, and the higher the value for the GDP defla-tor. Increases in the GDP deflator allow economists and policymakers to track increases in the price level over time.
Remember that in the base year (currently 2009), nominal GDP is equal to real GDP, so the value of the GDP price deflator will always be 100 in the base year. The following table gives the values for nominal and real GDP for 2011 and 2012:
2011 2012
Nominal GDP $15,534 billion $16,245 billion
Real GDP $15,052 billion $15,471 billion
We can use the information from this table to calculate values for the GDP price defla-tor for 2011 and 2012:
Formula Applied to 2011 Applied to 2012
GDP deflator = aNominal GDP
Real GDPb * 100 a$15,534 billion
$15,052 billionb * 100 = 103 a$16,245 billion
$15,471 billionb * 100 = 105
From these values for the deflator, we can calculate that the price level increased by 1.9 percent between 2011 and 2012:
a 105 - 103103
b * 100 = 1.9%.
In the next chapter, we will see that economists and policymakers also rely on another measure of the price level, known as the consumer price index. In ad-dition, we will discuss the strengths and weaknesses of different measures of the price level.
MyEconLab Concept Check
Price level A measure of the average prices of goods and services in the economy.
GDP deflator A measure of the price level, calculated by dividing nominal GDP by real GDP and multiplying by 100.
MyEconLab Concept CheckMyEconLab Study Plan
M08_HUBB5496_05_SE_C08.indd 252 18/11/13 10:24 AM
Other Measures of Total Production and Total Income 19
Other Measures of total Production and total IncomeNational income accounting refers to the methods the BEA uses to track total production and total income in the economy. The statistical tables containing this information are called the National Income and Product Accounts (NIPA) tables. Every quarter, the BEA releases NIPA tables containing data on several measures of total production and total income. We have already discussed GDP, which is the most important measure of total production and total income. In addition to computing GDP, the BEA computes the following four measures of production and income: gross national product, national income, personal income, and disposable personal income.
Gross National ProductWe have seen that GDP is the value of final goods and services produced within the United States. Gross national product (GNP) is the value of final goods and ser-vices produced by residents of the United States, even if the production takes place outside the United States. U.S. firms have facilities in foreign countries, and foreign firms have facilities in the United States. Ford, for example, has assembly plants in the United Kingdom, and Toyota has assembly plants in the United States. GNP includes foreign production by U.S. firms but excludes U.S. production by foreign firms. For the United States, GNP is almost the same as GDP. For example, in 2012, GDP was $16,245 billion, and GNP was $16,497 billion, or only about 1.5 percent more than GDP.
For many years, GNP was the main measure of total production compiled by the federal government and used by economists and policymakers in the United States. However, in many countries other than the United States, a significant per-centage of domestic production takes place in foreign-owned facilities. For those countries, GDP is much larger than GNP and is a more accurate measure of the level of production within the country’s borders. As a result, many countries and international agencies had long preferred using GDP to using GNP. In 1991, the United States joined those countries in using GDP as its main measure of total production.
National IncomeIn producing goods and services, some machinery, equipment, and buildings wear out and have to be replaced. The value of this worn-out machinery, equipment, and buildings is called depreciation. In the NIPA tables, depreciation is called the consumption of fixed capital. If we subtract this value from GDP, we are left with national income.
Previously in this chapter, we stressed that the value of total production is equal to the value of total income. This point is not strictly true if by “value of total production” we mean GDP and by “value of total income” we mean national income because na-tional income will always be smaller than GDP by an amount equal to depreciation. In practice, though, the difference between the value of GDP and value of national income does not matter for most macroeconomic issues.
Personal IncomePersonal income is income received by households. To calculate personal income, we sub-tract the earnings that corporations retain rather than pay to shareholders in the form of dividends. We also add in the payments received by households from the government in the form of transfer payments or interest on government bonds.
8.4 LearnIng ObjecTIve
Understand other measures of total production and total income.
MyEconLab Concept Check
MyEconLab Concept Check
MyEconLab Concept Check
M08_HUBB5496_05_SE_C08.indd 253 18/11/13 10:24 AM

20 C h a P t E R 8 GDP: Measuring Total Production and Income
Disposable Personal IncomeDisposable personal income is equal to personal income minus personal tax payments, such as the federal personal income tax. It is the best measure of the income households actually have available to spend.
Figure 8.4 shows the values of these measures of total production and total income for 2012 in a table and a graph.
the Division of IncomeFigure 8.1 on page 241 illustrates the important fact that we can measure GDP in terms of total expenditure or as the total income received by households. GDP calculated as the sum of income payments to households is sometimes called gross domestic income. Figure 8.5 shows the division of total income among wages, interest, rent, profit, and certain non-income items. The non-income items are included in gross domestic in-come because sales taxes, depreciation, and a few other items are included in the value of goods and services produced but are not directly received by households as income. Wages include all compensation received by employees, including fringe benefits such as health insurance. Interest is net interest received by households, or the difference be-tween the interest received on savings accounts, government bonds, and other invest-ments and the interest paid on car loans, home mortgages, and other debts. Rent is rent received by households. Profits include the profits of sole proprietorships, which are usually small businesses, and the profits of corporations. Figure 8.5 shows that the larg-est component of gross domestic income is wages, which are about three times as large as profits.
MyEconLab Concept Check
MyEconLab Concept Check
Figure 8.4 Measures of total Production and total Income, 2012
The most important measure of total production and total income is gross domestic product (GDP). As we will see in later chapters, for some purposes, the other measures of total production and total income shown in the figure turn out to be more useful than GDP.Source: U.S. Bureau of Economic Analysis.
GDP
GNP
National income
Personal income
Disposable personal income
$16,245
16,498
13,972
13,744
12,246
MeasureBillions
of dollars
Billionsof dollars
0
2,000
4,000
6,000
8,000
10,000
12,000
14,000
16,000
$18,000
GDP GNP Nationalincome
Personalincome
Disposablepersonalincome
MyEconLab Real-time data
M08_HUBB5496_05_SE_C08.indd 254 18/11/13 10:24 AM

conclusion 21
What’s the Best Country for You to Work In?
At the beginning of the chapter, we posed two questions: What effect should Canada’s and China’s two very different growth rates of GDP have on your decision to work and live in one country or the other? And if China’s much higher growth rate does not necessarily lead you to decide to work and live in China, why not? This chapter has shown that although it is generally true that the more goods and services people have, the better off they are, GDP provides only a rough measure of well-being. GDP does not include the value of leisure; nor is it adjusted for pollution and other negative effects of production or crime and other social problems. So, in deciding where to live and work, you would need to balance China’s much higher growth rate of GDP against these other considerations. You would also need to take into account that although China’s growth rate is higher than Canada’s, Canada’s current level of real GDP is higher than China’s.
Continued from page 237
Economics in Your Life
ConclusionIn this chapter, we have begun the study of macroeconomics by examining an important concept: how a country’s total production and income can be measured. Understanding GDP is important for understanding the business cycle and the process of long-run economic growth. In the next chapter, we discuss the issues involved in measuring two other key economic variables: the unemployment rate and the inflation rate.
Visit MyEconLab for a news article and analysis related to the concepts in this chapter.
Figure 8.5 the Division of Income, 2012
We can measure GDP in terms of total expenditure or as the total income received by households. The largest component of income received by households is wages, which are more than three times as large as the profits received by sole proprietors and the profits received by corporations combined.
Note: The components in the figure do not sum to 100% because of rounding.Source: U.S. Bureau of Economic Analysis.
Billionsof dollars
Wages
Interest
Rent
Profit
Profits of sole proprietors
Profits of corporations
Taxes, depreciation, and
statistical discrepancy
1,225
1,591
$8,620
597
541
2,815
3,668
Wages, 53%
Taxes, depreciation, andstatistical discrepancy, 23%
Rent, 3%
Profits ofcorporations, 10%
Interest, 4%
Profits of soleproprietors, 8%
MyEconLab Animation
M08_HUBB5496_05_SE_C08.indd 255 18/11/13 10:24 AM

22 C h a P t E R 8 GDP: Measuring Total Production and Income
Chapter Summary and ProblemsKey terms
Business cycle, p. 238Consumption, p. 242Economic growth, p. 238Expansion, p. 238Final good or service, p. 239GDP deflator, p. 252
Government purchases, p. 242Gross domestic product (GDP), p. 239Inflation rate, p. 238Intermediate good or service, p. 239
Investment, p. 242Macroeconomics, p. 238Microeconomics, p. 238Net exports, p. 243Nominal GDP, p. 250Price level, p. 252
Real GDP, p. 250Recession, p. 238Transfer payments, p. 242Underground economy, p. 246Value added, p. 245
Gross Domestic Product Measures total Production, pages 239–246 8.1 LearNING OBJeCtIVe: explain how total production is measured.
SummaryEconomics is divided into the subfields of microeconomics—which studies how households and firms make choices—and macroeconomics—which studies the economy as a whole. An im-portant macroeconomic issue is the business cycle, which refers to alternating periods of economic expansion and economic recession. An expansion is a period during which production and employment are increasing. A recession is a period during which production and employment are decreasing. Another important macroeconomic topic is economic growth, which refers to the ability of the economy to produce increasing quantities of goods and services. Macroeco-nomics also studies the inflation rate, or the percentage increase in the price level from one year to the next. Economists measure total production by gross domestic product (GDP), which is the value of all final goods and services produced in an economy during a pe-riod of time. A final good or service is purchased by a final user. An intermediate good or service is an input into another good or ser-vice and is not included in GDP. When we measure the value of total production in the economy by calculating GDP, we are simultane-ously measuring the value of total income. GDP is divided into four major categories of expenditures: consumption, investment, gov-ernment purchases, and net exports. Consumption is spending by households on goods and services, not including spending on new houses. Investment is spending by firms on new factories, office buildings, machinery, research and development, and additions to inventories, plus spending by households and firms on new houses. Government purchases is spending by federal, state, and local gov-ernments on goods and services. Net exports are equal to exports minus imports. Government transfer payments are not included in GDP because they are payments to individuals for which the gov-ernment does not receive a good or service in return. We can also calculate GDP by adding up the value added by every firm involved in producing final goods and services.
MyEconLab visit www.myeconlab.com to complete these exercises online and get instant feedback.
review Questions 1.1 Why in microeconomics do we measure production in
terms of quantity, but in macroeconomics we measure production in terms of market value?
1.2 If the U.S. Bureau of Economic Analysis added up the val-ues of every good and service sold during the year, would the total be larger, smaller, or equal to GDP?
1.3 In the circular flow of income, why must the value of total production in an economy equal the value of total income?
1.4 Describe the four major components of expenditures in GDP, and write the equation that represents the re-lationship between GDP and the four expenditure components.
1.5 What is meant by a firm’s “value added”?
problems and applications 1.6 A student remarks: “It doesn’t make sense that interme-
diate goods are not counted in GDP. A computer chip is an intermediate good, and without it a PC won’t work. So why don’t we count the computer chip in GDP?” Provide an answer for the student’s question.
1.7 Briefly explain whether each of the following transactions represents the purchase of a final good.
a. The purchase of flour by a bakery b. The purchase of an aircraft carrier by the federal
government c. The purchase of French wine by a U.S. consumer d. The purchase of a new airliner by American Airlines 1.8 [Related to the chapter Opener on page 237] Which
component of GDP will be affected by each of the follow-ing transactions involving Ford Motor Company? If you believe that none of the components of GDP will be af-fected by the transactions, briefly explain why.
a. You purchase a new Ford Escape Hybrid from a Ford dealer.
b. You purchase a 2011 Ford Escape Hybrid from a friend. c. Ford purchases door handles for the Escape from an
auto parts manufacturer in Indiana. d. Ford produces 1,000 Escapes in a factory in Missouri
and ships them to a car dealer in Shanghai, China. e. Ford purchases new machine tools to use in its Mis-
souri Escape factory. f. The state of Missouri builds a new highway to help im-
prove access to the Ford Escape plant.
M08_HUBB5496_05_SE_C08.indd 256 18/11/13 10:24 AM

chapter Summary and Problems 23
1.9 Is the value of a house built in 2006 and resold in 2015 included in the GDP of 2015? Briefly explain. Would the services of the real estate agent who helped sell (or buy) the house in 2015 be counted in GDP for 2015? Briefly explain.
1.10 [Related to Solved Problem 8.1 on page 240] Suppose that a simple economy produces only four goods: shoes, hamburgers, shirts, and cotton. Assume that all the cotton is used in the production of shirts. Use the information in the following table to calculate nominal GDP for 2015:
Production and Price Statistics for 2015
Product Quantity Price
Shoes 100 $60.00Hamburgers 100 2.00Shirts 50 25.00Cotton 80 0.60
1.11 [Related to the Don’t Let This Happen to You on page 243] Briefly explain whether you agree with the follow-ing statement: “In years when people buy many shares of stock, investment will be high and, therefore, so will GDP.”
1.12 [Related to the Making the connection on page 244] According to Dan Sichel, an economist at Wellesley College, the amount of time a singer spends working on a record al-bum in a recording studio is “quite analogous to a factory investing in a new machine.” Do you agree? Briefly explain.Source: David Kestenbaum, “Lady Gaga Writing a New Song Is Like a Factory Investing in a New Machine,” www.npr.org, April 25, 2013.
1.13 An artist buys scrap metal from a local steel mill as a raw ma-terial for her metal sculptures. Last year, she bought $5,000 worth of the scrap metal. During the year, she produced 10 metal sculptures that she sold for $800 each to a local art store. The local art store sold all of the sculptures to local art collectors, at an average price of $1,000 each. For the 10 metal sculptures, what was the total value added by the artist, and what was the total value added by the local art store?
Does GDP Measure What We Want It to Measure? pages 246–249 8.2 LearNING OBJeCtIVe: Discuss whether GDp is a good measure of well-being.
SummaryGDP does not include household production, which refers to goods and services people produce for themselves, nor does it in-clude production in the underground economy, which consists of concealed buying and selling. The underground economy in some developing countries may be more than half of measured GDP. GDP is not a perfect measure of well-being because it does not include the value of leisure, it is not adjusted for pollution or other negative effects of production, and it is not adjusted for changes in crime and other social problems.
MyEconLab visit www.myeconlab.com to complete these exercises online and get instant feedback.
review Questions 2.1 Why does the size of a country’s GDP matter? How does it
affect the quality of life of the country’s people? 2.2 What is the underground economy? Why do some countries
have larger underground economies than other countries? 2.3 Why is GDP an imperfect measure of economic well-
being? What types of production does GDP not measure? If GDP included these types of production, would it still be an imperfect measure of economic well-being?
problems and applications 2.4 Which of the following are likely to increase measured
GDP, and which are likely to reduce it? a. The fraction of women working outside the home
increases. b. There is a sharp increase in the crime rate. c. Higher tax rates cause some people to hide more of the
income they earn.
2.5 Michael Burda of Humboldt University in Germany and Daniel Hamermesh of the University of Texas examined how workers in the United States who lost their jobs be-tween 2003 and 2006 spent their time. They discovered that during the period when the workers were unem-ployed, the decline in the number of hours of paid work these workers did was almost the same as the increase in the number of hours these workers devoted to household production. Do Burda and Hamermesh’s findings allow us to draw any conclusions about whether total produc-tion in the economy—whether that production is included in GDP or not—decreased when these workers became unemployed? Does your answer depend on whether the household production they carried out while unemployed involved activities, such as childcare, that the workers had been paying other people to perform before the workers lost their jobs? Briefly explain.Source: Michael Burda and Daniel S. Hamermesh, “Unemployment, Market Work, and Household Production,” Economic Letters, Vol. 107, May 2010, pp. 131–133.
2.6 A typical American today works fewer than 40 hours per week, while a typical American in 1890 worked 60 hours per week. Does this difference in the length of work weeks matter in comparing the economic well-being of Ameri-cans today with that of 1890? Or can we use the difference between real GDP per capita today and in 1890 to measure differences in economic well-being while ignoring differ-ences in work weeks? Briefly explain.
2.7 Economic historians Roger Ransom and Richard Sutch have estimated that African-American farmers in the U.S. South after the Civil War worked about 30 percent fewer hours per year than they had as slaves before the Civil War. If after the Civil War, African-American farmers had con-tinued to work these additional hours, their production and income would have been higher and so would have
M08_HUBB5496_05_SE_C08.indd 257 18/11/13 10:24 AM

24 C h a p t e r 8 GDP: Measuring Total Production and Income
been U.S. GDP. Would the farmers’ well-being also have been higher as a result of working these additional hours? Does your answer affect how we should interpret changes in U.S. GDP from before the Civil War to after the Civil War? Briefly explain.Source: Roger L. Ransom and Richard Sutch, One Kind of Freedom: The Economic Consequences of Emancipation, Second Edition, New York: Cambridge University Press, 2001.
2.8 [related to the Making the Connection on page 247] An article in the New York Times describes the much greater use of cash, as opposed to checks and credit cards, in buying and selling in China. The article describes some-one bringing several bags of cash containing the equiva-lent of $130,000 into a car dealership to buy a new BMW. Another article notes: “Many economists believe that the rise in [use of] cash is strongly related to growth in the so-called underground economy.”
a. What is the underground economy? b. Why might buyers and sellers in the underground
economy prefer to use cash?Sources: David Barboza, “Chinese Way of Doing Business: In Cash We Trust,” New York Times, April 30, 2013; and Bruce Bartlett, “Amer-ica’s Most Profitable Export Is Cash,” New York Times, April 9, 2013.
2.9 Each year, the United Nations publishes the Human De-velopment Report, which provides information on the standard of living in nearly every country in the world. The report includes data on real GDP per person and also contains a broader measure of the standard of living called the Human Development Index (HDI). The HDI combines data on gross national income (GNI) per person with data
on life expectancy at birth, average years of schooling, and expected years of schooling. (GNI is a measure of the total income per person in a country.) The following table shows values for GNI per person and the HDIs for several coun-tries. Prepare one list that ranks countries from highest GNI per person to lowest and another list that ranks coun-tries from highest HDI to lowest. Briefly discuss possible reasons for any differences in the rankings of countries in your two lists. (All values in the table are for the year 2012.)
Country Real GNI per Person HDI
Australia $34,340 0.938China 7,945 0.699Greece 20,511 0.860Iran 10,695 0.742Norway 48,688 0.955Singapore 52,613 0.895
Korea 28,231 0.909United Arab Emirates 42,716 0.818United States 43,480 0.937
Source: United Nations Development Programme, “The Human Development Index,” http://hdr.undp.org/en/statistics/hdi/.
2.10 [related to the Making the Connection on page 248] Think about the increases in spending since 2001 for the Department of Homeland Security and the wars in Af-ghanistan and Iraq. Briefly explain whether you think that these increases in government expenditures have made the typical person better off.
real GDp versus Nominal GDp, pages 249–252 8.3 LEARNING OBJECTIVE: Discuss the difference between real GDP and nominal GDP.
SummaryNominal GDP is the value of final goods and services evaluated at current-year prices. Real GDP is the value of final goods and ser-vices evaluated at base-year prices. By keeping prices constant, we know that changes in real GDP represent changes in the quantity of goods and services produced in the economy. When the price level, the average prices of goods and services in the economy, is increas-ing, real GDP is greater than nominal GDP in years before the base year and less than nominal GDP for years after the base year. The GDP deflator is a measure of the price level and is calculated by dividing nominal GDP by real GDP and multiplying by 100.
MyEconLab Visit www.myeconlab.com to complete these exercises online and get instant feedback.
Review Questions 3.1 Why does inflation make nominal GDP a poor measure of
the increase in total production from one year to the next? How does the U.S. Bureau of Economic Analysis deal with the problem inflation causes with using nominal GDP?
3.2 What is the GDP deflator, and how is it calculated?
3.3 Assuming that inflation has occurred over time, what is the relationship between nominal GDP and real GDP in each of the following situations?
a. In the years after the base year b. In the base year c. In the years before the base year
Problems and Applications 3.4 [related to Solved Problem 8.3 on page 250] Suppose
the information in the following table is for a simple econ-omy that produces only four goods and services: shoes, hamburgers, shirts, and cotton. Assume that all the cotton is used in the production of shirts.
2009 2014 2015
Product Quantity Price Quantity Price Quantity Price
Shoes 90 $50.00 100 $60.00 100 $65.00Hamburgers 75 2.00 100 2.00 120 2.25Shirts 50 30.00 50 25.00 65 25.00Cotton 100 0.80 800 0.60 120 0.70
M08_HUBB5496_05_SE_C08.indd 258 19/11/13 4:12 AM

a. Use the information in the table to calculate real GDP for 2014 and 2015, assuming that the base year is 2009.
b. What is the growth rate of real GDP during 2015? 3.5 Briefly explain whether you agree with the following
statements. a. “If nominal GDP is less than real GDP, then the price
level must have fallen during the year.” b. “Whenever real GDP declines, nominal GDP must also
decline.” c. “If a recession is so severe that the price level declines,
then we know that both real GDP and nominal GDP must decline.”
d. “Nomina l GDP decl ined b etween 2008 and 2009; therefore, the GDP deflator must also have declined.”
3.6 The movie Avatar overtook Titanic as the highest-grossing movie of all time. An article on Forbes.com notes that “the average ticket price in 2008 (Avatar was released in 2009) was $7.18, up 56% from prices in 1997 when Titanic was in theaters.” The article states: “A look at domestic grosses (box-office receipts) ad-justed for inflation shows a more realistic view of Avatar’s performance.” Why would adjusting for infla-tion show a more realistic view of Avatar’s performance at the box office?Source: Dorothy Pomerantz, “Is Avatar Really King of the Box Of-fice?” Forbes.com, January 27, 2010.
3.7 The following graph shows movements in nominal GDP and real GDP in an economy that has experienced defla-tion, or a falling price level, during the time period cov-ered in the graph. In the years before the base year, would the curve from A to B or the curve from C to B represent nominal GDP compared to real GDP? Briefly explain. In the years after the base year, would the curve from B to D or the curve from B to E represent nominal GDP com-pared to real GDP? Briefly explain.
3.8 According to an article in the Economist, the Russian economy “may not have been booming by 7% a year, as in the mid-2000s, but GDP grew by 3.6% in 2012.” Are these two percentages referring to changes in nominal GDP or in real GDP? Briefly explain.Source: “The Russian Economy, Sputtering,” Economist, June 22, 2013.
3.9 Use the data in the following table to calculate the GDP deflator for each year (values are in billions of dollars):
Year Nominal GDP Real GDP
2008 $ 14,720 $14,8342009 14,418 14,4182010 14,958 14,7792011 15,534 15,0522012 16,245 15,471
Which year from 2009 to 2012 saw the largest percentage increase in the price level, as measured by changes in the GDP deflator? Briefly explain.
GDP (billionsof dollars) Base year
E
B
D
A
C
Years
Other Measures of total Production and total Income, pages 253–255 8.4 LearNING OBJeCtIVe: Understand other measures of total production and total income.
SummaryThe most important measure of total production and total income is gross domestic product (GDP). As we will see in later chapters, for some purposes, the other measures of total production and total income shown in Figure 8.4 are actually more useful than GDP. These measures are gross national product (GNP), national income, personal income, and disposable personal income.
MyEconLab visit www.myeconlab.com to complete these exercises online and get instant feedback.
review Questions 4.1 What is the difference between GDP and GNP? Briefly ex-
plain whether the difference is important for the United States.
4.2 What are the differences between national income, per-sonal income, and disposable personal income?
4.3 What is gross domestic income? Which component of gross domestic income is the largest?
problems and applications 4.4 Suppose a country has many of its citizens temporarily
working in other countries, and many of its firms have facilities in other countries. Furthermore, relatively few citizens of foreign countries are working in this country, and relatively few foreign firms have facilities in this coun-try. In these circumstances, which would you expect to be larger for this country, GDP or GNP? Briefly explain.
4.5 Suppose the amount the federal government collects in personal income taxes increases, while the level of GDP re-mains the same. What will happen to the values of national income, personal income, and disposable personal income?
chapter Summary and Problems 25
M08_HUBB5496_05_SE_C08.indd 259 18/11/13 10:24 AM

26 C h a P t E R 8 GDP: Measuring Total Production and Income
4.6 If you were attempting to forecast the level of consumption spending by households, which measure of total produc-tion or total income might be most helpful to you in mak-ing your forecast? Briefly explain.
4.7 Briefly discuss the accuracy of the following statement: “Corporate profits are much too high: Most corporations make profits equal to 50 percent of the price of the prod-ucts they sell.”
real-time-Data exercises D8.1 [analyzing the components of personal consumption
expenditures] Go to the Web site of the Federal Reserve Bank of St. Louis (FRED) (research.stlouisfed.org/fred2/).
a. Find the values for the most recent quarter for these four variables: (1)Personal Consumption Expenditures (PCEC); (2) Personal Consumption Expenditures: Durable Goods (PCDG): (3) Personal Consump-tion Expenditures: Nondurable Goods (PCND); and (4) Personal Consumption Expenditures: Services (PCESV).
b. What percentage of total household expenditures is de-voted to the consumption of goods (both durable and nondurable goods)?
D8.2 [analyzing the components of investment] Go to the Web site of the Federal Reserve Bank of St. Louis (FRED) (research.stlouisfed.org/fred2/).
a. Find the values for the most recent quarter for these three variables: (1) Gross Private Domestic Investment (GPDI); (2) Private Nonresidential Fixed Investment (PNFI); and (3) Private Residential Fixed Investment (PRFI).
b. Use these values to calculate the difference between private domestic investment and residential and non-residential fixed private investment. What component of GDP does the value calculated represent?
D8.3 [Calculating net exports] Go to the Web site of the Fed-eral Reserve Bank of St. Louis (FRED) (research.stlouisfed.org/fred2/).
a. Find the values for the most recent two years for Real Exports of Goods and Services (EXPGSCA) and Real Imports of Goods and Services (IMPGSCA).
b. Compute the value of net exports for each of the two most recent years.
D8.4 [Comparing GDP and GNP] Go to the Web site of the Federal Reserve Bank of St. Louis (FRED) (research.stlouisfed.org/fred2/).
a. Find the values for the most quarter for Gross Domes-tic Product (GDP) and Gross National Product (GNP).
b. Given these values, explain whether foreign production by U.S. firms exceeded U.S. production by foreign firms.
D8.5 [analyzing the components of personal income] Go to the Web site of the Federal Reserve Bank of St. Louis (FRED) (research.stlouisfed.org/fred2/).
a. Find the values for the most recent quarter for these three variables: (1) Personal Income (PINCOME); (2) Disposable Personal Income (DPI); and (3) Personal Consumption Expenditures (PCEC).
b. Use these values to calculate the difference between personal income and disposable personal income. What does this value represent?
D8.6 [Calculating the GDP deflator and the inflation rate] Go to the Web site of the Federal Reserve Bank of St. Louis (FRED) (research.stlouisfed.org/fred2/).
a. Find the values for the most recent quarter and the values for the quarter one year ago for nominal Gross Domestic Product (GDP) and Real Gross Domestic Product (GDPC1).
b. Use these values to calculate the GDP price deflator for the most recent quarter and the GDP price deflator for the quarter one year ago.
c. Using the two GDP price deflators, calculate the infla-tion rate during this year.
d. Look again at Figure 8.3 on page 251. Briefly explain why the nominal and real GDP lines intersect at the base year. What is the value of the GDP deflator in the year when the nominal and real GDP lines intersect?
D8.7 [Calculating real GDP and the real growth rate] Go to the Web site of the Federal Reserve Bank of St. Louis (FRED) (research.stlouisfed.org/fred2/).
a. Find the values for the most recent quarter and the quarter one year ago for nominal Gross Domestic Product (GDP) and the GDP Implicit Price Deflator (GDPDEF)
b. Use these values to calculate real GDP for the most re-cent quarter and for the quarter one year ago.
c. Use the two real GDP values to calculate the real growth rate of the economy during this year.
M08_HUBB5496_05_SE_C08.indd 260 18/11/13 10:24 AM


