Positioning Your Pork Operation for the 21st Century Chapter Six: 150 Sow Farrow-to-Finish. 75 Chapter Six: 150 SOW FARROW-TO-FINISH Kenneth Foster, Chris Hurt, and Jeffrey Hale Introduction This chapter presents two 150 sow capitalization and cost of production models and the associated economic and production assumptions. The first model, called the 150 sow high technology, is similar to the other models in previous chapters in that it is designed to show an operation utilizing as much of the current technology as is feasible to adopt. As discussed in the opening chapter, many of the smaller swine operations around the Midwest were either constructed or renovated in the late 1970s or early 1980s. Therefore, a second model is presented, in this chapter entitled the 150 sow low technology. This model is designed to give an idea what the cost of production may be for an operation that has not yet adopted the current technology available. The 150 sow low technology model will be used in later chapters to show how the adoption of various technologies can affect capitalization and the cost of production. This chapter is divided into three sections. This first section is an introduction to the models. The second section provides details on capitalization, cost of production estimates, and specifications of the 150 sow high technology system. The last section includes capitalization, cost of production estimations, and technical specifications of the 150 sow low technology system. Table 6-1: Summary of Budgeting Results Total Cost of Production Capitalization Annual Per Litter Per Head Per Cwt. 150 Sow High Tech. $505,799 $300,769 $892.49 $99.33 $40.54 150 Sow Low Tech. $480,919 $256,146 $988.98 $117.31 $47.88 Table 6-1 summarizes the capitalization required to construct for both models presented in this chapter. Additionally, the projected costs of production on an annual, per litter, per head, and per hundred weight basis are presented.
Transcript
Positioning Your Pork Operation for the 21st Century
Chapter Six: 150 Sow Farrow-to-Finish.
75
Chapter Six:150 SOW FARROW-TO-FINISH
Kenneth Foster, Chris Hurt, and Jeffrey Hale
Introduction
This chapter presents two 150 sow capitalization and cost of production models and theassociated economic and production assumptions. The first model, called the 150 sow hightechnology, is similar to the other models in previous chapters in that it is designed to show anoperation utilizing as much of the current technology as is feasible to adopt. As discussed in theopening chapter, many of the smaller swine operations around the Midwest were either constructedor renovated in the late 1970s or early 1980s. Therefore, a second model is presented, in thischapter entitled the 150 sow low technology. This model is designed to give an idea what the costof production may be for an operation that has not yet adopted the current technology available.The 150 sow low technology model will be used in later chapters to show how the adoption ofvarious technologies can affect capitalization and the cost of production.
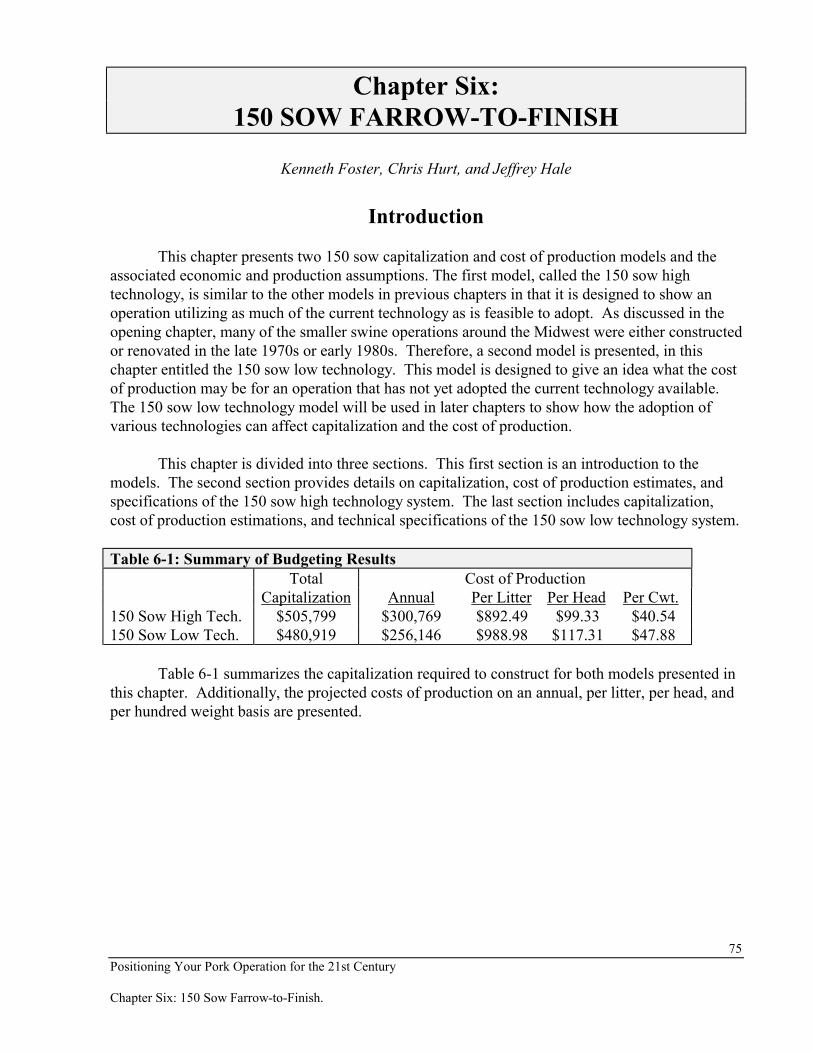
This chapter is divided into three sections. This first section is an introduction to themodels. The second section provides details on capitalization, cost of production estimates, andspecifications of the 150 sow high technology system. The last section includes capitalization,cost of production estimations, and technical specifications of the 150 sow low technology system.
Table 6-1: Summary of Budgeting ResultsTotal Cost of Production
Capitalization Annual Per Litter Per Head Per Cwt.150 Sow High Tech. $505,799 $300,769 $892.49 $99.33 $40.54150 Sow Low Tech. $480,919 $256,146 $988.98 $117.31 $47.88
Table 6-1 summarizes the capitalization required to construct for both models presented inthis chapter. Additionally, the projected costs of production on an annual, per litter, per head, andper hundred weight basis are presented.
Positioning Your Pork Operation for the 21st Century
Chapter Six: 150 Sow Farrow-to-Finish.
76
150 Sow High Technology System
Introduction
This system is composed of total 180 sows, farrowing 36 litters eight times per year. Atotal of 337 litters are assumed to be produced each year, with 9.0 pigs weaned per litter, or 3,032hogs weaned annually. A 6% death loss results in 8.46 pigs marketed per litter, or 2,851 markethogs sold annually. A complete discussion of the production assumptions is located in the sectionentitled Specifications.
The operation is designed as a high investment farrow-to-finish swine unit. Production isconfined with the exception of the gestation phase. General technologies employed include: All-in/All-Out production; less than 21 day weaning with two week age variation; split-sex and phasefeeding; physical separation of pigs by room for greater bio-security; and medium lean genetics.
Capitalization
Capitalization is subdivided into five categories: land, buildings, equipment, productioninventory, and market inventory. The numbers presented represent a snapshot of the operation atfull capacity, on any given day. The fullcapitalization of the operation ispresented in Table 6-2.
Land
This operation is assumed to occupy a site consisting of 5 acres. The assumed value ofland is $1400 per acre, for a total of $7,000. However, this cost was not used in the cost ofproduction calculation. Instead, the lost profit opportunity from not having the land in cornproduction was used to approximate the annual land ownership charge. It is assumed that landwith 113 bushel corn yields would be used forthe hog facility site. The cost of productioninformation for 113 bushel corn is derived from“1994 Purdue Crop Guide (ID-166).”42 Theprice of corn used in the analysis is the mean ofthe season average prices for the period 1984through 1993.43 As shown in Table 6-3, theestimated annual opportunity cost from nothaving the land in corn production was $101.70per acre, or $508.50 for the entire 5 acres.
Table 6-3: Land Opportunity CostAnalysisProduction Cost (per bushel) $1.36Selling Price (per bushel) $2.26 Net Profit[loss] (per bushel) $.90Production per Acre (bushels) 113 Net Profit[loss] per Acre $101.70Total Opportunity Cost (5 acres) $508.50
Positioning Your Pork Operation for the 21st Century
Chapter Six: 150 Sow Farrow-to-Finish.
77
Buildings and Equipment
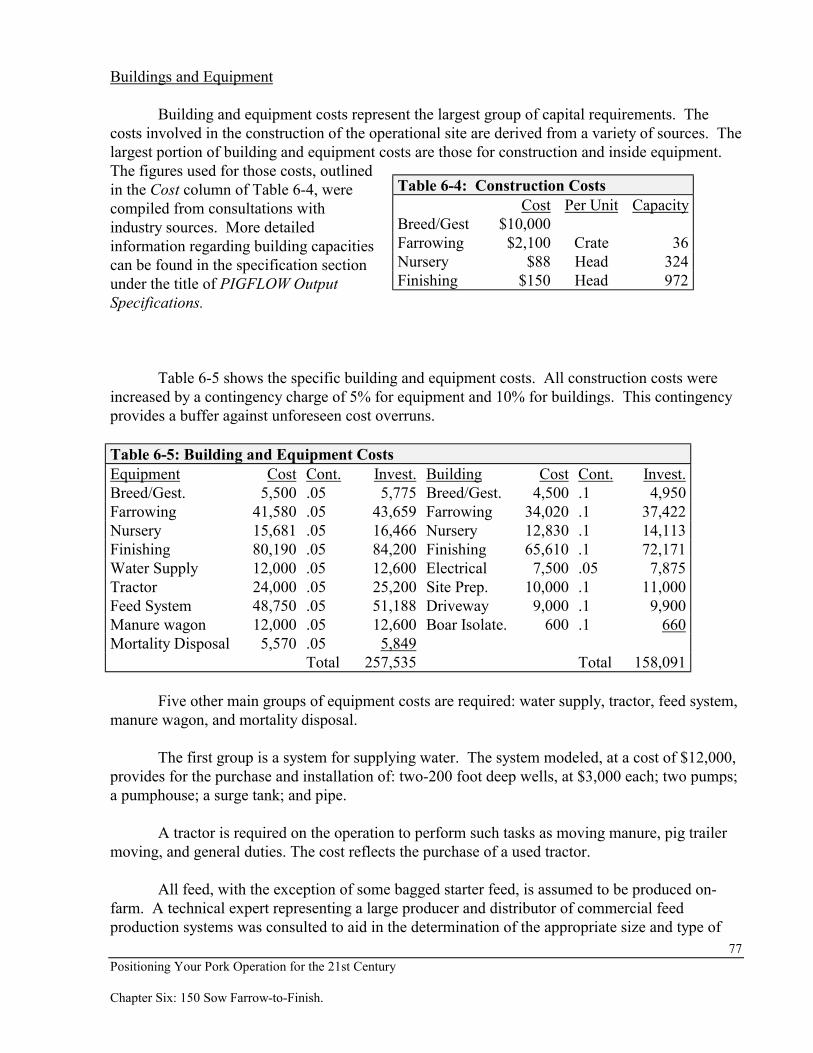
Building and equipment costs represent the largest group of capital requirements. Thecosts involved in the construction of the operational site are derived from a variety of sources. Thelargest portion of building and equipment costs are those for construction and inside equipment.The figures used for those costs, outlinedin the Cost column of Table 6-4, werecompiled from consultations withindustry sources. More detailedinformation regarding building capacitiescan be found in the specification sectionunder the title of PIGFLOW OutputSpecifications.
Table 6-5 shows the specific building and equipment costs. All construction costs wereincreased by a contingency charge of 5% for equipment and 10% for buildings. This contingencyprovides a buffer against unforeseen cost overruns.
Five other main groups of equipment costs are required: water supply, tractor, feed system,manure wagon, and mortality disposal.
The first group is a system for supplying water. The system modeled, at a cost of $12,000,provides for the purchase and installation of: two-200 foot deep wells, at $3,000 each; two pumps;a pumphouse; a surge tank; and pipe.
A tractor is required on the operation to perform such tasks as moving manure, pig trailermoving, and general duties. The cost reflects the purchase of a used tractor.
All feed, with the exception of some bagged starter feed, is assumed to be produced on-farm. A technical expert representing a large producer and distributor of commercial feedproduction systems was consulted to aid in the determination of the appropriate size and type of
Table 6-4: Construction CostsCost Per Unit Capacity
Breed/Gest $10,000Farrowing $2,100 Crate 36Nursery $88 Head 324Finishing $150 Head 972
Positioning Your Pork Operation for the 21st Century
Chapter Six: 150 Sow Farrow-to-Finish.
78
mill required. A modular feed grinding/mixing system was selected. The system requires that feeddelivery be completed with a feed truck. The system is designed with an auxiliary system of feedproduction. This redundancy is included as a safety margin. Included in the charge for the feedsystem is the cost for the grinding and mixing system, the feed truck, an auxiliary system, and thenecessary feed storage tanks and bins.
Mortality disposal is based on acomposting system. Three items, in additionto a suitable site, are required: a concreteslab; hay bales; and a perimeter fence. Thecost of these was found from local suppliersand is shown in Table 6-6.
In addition to the basic construction costs involved with putting up the buildings, fouradditional groups of items are required: electrical hook-up; site preparation; a driveway; and a newboar isolation facility. These items are shown in Table 6-5, on the lower right side.
The electrical hook-up charge consists of the link from the power company’s service linesto the main breaker at the production site. This work is generally done by a professionalcontractor. A local contractor estimated a fee of $7,500.
The 5-acre site on which the operation is established must be prepared with respect toslope, drainage, etc., prior to the start of construction. Additionally, after the buildings are up,final grading and fencing work is required. A local contractor was consulted for a per-acre fee forthis type of work. The fee provided by the contractor includes the costs of all earth moving andpreparation. The fee for ground preparation and installing a perimeter is $2,000 per acre, or$10,000 before the contingency charge.
The site requires a 600-foot long by 10-foot wide access driveway. A cost of $1.50 persquare foot for preparing and laying gravel on the drive was used to calculate the $9,000 totalcharge for the drive.
New boars entering the operation must first pass through an isolation facility in order tomaintain bio-security. This operation requires a pen with the capacity to hold two boars with 15square feet of space for each. The construction cost used in this analysis is $20 per square foot, or$600 for the total cost of the pen.
Waste is disposed of through the use of deep-pits constructed under the buildings. Thedeep-pits are pumped out periodically, as they fill. The manure collected from the deep-pits isinjected into cropland in order to capture its nutrient value.
Positioning Your Pork Operation for the 21st Century
Chapter Six: 150 Sow Farrow-to-Finish.
79
Production Inventory
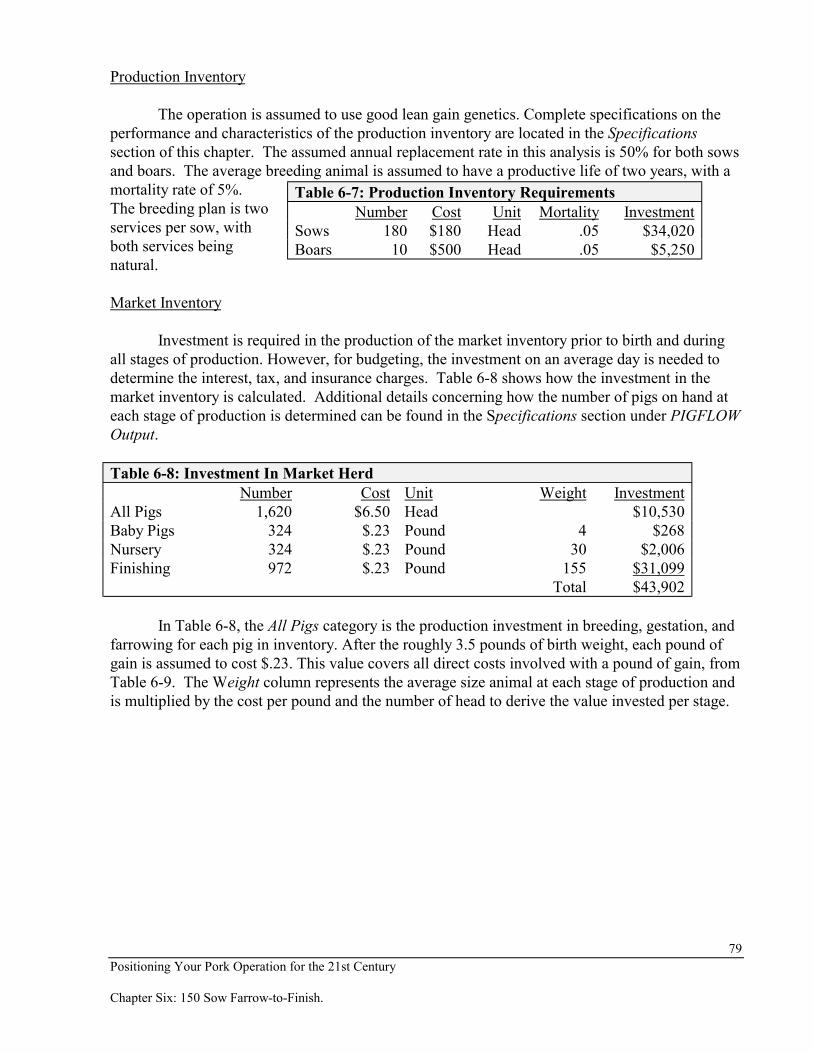
The operation is assumed to use good lean gain genetics. Complete specifications on theperformance and characteristics of the production inventory are located in the Specificationssection of this chapter. The assumed annual replacement rate in this analysis is 50% for both sowsand boars. The average breeding animal is assumed to have a productive life of two years, with amortality rate of 5%.The breeding plan is twoservices per sow, withboth services beingnatural.
Market Inventory
Investment is required in the production of the market inventory prior to birth and duringall stages of production. However, for budgeting, the investment on an average day is needed todetermine the interest, tax, and insurance charges. Table 6-8 shows how the investment in themarket inventory is calculated. Additional details concerning how the number of pigs on hand ateach stage of production is determined can be found in the Specifications section under PIGFLOWOutput.
Table 6-8: Investment In Market HerdNumber Cost Unit Weight Investment
In Table 6-8, the All Pigs category is the production investment in breeding, gestation, andfarrowing for each pig in inventory. After the roughly 3.5 pounds of birth weight, each pound ofgain is assumed to cost $.23. This value covers all direct costs involved with a pound of gain, fromTable 6-9. The Weight column represents the average size animal at each stage of production andis multiplied by the cost per pound and the number of head to derive the value invested per stage.
Table 6-7: Production Inventory RequirementsNumber Cost Unit Mortality Investment
Sows 180 $180 Head .05 $34,020Boars 10 $500 Head .05 $5,250
Positioning Your Pork Operation for the 21st Century
Chapter Six: 150 Sow Farrow-to-Finish.
80
Cost of Production
The compiled cost of production analysis is shown in Table 6-9. The results are presentedwith respect to litter, hundred weight produced, and head of market hogs sold.
Positioning Your Pork Operation for the 21st Century
Chapter Six: 150 Sow Farrow-to-Finish.
81
Feed Costs
The cost of feed is based on a series of phased diets and the historical average prices ofcorn and soybean meal. The direct charge for feed is subdivided into three sections: corn, beanmeal, and other feed.
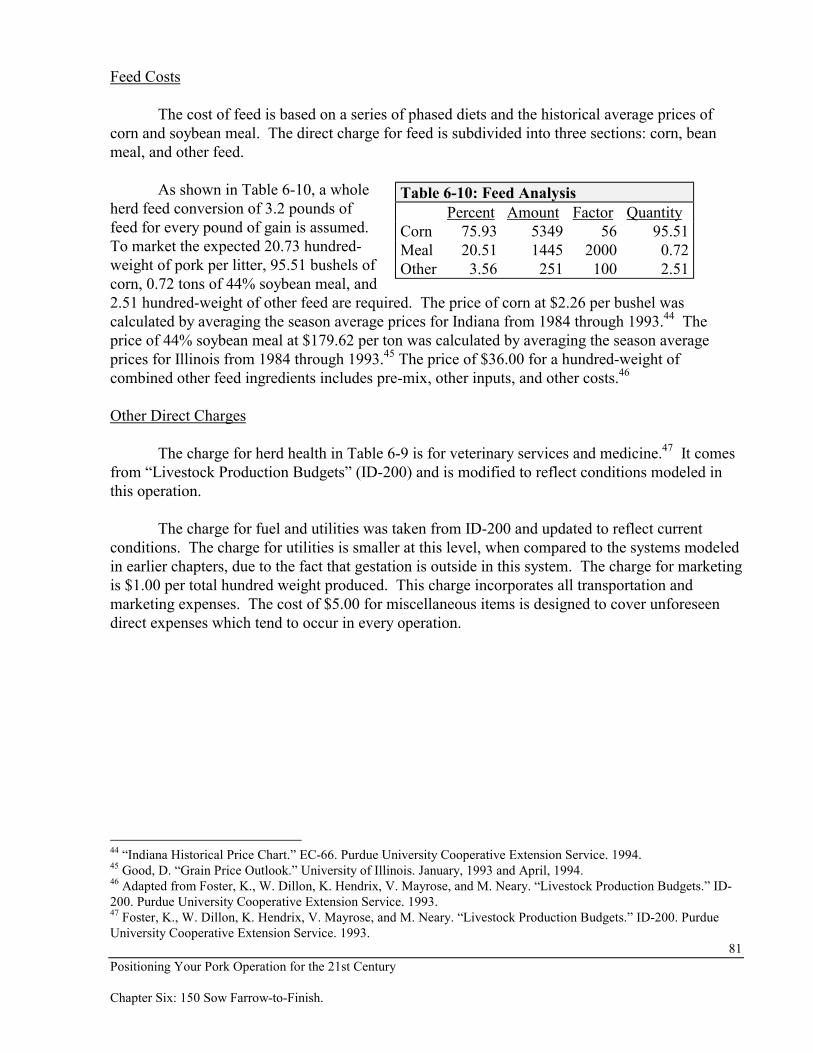
As shown in Table 6-10, a wholeherd feed conversion of 3.2 pounds offeed for every pound of gain is assumed.To market the expected 20.73 hundred-weight of pork per litter, 95.51 bushels ofcorn, 0.72 tons of 44% soybean meal, and2.51 hundred-weight of other feed are required. The price of corn at $2.26 per bushel wascalculated by averaging the season average prices for Indiana from 1984 through 1993.44 Theprice of 44% soybean meal at $179.62 per ton was calculated by averaging the season averageprices for Illinois from 1984 through 1993.45 The price of $36.00 for a hundred-weight ofcombined other feed ingredients includes pre-mix, other inputs, and other costs.46
Other Direct Charges
The charge for herd health in Table 6-9 is for veterinary services and medicine.47 It comesfrom “Livestock Production Budgets” (ID-200) and is modified to reflect conditions modeled inthis operation.
The charge for fuel and utilities was taken from ID-200 and updated to reflect currentconditions. The charge for utilities is smaller at this level, when compared to the systems modeledin earlier chapters, due to the fact that gestation is outside in this system. The charge for marketingis $1.00 per total hundred weight produced. This charge incorporates all transportation andmarketing expenses. The cost of $5.00 for miscellaneous items is designed to cover unforeseendirect expenses which tend to occur in every operation.
44 “Indiana Historical Price Chart.” EC-66. Purdue University Cooperative Extension Service. 1994.45 Good, D. “Grain Price Outlook.” University of Illinois. January, 1993 and April, 1994.46 Adapted from Foster, K., W. Dillon, K. Hendrix, V. Mayrose, and M. Neary. “Livestock Production Budgets.” ID-200. Purdue University Cooperative Extension Service. 1993.47 Foster, K., W. Dillon, K. Hendrix, V. Mayrose, and M. Neary. “Livestock Production Budgets.” ID-200. PurdueUniversity Cooperative Extension Service. 1993.
Positioning Your Pork Operation for the 21st Century
Chapter Six: 150 Sow Farrow-to-Finish.
82
A direct charge for mortality disposal is included in the budget. This cost reflects theregular replacement of some items in thecomposting system and the repair of others.The general composting system was modifiedto coincide with the particular productionsystem used in this analysis.48 The directcosts involved with the composting system areshown in Table 6-11.
Indirect Charges
The investments in market inventory, production inventory, equipment, buildings, and landare shown in the section of this chapter entitled Capitalization. The capitalized value calculatedearlier shows up in the cost of production budget, Table 6-9, under the column Investment. Thenumbers found in Table 6-9 were calculated by taking the capitalized value and dividing by thenumber of litters produced. For example, the market inventory is capitalized at a value of $43,902(Table 6-8), and 337 litters are produced each year. Therefore, the investment shown in Table 6-9is $43,902/337 = $130.27. This same type of calculation is done on each of the capitalcomponents.
Each of the investments per litter in capital items is multiplied by a fixed percent charge todetermine the per litter charge for capital items. The charge on the market inventory of 8.63%assumes a 9.5% nominal interest rate for .75 years and 1.5% for taxes and insurance. A nominalinterest rate was used in the charge for the market inventory due to the short life of these animals.It is assumed that the effects of inflation will be so small during the time that these animals arepart of the operation that adjustment is not required.
The charge on the production inventory assumes a 6% real interest rate and 1.5% for taxesand insurance. The charge on equipment assumes a 6% real interest rate; 3.5% for taxes,insurance, and repairs; and an eight-year useful life. The charge on buildings assumes a 6% realinterest rate; 3.5% for taxes, insurance, and repairs; and a 16-year useful life. All charges weredetermined with the use of an amortization schedule based on the parameters outlined above.
The opportunity cost calculation on the land required for the operation was discussed in theCapitalization section, Table 6-3, and is $508.50.
Labor for the operation requires one manager and one part-time employee. The manager ispaid a salary of $20,250 per year. In addition, a benefits package is provided, calculated as 15% ofgross salary. The employee is paid an hourly wage of $6.00 an hour. Employee benefits areconsidered to be 25% of gross pay.
48 Foster, K., Department of Agricultural Economics, Purdue University. October 1994.
Table 6-11: Direct Composting ChargesReplacement Tarps $50Annual Fence Repair $20Replacement Hay Bales $30Fuel and Utilities $100Sawdust $100
Annual Total $300Direct Cost per Litter $.89
Positioning Your Pork Operation for the 21st Century
In addition to the labor, a fee was charged to compensate the management team. Thepurpose of this fee is to provide a return to the management personnel who make the decisions thatguide the operation through the long-range horizon. It is likely that these decisions are made bythe owner(s) of the operation. However, ifthis service was contracted out, a feewould have to be paid. The managementcharge, presented in Table 6-13, iscalculated as 3.5% of gross market hogsales, or $10,267 per year, assuming theprice of market hogs is $42 per hundredweight.
Specifications
Health Program50
Facilities
1. Perimeter fence2. Entry facility3. Dead animal disposal4. Screened and rat-proofed buildings5. Isolation facility
Management
1. Weaned in less than 21 days2. All-In/All-Out production Nursery - (1 for 480-500 pigs) Finishers - (1 for 960-1000 pigs in 2 rooms; four feed tanks)3. Separation of buildings for bio-security4. Segregated early weaning procedures
49 Salary and benefit rates from industry sources.50 Kirk Clark, DVM, School of Veterinary Medicine, Purdue University. 1994.
Table 6-13: Management FeeNumber of Head Sold 2,851Cwt. per Head 2.45Price per Cwt. $42Total Management Fee @ 3.5% $10,267
Positioning Your Pork Operation for the 21st Century
Chapter Six: 150 Sow Farrow-to-Finish.
84
Medications
1. Medication for H. parasuis2. Penicillin + Azium for S. suis3. Antibiotic fed to #75 (Apralan & Mecadox)4. BMD - 3 weeks - Tet 1 week rotation in finisher
Vaccination program
1) Gilts:a) Porcine Parvovirus, Erysipelas, 5-way Leptospirosisb) Vaccination to occur at 5 and 2 weeks before breedingc) Vaccination for E coli and others to occur as needed prefarrowing
2) Sows:a) Porcine Parvovirus, Erysipelas, 5-way Leptospirosisb) Vaccination to occur after each weaningc) Vaccination for E coli and others to occur as needed prefarrowing
3) Other vaccinations (herd dependent)
Genetics Program51
∗ Gilts and boars purchased from an independent seedstock supplier.
∗ Medium lean growth - .60 - .66 pound fat-free lean gain potential.
Barrows 1.00 in. backfat at 245 pounds - 46.0% lean (fat-free)1.15 in. backfat at 260 pounds - 44.5% lean (fat-free)
Gilts 0.90 in. backfat at 245 pounds - 48.0% lean (fat-free)1.00 in. backfat at 260 pounds - 48.6% lean (fat-free)
Feed Conversion 2.90 from 60 to 245 pounds meal diets2.96 from 60 to 260 pounds meal diets
Gilts purchased at $180 each.
51 Allan Schinckel, Department of Animal Sciences, Purdue University. 1994.
Positioning Your Pork Operation for the 21st Century
Chapter Six: 150 Sow Farrow-to-Finish.
85
Nutrition Program52
Nursery
1. Four to five diets, sequencing rapidly in order to decrease cost.
2. Diets based on health status and genotype. Will usually feed a specified amount of each diet,or feed for a specified amount of time.
Grow-Finish
1. Minimum of three diets for each sex, decreasing in lysine content with time (weight).
2. Split-sex feeding after 70 pounds.The first two (or three) diets will be fed at a fixed amount per pig based on liveweightgrowth. Diets after 150 pounds will be based on liveweight.
Sow feed
Gestation: 15-16% crude protein corn-soy plus a laxative. Feeding level increased last2-3 weeks.
Lactation: 17% crude protein corn-soy with 5% added fat.
Boar feed
Gestation feed used.
Production Assumptions and PIGFLOW53
Several assumptions were made concerning production which directly affect costs. Thoseproduction assumptions are described in this section.
Nine pigs are assumed to be weaned from each litter farrowed. After deducting a 6% deathloss, 8.46 pigs are marketed per litter. Based on the number of sows, the length of the weaningperiod, and settling rates, 337 litters are assumed to be produced each year. Annual market hogproduction is estimated at 2,851 pigs.
A flow and space requirement planning software tool entitled PIGFLOW54 was used todetermine various aspects of herd size and building design.
52 T. R. Cline, Department of Animal Sciences, Purdue University. 1994.53 Don Jones, Department of Agricultural Engineering, Purdue University. 1994.54 Jones, D. and V. Mayrose. PIGFLOW Version 1.6. Purdue Research Foundation. 1994.
Positioning Your Pork Operation for the 21st Century
Chapter Six: 150 Sow Farrow-to-Finish.
86
Based on these assumption, PIGFLOW provided the following results:
∗ Farrowing unit consists of one room with 36 crates each.
∗ One group farrowed every 39 days.
∗ Rooms are empty 15 days for cleaning, and sows enter 3 days prior to farrowing.
∗ Weaning age: Average ⇒ 18 days Maximum ⇒ 21 day.
∗ Sow herd consists of 180 females in 4 groups of 45 sows.
∗ Conception rates: 80% average 60% seasonal
∗ Breeding on second heat after weaning.
Table 6-14: Building CapacitiesBreeding 60 sows and 8 boarsNursery 1 groups for a total of 324 hogs (maximum age = 60 days)Finishing 3 groups for a total of 972 hogs (maximum age = 175 days)
Manure Management
∗ Deep-pit construction with manure injection capacity.
The drawings for the site and individual buildings are presented on the next several pages.
Positioning Your Pork Operation for the 21st Century
Chapter Six: 150 Sow Farrow-to-Finish.
88
150 Sow High Technology SystemN
GESTATION
NURSERY BUILDING
FARROWING BUILDING
FINISHING BUILDINGThree Rooms of 324
324 Pigs
36 Crates
BREEDING
5 Acre Site
300'
Shed & LotShed & Lot
972 Pigs Total
16 Sows/Pen
230'
18
0'
60 Sows& 8 Boars
Positioning Your Pork Operation for the 21st Century
Chapter Six: 150 Sow Farrow-to-Finish.
89
150 Sow High Technology System
FARROWING BUILDING
36 Crates
96'
24
'
Positioning Your Pork Operation for the 21st Century
Chapter Six: 150 Sow Farrow-to-Finish.
90
NURSERY BUILDING
324 Pigs
42'
24
'
150 Sow High Technology System
Positioning Your Pork Operation for the 21st Century
Chapter Six: 150 Sow Farrow-to-Finish.
91
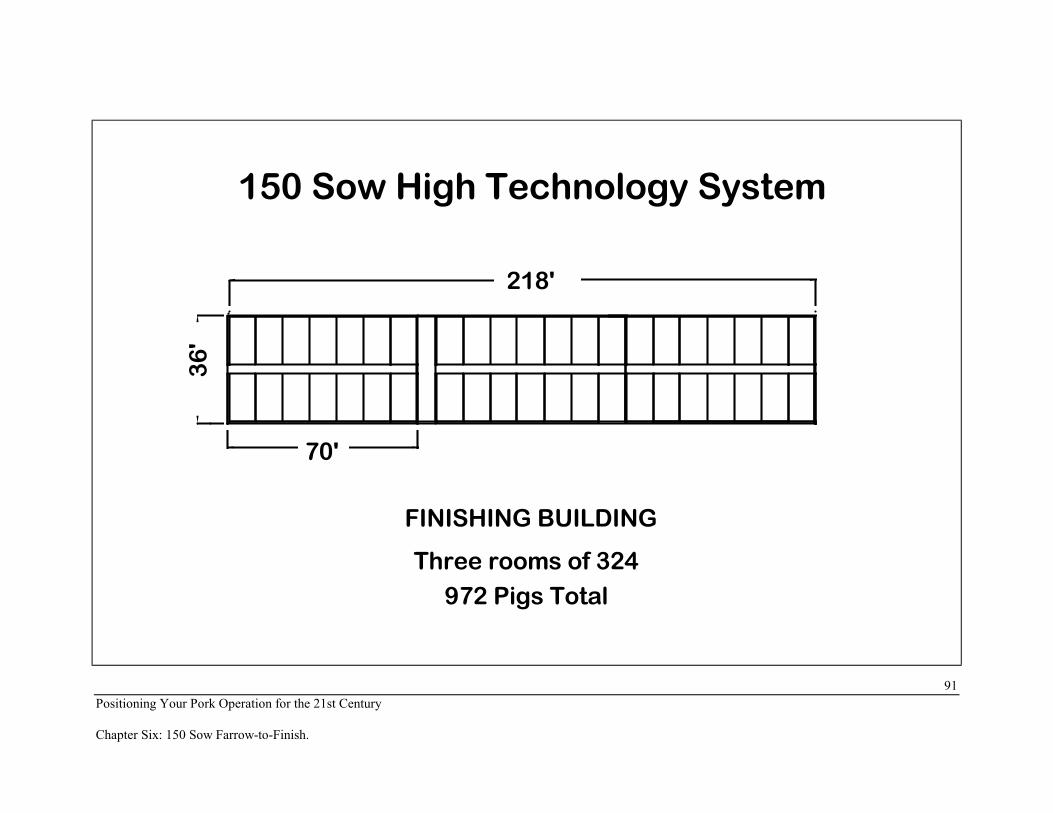
150 Sow High Technology System3
6'
972 Pigs Total
FINISHING BUILDING
Three rooms of 324
70'
218'
Positioning Your Pork Operation for the 21st Century
Chapter Six: 150 Sow Farrow-to-Finish.
92
150 Sow High Technology System
90 SOW GESTATION
12 sows
Bo
ars
BREEDING
112'
48
’
Shed & LotShed & Lot
16 Sows/Pen
96'
44
'60 Sows & 13 Boars
Positioning Your Pork Operation for the 21st Century
Chapter Six: 150 Sow Farrow-to-Finish.
93
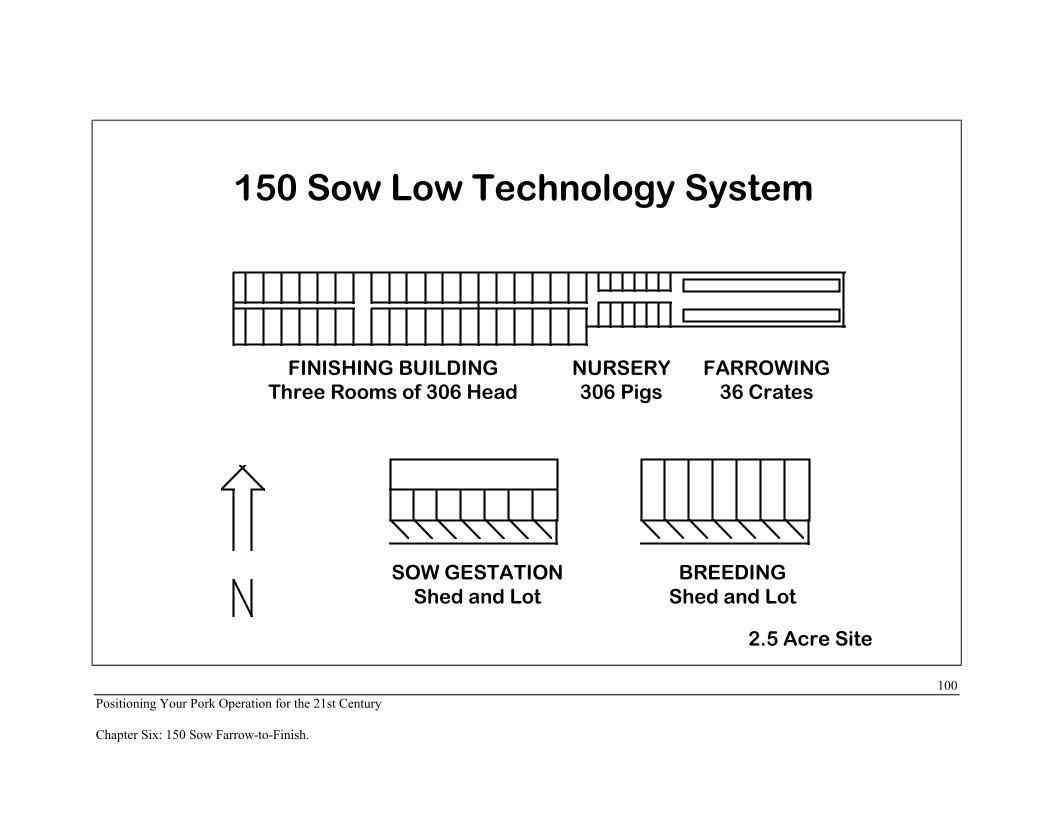
150 Sow Low Technology System
Introduction
This system is composed of total 135 sows, farrowing 36 litters seven times per year. Atotal of 259 litters are assumed to be produced each year, with 8.5 pigs weaned per litter, or 2,204hogs weaned annually. A 7% death loss results in 7.905 pigs marketed per litter, or 2,047 markethogs sold annually. A complete discussion of the production assumptions is located in the sectionentitled Specifications.
The operation is designed as a high investment farrow-to-finish swine unit. Production isconfined with the exception of the gestation phase. The building facilities assumed to be used arein-line and joined together.
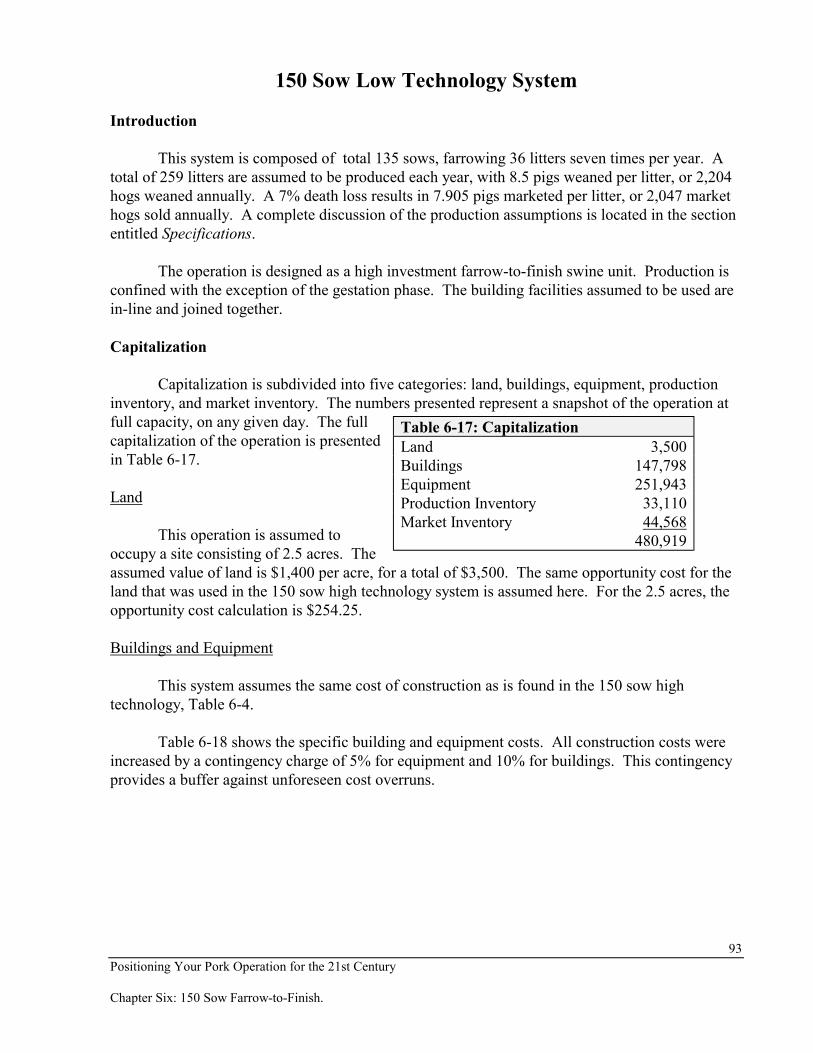
Capitalization
Capitalization is subdivided into five categories: land, buildings, equipment, productioninventory, and market inventory. The numbers presented represent a snapshot of the operation atfull capacity, on any given day. The fullcapitalization of the operation is presentedin Table 6-17.
Land
This operation is assumed tooccupy a site consisting of 2.5 acres. Theassumed value of land is $1,400 per acre, for a total of $3,500. The same opportunity cost for theland that was used in the 150 sow high technology system is assumed here. For the 2.5 acres, theopportunity cost calculation is $254.25.
Buildings and Equipment
This system assumes the same cost of construction as is found in the 150 sow hightechnology, Table 6-4.
Table 6-18 shows the specific building and equipment costs. All construction costs wereincreased by a contingency charge of 5% for equipment and 10% for buildings. This contingencyprovides a buffer against unforeseen cost overruns.
Five other main groups of equipment costs are required: water supply, tractor, feed system,manure wagon, and mortality disposal. The costs of these are assumed to be the same as in the150 sow high technology system. Additionally, electrical hookup, site preparation, driveway, andnew boar isolation are assumed to be the same as the 150 sow high technology.
Production Inventory
The operation is assumed to use good lean gain genetics. Complete specifications on theperformance and characteristics of the production inventory are located in the Specificationssection of this chapter. The assumed annual replacement rate in this analysis is 50% for both sowsand boars. The averagebreeding animal is assumedto have a productive life oftwo years, with a mortalityrate of 7.5%. The breedingplan is two services per sow, with both services being natural.
Market Inventory
Investment is required in the production of the market inventory prior to birth and duringall stages of production. However, for budgeting, the investment on an average day is needed todetermine the interest, tax, and insurance charges. Table 6-20 shows how the investment in themarket inventory is calculated. Additional details concerning how the number of pigs on hand ateach stage of production is determined can be found in the specification section under PIGFLOWOutput.
Table 6-19: Production Inventory RequirementsNumber Cost Unit Mortality Investment
Sows 135 $180 Head 1.075 $26,123Boars 13 $500 Head 1.075 $6,988
Positioning Your Pork Operation for the 21st Century
Chapter Six: 150 Sow Farrow-to-Finish.
95
Table 6-20: Investment In Market HerdNumber Cost Unit Weight Investment
The compiled cost of production analysis is shown in Table 6-21. The results are presentedwith respect to litter, hundred weight produced, and head of market hogs sold.
Positioning Your Pork Operation for the 21st Century
Chapter Six: 150 Sow Farrow-to-Finish.
96
Feed Costs
The cost of feed is based on a series of phased diets and the historical average prices ofcorn and soybean meal. The direct charge for feed is subdivided into three sections: corn, beanmeal, and other feed.
As shown in Table 6-9, a wholeherd feed conversion of 3.5 pounds of feedfor every pound of gain is assumed. Tomarket the expected 19.37 hundred-weightof pork per litter, 98.01 bushels of corn,0.74 tons of 44% soybean meal, and 2.57hundred-weight of other feed are required. The price of corn, soybean meal, and combined otherfeed ingredients is assumed to be the same as in the 150 sow high technology system.
Other Direct Charges
The charges for veterinary services and medicine; fuel and utilities; and mortality disposalis assumed to be the same as in the 150 sow high technology system.
Indirect Charges
Labor for the operation requires one manager and one part-time employee. The manager ispaid a salary of $20,250 per year. In addition, a benefits package is provided, calculated as 15% ofgross salary. The employee is paid an hourly wage of $6.00 an hour. Employee benefits areconsidered to be 25% of gross pay.
In addition to the labor, a fee was charged to compensate the management team. Thepurpose of this fee is to provide a return to the management personnel who make the decisions thatguide the operation through the long-range horizon. It is likely that these decisions are made bythe owner(s) of the operation. However,if this service was contracted out, a feewould have to be paid. The managementcharge, presented in Table 6-24, iscalculated as 3.5% of gross market hogsales, or $7,374 per year, assuming theprice of market hogs is $42 per hundredweight.
55 Salary and benefit rates from industry sources.
Table 6-24: Management FeeNumber of Head Sold 2,047Cwt. per Head 2.45Price per Cwt. $42Total Management Fee @ 3.5% $7,374
Positioning Your Pork Operation for the 21st Century
Chapter Six: 150 Sow Farrow-to-Finish.
97
Specifications
Health Program56
Facilities
1. Perimeter fence2. Dead animal disposal3. Isolation facility
Management
1. Weaned in less than 39 days
Medications
1. Medication for H. parasuis2. Penicillin + Azium for S. suis3. Antibiotic fed to #75 (Apralan & Mecadox)4. BMD - 3 weeks - Tet 1 week rotation in finisher
Vaccination program
1) Gilts:a) Porcine Parvovirus, Erysipelas, 5-way Leptospirosisb) Vaccination to occur at 5 and 2 weeks before breedingc) Vaccination for E coli and others to occur as needed prefarrowing
2) Sows:a) Porcine Parvovirus, Erysipelas, 5-way Leptospirosisb) Vaccination to occur after each weaningc) Vaccination for E coli and others to occur as needed prefarrowing
3) Other vaccinations (herd dependent)
56 Kirk Clark, DVM, School of Veterinary Medicine, Purdue University. 1994.
Positioning Your Pork Operation for the 21st Century
Chapter Six: 150 Sow Farrow-to-Finish.
98
Genetics Program57
Genetics in the 150 sow low technology system are assumed to be the same as those in the150 sow high technology system.
Production Assumptions and PIGFLOW58
Several assumptions were made concerning production which directly affect costs. Thoseproduction assumptions are described in this section.
Eight point five pigs are assumed to be weaned from each litter farrowed. After deductinga 7% death loss, 7.905 pigs are marketed per litter. Based on the number of sows, the length of theweaning period, and settling rates, 259 litters are assumed to be produced each year. Annualmarket hog production is estimated at 2,047 pigs.
A flow and space requirement planning software tool entitled PIGFLOW59 was used todetermine various aspects of herd size and building design.
Based on these assumption, PIGFLOW provided the following results:
∗ Farrowing unit consists of one room with 36 crates each.
∗ One group farrowed every 51 days.
∗ Rooms are empty 11.7 days for cleaning and sows enter 3 days prior to farrowing.
∗ Weaning age: Average ⇒ 36 days Maximum ⇒ 39 day.
∗ Sow herd consists of 135 females in 3 groups of 45 sows.
∗ Conception rates: 80% average 60% seasonal
∗ Breeding on first heat after weaning.
57 Allan Schinckel, Department of Animal Sciences, Purdue University. 1994.58 Don Jones, Department of Agricultural Engineering, Purdue University. 1994.59 Jones, D. and V. Mayrose. PIGFLOW Version 1.6. Purdue Research Foundation. 1994.
Positioning Your Pork Operation for the 21st Century
Chapter Six: 150 Sow Farrow-to-Finish.
99
Table 6-25: Building CapacitiesBreeding 60 sows and 13 boarsNursery 1 group for a total of 306 hogs (maximum age = 60 days)Finishing 3 groups for a total of 918 hogs (maximum age = 175 days)
Manure Management
∗ Deep-pit construction with manure injection capacity.