157 Chapter Six PLANNING THE FUTURE MILITARY WORKFORCE Harry J. Thie Different questions about military manpower requirements, man- power costs, and trained personnel inventory have emerged as im- portant at various times. For example, just before World War II, the most important question was how to procure a large force immedi- ately. After World War II, the emphasis shifted to managing a large inventory of people with military experience. Now, the emphasis is on recruiting in a highly competitive labor market. Although the broad questions remain fixed, particular aspects of them—recruiting, training, retaining, promoting, compensating, and retiring—receive more or less emphasis at particular times, depending on the nation’s military, social, and economic environment. Questions and answers are shaped by many forces, including external events, societal con- cerns, missions, organization, technology, budget, and demograph- ics. Specific forces at work for the past few years that affect how manpower, personnel, and training questions are asked and an- swered include a military end strength that is shrinking, threats changing from known to varied, a unitary mission of global conflict shifting to diverse missions within an overall policy of selective and flexible engagement, multiple unit missions replacing single unit missions, variable hierarchies replacing fixed organizational hierar- chies, and a joint perspective in operational matters supplanting a service focus. Planning the workforce is about ensuring that manpower needs are met with trained people at reasonable costs. In past years—as a re- sult of practices from World War II through conscription and the draft-induced volunteerism that ended with Vietnam—planning the workforce was largely about determining its size: forecasting who
Transcript
157
Chapter Six
PLANNING THE FUTURE MILITARY WORKFORCE
Harry J. Thie
Different questions about military manpower requirements, man-power costs, and trained personnel inventory have emerged as im-portant at various times. For example, just before World War II, themost important question was how to procure a large force immedi-ately. After World War II, the emphasis shifted to managing a largeinventory of people with military experience. Now, the emphasis ison recruiting in a highly competitive labor market. Although thebroad questions remain fixed, particular aspects of them—recruiting,training, retaining, promoting, compensating, and retiring—receivemore or less emphasis at particular times, depending on the nation’smilitary, social, and economic environment. Questions and answersare shaped by many forces, including external events, societal con-cerns, missions, organization, technology, budget, and demograph-ics. Specific forces at work for the past few years that affect howmanpower, personnel, and training questions are asked and an-swered include a military end strength that is shrinking, threatschanging from known to varied, a unitary mission of global conflictshifting to diverse missions within an overall policy of selective andflexible engagement, multiple unit missions replacing single unitmissions, variable hierarchies replacing fixed organizational hierar-chies, and a joint perspective in operational matters supplanting aservice focus.
Planning the workforce is about ensuring that manpower needs aremet with trained people at reasonable costs. In past years—as a re-sult of practices from World War II through conscription and thedraft-induced volunteerism that ended with Vietnam—planning theworkforce was largely about determining its size: forecasting who
158 New Challenges, New Tools for Defense Decisionmaking
would stay if they were currently part of it, and calculating how manynew entrants would be needed each year. “Manning” the force wasthe mantra; “aligning” the force by numbers and grades was the goal.Planning the future force is currently shifting away from recruitingand toward overcoming the retention shortfall. Today, workers arescarce throughout the economy—not overall, but among those whoare skilled and committed. Emphasis is shifting away from pure re-cruiting and retention strategies to strategies aimed at developingexisting workforces to carry out emerging work. The goal is to de-velop a cadre of personnel who have the skills needed to meet the re-quirements of the national military strategy. Human capital accretes;it is smarter to build on what exists than to start anew.
This chapter focuses on manpower, personnel, and training. Man-power deals with the numbers and types of people needed to ac-complish missions, personnel involves managing people either di-rectly (e.g., via assignments) or through incentives (e.g., via compen-sation), and training and development affects knowledge, skills, andbehaviors. The chapter also addresses questions about the size of theforce; its grade, skill, and experience composition; and the cost andoptimal methods to procure, enter, train, develop, assign, advance,compensate, and remove personnel.
To illustrate these issues, an example of how to analyze manpowerand personnel policies is worked through. The specific example ex-plores manpower, personnel, and training policy alternatives forachieving an available, qualified, stable, experienced, and motivatedfuture force. Some policy choices can be applied servicewide; otherscan be applied to military units or to individual soldiers, sailors, air-men, or marines. The example illustrates controllable and uncon-trollable variables involved in policy alternatives, relationshipsamong policy choices and desired outcomes, complexity and con-flicts among competing objectives, and how undesired outcomes canemerge. Frequently, the complex relationships among variables arenot sufficiently considered in the process of choosing policies. As aresult, what appears to be a reasonable decision to save budget dol-lars can have unforeseen future personnel and training conse-quences.
Planning the Future Military Workforce 159
MILITARY HUMAN CAPITAL
Human capital comprises the skills, knowledge, and abilities of indi-viduals and groups and has value inside an organization and to anorganization’s customers. The United States has always gained amilitary advantage by being able to draw on large pools of humancapital.
Inside an organization, the correct skills, knowledge, and abilitieslead to greater efficiency; outside an organization, they lead togreater effectiveness with customers. In the U.S. military, the com-batant commanders take skills, knowledge, and abilities developedby the services and apply them to seek military effectiveness aroundthe globe for diverse missions. The military needs a proper mix ofskills and knowledge to gain internal operating efficiencies and to beeffective on battlefields, however defined.
Human capital can be thought of as a “stock,” much as we think of astock of materiel. It must be built, maintained, and upgraded; leftalone, it deteriorates and becomes obsolete. The next few sectionsreview what the stock of military human capital is now, how it gotthat way, and what it is likely to undergo in the future, specifically:
• The historical size, source, and composition of the active military
• The present composition, characteristics, and attributes of theactive military
• The future effect of the present under likely conditions.
Historical Size, Source, and Composition of the Active Force
Consider, one at a time, various characteristics of the active force:size, enlisted/officer mix, skill mix, and source of manpower. Sizelargely depends on external events; type of manpower and mix of oc-cupations depend on mission, organization, and technology; andsource of manpower—conscription or volunteer—depends on thesize of the military relative to the size of the population.
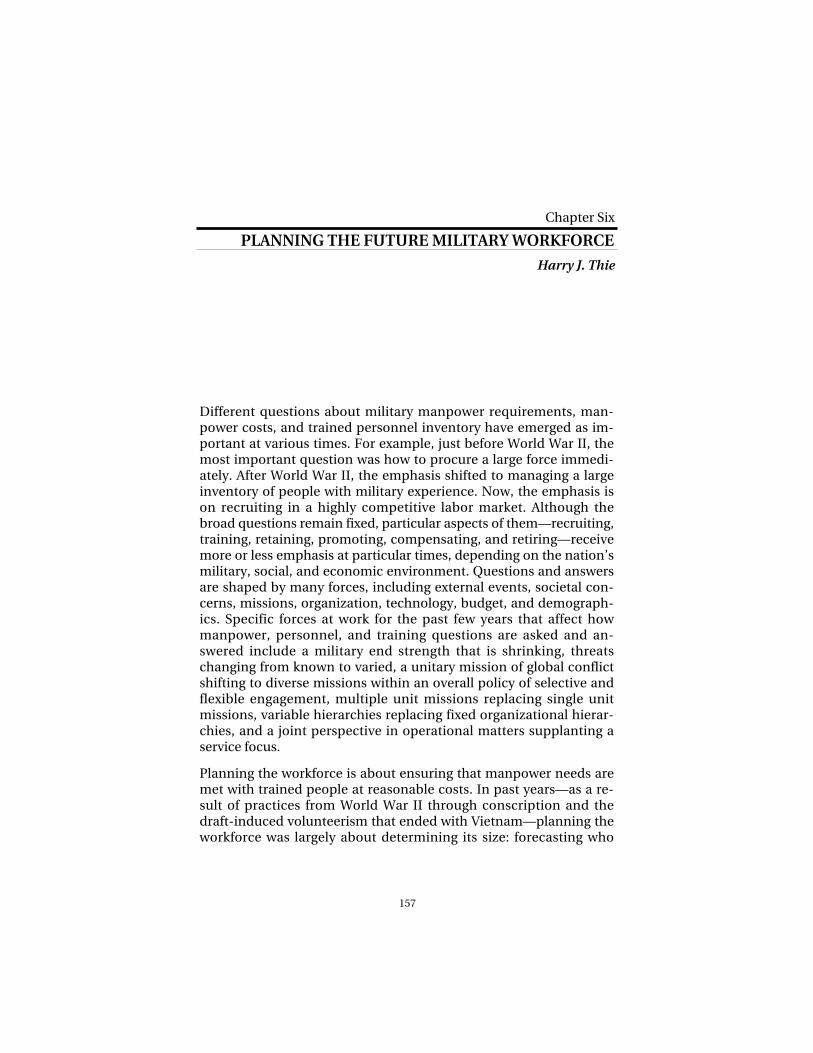
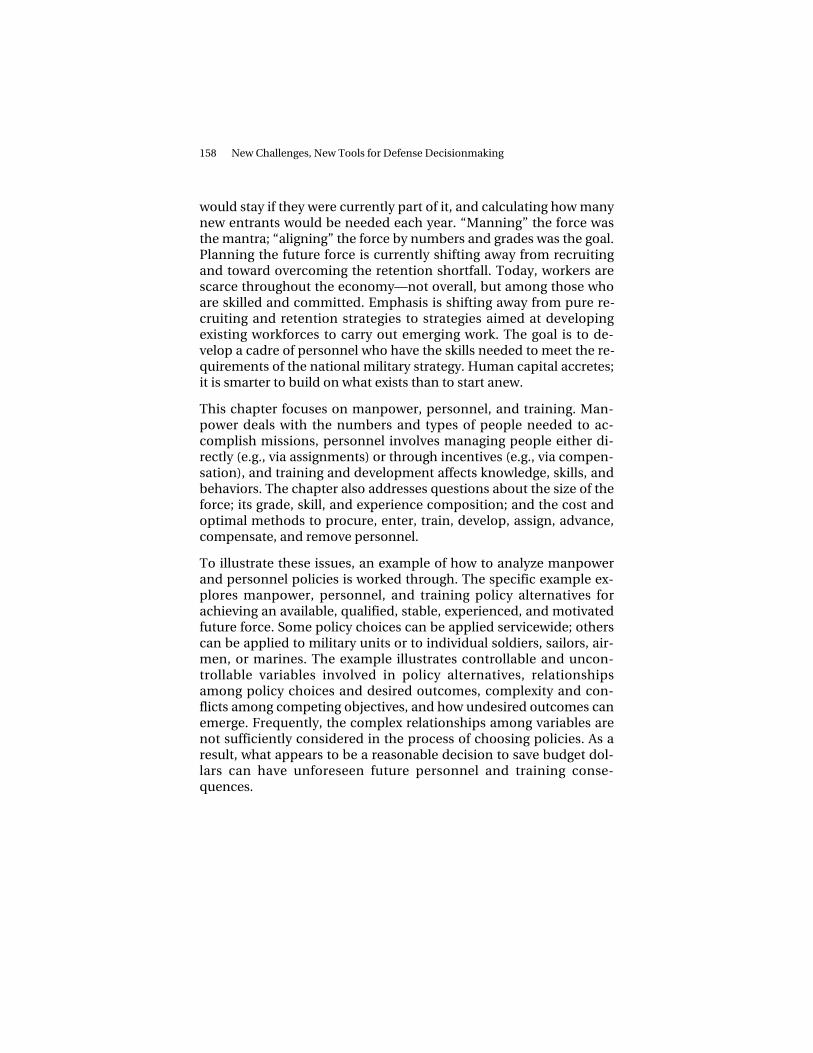
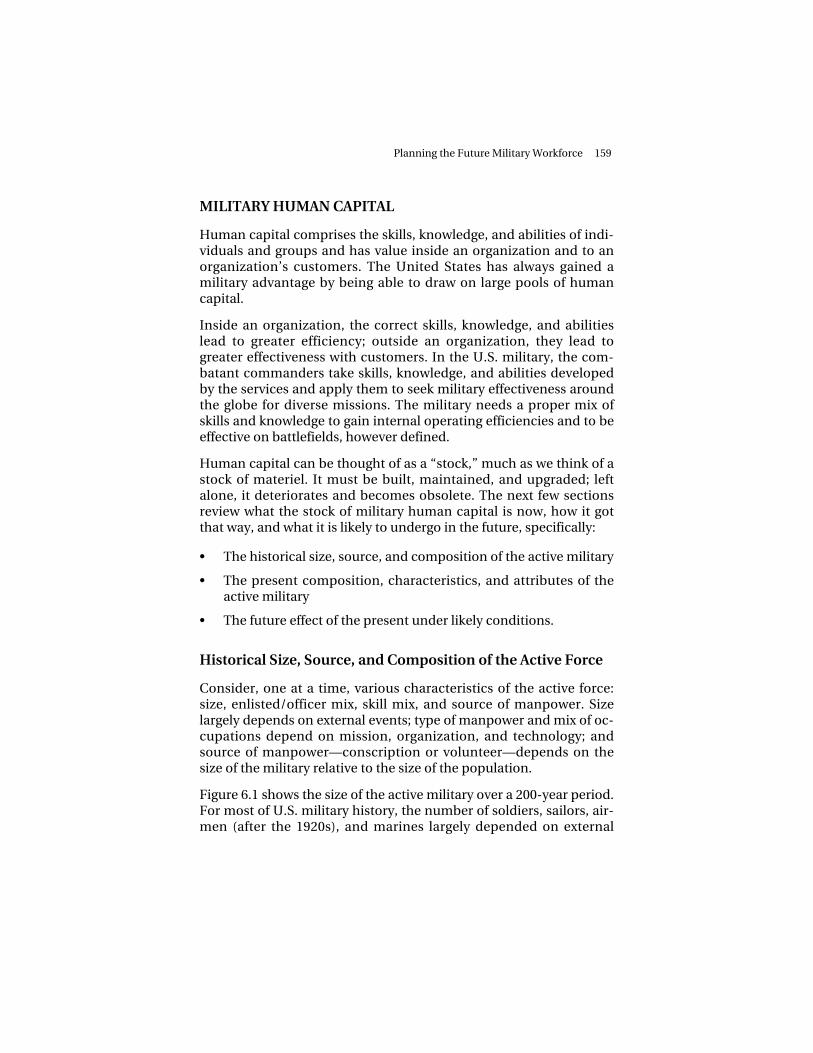
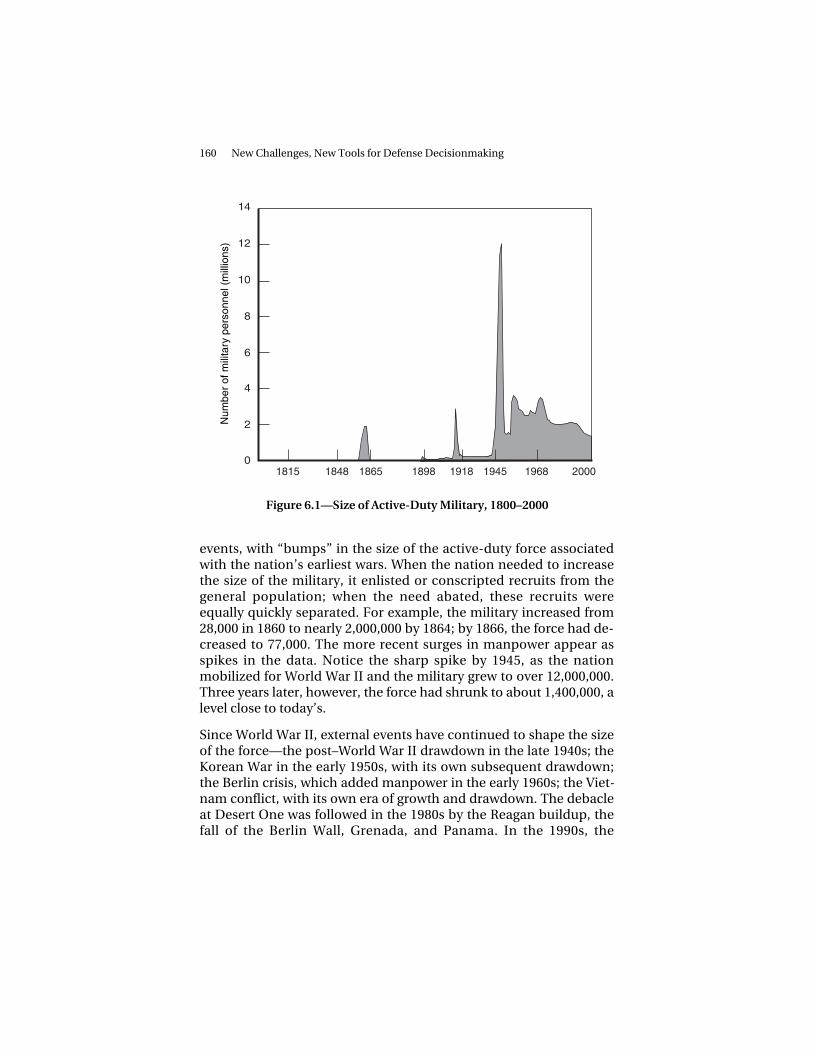
Figure 6.1 shows the size of the active military over a 200-year period.For most of U.S. military history, the number of soldiers, sailors, air-men (after the 1920s), and marines largely depended on external
160 New Challenges, New Tools for Defense Decisionmaking
0
2
4
6
8
10
12
14
1865 1898 1918 1945 2000196818481815
Num
ber
of m
ilita
ry p
erso
nnel
(m
illio
ns)
Figure 6.1—Size of Active-Duty Military, 1800–2000
events, with “bumps” in the size of the active-duty force associatedwith the nation’s earliest wars. When the nation needed to increasethe size of the military, it enlisted or conscripted recruits from thegeneral population; when the need abated, these recruits wereequally quickly separated. For example, the military increased from28,000 in 1860 to nearly 2,000,000 by 1864; by 1866, the force had de-creased to 77,000. The more recent surges in manpower appear asspikes in the data. Notice the sharp spike by 1945, as the nationmobilized for World War II and the military grew to over 12,000,000.Three years later, however, the force had shrunk to about 1,400,000, alevel close to today’s.
Since World War II, external events have continued to shape the sizeof the force—the post–World War II drawdown in the late 1940s; theKorean War in the early 1950s, with its own subsequent drawdown;the Berlin crisis, which added manpower in the early 1960s; the Viet-nam conflict, with its own era of growth and drawdown. The debacleat Desert One was followed in the 1980s by the Reagan buildup, thefall of the Berlin Wall, Grenada, and Panama. In the 1990s, the
Planning the Future Military Workforce 161
breakup of the former Soviet Union, the Persian Gulf conflict, andparticipation in humanitarian and other nonwar operations weresignificant. The 1990s witnessed a sharp reduction in the size of theactive military.
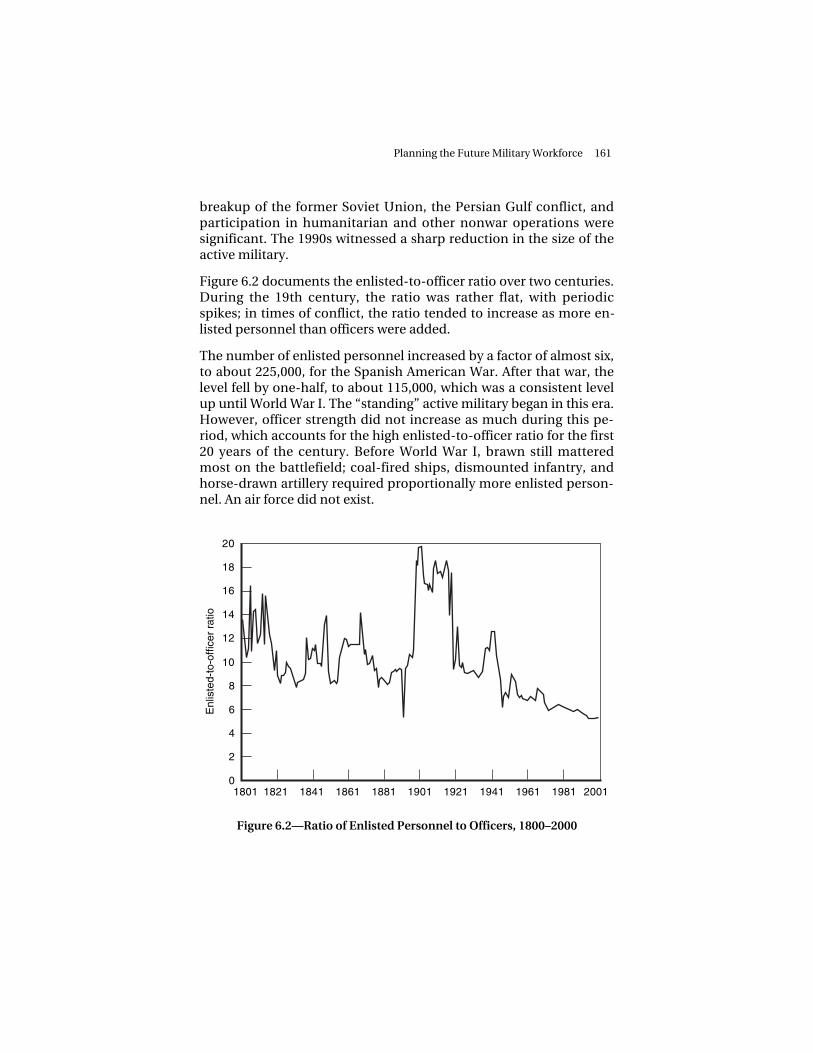
Figure 6.2 documents the enlisted-to-officer ratio over two centuries.During the 19th century, the ratio was rather flat, with periodicspikes; in times of conflict, the ratio tended to increase as more en-listed personnel than officers were added.
Figure 6.2—Ratio of Enlisted Personnel to Officers, 1800–2000
The number of enlisted personnel increased by a factor of almost six,to about 225,000, for the Spanish American War. After that war, thelevel fell by one-half, to about 115,000, which was a consistent levelup until World War I. The “standing” active military began in this era.However, officer strength did not increase as much during this pe-riod, which accounts for the high enlisted-to-officer ratio for the first20 years of the century. Before World War I, brawn still matteredmost on the battlefield; coal-fired ships, dismounted infantry, andhorse-drawn artillery required proportionally more enlisted person-nel. An air force did not exist.
162 New Challenges, New Tools for Defense Decisionmaking
Since World War I, there has been a significant shift from enlisted toofficer manpower. The introduction of the airplane, tank, modernsteam ship, and radio shifted work toward more use of brain thanbrawn. New technologies tend to be “officer heavy” when first intro-duced, because initially they are complex and require doctrinal andorganizational change. Technological innovations also initially re-quire a larger, officer-rich support tail to provide service and supply.Since World War II, the ratio’s trend has been downward, with lessfrequent spikes, as officers have come to represent a larger propor-tion of a large active military. Moreover, beginning in World War II,the need to coordinate, integrate, and sustain military forces num-bering in the millions, rather than tens of thousands, has led to offi-cers being substituted for enlisted personnel, in part to staff increas-ingly larger and more hierarchical organizations. These broad trendscontinue to the present.
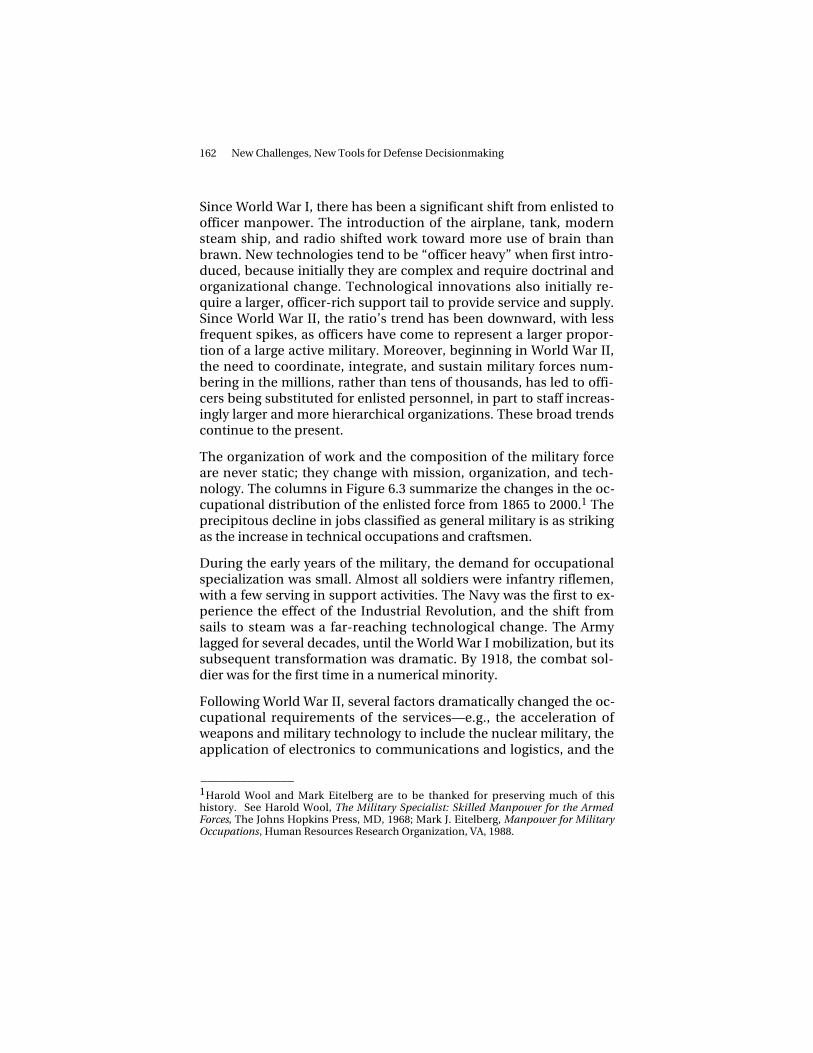
The organization of work and the composition of the military forceare never static; they change with mission, organization, and tech-nology. The columns in Figure 6.3 summarize the changes in the oc-cupational distribution of the enlisted force from 1865 to 2000.1 Theprecipitous decline in jobs classified as general military is as strikingas the increase in technical occupations and craftsmen.
During the early years of the military, the demand for occupationalspecialization was small. Almost all soldiers were infantry riflemen,with a few serving in support activities. The Navy was the first to ex-perience the effect of the Industrial Revolution, and the shift fromsails to steam was a far-reaching technological change. The Armylagged for several decades, until the World War I mobilization, but itssubsequent transformation was dramatic. By 1918, the combat sol-dier was for the first time in a numerical minority.
Following World War II, several factors dramatically changed the oc-cupational requirements of the services—e.g., the acceleration ofweapons and military technology to include the nuclear military, theapplication of electronics to communications and logistics, and the
______________ 1Harold Wool and Mark Eitelberg are to be thanked for preserving much of thishistory. See Harold Wool, The Military Specialist: Skilled Manpower for the ArmedForces, The Johns Hopkins Press, MD, 1968; Mark J. Eitelberg, Manpower for MilitaryOccupations, Human Resources Research Organization, VA, 1988.
Planning the Future Military Workforce 163
0
20
40
60
80
100
1865 1898 1918 1945 1975 2000
Per
cent
age
in e
ach
cate
gory
General militaryService and supplyClericalCraftsmenTechnical
Figure 6.3—Occupational Mix, 1865–2000
emergence of missiles and air defense. Organizational structureschanged to take advantage of the new armaments and processes, andthere was a noticeable occupational shift from infantry, artillery, andseamanship to technicians. By the early 1980s, technical workersconstituted the largest of the five separate groupings, as they do to-day. As of 2000, 18 percent of enlisted personnel were in a generalmilitary specialty, 35 percent were blue collar workers (service andsupply workers and craftsmen), and 47 percent were white collarworkers (clerical and technical workers).
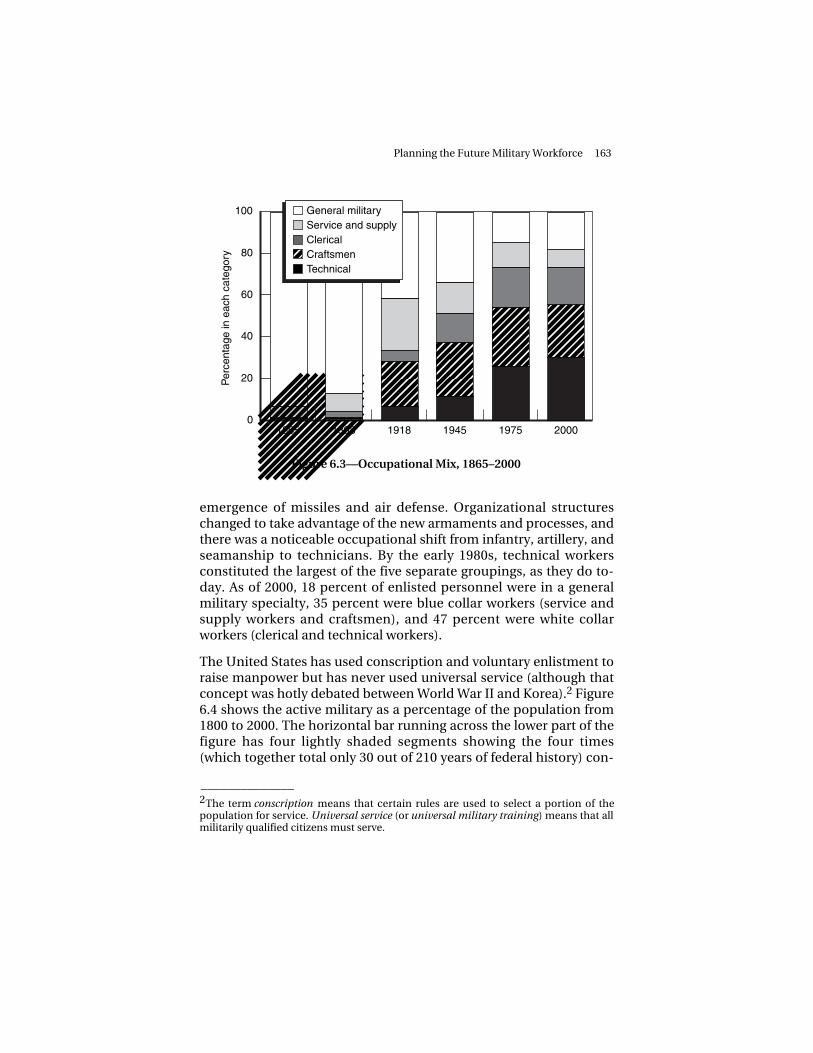
The United States has used conscription and voluntary enlistment toraise manpower but has never used universal service (although thatconcept was hotly debated between World War II and Korea).2 Figure6.4 shows the active military as a percentage of the population from1800 to 2000. The horizontal bar running across the lower part of thefigure has four lightly shaded segments showing the four times(which together total only 30 out of 210 years of federal history) con-
______________ 2The term conscription means that certain rules are used to select a portion of thepopulation for service. Universal service (or universal military training) means that allmilitarily qualified citizens must serve.
164 New Challenges, New Tools for Defense Decisionmaking
0
1
2
3
4
5
6
7
8
9
1865 1898 1918 1945 2000196818481815
Per
cent
age
of p
opul
atio
n
Figure 6.4—Active Military as Percentage of Population, 1800–2000
scription was used. The Civil War and World War I were both periodsof wartime conscription; the first use of peacetime conscription wasin 1940, shortly before World War II. The nation had a volunteer forcefrom 1946 to 1950, but Korea saw a return to conscription. Vietnammanpower policy was dominated by conscription to meet the needsof the Army; the needs of the other services and the reserve compo-nent were met largely with volunteers (though many of these weredraft induced).
Figure 6.4 also shows how the size of both the active enlisted forceand the population related to the use of conscription (shown inlightly shaded part of bar) over time. The nation has always usedconscription when it required an active enlisted force larger thanabout 1.4 percent of the population, something that has occurredonly during the four periods described above. Since 1973, when thelast period of conscription ended, the population has grown and theactive military has shrunk. Currently, the active force representsabout 0.5 percent of the population. Using the 1.4 percent as a rule ofthumb means that the need for an active force of above 3.7 million
Planning the Future Military Workforce 165
would lead to conscription—a highly unlikely event in the foresee-able future. Also, conditions outlined below will most likely make therule of thumb obsolete.
The lessons from this history are central to assessments about thefuture. However, the durability of these lessons cannot help but beaffected by more-recent fundamental changes that must be incorpo-rated into any synthesis of the future: the greater use of civilians andreserves, and the greater education and higher aptitude of the en-listed force.
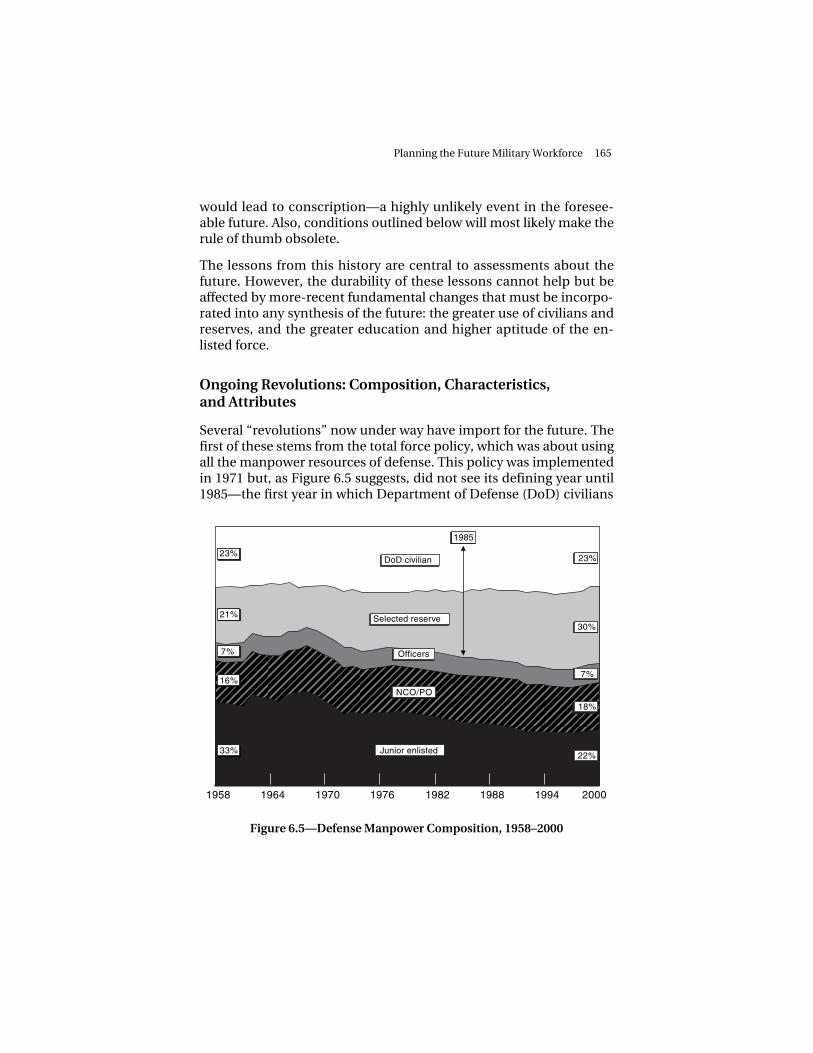
Several “revolutions” now under way have import for the future. Thefirst of these stems from the total force policy, which was about usingall the manpower resources of defense. This policy was implementedin 1971 but, as Figure 6.5 suggests, did not see its defining year until1985—the first year in which Department of Defense (DoD) civilians
166 New Challenges, New Tools for Defense Decisionmaking
and selected reservists (Guard and Reserve), combined, outnum-bered the active military. As of 2000, only 47 percent of total defensemanpower has been active military. This is a fundamental changethat needs to be central to thinking about the future stock of militaryhuman capital.
Another fundamental change took place within the active military.From 1958 on, active officers were a consistent 7 percent share oftotal defense manpower. However, in the enlisted category, noncom-missioned officers (NCOs) and petty officers (POs) gained share—upto 18 percent of defense manpower. Civilians, reservists, and NCO/PO have, together, replaced junior enlisted (those in the grades of E1to E4); the latter have dropped from one-third of all defense man-power in 1958 to about one-fifth in 2000. This follows directly fromthe changes in the nature of the military: work has become morecomplex and specialized, and more education and experience arerequired to do the work successfully.
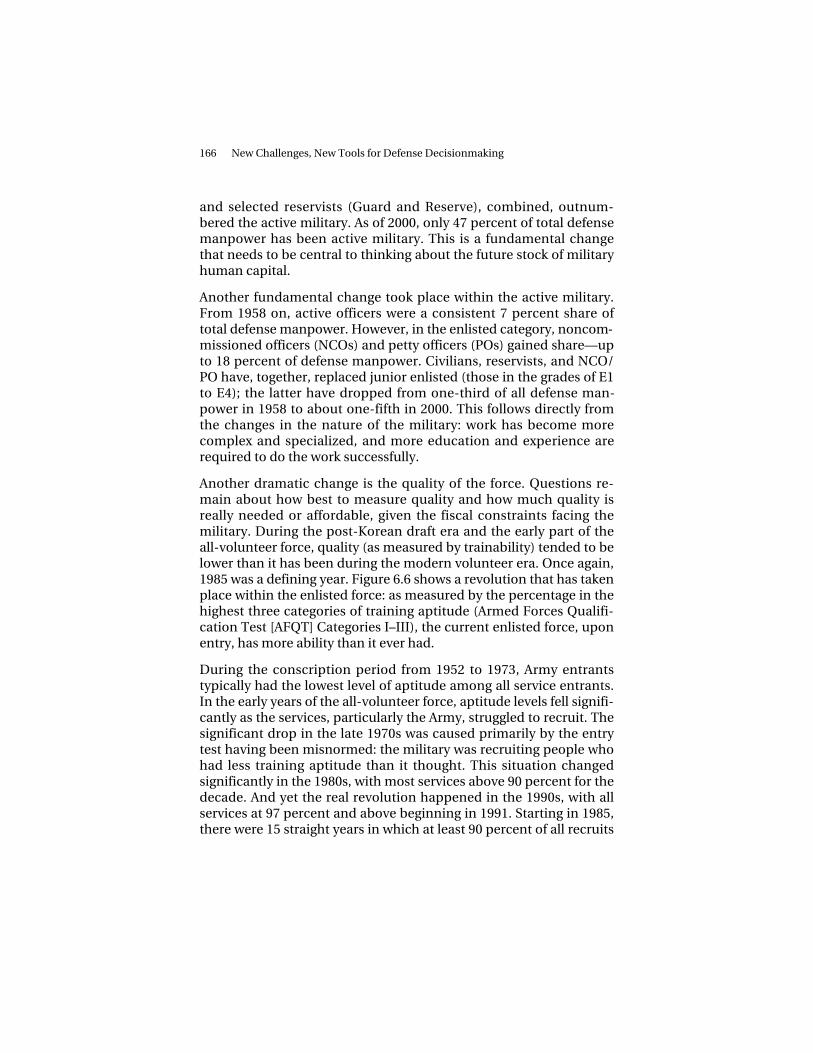
Another dramatic change is the quality of the force. Questions re-main about how best to measure quality and how much quality isreally needed or affordable, given the fiscal constraints facing themilitary. During the post-Korean draft era and the early part of theall-volunteer force, quality (as measured by trainability) tended to belower than it has been during the modern volunteer era. Once again,1985 was a defining year. Figure 6.6 shows a revolution that has takenplace within the enlisted force: as measured by the percentage in thehighest three categories of training aptitude (Armed Forces Qualifi-cation Test [AFQT] Categories I–III), the current enlisted force, uponentry, has more ability than it ever had.
During the conscription period from 1952 to 1973, Army entrantstypically had the lowest level of aptitude among all service entrants.In the early years of the all-volunteer force, aptitude levels fell signifi-cantly as the services, particularly the Army, struggled to recruit. Thesignificant drop in the late 1970s was caused primarily by the entrytest having been misnormed: the military was recruiting people whohad less training aptitude than it thought. This situation changedsignificantly in the 1980s, with most services above 90 percent for thedecade. And yet the real revolution happened in the 1990s, with allservices at 97 percent and above beginning in 1991. Starting in 1985,there were 15 straight years in which at least 90 percent of all recruits
Planning the Future Military Workforce 167
40
50
60
70
80
90
100P
erce
ntag
e in
cat
egor
ies
I–III
1952 1958 1964 1970 1976 1982 1988 1994 2000
1991
Air ForceNavyMarine CorpsArmy
1956-1964
1985
Figure 6.6—Percentage of Enlisted Accessions in Highest Three TrainingAptitude Categories, 1952–2000
entering the services were in these three highest aptitude categories.And those who have entered since 1985 will make up over 95 percentof the enlisted force across all services by 2005. Where does this apti-tude revolution lead? Virtually all NCOs/POs in the year 2010 (99.5percent) will have entered since 1985. This highly trainable currentand future force bodes well for those who emphasize the learning re-quirements of the future and the development of military humancapital.
Hand in glove with the aptitude revolution is an education revolu-tion. Officers have always been mostly college graduates, but NCOsand POs are now becoming more educated as well. In recent years,officer duties have devolved to NCOs and POs. Many types of work,from administration and paperwork to missile launching, have be-come sergeant and PO work—largely because of technology and afaster operational tempo. Aspects of this devolution of duties canalso be seen in changing concepts of development. Training, a skill-based concept that results in an immediate ability to do certain tasksmore proficiently, is slowly giving way to education as a knowledge-
168 New Challenges, New Tools for Defense Decisionmaking
based enlisted force increasingly becomes a necessity for successfulperformance.
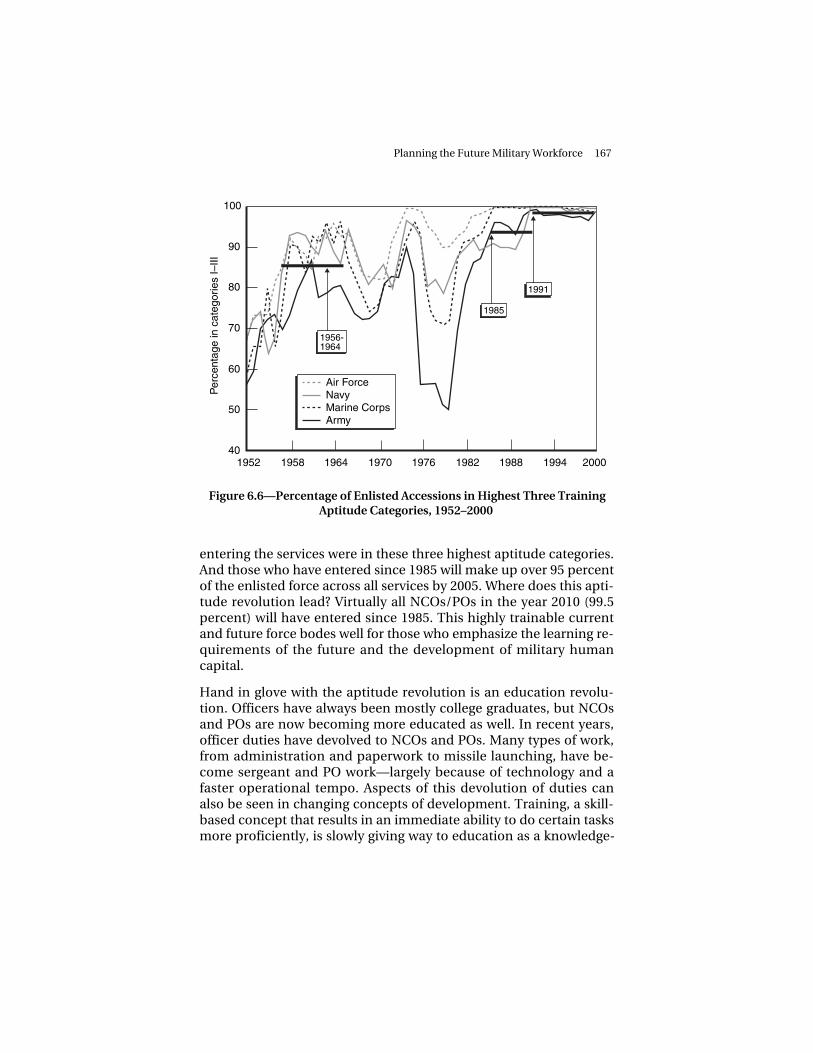
The enlisted force is more highly educated than in any previous era.Figure 6.7 shows the proportion of grades E6 to E9 with at least somecollege education for three different time periods. Fiscal year 1972represents a force that, while not necessarily conscripted, wasshaped by conscription; fiscal year 1981 represents a force shapedadditionally by the early years of the volunteer force; fiscal year 1996represents a force almost exclusively the product of the volunteerera. The figure shows that, generally, the higher the grade, the higherthe educational achievement. This figure and the earlier ones showthat the proportion of college graduates grew over time as well asacross all grades and occupations.
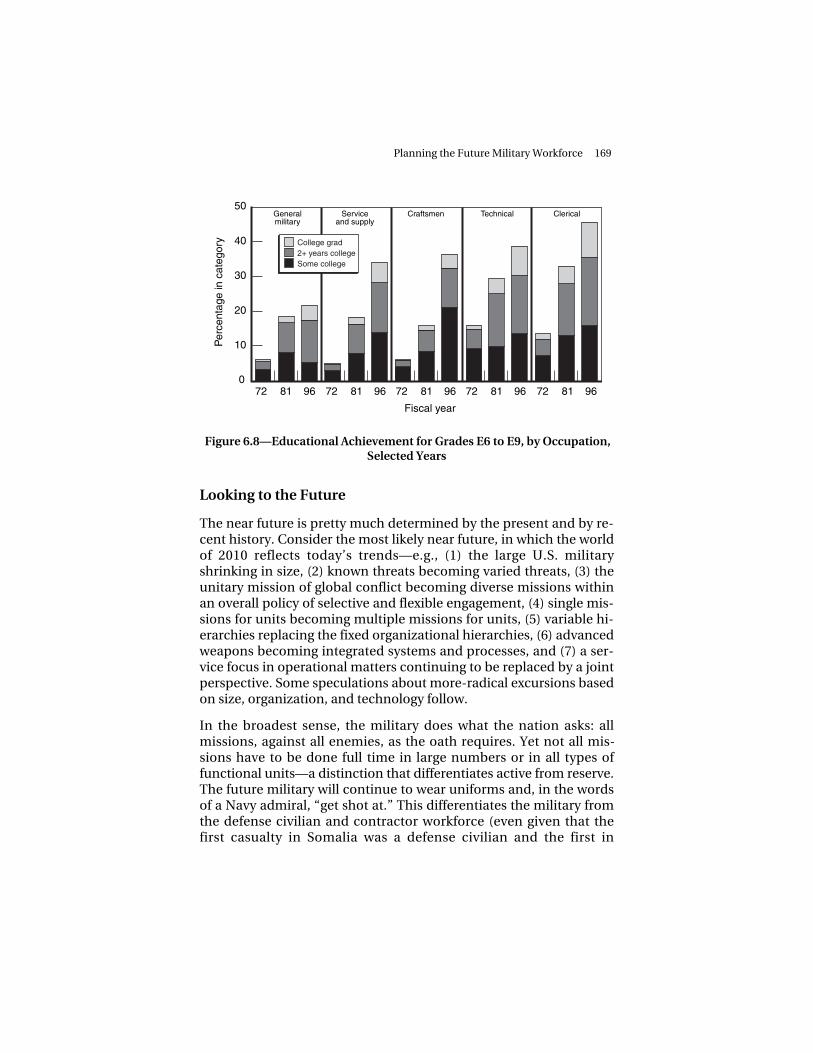
Figure 6.8 shows the data by occupation (aggregated for grades E6 toE9). Even in the general military occupational group, which is thegroup associated with Army and Marine Corps combat skills, theproportion with at least some college is much greater than was gen-erally believed to be achievable in the era of a conscription-shapedenlisted force.
0
10
20
30
40
50
72 81 96 72 81 96 72 81 96 72 81 96
Grade E6 Grade E7 Grade E8 Grade E9
Fiscal year
Per
cent
age
in c
ateg
ory
College grad2+ years collegeSome college
Figure 6.7—Educational Achievement for Grades E6 to E9, Selected Years
Planning the Future Military Workforce 169
0
10
20
30
40
50
72 81 96 72 81 96 72 81 96 72 81 96 72 81 96
Generalmilitary
Serviceand supply
Craftsmen Technical Clerical
Fiscal year
Per
cent
age
in c
ateg
ory College grad
2+ years collegeSome college
Figure 6.8—Educational Achievement for Grades E6 to E9, by Occupation,Selected Years
Looking to the Future
The near future is pretty much determined by the present and by re-cent history. Consider the most likely near future, in which the worldof 2010 reflects today’s trends—e.g., (1) the large U.S. militaryshrinking in size, (2) known threats becoming varied threats, (3) theunitary mission of global conflict becoming diverse missions withinan overall policy of selective and flexible engagement, (4) single mis-sions for units becoming multiple missions for units, (5) variable hi-erarchies replacing the fixed organizational hierarchies, (6) advancedweapons becoming integrated systems and processes, and (7) a ser-vice focus in operational matters continuing to be replaced by a jointperspective. Some speculations about more-radical excursions basedon size, organization, and technology follow.
In the broadest sense, the military does what the nation asks: allmissions, against all enemies, as the oath requires. Yet not all mis-sions have to be done full time in large numbers or in all types offunctional units—a distinction that differentiates active from reserve.The future military will continue to wear uniforms and, in the wordsof a Navy admiral, “get shot at.” This differentiates the military fromthe defense civilian and contractor workforce (even given that thefirst casualty in Somalia was a defense civilian and the first in
170 New Challenges, New Tools for Defense Decisionmaking
Afghanistan was a CIA operative). The reduction of active militarymanpower as a proportion of all defense manpower is likely to con-tinue. More reductions of direct defense manpower will occur asmore contractors are used on and off the battlefield. Eventually, themanpower needs of the active military will be about one-third of apercent of the population, a level easily met by volunteers enteringmilitary service.
Officers “lead” in the broad sense of leadership. They set direction,align forces, and empower people. This differentiates the officercorps from the NCO and PO corps, which has evolved in its own rightto be the force’s managers and technicians. The experience level ofthe enlisted force will continue to grow as NCOs and POs continue todisplace junior enlisted. Moreover, junior officers who have beenmanagers and technicians more than leaders will begin to be sup-planted by educated and experienced enlisted technicians and man-agers. So far, with enlisted personnel acquiring more status, theirwork appears to be taking on more of the hallmarks of a professionand fewer of the hallmarks of a trade. As the edge in human capitalenjoyed by junior officers over senior enlisted shrinks, many issuesrelated to the scope of the latter’s responsibility, job design, status,and compensation become salient.
Two enduring characteristics—cognitive ability and conscientious-ness—explain most variability in job performance. These character-istics are largely inherent in the individual and not easily changedlater in life. People have them in varying levels when they enter or-ganizations; one cannot develop, train, or educate for these charac-teristics except at the margin. Therefore, people have to be selectedfor them. The military has had and will continue to have a “select thebest” strategy, expecting all entrants to be able to rise to the highestlevels of responsibility. The military strives for a homogeneous enter-ing group of high ability. As better measures of such characteristicsas conscientiousness are found, the military will select for them aswell. Neither all militaries around the world nor all organizations canafford such a strategy, however; instead, they select a mix of peoplewith varied levels of these characteristics. But to get people with highlevels of these characteristics, one must have appropriate selectionand compensation instruments in place.
Planning the Future Military Workforce 171
Occupational classifications derive from what work the military willbe asked to do (its missions), how it structures itself to do the work(its organization), and the systems and processes it uses to accom-plish the work (its technology). The competencies for military humancapital change over time. Doctrine and theory for military and navalscience and paradigms for leadership and management are not con-stants. Miniaturization, digitization, and other advances changeneeded military expertise. Tanks replace horses; steam replaces sail;turbines replace pistons. Is technology part of military knowledgeand expertise? Certainly. Technology—how things are done—has al-ways been part of the core knowledge of the military profession.Reskilling and upskilling will enter the lexicon of force management.The highly trainable and experienced enlisted force will be devel-oped and redeveloped to ensure it possesses attributes critical tomission performance.
The military is likely to become smaller, more experienced, and morehighly graded, with the percentage classified as general military orline category reaching a new low. These grade and skill percentageswill vary by service, as they do now, but the differences will becomemore pronounced toward 2010. The military might evolve in a differ-ent way, however, because of varying size (smaller or larger), organi-zational change (outsourcing, streamlining, downgrading), andtechnology (user friendly or not user friendly). Based on the directionof change, the military can shrink or grow as well as compose itself ofvarious skills and grades.
Whether military human capital will change depends on how changeis defined. If it is defined as a succession of doctrinal and organiza-tional changes in a constant-sized force, the manpower and person-nel change will largely be one of composition, grade, and skill, withsome manpower reductions because of productivity gains. However,if manpower is reduced to pay for new systems, what remains will beolder, have a different mix of skills, and be forced to rely more on re-serves and civilians. Either way, trends in manpower categorization,experience, and skill mix will be accelerated, but there will be nofundamentally new prospect.
In sum, this is what the future holds: the stock of military humancapital needed will change, but in discernible directions. The activemilitary will remain robust in size, but proportionally more defense
172 New Challenges, New Tools for Defense Decisionmaking
will be provided by civilians, contractors, and selected reservists.NCOs and POs will continue to displace junior enlisted and begin tosupplant junior officers. Those who enter the active military will beselected on the basis of certain enduring characteristics, such ascognitive ability and conscientiousness, for which a good measure isneeded. They will be well-trained and educated. Specific knowledgeand other developed attributes will change as the core of professionalknowledge and experience that all military personnel must havechanges with mission, organization, and technology. It is likely thatcareer management and compensation practices will need tochange. It is not likely that a revolution in military affairs (RMA), rea-sonably defined, will alter such trends much, but it may acceleratethem.
MANPOWER AND PERSONNEL ANALYSIS
To answer questions about planning a future force, one must decideon objectives, criteria, alternatives, and measures. Models and ana-lytic techniques can be used to relate these four elements in usefulways and to draw out consequences and tradeoffs.
The Process
The analytic process begins with the front end (more art than sci-ence), in which the problem is identified and structured. The prob-lem first has to be stated appropriately and clearly, at which point itbecomes critical that the objectives be articulated so as to spawnmore-precise criteria. What is the desired outcome? Almost all ob-jectives deal with some variant of effectiveness or cost. One part ofthe front end entails devising a broad, creative range of alternativepolicies that can be evaluated. A large part deals with sorting outends from means from alternatives from constraints. Constantlyasking “why” helps to construct a hierarchy that allows for analysis toenter a structured picture.
In the second part of the process, the analytic middle (muddle?), sci-ence replaces the art of the front end. The science does not have tobe complex; logic is often sufficient and may be adequately done onthe back of an envelope. This analytic middle sorts through conse-quences: How well do alternatives meet criteria? Models, methods,
Planning the Future Military Workforce 173
data, and qualitative assessments are brought to bear. Once the con-sequences of alternatives are known, tradeoffs can be made. Rarelyare all objectives satisfied by one dominant alternative, so toughchoices and compromises must be made when all objectives cannotbe met at once.
Which objectives are more important than others? An alternative thatprovides more effectiveness at a lower cost is a no-brainer, but suchan alternative is seldom found in the real world; and the reverse, lesseffectiveness at a higher cost, is seldom chosen. Alternatives that of-fer more effectiveness at a higher cost or a lower cost for less effec-tiveness or other possible combinations require hard thinking aimedat determining which alternative appears to best meet the ultimateobjectives. Then, one must deal with uncertainties. What couldchange the assessed consequences? Specific cases can be examinedor certain parameters can be judgmentally varied to see how theconsequences and thus the conclusion might change. Last, what isthe appetite for risk? Is it better to do nothing if there is no stomachto see the consequences through?
At this point, the back end of the analytic process is reached. Analyz-ing stops, and decisions or recommendations are made—which in-cludes linking them to other problems and solutions in useful ways.Art and science give way to decision and judgment, a process that inthe public sector, is not simply about selecting the “best” alternativefor maximizing or minimizing criteria related to objectives, but in-volves consensus. What can the disparate stakeholders within DoDor across the executive and legislative branches agree to? What canbe implemented?
The various parts of the manpower community go about their workdifferently. The personnel community, which seeks the best answerfor the long term, studies the long-range, ideal effects of policy orchanged parameters. This steady-state analysis applies constantrates and planning factors to see what happens in the steady statewhen all the transitional effects are settled out. Of course, no state issteady; transitional effects form a constant stream. But steady-statethinking is the best analytic tool for policy optimization.
The program and budget community, however, is more interested inthe dynamic effects of a changed policy. What happens over a par-
174 New Challenges, New Tools for Defense Decisionmaking
ticular time horizon as rates and factors change successively? Notsurprisingly, the five- to seven-year horizon of the program objec-tives memorandum (POM) process is frequently used. Models showthe effects of policy choice projected out for about five years, but notbeyond (the famous “straight-lined” from the fifth year). Programand budget analysts are more concerned with the immediate re-source consequences than with long-term effectiveness issues.
And as for the managerial community, it is more interested in execu-tion: How do we get to a chosen new policy over a period of time?What decisions have to be implemented and when if we are to gainthe benefits and avoid the costs? Unfortunately, deciding on a courseand implementing it are not one and the same, so tough choices of-ten are not followed through on. The reality is a bewildering agglom-eration of half-completed past policy implementations that con-found not only the managerial community, but the personnel andprogram and budget communities as well. Personnel policy tends toaccrete over time in marginal ways.
Choosing Among Alternatives, an Example
To illustrate the process just described, consider the following ques-tions: How do specific changes in deployment, or personnel-related,policies and procedures affect
• Force readiness, particularly the availability of individuals andunits for deployment?
• The level and distribution of operations tempo and its relatedstresses on units and individuals?
• Related outcomes, such as geographic stability, unit cohesion,and career-long job satisfaction and quality of life?
• Retention?
• Cost?
Concentrating on these questions helps in identifying objectives andalternatives—part of the front end of the process. Objectives—out-comes desired by the organization—are of extreme importance indecisionmaking. Although they are usually stated broadly, are usuallypoorly quantified, and may conflict with each other, their purpose is
Planning the Future Military Workforce 175
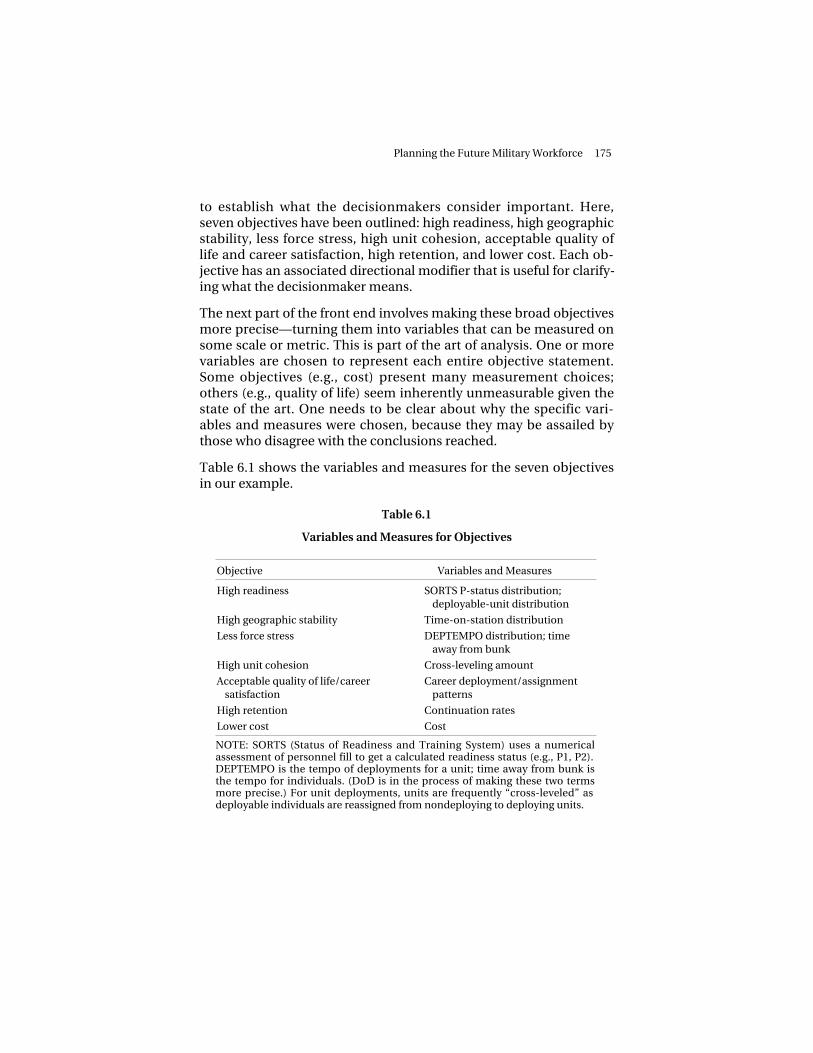
to establish what the decisionmakers consider important. Here,seven objectives have been outlined: high readiness, high geographicstability, less force stress, high unit cohesion, acceptable quality oflife and career satisfaction, high retention, and lower cost. Each ob-jective has an associated directional modifier that is useful for clarify-ing what the decisionmaker means.
The next part of the front end involves making these broad objectivesmore precise—turning them into variables that can be measured onsome scale or metric. This is part of the art of analysis. One or morevariables are chosen to represent each entire objective statement.Some objectives (e.g., cost) present many measurement choices;others (e.g., quality of life) seem inherently unmeasurable given thestate of the art. One needs to be clear about why the specific vari-ables and measures were chosen, because they may be assailed bythose who disagree with the conclusions reached.
Table 6.1 shows the variables and measures for the seven objectivesin our example.
Table 6.1
Variables and Measures for Objectives
Objective Variables and Measures
High readiness SORTS P-status distribution;deployable-unit distribution
High geographic stability Time-on-station distribution
Less force stress DEPTEMPO distribution; timeaway from bunk
High unit cohesion Cross-leveling amount
Acceptable quality of life/careersatisfaction
Career deployment/assignmentpatterns
High retention Continuation rates
Lower cost Cost
NOTE: SORTS (Status of Readiness and Training System) uses a numericalassessment of personnel fill to get a calculated readiness status (e.g., P1, P2).DEPTEMPO is the tempo of deployments for a unit; time away from bunk isthe tempo for individuals. (DoD is in the process of making these two termsmore precise.) For unit deployments, units are frequently “cross-leveled” asdeployable individuals are reassigned from nondeploying to deploying units.
176 New Challenges, New Tools for Defense Decisionmaking
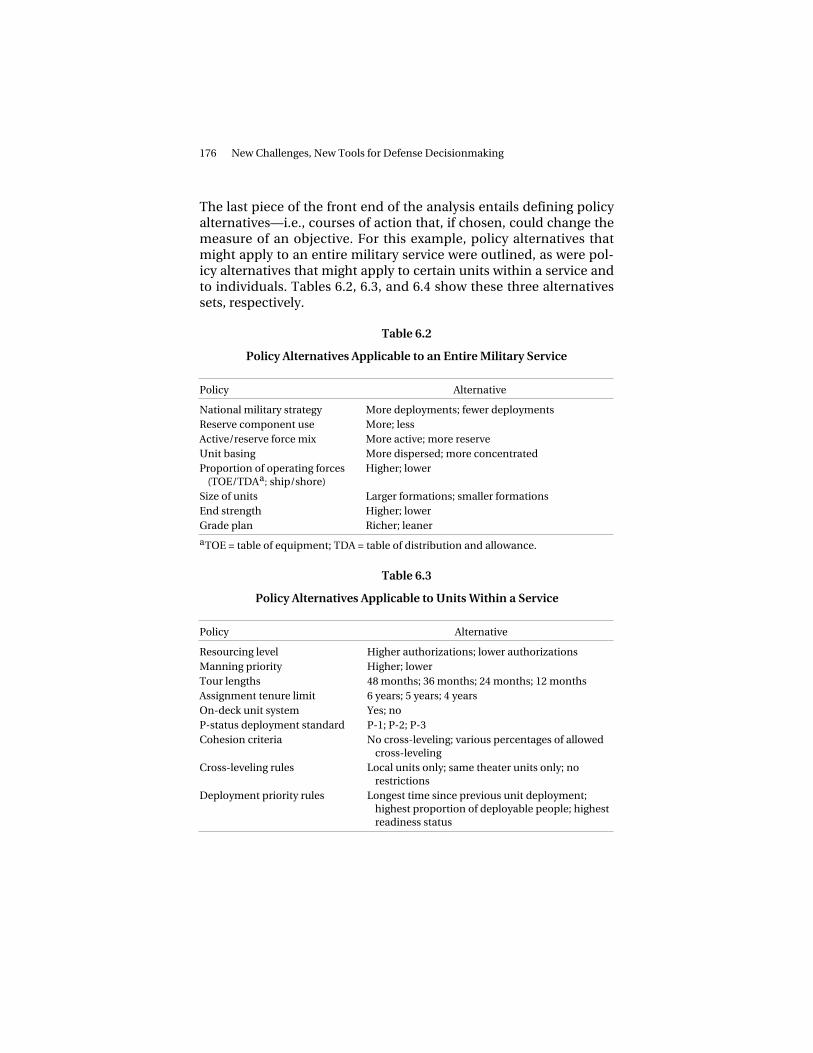
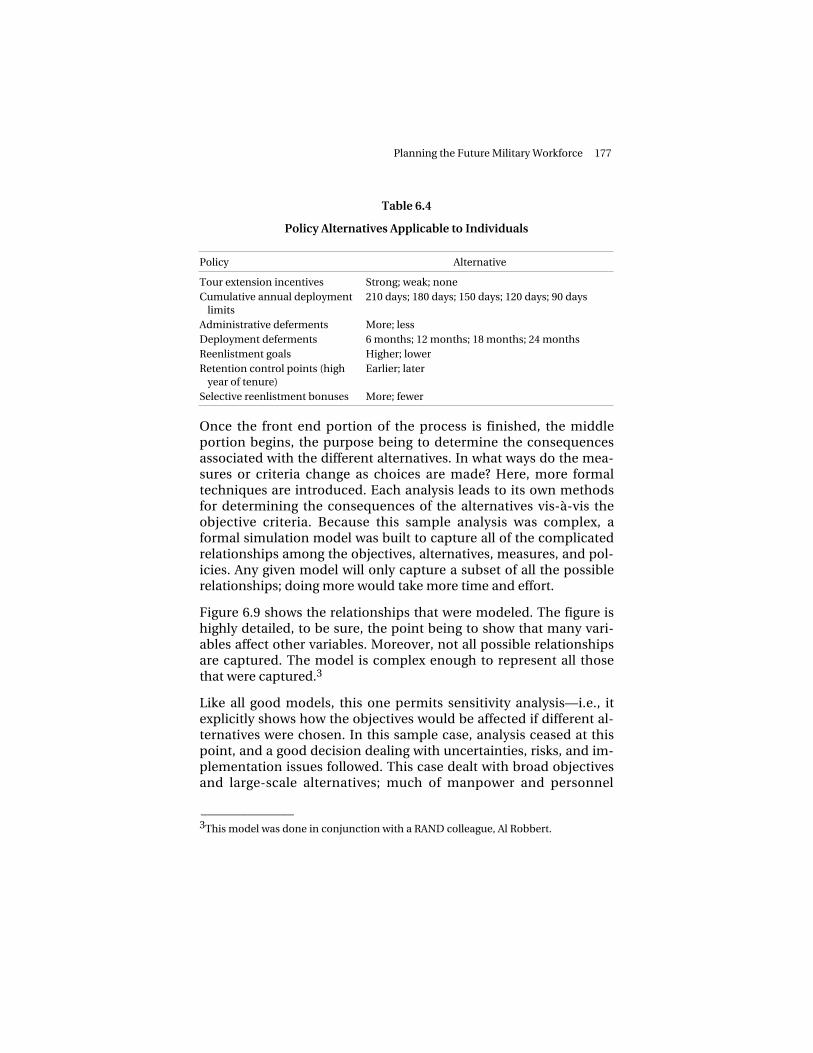
The last piece of the front end of the analysis entails defining policyalternatives—i.e., courses of action that, if chosen, could change themeasure of an objective. For this example, policy alternatives thatmight apply to an entire military service were outlined, as were pol-icy alternatives that might apply to certain units within a service andto individuals. Tables 6.2, 6.3, and 6.4 show these three alternativessets, respectively.
Table 6.2
Policy Alternatives Applicable to an Entire Military Service
Policy Alternative
National military strategy More deployments; fewer deploymentsReserve component use More; lessActive/reserve force mix More active; more reserveUnit basing More dispersed; more concentratedProportion of operating forces
(TOE/TDAa; ship/shore)Higher; lower
Size of units Larger formations; smaller formationsEnd strength Higher; lowerGrade plan Richer; leaner
aTOE = table of equipment; TDA = table of distribution and allowance.
Table 6.3
Policy Alternatives Applicable to Units Within a Service
Policy Alternative
Resourcing level Higher authorizations; lower authorizationsManning priority Higher; lowerTour lengths 48 months; 36 months; 24 months; 12 monthsAssignment tenure limit 6 years; 5 years; 4 yearsOn-deck unit system Yes; noP-status deployment standard P-1; P-2; P-3Cohesion criteria No cross-leveling; various percentages of allowed
cross-levelingCross-leveling rules Local units only; same theater units only; no
restrictionsDeployment priority rules Longest time since previous unit deployment;
highest proportion of deployable people; highestreadiness status
Planning the Future Military Workforce 177
Table 6.4
Policy Alternatives Applicable to Individuals
Policy Alternative
Tour extension incentives Strong; weak; noneCumulative annual deployment
limits210 days; 180 days; 150 days; 120 days; 90 days
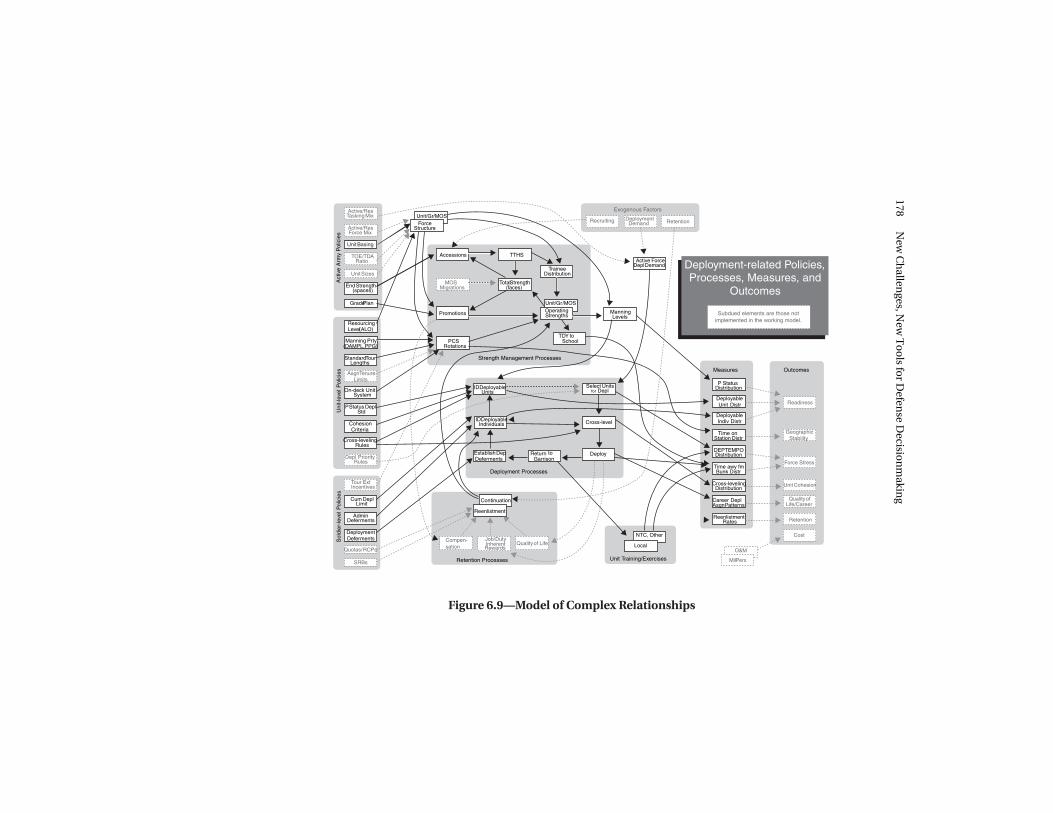
Once the front end portion of the process is finished, the middleportion begins, the purpose being to determine the consequencesassociated with the different alternatives. In what ways do the mea-sures or criteria change as choices are made? Here, more formaltechniques are introduced. Each analysis leads to its own methodsfor determining the consequences of the alternatives vis-à-vis theobjective criteria. Because this sample analysis was complex, aformal simulation model was built to capture all of the complicatedrelationships among the objectives, alternatives, measures, and pol-icies. Any given model will only capture a subset of all the possiblerelationships; doing more would take more time and effort.
Figure 6.9 shows the relationships that were modeled. The figure ishighly detailed, to be sure, the point being to show that many vari-ables affect other variables. Moreover, not all possible relationshipsare captured. The model is complex enough to represent all thosethat were captured.3
Like all good models, this one permits sensitivity analysis—i.e., itexplicitly shows how the objectives would be affected if different al-ternatives were chosen. In this sample case, analysis ceased at thispoint, and a good decision dealing with uncertainties, risks, and im-plementation issues followed. This case dealt with broad objectivesand large-scale alternatives; much of manpower and personnel
______________ 3This model was done in conjunction with a RAND colleague, Al Robbert.
178N
ew C
hallen
ges, New
To
ols fo
r Defen
se Decisio
nm
aking
Active/ResTasking Mix
Active/ResForce Mix
Unit Basing
TOE/TDARatio
Unit Sizes
End Strength(spaces)
Grade Plan
Act
ive
Arm
y P
olic
ies
Resourcing Level (ALO)
Manning Prty(DAMPL,PPG)
Standard TourLengths
Depl PriorityRules
P Status DeplStd
On-deck UnitSystem
Asgn TenureLimits
CohesionCriteria
Cross-levelingRules
DeploymentDeferments
AdminDeferments
Tour ExtIncentives
Cum DeplLimit
SRBs
Quotas/ RCPs
Sol
dier
-leve
l P
olic
ies
Strength Management Processes
TTHS
PCSRotations
Promotions
Accessions
Total Strength(faces)
MOSMigrations
TraineeDistribution
Unit/Gr/MOSOperatingStrengths
TDY to School
Unit/Gr/MOSForce
Structure
Exogenous Factors
DeploymentDemand RetentionRecruiting
Active ForceDepl Demand
ManningLevels
Compen-sation Inherent
Job/Duty
RewardsQuality of Life
Continuation
Reenlistment
Retention Processes
ID DeployableUnits
Cross-level
DeploytoGarrison
Select Unitsfor Depl
ID DeployableIndividuals
EstablishDepDeferments
Deployment Processes
NTC, Other
Local
Unit Training/Exercises
Measures
DeployableIndiv Distr
P StatusDistribution
Time onStation Distr
ReenlistmentRates
Career DeplAsgn Patterns
Time awy fmBunk Distr
Cross-levelingDistribution
DEPTEMPODistribution
DeployableUnit Distr
O&M
Mil Pers
Readiness
GeographicStability
Retention
Quality ofLife/Career
Unit Cohesion
Force Stress
Cost
Outcomes
Deployment-related Policies,Processes, Measures, and
Outcomes
Subdued elements are those notimplemented in the working model.
Uni
t-le
vel P
olic
ies
Figure 6.9—Model of Complex Relationships
Return
Planning the Future Military Workforce 179
analysis is narrower and more precise. While trends and broad forcesdo not change quickly, there is much to be learned by analyzing theirimpacts when seeking improvements to manpower, personnel, andtraining policies and processes that will increase military effective-ness and reduce costs.