64 CHAPTER THREE: ENVIRONMENTAL VARIABLES 3.1 Introduction Based on situational crime prevention strategy, physical and environmental conditions can influence the chances of occurrence of a crime. It assumes that offending behaviour is opportunistic and therefore situational features can be more easily manipulated than the behaviour of offenders to inhibit crime. This chapter discusses the assumptions that link the urban physical and environmental features with occurrences of vandalism and graffiti. Since the study aims to explore the teenage students’ perception of safety in relation to non-political graffiti vandalism with reference to outdoor lighting levels in urban areas of Tehran, the first part of this chapter focuses on lighting in urban environment. This part looks at the relation between outdoor lighting qualities, urban development and also looks at effective lighting design, its principles and issues. It continues with a critical review of the available literature on the effectiveness and costs benefit of the lighting interventions to improve perception of safety, to reduce crimes and such other antisocial behaviour. Finally the chapter points to different theories that link the lighting level and vandalism occurrences. The purpose of this study is to discuss the results from relevant available literature on this topic that might lead to a better understanding of the problem and helps to identify the knowledge gap. To identify situational and urban environmental variables that correlated with high degree of graffiti damages in Tehran urban areas, it is necessary to study the physical features of the study area.
Transcript
64
CHAPTER THREE: ENVIRONMENTAL VARIABLES
3.1 Introduction
Based on situational crime prevention strategy, physical and environmental
conditions can influence the chances of occurrence of a crime. It assumes that offending
behaviour is opportunistic and therefore situational features can be more easily
manipulated than the behaviour of offenders to inhibit crime. This chapter discusses the
assumptions that link the urban physical and environmental features with occurrences of
vandalism and graffiti.
Since the study aims to explore the teenage students’ perception of safety in
relation to non-political graffiti vandalism with reference to outdoor lighting levels in
urban areas of Tehran, the first part of this chapter focuses on lighting in urban
environment. This part looks at the relation between outdoor lighting qualities, urban
development and also looks at effective lighting design, its principles and issues. It
continues with a critical review of the available literature on the effectiveness and costs
benefit of the lighting interventions to improve perception of safety, to reduce crimes
and such other antisocial behaviour. Finally the chapter points to different theories that
link the lighting level and vandalism occurrences.
The purpose of this study is to discuss the results from relevant available literature
on this topic that might lead to a better understanding of the problem and helps to
identify the knowledge gap.
To identify situational and urban environmental variables that correlated with high
degree of graffiti damages in Tehran urban areas, it is necessary to study the physical
features of the study area.
65
The major sets of the physical features that are emphasised in this study are:
i. Block layout ii. Housing design
iii. Street design iv. Lighting design
This chapter describes urban characteristics of Tehran and discusses how urban
environmental variables such as lighting design, housing design, block layout and street
design in Tehran urban areas can provide opportunities or limitations to occurrence of
vandalism and graffiti. It explores how these physical features effects on
implementation of SCP strategies to combat graffiti and vandalism in urban areas of
Tehran. Individual characteristics of the city, demography and socioeconomic status of
residents would be discussed.
3.2 Outdoor Lighting
Lighting is to provide comfortable, safe and effective vision at night. It can
enhance visually structured urban space and provide both place promotion and sense of
place after dark.
Cities are generally planned by day to provide a pleasing experience for citizens
but when darkness falls, the urban environment often changes in character. Illumination
of the cities is necessary for safety, security, city appearance as well as for the
aesthetics. It aims to emphasise historical and artistic values of a city through outdoor
lighting sources. In general, cities have identities because of their qualities. When the
daylight disappears, the night-time lighting becomes important. As a result lighting
takes the primary role to strengthen the quality of nightscape for cities.
Although, there are economic and environmental reasons why some organisations
may wish to control and limit the amount of lighting, there are safety reasons as to why
66
lighting needs to be available. “Energy consumption and adverse effect of lighting on
the environment in the form of greenhouse gases and the increase in light pollution are
often cited as the reasons to switch off lighting” (The Institution of Lighting Engineers
[ILE], 2006, P.2) but the assumption that improved lighting can make substantial
contribution to reduce crime and fear of crime, lead authorities and policy makers to
encourage investigating the actual effects of improved lighting on crime prevention.
3.2.1 Outdoor Lighting in Urban Environment
Lighting is an important aspect of the urban environment. Major, Speirs and
Tischhauser (2005, P.1) noted that “The built environment is designed not only to
provide light but also to be experienced in light”. Rateau (2002, P.75) pointed out that
“it should not be denied that lighting plays an essential role in influencing the way in
which we apprehend the environment”.
The primary propose of lighting in urban areas is to provide a safer, more inviting,
attractive, appropriate and positive image for the people that live and work in the
neighbourhood (NYSERDA 2002, American Association of State Highway and
Transportation Officials [AASHTO],2003).
According to Lang (1994), lighting in public areas provide illumination for
activities, it entertains and gives visual order to the cities. He added that lighting gives
identity to places and brings attention to specific features. Lighting serves aesthetic
purposes and can enhance sense of pride, if well executed. According to Lang (1994),
“well lighted places contributes not only to peoples’ feeling secure but also to their
sense of well being” (Lang (1994, P.295). Schreuder (2008) pointed to the advancement
of human well being as the main function of lighting and Carmona et al. (2003, P.187)
stated that “artificial lighting makes a positive contribution to the character and utility of
urban spaces”.
67
According to Rateau (2002), artificial lighting shapes the cities and it can disguise
the blemishes revealed during day time. Lighting can link different components of the
city by giving them a recognisable and identifiable personality.
Generally street lighting are installed for practical reasons and sometimes simply
for aesthetics. Tanner and Tiesdell (1997) explained that the aesthetic properties of good
lighting make urban areas attractive places and add urban quality. Watson (1990 as cited
in Lang,1994), explained that the way the urban areas are illuminated, the patterns,
degree of illumination, types of light and light sources are contributing factors to
aesthetic effects of a city.
According to Schreuder (1998) the benefits of public lighting is social and includes
communication between people and the promotion of safety and makes an important
contribution to increase social life by enhancing the night time environment.
Narisada and Schreduder (2004) points to the contribution of outdoor lighting to
the efficiency of human activities at night and that the existence of outdoor lighting
makes the continuous works possible. It helps to save time, energy and indirectly
contributes to efficiency of human activities.
But with the benefits of lighting, comes a need to protect travellers or adjacent
properties from the use of inappropriate lighting practices and systems (Schreuder 1998,
Eley Associates 2002, Clark 2009).
According to International Dark-Sky Association (2002), careless use of outdoor
lighting damages the night time environment and often decreases security and safety. It
also points to excessive use of outdoor lighting that causes extensive damage to the
aesthetics of the night.
68
Clark (2009) considers the widespread application of outdoor lighting and notes
that although it transformed the civilisation and enhanced the quality of life but “it was
accompanied by a large hidden cost of substantial ecological and environmental
degradation as well as undesirable social and health consequences” ( Clark, 2009, P11).
Energy savings by more efficient lighting has been a major priority of most groups
concerned with environmental issues (Thompson & Sorvig, 2000). Energy for outdoor
lighting is the biggest part in the energy usage of a city. Electric power usage,
maintenance and operation of the lighting system are a considerable expense for cities
(Baenziger & Progetti, 2002).
According to US Department of Energy for outdoor lighting design (2010), it is
important to consider the primary purpose of lighting along with the basic methods for
achieving energy efficiency.
Due to the need to build a sustainable world community, necessary steps should be
taken to reduce the negative aspects of lighting on our environment that has increased in
the last half century at an alarming rate (Fowles, 2008).
The new outdoor lighting system for the cities is trying to increase the sustainable
energy outcomes, while considering “people and structures within the environment, the
effects of glare and sparkle, suitability of light sources for colour appearance and colour
rendering, the effect of the lighting on the environment, the effect of lighting on night
time crime and the general aesthetics of the lighting equipment used” (Guide to the
lighting of urban areas [CIE], 2000).
69
3.2.1.1 Outdoor Lighting Design Issues and constraints
According to Walton and Rowan (1978) and Iowa State wide Urban Design and
Specifications [SUDAS] (2008) “Lighting design is concerned with the selection and
location of equipment so as to provide improved visibility and increase safety while
making the most efficient use of energy within minimum expenditure”.
Good lighting is a matter of having the right amount of light in the right place and
it relates to the quality of the light as much or more than quantity of the light (Fowles,
2008, P.1). US Department of Energy (2002) asserted that more light is not necessarily
better and explains that visual performance depends on light quality as well as quantity.
According to Veitch and Newshame (1998), IESA Quality of the Visual
Environment Committee (QVE) reported in 1994 that quality of lighting differs from
quantity and explained that “lighting quality is a term used to describe all of the factors
in a lighting installation not directly connected to quantity of illumination” (P.92)
Gerken et al. (2003) points to the quality of lighting as “refers to ability of the light
available to provide the contrast difference in the visual scene in such a manner that
people may recognise the cues required for the seeing tasks” (P.2).
Good Street light design, known as "effective efficient energy street lighting" needs
designers and planers to understand design issues and constrains to determine the best
approach considering safety, security, economic development and aesthetic for lighting
installation (NYSERDA, 2002) and the characteristics of the people who use or
experience the space also influence the need to achieve a good lighting quality (National
Research Council Canada [NRCC] 2006, Veitch & Newshame 1998).
70
According to NYSERDA (2002), considering the situation, Street light designing
can be done in two different ways: Retrofit/replace or new construction
Retrofit/replace: It means the locations of the poles will remain and lamps, ballasts,
luminaires or poles and in some cases all will be changed according to new design (See
Appendix C). Sometimes the lighting pole also needs to be replaced because of not
distributing the light correctly. As the poles location will not change, to achieve desired
performance, retrofitting should be carefully evaluated.
New construction: For new construction poles, bases and wiring will be removed
and a new system will be installed. New construction will impact design with greater
flexibility for location and number of poles.
Before developing recommendations for street lighting, designers should be aware
of lighting goals and characteristics of the area, project funding, utility funding, energy
and maintenance costs that can impact on street lighting design (Lighting Research
Centre [LRC], 2007).
According to Alliance for Solid State Illumination System and Technologies
[ASSIST] (2009), good lighting incorporates the need for visibility, aesthetic appeal,
and economy and energy efficiency and also to provide a sense of safety and security
attracts patrons and deter criminals while limiting light pollution. Effective outdoor
lighting requires careful consideration of a variety of issues.
71
Lighting design issues and constrains consist of five components as follows:
i. Lighting Requirements
The lighting level of illumination, distribution, uniformity and colour required in a
lighting design project (according to standards) will help designers to determine the best
efficient lighting system technology available.
Existing conditions such as types of street, traffic density and prevailing speed,
types of building, special conditions related to street characteristics and future municipal
plan for the area are determinative factors in designing (Project for Public Spaces [PPS],
n.d.).
Designers and planners should be in contact with lighting manufactures to be aware
of the latest technology and the most energy efficient types of street lighting in order to
propose the best design solutions for the cities (NYSERDA, 2002).
ii. Cost Savings
Cost limitations are known as the main objective for outdoor lighting. Narisada and
Schreduder (2004, P.13) explained that “the effectiveness of the lighting is the degree to
which function is full fit and efficiency is the degree to which benefits suppress the
cost”. The initial cost of maintenance and repairing, cost of operating and energy cost
are the factors that must be considered to prevent unnecessary cost and minimise energy
use while providing lighting requirements.
All projects should be designed to avoid excessive number of poles, wiring and
digging to minimise the costs (NYSERDA, 2002). The goal of good lighting design is
to have an optimum fixture on an optimum pole (Gazzar, n.d., P.5) and existing lighting
72
system condition should also be considered for an effective efficient street light design
(IEE, 2007).
In order to minimise the cost of lighting systems, it is suggested to use proper
fixture spacing and placement in order to use less poles and luminaires. By using lamps
with longer life and layouts with proper spacing and placement, the costs for painting,
fixing, replacing damaged poles will be reduced (“RMI’s Guide to Energy” n.d.,
NYSERDA 2002).
According to CIE (1992), long term operating costs shouldn’t be allowed to
become unacceptable just to meet an initial cost consideration.
iii. Aesthetic Requirement
Lighting should enrich people’s perceptions of the city after night. It can make the
city more attractive and enhancing the character and quality of the city (“City of Port
Philip”, 2004). Salt City Street Lighting Master Plan (2006, P.4) suggested “combining
street lighting projects with other urban design elements to create a holistic and
aesthetic environment”.
Shaflik (1997) pointed out to clutter1
The aesthetics of the poles and fixtures are visually important during day and night
in urban environments (NYSERDA 2002, “Salt City” 2006). The functional lighting
as adverse aesthetic effect of lighting by
considerable wasted light and asserted that “light design should enhance the aesthetics
of the area not to destroy it” (P.8). Lighting can become an important tool in
transforming spaces and buildings across the city based upon cultural significance and
aesthetic value.
1Light clutter is excessive brightness caused by groups of poorly placed lights. It is of most concern to drivers and pilots caused by considerable wasted lights when lights are placed too close together, or are excessively bright together, the effect tends to be distracting (www.osr.org, IDSA, 2002)
Figure 3.5: Light Pollution (Taken from Guidance Notes for the Reduction of Obtrusive Light Source: ILE (2005), UK. www.ile.org.uk
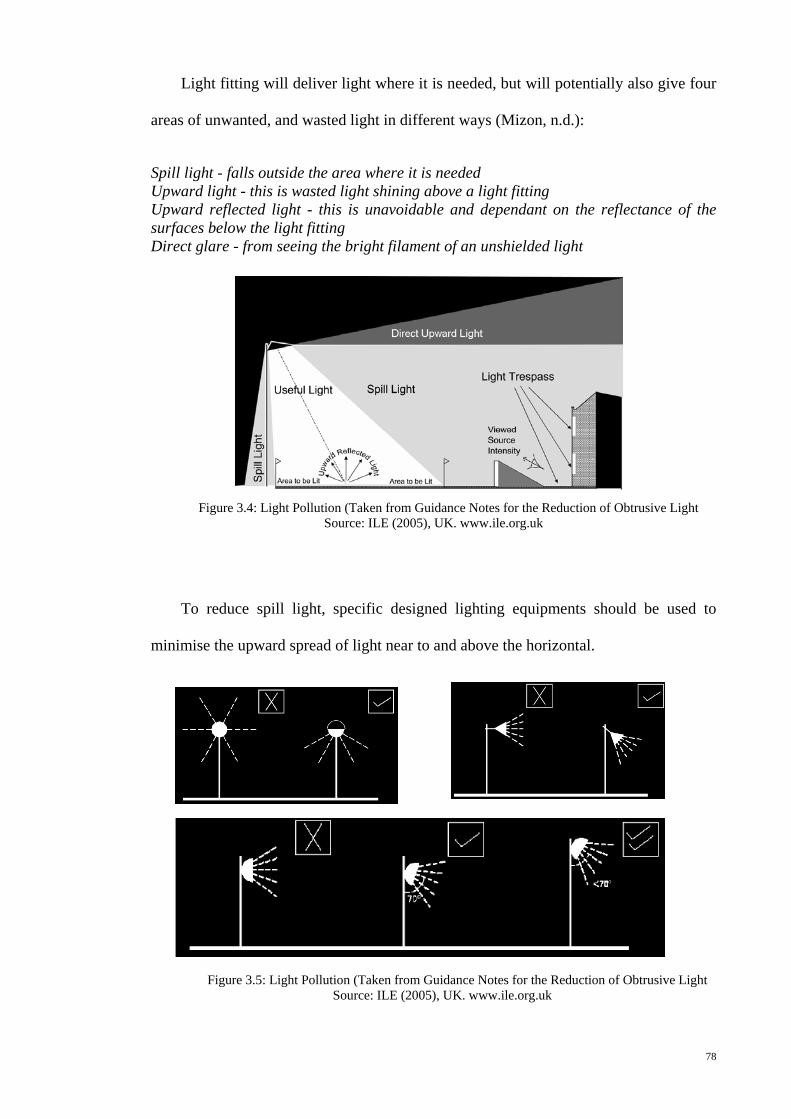
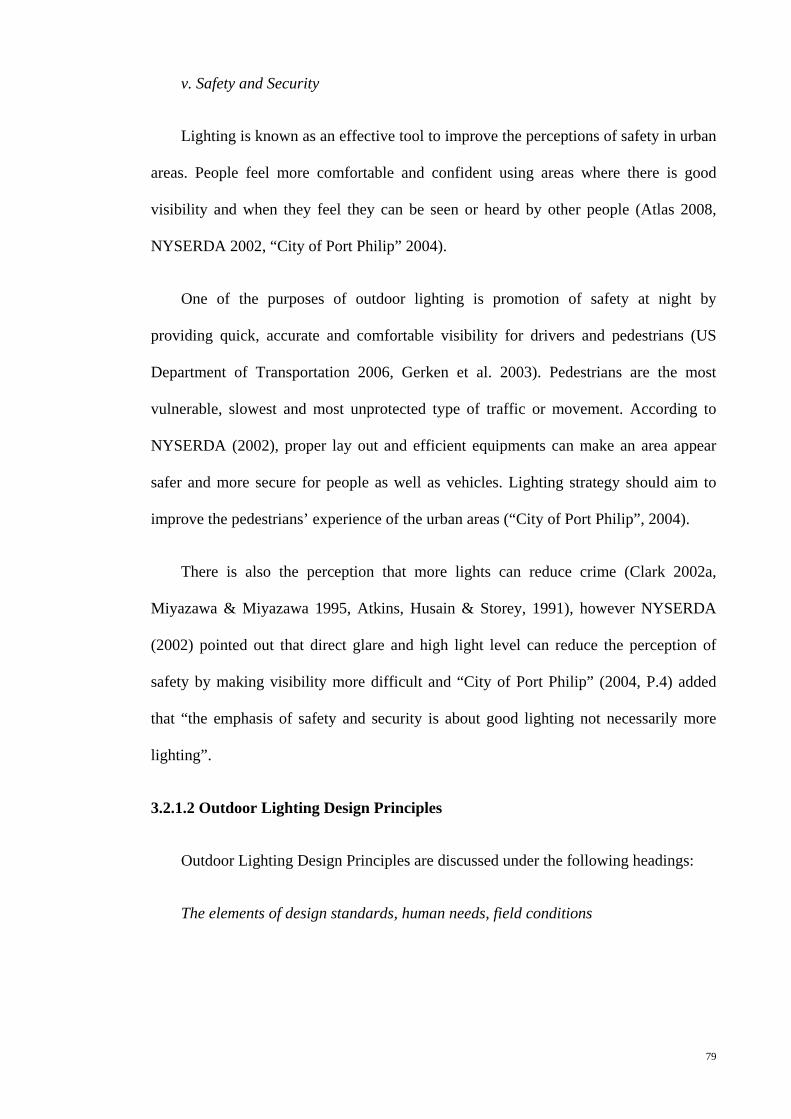
Light fitting will deliver light where it is needed, but will potentially also give four
areas of unwanted, and wasted light in different ways (Mizon, n.d.):
Spill light - falls outside the area where it is needed Upward light - this is wasted light shining above a light fitting Upward reflected light - this is unavoidable and dependant on the reflectance of the surfaces below the light fitting Direct glare - from seeing the bright filament of an unshielded light
Figure 3.4: Light Pollution (Taken from Guidance Notes for the Reduction of Obtrusive Light Source: ILE (2005), UK. www.ile.org.uk
To reduce spill light, specific designed lighting equipments should be used to
minimise the upward spread of light near to and above the horizontal.
79
v. Safety and Security
Lighting is known as an effective tool to improve the perceptions of safety in urban
areas. People feel more comfortable and confident using areas where there is good
visibility and when they feel they can be seen or heard by other people (Atlas 2008,
NYSERDA 2002, “City of Port Philip” 2004).
One of the purposes of outdoor lighting is promotion of safety at night by
providing quick, accurate and comfortable visibility for drivers and pedestrians (US
Department of Transportation 2006, Gerken et al. 2003). Pedestrians are the most
vulnerable, slowest and most unprotected type of traffic or movement. According to
NYSERDA (2002), proper lay out and efficient equipments can make an area appear
safer and more secure for people as well as vehicles. Lighting strategy should aim to
improve the pedestrians’ experience of the urban areas (“City of Port Philip”, 2004).
There is also the perception that more lights can reduce crime (Clark 2002a,
(2002) pointed out that direct glare and high light level can reduce the perception of
safety by making visibility more difficult and “City of Port Philip” (2004, P.4) added
that “the emphasis of safety and security is about good lighting not necessarily more
lighting”.
3.2.1.2 Outdoor Lighting Design Principles
Outdoor Lighting Design Principles are discussed under the following headings:
The elements of design standards, human needs, field conditions
80
i. Design Standards
According to “City of Port Philip” (2004), the lighting standards define the
minimum performance parameters and technical requirements for lighting design.
Lighting design needs to comply with the technical parameters of relevant standards.
Lighting design standards include technical knowledge in relation to urban
designing regulations and also human needs, visual aesthetic, cost, energy standards and
operating–maintenance controls.
Design standards may be examined in three steps namely, design concept,
equipments characteristics and performance criteria in terms of the urban design quality.
Zissis and Mucklejohn (2007) pointed out that developing relevant standards can
play a significant role in economising energy and contributing to sustainable
development.
ii. Human Needs
People need outdoor lighting for safety, security and aesthetic purpose. Outdoor
lighting should meet every ones’ need in terms of pleasure, safety and productivity.
According to Lang (1994, P.161), “the urban design concern is with the layout of
environments that provide safe and secure setting in which people can pursue their
lives. Cognitive needs are basic to life and the aesthetic quality of the built and natural
environment is an important mechanism in attaining a variety of ends”. He added
“good lighting reduces opportunities for miscreant to hide and enables people to scan
their environment” (Lange, 1994. P. 254)
Lighting design can give aesthetic character to a place but the aesthetic effects of
lighting in both daytime and night time is seldom given the attention it deserves.
81
Aesthetic consideration include the scale and physical appearance of the equipments
such as pole style, colour, material finishing, shape, height and luminaires’ type and size
and order of the design are determining factors in outdoor light designing.
iii. Field Conditions
The character of urban spaces which have variety of activities should be taken into
consideration in outdoor lighting design.
Commercial, residential areas, walkways, public areas, and recreation areas are
different in term of light quality, specifications and standards, performance
requirements, ease and quality of construction and cost.
3.3 The Effects of Improved Street Lighting on Crimes
There are two known approaches to prevent crimes. One approach contends that
the central focus of any crime prevention should be on individuals and their behaviours
and tries to change their propensity to commit anti social or criminal acts. The second
approach focuses on changing the structure of societies, communities and situations to
alter either the risks of criminal victimisation or environmental opportunities for
offending” (Miyazawa & Miyazawa, 1995, P.3)
Following the second approach, Clark and Mayhew (1980), Heal and Laycock
(1986) (as cited in Atkins, Husain & Storey 1991, P.1) say that “making changes to
environmental conditions and operational practices can discourage crime”.
CPTED is a term used to describe a broad range of programs involves “examining
the creation and use of space, land use and the position and architecture of buildings
including such factors as lighting, access and landscaping...” (Levinson, 2002, P.625) as
an aid to reduce crime that can lead to a reduction in fear of crime and an improvement
in the quality of life (Crowe, 2000 as cited in Cozens, Thorn & Hillier, 2008).
82
Miyazawa and Miyazawa (1995) explained that changing the situations and
altering the environmental opportunities are known as cornerstone of crime prevention
but the approach has clear limitations because of “organised bureaucratic resistance to
change and an absence of knowledge about how to organisationally implement risk
reduction programs” (P.9).
There is something magical in the widespread belief that improved outdoor lighting
at night is known as a means of preventing actual crime and reducing fear of crime
(Clark 2002a, Miyazawa & Miyazawa 1995 and Atkins et al., 1991). Explaining the
nature of crimes will answer the question why improved outdoor lighting has been
suggested as a means of reducing crime. “Crime is a covert activity and to commit a
crime, all offenders will assess the risk of being seen when making a decision about
committing a crime” (Atkins et al. 1991, P.2). If lighting encourages people to notice
suspicious activities, and act as a deterrent by increasing opportunities for surveillance,
it may affect on crime rates and fear of crime.
Cohen and Felson (1979 as cited in Painter & Tilley, 1999) argued that lighting
may affect on crime rate if it can contribute to increased street usage and presence of
more of ‘capable guardianship’ as “one of the essential conditions for a crime to be
committed that must converge in space and time” (P.1).
Painter and Farrington (1997) asserted that there is no specific theory to relate
street lighting to crime. They reported that situational prevention approaches focus on
‘opportunity reduction’ and ‘increase perceived risk’ by modification of the physical
environment, can explain the way street lighting improvements could prevent crime
(Painter & Farrington, 1997). They emphasised the role of improved street lighting to
strengthen informal social control and community cohesion through more effective
street use (Jacobs 1961, Angel 1968, Newman 1972, Bennett & Wright 1984) and
83
investment in neighbourhood conditions (Taub et al. 1984, Fowler & Mangione 1986,
Lavrakas & Kushmuk 1986, Taylor & Gottfredson 1986, Wilson & Kelling 1982)
(Painter & Farrington, 1997).
Sampson et al. (1997 as cited in Byrne & Rebovich, 2003, P.82) states that “a low
degree of ‘collective efficacy’ or informal social control in a neighbourhood causes high
crime rates”. According to Farrington and Welsh (2002, P.3) street lighting is known as
a highly visible sign of positive investment and can prevent crime only “if it physically
improves the environment and signals to residents that efforts were being made to invest
and improve their neighbourhood and it can lead to a positive image of the area,
increasing community pride, optimism and cohesion”. Improved lighting may improve
community confidence by providing a highly noticeable sign that local authorities are
investing in the area and “stimulates a general ‘feel good’ factor” (Farrington & Welsh,
2002, P.4) that may affect to reduce fear of crime. According to Warr (1990 as cited in
Miethe & Meier, 1994, P.67) “darkness is a major factor underlying of peoples’
evaluations of dangerous places”.
Farrington and Welsh (2002) explained that when the actual and perceived risks of
victimisation lessen, the area will be used by more number of community members and
it can lead to increase formal surveillance. There exists a strong evocative potential of
lighting and to significant role of lighting to arouse sensation and even feelings in
people (Rateau, 2002).
Lighting improved visibility and it can deter offenders by increasing the risks of
being recognised or interrupted while committing a crime (Mayhew et al. 1979 as cited
in Painter & Farrington, 1999). Farrington and Welsh (2002), added that better lighting
will help to show the presence of police and other authority figures more visible to
people.
84
According to Farrington and Welsh (2002), it is also feasible that improved lighting
increases opportunities for crime and explained that better lighting may bring more
number of potential victims and potential offenders to the same physical space and
better visibility may help potential offenders to make a better judgments of their
vulnerability and attractiveness and they can easily commit crimes and escape
(Farrington & Welsh, 2006). They argue that increased street usage may increase
number of unoccupied houses available for burglary. According to Pease (1999a, P.63)
“increased illumination may facilitates illegal activities like drug dealing and other
problematic forms of street life”.
Clark (2008) adopted some points from the review by Pease (1999a) and discussed
on the effectiveness of improved lighting to reducing crime at day time as follows:
“if offenders commit crime in both light and dark time, night time arrest and subsequent imprisonment would reduce both day time and night time crime...improved lighting shows that the police are determined to control the city and as a result potential offenders might no longer see the neighbourhood as affording easy pickings and citizens might be motivated to pass on information about offenders... better lighting can increase community pride and cohesive leading to a greater willingness to intervene in crime and to report it”(Clark, 2008, P.18)
History: According to Farrington and Welsh (2002), Clark (2002b) and Cozens et
al. (2005) the interest in the effects of improved street lighting to reduce crimes has
been growing since dramatic rise in a number of cities. It started from mid twentieth
century. "Berla 1995, Wheeler 1967, Wright et al. 1974, Tyrpak 1975 and Hartley 1974
reported that the initial results were encouraging and such improvements produced
substantial reductions in recorded crime" (Cozens et al., 2005, P.334).
Cozens et al. (2005) said that the review of these positive results by Tien et al.
(1979) as part of the national evaluation program of Low Enforcement Assistance
Agency (LEAA) showed that of the 103 studies, only 15 were considered sufficiently
85
rigorous for evaluation and it showed that the results were inconclusive and other
indicators of crime should be used in addition to recorded crime data. Farrington and
Welsh (2002) explained that the evaluation concludes that:
"Each project was considered to be seriously flawed because of such problems as: weak project designs, misuse or complete absence of sound analytic techniques, inadequate measures of street lighting, poor measures of crime (all were based on police records and insufficient application of the impact of lighting on different types of crime” (Farrington and Welsh, 2002, P.1).
They argued that this evaluation should have stimulated more studies using more
adequate designs and alternative measures of crime such as victim surveys, self reported
or systematic observation but it was interpreted as to show that lighting had no effects
on crime rates and effectively killed the topic in United States.
Farrington and Welsh (2002) reported that very little research was carried out in
UK until 1980 but there was a resurgence of interest between 1988 until 1990.
Cozens et al. (2005) states that lighting studies by Painter (1991) in Hammersmith
and North West of England showed reductions in crime and disorder. Atkins et al.
(1991) said that although Painter’s work provided useful and consistent information
about short term impacts of improved lighting in small particular areas but long term
effects and the benefits of re-lighting programs in wide areas are still unknown.
A review by Ramsay and Newton (1991as cited in Clark, 2002b) did reject
Painter’s results because of important shortcomings in methodology and analysis. They
suggest improved street lighting could only reduce the fear of crime. A Home Office
funded study by Atkins et al. (1991) in Wandsworth found no effect on crime but
interviews indicated that people in the relit areas did feel safer at night. Cozens et al.
(2005) reported on the studies by Herbert and Moore (1991), Davidson and Goodey
(1991), Burden and Murphy (1991) and Ditton et al. (1993) and Bainbridge and Painter
(1993) produced inconclusive findings. Methodological inadequacies were highlighted
by Cozens et al. (2005) as a reason to raise serious doubts about the validity of many of
these exploratory studies.
Moreover, Shaftoe and Osborn (1996 as cited in Clark (2002b) studied lighting
improvements in Bristol and found that lighting changes reduced fear of crime and
actual crime in high crime locations. Farrington and Welsh (2002) argued that although
they managed to extract quantitative information indicating that the changes were
effective in reducing night- time and day-time crimes but “the study was found
difficult to interpret because street lighting was gradually improved in different places
over 28 month” (P.32)
Poyner and Webb (1997 as cited in Clark, 1997) pointed out to the effectiveness of
improved lighting to prevent thefts from shoppers at retail places in Birmingham and
Coventry in England. In another project by Poyner and Webb in Dover in (1991 as cited
in Farrington & Welsh, 2002), improved lighting in parking garages in town centres led
to reduction thefts of vehicles but not from vehicles. However, in both projects, lighting
improvement was not the only interventions to prevent crimes. Farrington and Welsh
(2002) reported on two more experiments by Painter and Farrington in Dudley (1997)
and Stoke-on- Trent (1999) and in both studies, crime decreased both in day-time and in
night- time.
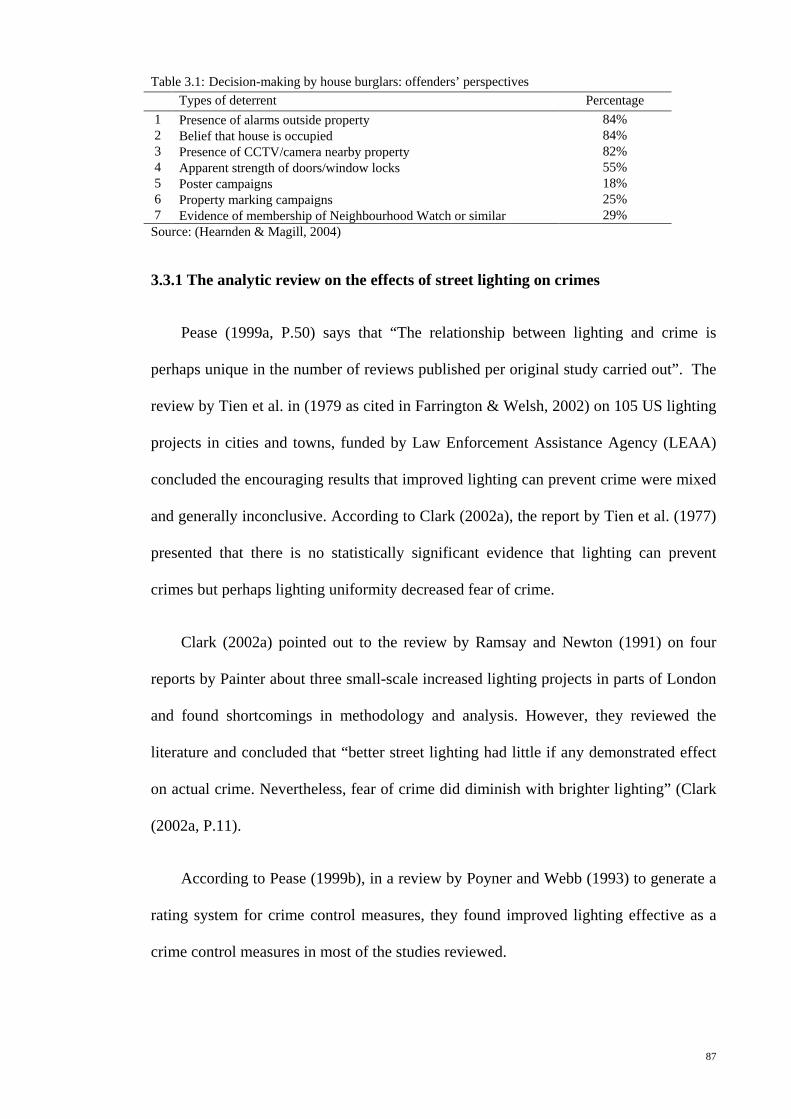
A survey by UK Home Office (Findings 249) bases on a sample of 82 offenders (Table
3.1) reported on the factors as a deterrent to crime. In this report, the presence of
lighting as a deterrent has not been mentioned anywhere but it is possible that improved
lighting helps to improved neighbourhood watch.
87
Table 3.1: Decision-making by house burglars: offenders’ perspectives Types of deterrent Percentage
1 Presence of alarms outside property 84% 2 Belief that house is occupied 84% 3 Presence of CCTV/camera nearby property 82% 4 Apparent strength of doors/window locks 55% 5 Poster campaigns 18% 6 Property marking campaigns 25% 7 Evidence of membership of Neighbourhood Watch or similar 29%
Source: (Hearnden & Magill, 2004)
3.3.1 The analytic review on the effects of street lighting on crimes
Pease (1999a, P.50) says that “The relationship between lighting and crime is
perhaps unique in the number of reviews published per original study carried out”. The
review by Tien et al. in (1979 as cited in Farrington & Welsh, 2002) on 105 US lighting
projects in cities and towns, funded by Law Enforcement Assistance Agency (LEAA)
concluded the encouraging results that improved lighting can prevent crime were mixed
and generally inconclusive. According to Clark (2002a), the report by Tien et al. (1977)
presented that there is no statistically significant evidence that lighting can prevent
crimes but perhaps lighting uniformity decreased fear of crime.
Clark (2002a) pointed out to the review by Ramsay and Newton (1991) on four
reports by Painter about three small-scale increased lighting projects in parts of London
and found shortcomings in methodology and analysis. However, they reviewed the
literature and concluded that “better street lighting had little if any demonstrated effect
on actual crime. Nevertheless, fear of crime did diminish with brighter lighting” (Clark
(2002a, P.11).
According to Pease (1999b), in a review by Poyner and Webb (1993) to generate a
rating system for crime control measures, they found improved lighting effective as a
crime control measures in most of the studies reviewed.
88
Clark (2002a) reported another review by Sherman, Gottfredson, Mackenzie, Eck,
Reuter and Bushway (1997). Eck (1997) summarised the findings and explained that the
limited research on lighting continues to use weak designs (typically without control
areas) decreased uncertainly about the effects of lighting on crime and asserted to the
problematic relationship between lighting and crime when one considers that offenders
need lighting to detect potential targets and low-risk situations (Fleming and Burrows,
1986 as cited in Eck, 1997). Lighting is effective in some places, ineffective in others
and counterproductive in still other circumstances (Clark, 2002b).
Eck revised his views in 2002 and pointed out to some studies from Britain that
removed the lingering doubt about lighting efficiency particularly in public spaces and
residential communities (Sherman, Farrington, Welsh & Mackenzie, 2002). A
systematic review by Farrington and Welsh (2002) on available studies from UK and
US found that improved street lighting led to a significant reduction in crime. This
systematic review (which excluded several poorly designed lighting evaluations) found
that improved street lighting reduced recorded crime overall by 7% in eight American
studies and by 30% in five UK studies, and reductions in recorded crime were also
demonstrated during the day. The results from all thirteen studies showed 20%
deduction in recorded crimes (See Appendix B). According to Farrington and Welsh
(2002), the criteria were:
“Improvements in street lighting were the main intervention studies; There was an outcome measure of crime; Crime levels before and after the interventions were measured; The studies included a comparable control area The total number of crimes before interventions shouldn’t be less than 20 in each area” (Farrington and Welsh, 2002,P.9).
Farrington and Welsh (2002) also reported that financial saving from reduced crimes
greatly exceeded the financial cost of improved lighting in two studies from UK in
Dudley 1997-2001 and Stoke on Trent 1999.
89
Marchant (2004) pointed out that although the Farrington and Welsh review
appears to be appropriate at first sight but on close examination, the statistical claims
and methods are unfounded. He explained that there is a conflict between the evidence
and reviewers’ interpretation in Bristol, Birmingham and Dudley projects. According to
Marchant (2006, P.52), after he examined the work considered that “it was not as
rigorous as it needed to be to make such a strong claim” and added that the strong
claims made in the review are inconsistent with the data.
Farrington and Welsh (2008) revised the systematic review and adjusted the
variances the conclusion was substantially unaffected and explained that UK studies
included in the review showed that improved lighting can be effective in reducing crime
in some circumstances but added that the optimal circumstances is not clear at present
and needs to be established by future evaluation strategies. They asserted that improved
street lighting as a feasible, inexpensive and effective method of reducing crime should
be considered in any crime reduction program in coordination with other intervention
strategies. (P.23).
However, Marchant (2006) said ‘after reviewing the revised analysis by Farrington and
Welsh (2006), he is still in doubt about the result and more exacting scientific and
statistical standards are needed in the area of crime research.’
The review by Clark (2002a, P.) showed "although it is commonly believed that
outdoor lighting helps to prevent crime at night but the evidence is equivocal". He
reviewed Dudley and Stoke-on-Trent projects as problematic studies in detail. He drew
attention to serious shortcomings and said “in both projects the results were larger than
in most other studies and much publicity has been given to the results, leading to
increased public expenditure on outdoor lighting in UK and elsewhere” (P.17).
90
Clark (2002a) also criticised the Meta analysis by Farrington and Welsh (2002) and
concluded that the result derived for a typical relighting treatment is too large.
Moreover, Clark (2003) argued that darkness inhibits crime and that crime is more
encouraged than deterred by outdoor lighting although lighting is important for mobility
safety or limiting the fear of crime. Clark (2003) pointed out to the growth of artificial
sky brightness in the cities and crime in the twentieth century and said crime rates and
apprehensive sky growth curves are positively correlated in Australia, Canada, New
Zealand and USA. He draws attention to negative effects of lighting on health, safety,
quality of life and ecology and said “lighting seems to be regarded as an indicator of
progress but governments typically neglect to monitor its growth, let alone control its
excesses and adverse effects” (P.130).
The recent reviews by Farrington and Welsh (2002, 2008), Clark (2002a, 2002b)
and Marchant (2004, 2006, 2009) are more likely to indicate that the effects of
improved lighting on crime is still in doubt. The Meta analysis review by Farrington and
Welsh (2002) has been criticised by Clark (2002a, 2002b) and Marchant (2004, 2006)
because of some shortcomings in methodology. However, the review could lead to
design more explicit studies to test the main theories of the effects of improved street
lighting (community pride versus surveillance/deterrence) and to investigate the effects
of improved lighting on different types of crime according to characteristics of areas.
Moreover, Farrington and Welsh (2002) points to some other shortcomings in their
systematic review. They explained that the systematic review was based on available
relevant studies and they asserted that not all studies meet the criteria ideally and most
of the studies suffered from lack of detail about how the reviewer conducted the
research. They added that the effects of improved lighting on crime may vary according
to characteristics of the area, residents and design of the area and it also depends on the
91
existing design of the lighting, initial crime rate and length of the study (before and
after lighting intervention). They also pointed out to American studies that are now
rather dated comparing to the results from British studies that are mostly conducted in
the 1990s.
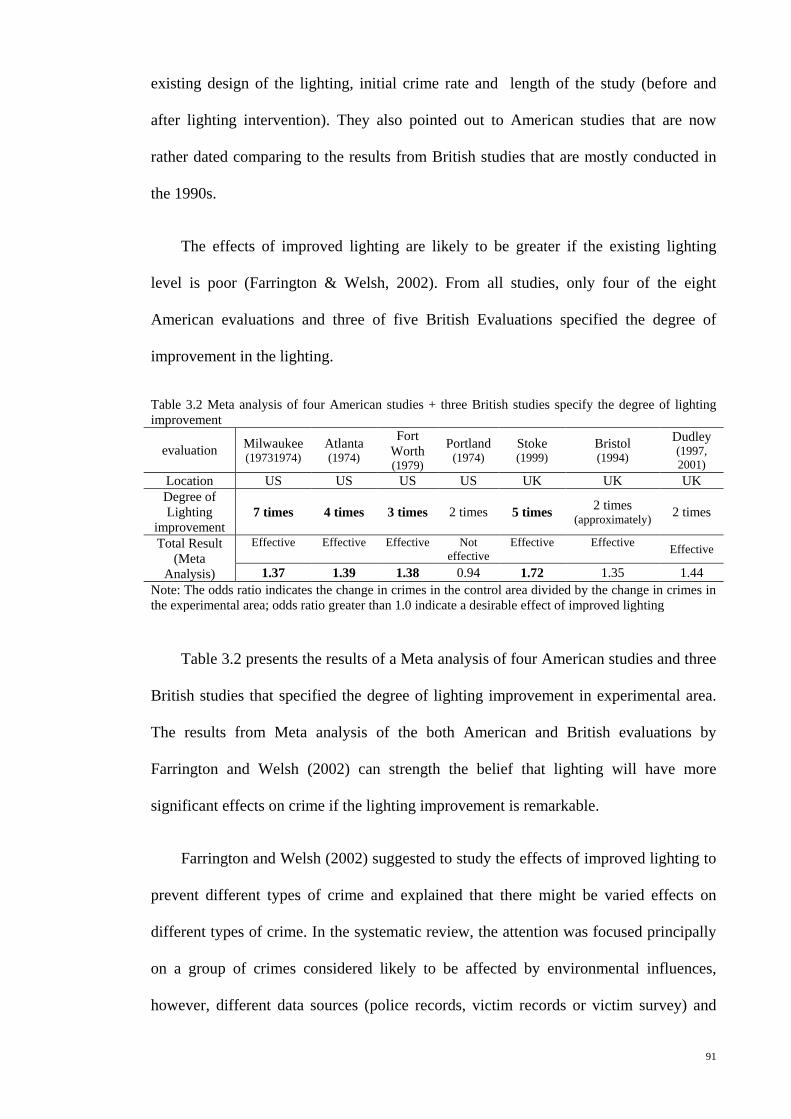
The effects of improved lighting are likely to be greater if the existing lighting
level is poor (Farrington & Welsh, 2002). From all studies, only four of the eight
American evaluations and three of five British Evaluations specified the degree of
improvement in the lighting.
Table 3.2 Meta analysis of four American studies + three British studies specify the degree of lighting improvement
evaluation Milwaukee (19731974)
Atlanta (1974)
Fort Worth (1979)
Portland (1974)
Stoke (1999)
Bristol (1994)
Dudley (1997, 2001)
Location US US US US UK UK UK Degree of Lighting
improvement 7 times 4 times 3 times 2 times 5 times 2 times
(approximately) 2 times
Total Result (Meta
Analysis)
Effective
Effective
Effective
Not effective
Effective
Effective Effective
1.37 1.39 1.38 0.94 1.72 1.35 1.44 Note: The odds ratio indicates the change in crimes in the control area divided by the change in crimes in the experimental area; odds ratio greater than 1.0 indicate a desirable effect of improved lighting
Table 3.2 presents the results of a Meta analysis of four American studies and three
British studies that specified the degree of lighting improvement in experimental area.
The results from Meta analysis of the both American and British evaluations by
Farrington and Welsh (2002) can strength the belief that lighting will have more
significant effects on crime if the lighting improvement is remarkable.
Farrington and Welsh (2002) suggested to study the effects of improved lighting to
prevent different types of crime and explained that there might be varied effects on
different types of crime. In the systematic review, the attention was focused principally
on a group of crimes considered likely to be affected by environmental influences,
however, different data sources (police records, victim records or victim survey) and
92
lack of information on some types of crime such as vandalism and assault that people
don’t tend to report to police can bias the results.
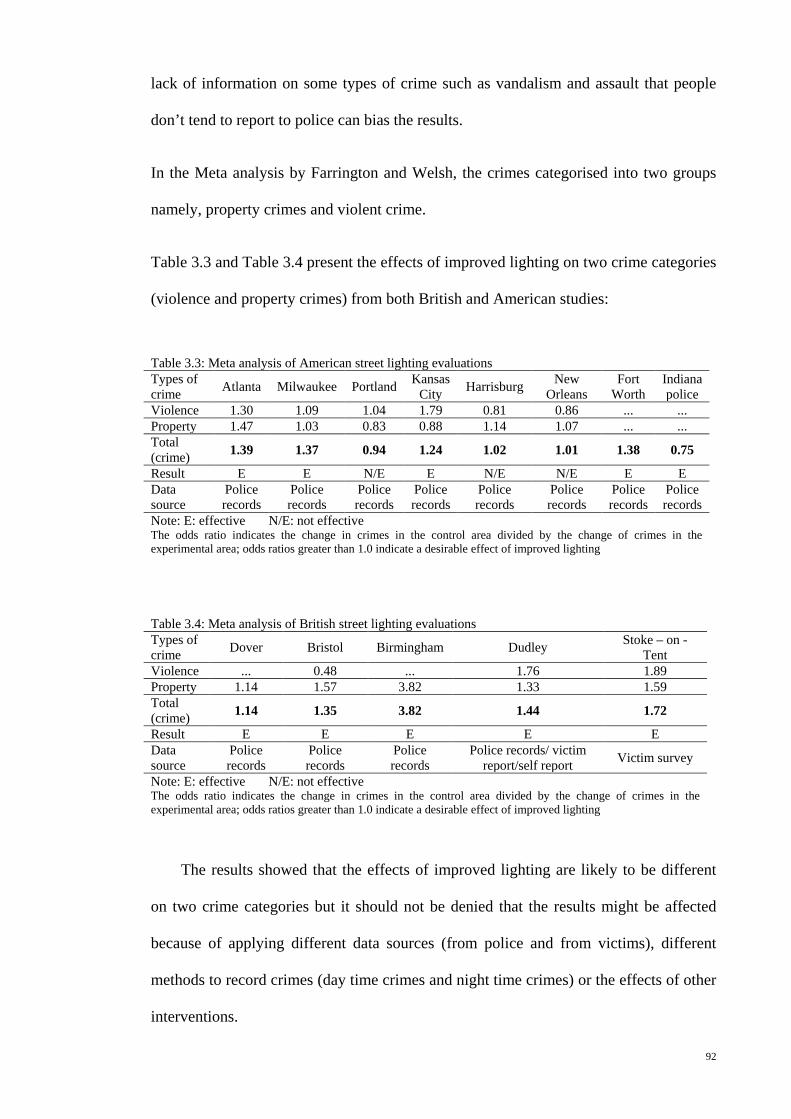
In the Meta analysis by Farrington and Welsh, the crimes categorised into two groups
namely, property crimes and violent crime.
Table 3.3 and Table 3.4 present the effects of improved lighting on two crime categories
(violence and property crimes) from both British and American studies:
Table 3.3: Meta analysis of American street lighting evaluations Types of crime Atlanta Milwaukee Portland Kansas
Note: E: effective N/E: not effective The odds ratio indicates the change in crimes in the control area divided by the change of crimes in the experimental area; odds ratios greater than 1.0 indicate a desirable effect of improved lighting
Table 3.4: Meta analysis of British street lighting evaluations Types of crime Dover Bristol Birmingham Dudley Stoke – on -
Note: E: effective N/E: not effective The odds ratio indicates the change in crimes in the control area divided by the change of crimes in the experimental area; odds ratios greater than 1.0 indicate a desirable effect of improved lighting
The results showed that the effects of improved lighting are likely to be different
on two crime categories but it should not be denied that the results might be affected
because of applying different data sources (from police and from victims), different
methods to record crimes (day time crimes and night time crimes) or the effects of other
interventions.
93
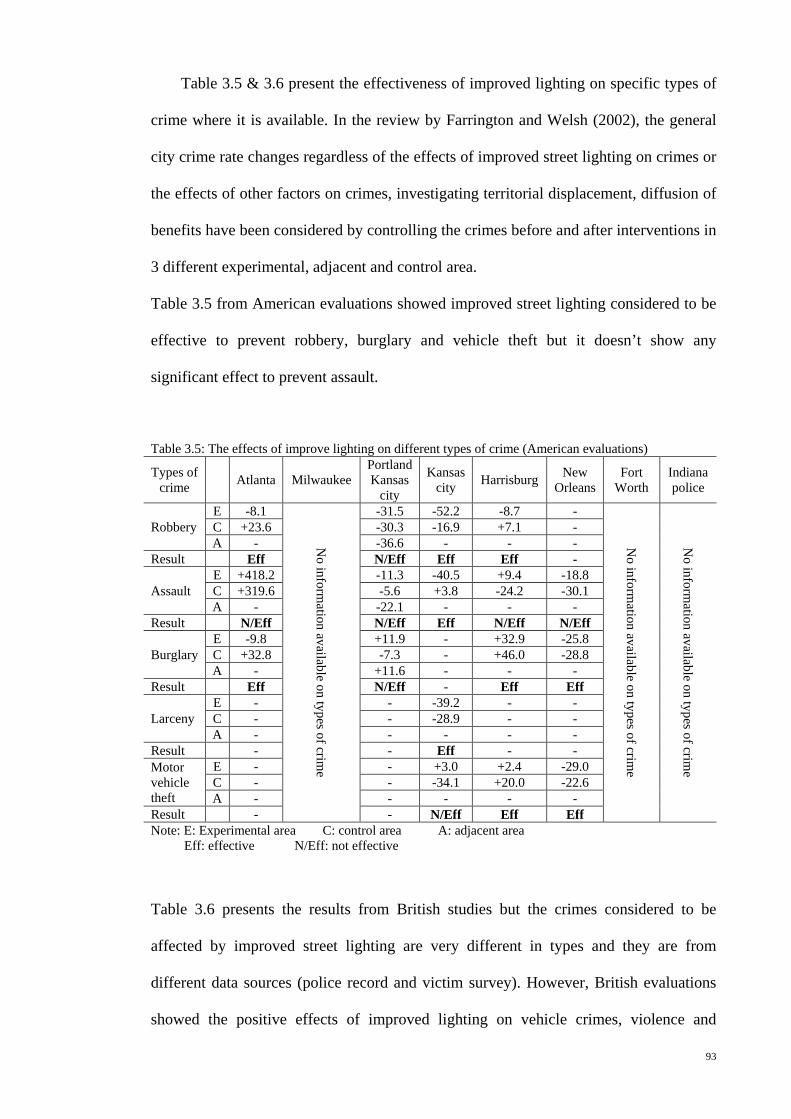
Table 3.5 & 3.6 present the effectiveness of improved lighting on specific types of
crime where it is available. In the review by Farrington and Welsh (2002), the general
city crime rate changes regardless of the effects of improved street lighting on crimes or
the effects of other factors on crimes, investigating territorial displacement, diffusion of
benefits have been considered by controlling the crimes before and after interventions in
3 different experimental, adjacent and control area.
Table 3.5 from American evaluations showed improved street lighting considered to be
effective to prevent robbery, burglary and vehicle theft but it doesn’t show any
significant effect to prevent assault.
Table 3.5: The effects of improve lighting on different types of crime (American evaluations)
Types of crime Atlanta Milwaukee
Portland Kansas
city
Kansas city Harrisburg New
Orleans Fort
Worth Indiana police
Robbery E -8.1
No inform
ation available on types of crime
-31.5 -52.2 -8.7 -
No inform
ation available on types of crime
No inform
ation available on types of crime
C +23.6 -30.3 -16.9 +7.1 - A - -36.6 - - -
Result Eff N/Eff Eff Eff -
Assault E +418.2 -11.3 -40.5 +9.4 -18.8 C +319.6 -5.6 +3.8 -24.2 -30.1 A - -22.1 - - -
Result N/Eff N/Eff Eff N/Eff N/Eff
Burglary E -9.8 +11.9 - +32.9 -25.8 C +32.8 -7.3 - +46.0 -28.8 A - +11.6 - - -
Result Eff N/Eff - Eff Eff
Larceny E - - -39.2 - - C - - -28.9 - - A - - - - -
Result - - Eff - - Motor vehicle theft
E - - +3.0 +2.4 -29.0 C - - -34.1 +20.0 -22.6 A - - - - -
Result - - N/Eff Eff Eff Note: E: Experimental area C: control area A: adjacent area Eff: effective N/Eff: not effective
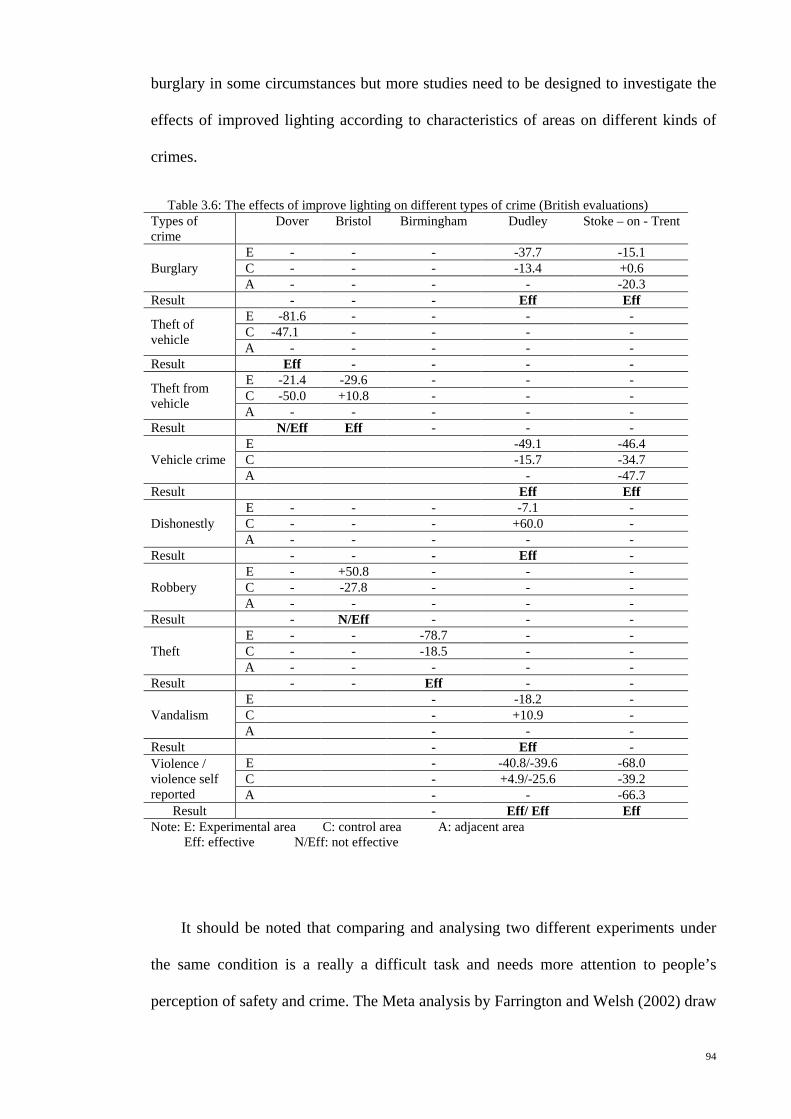
Table 3.6 presents the results from British studies but the crimes considered to be
affected by improved street lighting are very different in types and they are from
different data sources (police record and victim survey). However, British evaluations
showed the positive effects of improved lighting on vehicle crimes, violence and
94
burglary in some circumstances but more studies need to be designed to investigate the
effects of improved lighting according to characteristics of areas on different kinds of
crimes.
Table 3.6: The effects of improve lighting on different types of crime (British evaluations) Types of crime
Dover Bristol Birmingham Dudley Stoke – on - Trent
Burglary E - - - -37.7 -15.1 C - - - -13.4 +0.6 A - - - - -20.3
Result - - - Eff Eff
Theft of vehicle
E -81.6 - - - - C -47.1 - - - - A - - - - -
Result Eff - - - -
Theft from vehicle
E -21.4 -29.6 - - - C -50.0 +10.8 - - - A - - - - -
Result N/Eff Eff - - -
Vehicle crime E -49.1 -46.4 C -15.7 -34.7 A - -47.7
Result Eff Eff
Dishonestly E - - - -7.1 - C - - - +60.0 - A - - - - -
Result - - - Eff -
Robbery E - +50.8 - - - C - -27.8 - - - A - - - - -
Result - N/Eff - - -
Theft E - - -78.7 - - C - - -18.5 - - A - - - - -
Result - - Eff - -
Vandalism E - -18.2 - C - +10.9 - A - - -
Result - Eff - Violence / violence self reported
E - -40.8/-39.6 -68.0 C - +4.9/-25.6 -39.2 A - - -66.3
Result - Eff/ Eff Eff Note: E: Experimental area C: control area A: adjacent area Eff: effective N/Eff: not effective
It should be noted that comparing and analysing two different experiments under
the same condition is a really a difficult task and needs more attention to people’s
perception of safety and crime. The Meta analysis by Farrington and Welsh (2002) draw
95
attention to necessity of more studies on the effects of improved lighting on specific
types of crime considering the characteristics of the area since the reaction of criminals
and residents to any environmental changes may be vary between communities.
3.3.2 The effects of improved lighting on Fear of Crime
According to Ferraro (1995), fear of crime is defined as “an emotional response of
dread or anxiety to crime or symbols that a person associates with crime” (P.4) and
explain that to produce a fear reaction in humans, a recognition of a situation as
possessing at least potential danger, real or imagined is necessary. O’ Gorman (2009)
asserted that the definition “incorporates not only an individual’s concerns about crime
and the consequences of criminal activity but also their perceptions of risk and the role
of environment in eliciting fear.” (P.iv)
According to Tanner and Tiesdell (1997) crime and fear of crime are two separate
issues that was realised and became important from early 1980s. Hough and Mayhew
(1983 as cited in Tanner & Tiesdell ,1997) pointed out that “ while crime rates were
rising , peoples’ fear of crime were rising at a much faster rate” (P.122). Fear of crime is
known as one of the social problems (Garland, 2001) that can affect peoples’ quality of
life. Lewis and Salem (1988) say that fear of crime generates behaviours that is
destructive to community. Schneider and Kitchen (2002) pointed out to crime and fear
of crime as key factors directing the choices that citizens make and discussed that these
choices affect quality of life.
Brogden and Nijhar (2000) say that people with fear of crime will lose access to
chances in betterment of life and they are denied enjoyment of desirable life styles.
Kifer (2004) explained that fear of crime may lead people to change their normal
routines, avoid from certain areas and people. They may withdraw from the streets and
explained that consequently people may ignore to maintain social control that helps to
96
prevent crimes and disorder. Moore and Trojanowicz (1988) said that fear of crime
produces social consequences and causes people feel uncomfortable and fear motivates
people to invest time and money in defensive measures to reduce their vulnerability.
Ferraro (1995, P.3) asserted that fear of crime may increase “social integration,
migration, restriction of activities, added security costs and avoidance behaviour”. Lee
(2007) explained that fear of crime has been identified as being responsible for an even
increasing number of social maladies.
Feeling safe is a deterrent to victimisation and most criminals are cowards and
prefer to attack weaker persons and particularly those who are afraid (Narisada &
Scheruder, 2004). Fear of crime sometimes affects people more than the actual crime
itself. Lee (2007) reported that many researchers and policy makers believe that fear of
crime is as serious a problem as crime itself and some believe that fear of crime is a
more severe problem than crime (Warr 2000, Clements & Kleiman1976 as cited in
Ferraro, 1995).
According to research by University College London (2007), people with strong
fear of crime are almost twice as likely to show symptoms of depression. Fear of crime
is associated with decreased physical functioning and lower quality of life. Research by
the Centre for Regional Economic and Social Research, Sheffield Hallam University
(2005), revealed that there is a strong positive relationship between increasing fear of
crime and self reported poor health.
It is also believed that fear is natural and can prevent many people from becoming
victims of crime. O’ Gorman (2009) pointed out to both positive and negative effects of
fear of crime among residents and explained that fear of crime can cause people to
engage “ in a range of protective strategies, insurance, communication, participation,
information seeking and avoidance behaviours which can impact both positively and
97
negatively on quality of life” (P.30). Moore and Trojanowicz (1988) explained that
although “fear of crime can prompt cautions among residents and reduce criminal
opportunities and it also can motivate citizens to shoulder some of the burdens of crime
control by buying locks and dogs”, but unreasonable fear becomes a social problem.
There are two models2
Based on the above two models researches showed that fear of crime is not always
linked to real presence of crime in an area. According to John Howard society of
Alberta (1999) age, gender, past experiences with crime geography and ethnicity and
culture determine the level of fear. There are also other variables such as low income
level and low education level to increase fear of crime. O’ Gorman (2009) added that
geographical location and socio- economic status also linked to fear of crime.
According to Ferraro (1995) and O’ Connell (1999, 2002 as cited in O’ Gorman, 2009),
media can play a significant role in shaping perceived risk and fear of crime.
Schweitzer, Kim and Mackin R. (1999) pointed out to the physical characteristics of the
built environment that might be related to fear of crime and crime effecting the social
interactions.
to explain the causes and consequences of fear of crime and
to design programs for fear reduction introduced by Miyazawa and Miyazawa (1995);
first model tries to find the causes of fear through actual incidents of crime and second
model is based on the relation between fear of crime and social and physical incivilities.
Miyazawa and Miyazawa (1995) introduced the factors known to generate fear of
crime. They explained that personal experiences of victimization, indirect victimization
(knowing about the victimization of others, media coverage of crime , vulnerability to
2 "First is ‘victimization/opportunity reduction’ model that examines the relation between fear of crime and actual incidents of victimization; this model denies the direct linkage between perception and realities and assumes that the realities of victimization have a basic impact on fear of crime. They explained that this impact amplified through informal community networks and subsequently raise fear of crime among residents. This model emphasized on opportunity reduction programs to lower risk of victimization since the actual incidents of crime are basic generator of fear among residents. Second, ‘disorder/social’ control model assumes that residents' perception of disorder can generate fear of crime. Social incivilities (such as noisy teenagers, drunks and addicts on the streets) and physical incivilities (graffiti, litter, vacant houses with broken windows) interpreted by residents as signs of community disorganization that leads to higher level of fear... " (Miyazawa & Miyazawa,1995,P.155)
98
crime (women and aged are more vulnerable to crime), community environments (social
and physical deterioration of community produces the residents concern for the
community and this concern increases fear of crime) and public attitude to criminal
justice systems (if people in a community have confidence in the ability of the criminal
justice systems to cope with crime, they will be less fearful of crime).
Wesley Skogan (as cited in Moore & Trojanowicz, 1988, P.3) divided the
contributing causes of fear into five broad categories:
He explained that "the strongest effects on fear arising from physical deterioration,
social disorder and group conflict" and added that “it is hard to detect the effects of the
built environment on fear once one has subtracted the effects of other variables” (P.3),
however, Rohe and Burby (1988) reported on the importance of the image of the
housing in a study of fear of crime in public housing and some studies in UK revealed
that the lowest income and deprived regions have the highest level of fear in
neighbourhoods (Rohe & Burby, 1988) and Smith and Hill (1991) points that the fear of
crime is within characteristics of the neighbourhoods itself not individuals groups.
Some research also suggested that people think that other neighbourhoods are more
dangerous and crime is usually committed by outsiders. Brantingham et al. (1977) and
Merry (1981a) stressed the fear of strangers and unknown in urban neighbourhoods and
points to the impact and importance of increased population density on social ties that
i. " Actual criminal victimisation
ii. Second hand information about criminal victimisation
distributed through social networks
iii. Physical deterioration and social disorder
iv. Characteristics of the built environment
v. Group conflict"
99
lead to isolation and antisocial behaviour. Although these conditions are not necessary
crime but rather incivilities that relate to issues in an environment (Grohe, 2006).
Moore and Trojanowicz (1988) point to the findings by Charles Murray (1983) and
reported that there is little evidence of separate effect of the built environment on fear
and explain that the only exception is evidences indicating that improved lighting can
significantly reduce fear of crime.
Lighting is known to have a key role to prevent crime and reduce fear of crime
(The Institution of Lighting Engineering, 2005) by making the streets and open areas
more visible (Narisada & Scheruder 2004, Fennelly 2004).
Clark (2002b) explains that people tend to fear more in dark or dimly lit places and
said that it is universally reported that fear of crime is greater at night than it is by day
regardless of what the risks of actual crime are. Coumarelos (2001) points to the effects
of situational and contextual factors on fear of crime and reported that people are more
likely to feel unsafe at night than during the day. According to Tanner and Tiesdell
(1997) people are more fearful after dark and reducing the impact of darkness help
people to become less afraid to venture out. He explained that when the lighting levels
are diminished, people naturally become more fearful.
Although different factors are known to have impact on fear of crime but lack of
light and good visibility may justify why people having a higher level of fear at night.
According to Atlas (2008), although darkness or lack of light is sometimes CPTED
strategy but lighting helps people feel safer.
Lighting must signal to potential offenders that they are more likely to be seen and
identified the victim, observer or the police (Fisher & Nasar, 1992). Based on an
experiment in a college campus to find the relation between site features and fear of
100
crime found that fear of crime was the highest in places which offered places for
criminals to hide and had a restricted view. Lighting may reduce fear by diminishing the
number of places where criminals can hide and by increasing the distance over which
people can see (Boyce, 2003).
Ferraro (1995, P.25) explained that “fear involves an emotional and sometimes
psychological reaction to perceived danger, there exist an inherent difficulty in
measuring fear from questionnaire or interview data collection methods ….. Even the
best survey measures of fear of crime are not pure reflections of emotional experiences;
rather they are expressions of imagined fear”.
Hale (1996) identified four issues central to fear of crime studies:
"First, criminological research focuses on ordinary or street crime, rather than corporate or white-collar crime. Second, researchers have been conceptualized fear as something that is merely present or absent in people. According to Fattah and Sacco (1989), this limits a detailed discussion of the ephemeral, transitional, and situational nature of fear. Third, over reliance on quantitative methods causes fear to be treated as a static and simple process. Fourth, most recent research considers fear of crime to be a social problem, which can damage social and psychological stability."
The possible effect of improved street lighting on fear of crime has been examined
in line with the studies on the effect of improved street lighting on crime. The results are
mostly based on the interviews before and after interventions.
Research by Hack (1974), Vrij and Winkel (1991), Tien et al. (1976), Fleming and
Burrows (1986), Atkins et al. (1991), Ramsay and Newton (1991), Ken Pease (1991),
Painter (1994) (as cited in Farrington & Welsh, 2002) report on reducing fear of crime
after improvements in street lighting.
101
3.4 Lighting and vandalism Prevention: Theories
Relevant theories on the effects of lighting to prevent vandalism: The effect of
improved lighting to prevent vandalism is based on several studies aimed to save energy
and control vandalism conducted in some school campuses.
According to Purvis (2008), there are two basic thoughts regarding lighting a
school campus: ‘Lighting vs. no lighting’ during the evening, after dark and early
morning hours. He explained that each strategy has its particular advantages and
disadvantages. Purvis (2008) states that people have tendency to avoid and fear areas
where is absolute darkness and it might prevent people to enter the unknown. He
asserted that total darkness tends to reduce vandalism and graffiti because the offenders
cannot see what they are doing or creating. Moreover, the risk of being noticed by
others is high if the invader turns on the school lights or uses even a hand held light.
Clark (2003) reported that California Extension Service (n.d.), King (1995) and
Wilson (1995) also said that darkness could reduce vandalism because vandals like or
need to see the damages they cause.
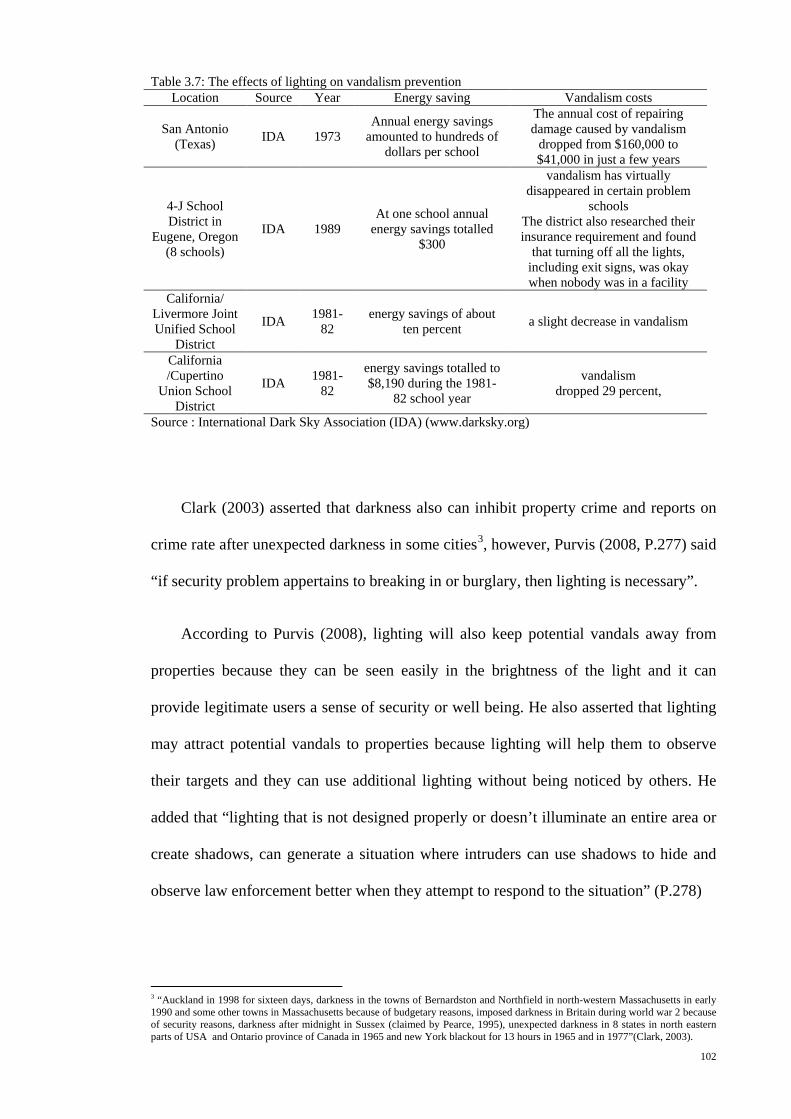
Frumkin (2006) points to the importance of security lighting to prevent vandalism
though he reports that the Marion County, Florida public schools implemented dark
campus approach (2000) and it could help the “district to save 46,000$ per year on
energy expenses and reduce the cost of vandalism by more than 50%” (P.26); some
other evidences are presented in Table 3.7 by International Dark-Sky Association (IDA)
reports on successful ‘dark campus’ approach.
102
Table 3.7: The effects of lighting on vandalism prevention Location Source Year Energy saving Vandalism costs
San Antonio (Texas) IDA 1973
Annual energy savings amounted to hundreds of
dollars per school
The annual cost of repairing damage caused by vandalism
dropped from $160,000 to $41,000 in just a few years
4-J School District in
Eugene, Oregon (8 schools)
IDA 1989 At one school annual
energy savings totalled $300
vandalism has virtually disappeared in certain problem
schools The district also researched their insurance requirement and found
that turning off all the lights, including exit signs, was okay when nobody was in a facility
California/ Livermore Joint Unified School
District
IDA 1981-82
energy savings of about ten percent a slight decrease in vandalism
California /Cupertino
Union School District
IDA 1981-82
energy savings totalled to $8,190 during the 1981-
82 school year
vandalism dropped 29 percent,
Source : International Dark Sky Association (IDA) (www.darksky.org)
Clark (2003) asserted that darkness also can inhibit property crime and reports on
crime rate after unexpected darkness in some cities3
According to Purvis (2008), lighting will also keep potential vandals away from
properties because they can be seen easily in the brightness of the light and it can
provide legitimate users a sense of security or well being. He also asserted that lighting
may attract potential vandals to properties because lighting will help them to observe
their targets and they can use additional lighting without being noticed by others. He
added that “lighting that is not designed properly or doesn’t illuminate an entire area or
create shadows, can generate a situation where intruders can use shadows to hide and
observe law enforcement better when they attempt to respond to the situation” (P.278)
, however, Purvis (2008, P.277) said
“if security problem appertains to breaking in or burglary, then lighting is necessary”.
3 “Auckland in 1998 for sixteen days, darkness in the towns of Bernardston and Northfield in north-western Massachusetts in early 1990 and some other towns in Massachusetts because of budgetary reasons, imposed darkness in Britain during world war 2 because of security reasons, darkness after midnight in Sussex (claimed by Pearce, 1995), unexpected darkness in 8 states in north eastern parts of USA and Ontario province of Canada in 1965 and new York blackout for 13 hours in 1965 and in 1977”(Clark, 2003).
103
Weisel (2004) pointed out to the effects of installing, upgrading and maintaining
lighting to detect vandals but asserted that additional lighting may attract graffiti in
isolated and remote locations.
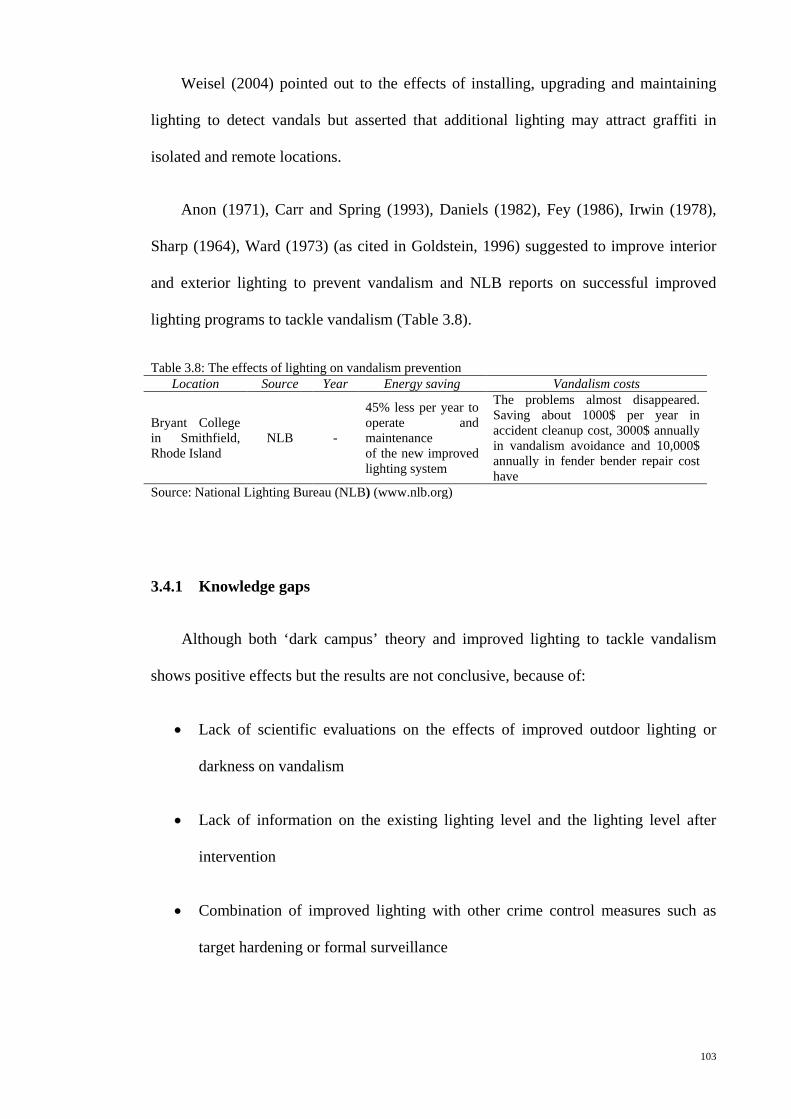
Anon (1971), Carr and Spring (1993), Daniels (1982), Fey (1986), Irwin (1978),
Sharp (1964), Ward (1973) (as cited in Goldstein, 1996) suggested to improve interior
and exterior lighting to prevent vandalism and NLB reports on successful improved
lighting programs to tackle vandalism (Table 3.8).
Table 3.8: The effects of lighting on vandalism prevention Location Source Year Energy saving Vandalism costs
Bryant College in Smithfield, Rhode Island
NLB -
45% less per year to operate and maintenance of the new improved lighting system
The problems almost disappeared. Saving about 1000$ per year in accident cleanup cost, 3000$ annually in vandalism avoidance and 10,000$ annually in fender bender repair cost have
Source: National Lighting Bureau (NLB) (www.nlb.org)
3.4.1 Knowledge gaps
Although both ‘dark campus’ theory and improved lighting to tackle vandalism
shows positive effects but the results are not conclusive, because of:
• Lack of scientific evaluations on the effects of improved outdoor lighting or
darkness on vandalism
• Lack of information on the existing lighting level and the lighting level after
intervention
• Combination of improved lighting with other crime control measures such as
target hardening or formal surveillance
104
Both theories should be studied in urban environment considering the effects of
either low or high level of lighting on people’s perception of safety as well as
prevention of other types of crime that might be different with school campus
experiments. Moreover, the possibility of darkening the urban areas or excessive use of
light in the cities to prevent vandalism and graffiti (considering the economical,
environmental and social effects of lighting on societies) and the effects of lighting
interventions on different age groups and communities with different social and cultural
values should come into consideration.
3.5 Tehran: Environmental characteristics
This part points to some aspects of the physical and environmental characteristics of
Tehran urban areas. It is to investigate if there is any correlation between urban
environmental variables and occurrence of vandalism and graffiti. The focus of this part
will be on four environmental variables that can provide opportunities or limitations on
vandalism and graffiti occurrences and discuss how these physical features effects on
implementation of environmental strategies to combat graffiti and vandalism in urban
areas of Tehran as well as the residents’ life style and quality of life.
3.5.1 Tehran: General Perspective
Tehran's urban area between Alborz Mountains in the north and Dashte-e Kavir in
south is located on a vast mountain slope. Tehran's urban area spans 250 kilometres
from east to west and 50 kilometres from north to south. The city is limited by the
mountains and consequently, the city has grown towards west and south (Schuppe,
2007). According to Tehran Geographical Information centre [TGIC] (2004), "the city
spans over a land area of 18,814 km2 of Tehran province". Tehran had a population of
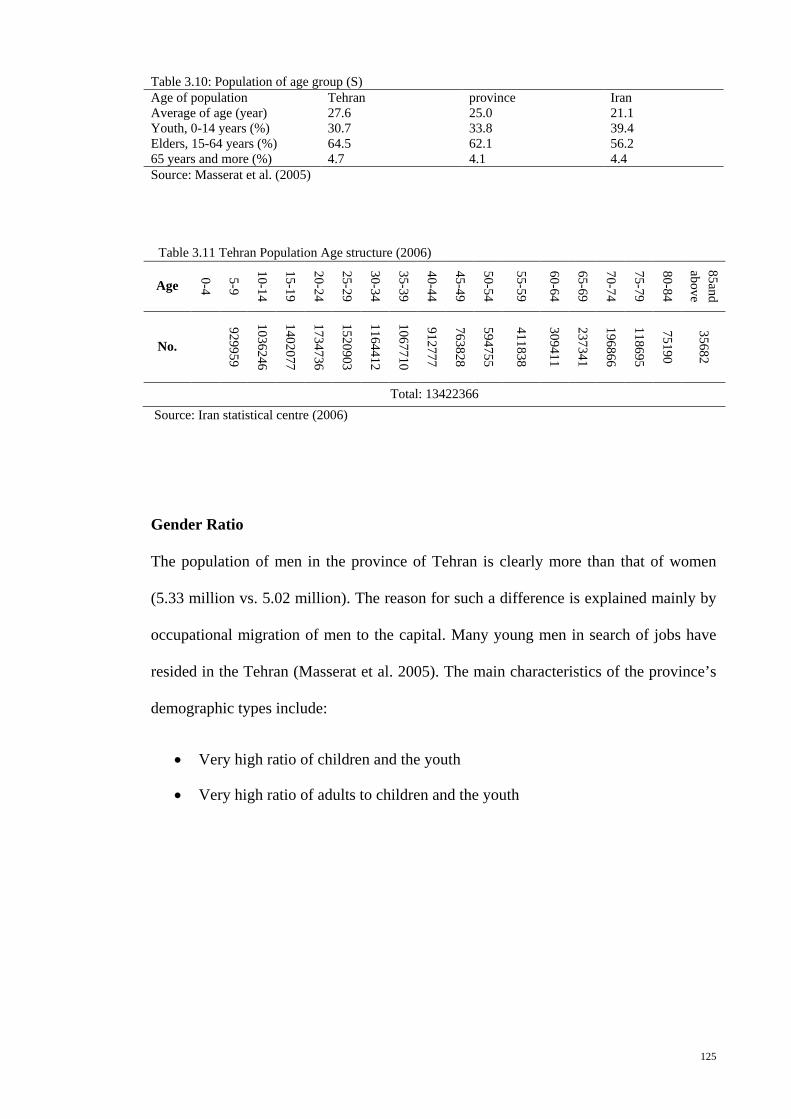
12 million in 2004 and this is the highest concentration of population in Iran and Middle
East but it is not disproportionate with respect to the total population of Iran (15.6%)
(Masserat et al., 2005). The population of Tehran is more than the sum of three other
major cities of Iran namely Isfahan, Mashad and Tanbriz. This imbalance between
Tehran and other large cities of Iran is the result of high political, administrative and
economic centralisation. This had made Tehran more developed than other regions in
Iran (Masserat et al., 2005).
The city of Tehran ranks among the prominent cities of the world that has a
comparatively short, but very fascinating history of turning from a small village into a
metropolitan area populated by millions of people. The city of Tehran is divided to 22
districts and 112 sub districts (Nahiyeh). Tehran is a metropolis because it functions as a
political and economic capital. It is not however, an international city with political and
cultural activities benefiting a country like Iran. As with other metropolises, Tehran is
facing more diverse and complex issues than smaller cities. There are problems from
concentration and mobility of the population that have transformed the social relations
as well as the infrastructure and spatial features of the Tehran metropolis (Masserat et
al., 2005). These issues root in improper and fast development of the city without
concerted and unified planning3F
4 taken over the previous years. Moreover, the newly
approved urban planning bylaws that are executed without much consideration are
known to cause problems in designing the city.
4 "Tehran's comprehensive plan with an agenda to expand a metropolis was propounded in early 1960s. This plan was provided by A. Farmanfarmaiyan and V. Gruen in 1966 and entered the implication phase in 1968. According to this plan, Tehran metropolis would have had the capacity to house 5,500,000 residents within an area of 180km2 by 1991. This plan was in favour of motor cars and the priority was to create a highway network for a sprawled city with a low population density. Primary objective of the plan was to relieve problems in the city, which had no zoning regulations to control land use or density. This plan would have decentralised the city by creating 10 new regional centres, each serving 500,000 people. Separated by landscaped open spaces, each community centre would have had its own commercial, employment and industrial complexes. The plan that was adopted later created 22 different city sections .Although this plan was only partially implemented and the city extended southward rather than westward, it is still continues to be a reference for planning and management even today. In the years following the Islamic revolution and then during imposed war of Iraq on Iran, opportunity to review the comprehensive plan was lost. In 1991 in order to find solutions for the new problems of a metropolis, the Iranian company of ATEC reviewed the plan. This review concluded the city only within its boarders and ignored the new suburbs around it but Tehran's municipality did not approve it. In this plan, there were no considerations for disaster management. The ministry of Housing and Urban Development provided technical assistance to the municipality to prepare a set of recommendations and directives that was to serve as the 25-year plan of Tehran. For the first time in 2001, the plan of Tehran metropolis concerning the city and urbanised lands around it was drafted. This plan brought about the idea of creating major and expensive infrastructure to be funded by the government of the province of Tehran" (Masserat et al. 2005, “Tehran, Iran" 2005).
106
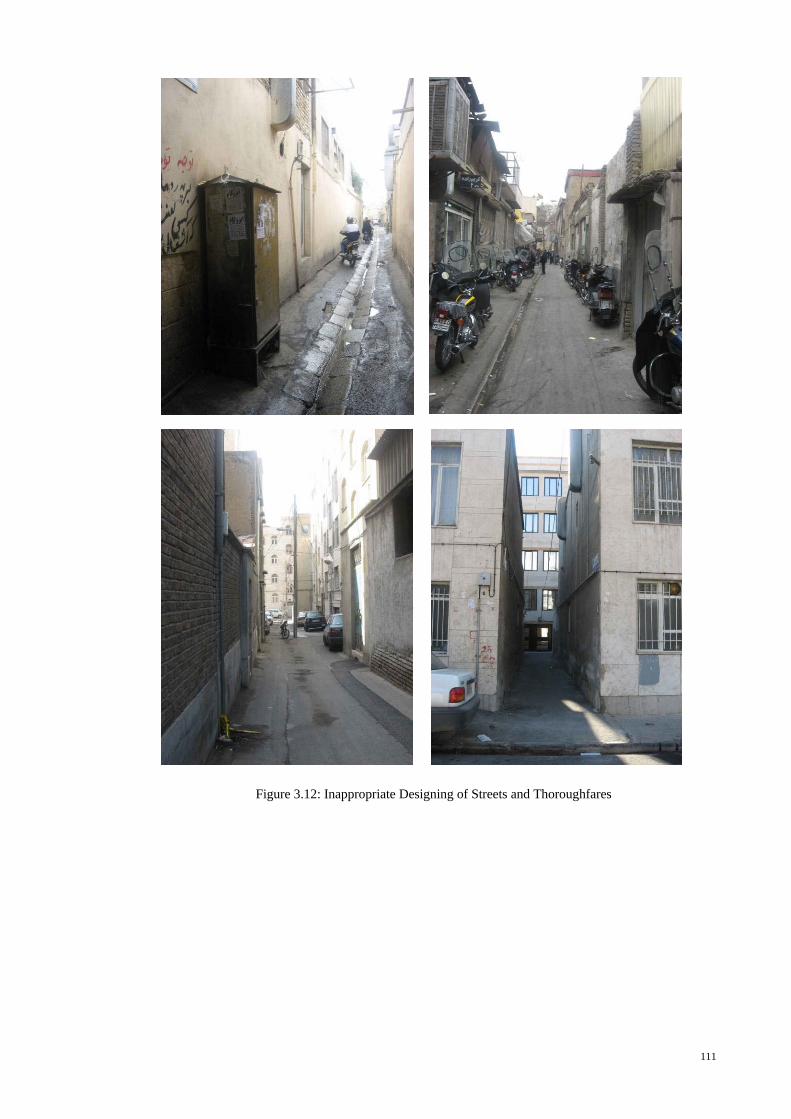
Moreover, the first nucleus of Tehran metropolis is based on old and Iranian -
Islamic urban planning patterns, which cannot meet current urban planning
requirements. A wide range of land area of metropolis Tehran in south, east, west and
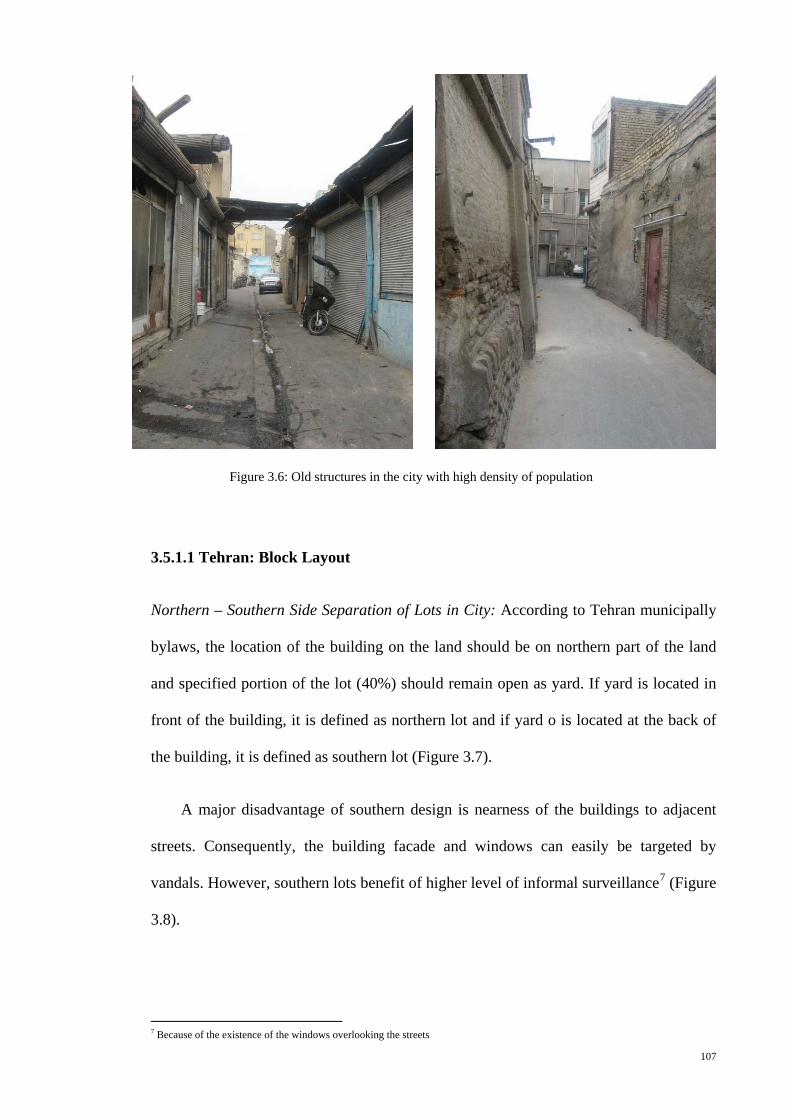
central regions include old city structures5
Urban areas with old structures and high congestion and density of population,
houses that are in dire need of renovation or rehabilitation, lack of pavement in most
streets, unsuitable system of urban sewage and garbage collection and failure in
observing requirements of international urban planning standards give the impression of
an environment with poor aesthetics and improper maintenance that no one cares about
that. According to Fisher, Bell and Baum (1984), in such conditions, vandalism
becomes more common. These areas suffer from poor informal control and the
buildings are mostly neglected by residents. Although the municipality has made its
utmost efforts for encouraging residents of these old-structure regions to renovate and
reconstructed the old buildings
(Figure 3.6).
6
, however, renovation and reconstruction trend is so
slow. Generally, renovation and reconstruction of old structures in central and south
parts of Tehran is not satisfactory besides the fact that these old buildings are replacing
with low quality buildings in terms of construction materials and construction process.
5 There are still buildings made of sun-dried bricks (1.2% of all buildings of Tehran) in old historical centre of the city and the majority of dwelling units in central and south-eastern parts of the city are made of semi- durable materials, i.e. bricks without steel skeleton that constitutes 45% of all the dwelling units in Tehran. This proportion is as high as 80% in some of the south-western quarters. In north and north-western quarters, the majority of buildings have been built with reinforced concrete or metal skeleton since 1981 (Masserat et al. 2005).
6 Tehran municipality provided low interest loans to owners for re construction of the old buildings (Tehran municipally website: en.tehran.ir)
107
Figure 3.6: Old structures in the city with high density of population
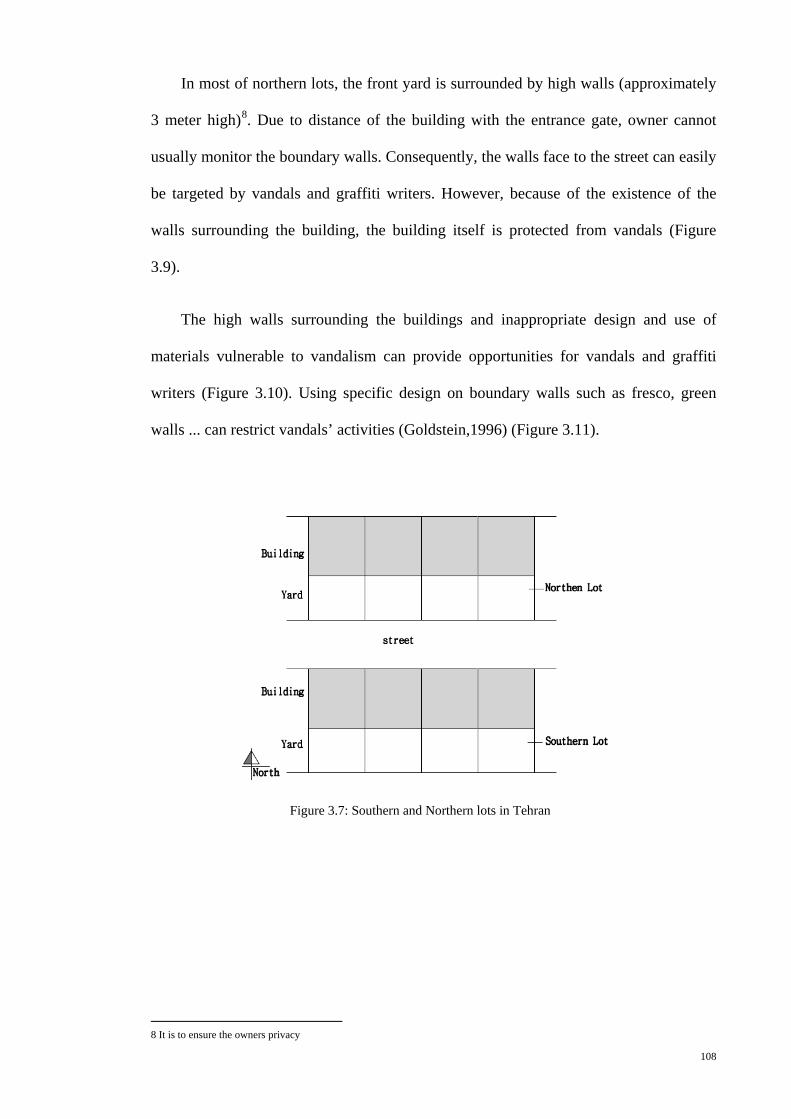
3.5.1.1 Tehran: Block Layout
Northern – Southern Side Separation of Lots in City: According to Tehran municipally
bylaws, the location of the building on the land should be on northern part of the land
and specified portion of the lot (40%) should remain open as yard. If yard is located in
front of the building, it is defined as northern lot and if yard o is located at the back of
the building, it is defined as southern lot (Figure 3.7).
A major disadvantage of southern design is nearness of the buildings to adjacent
streets. Consequently, the building facade and windows can easily be targeted by
vandals. However, southern lots benefit of higher level of informal surveillance7
7 Because of the existence of the windows overlooking the streets
(Figure
3.8).
108
Figure 3.7: Southern and Northern lots in Tehran
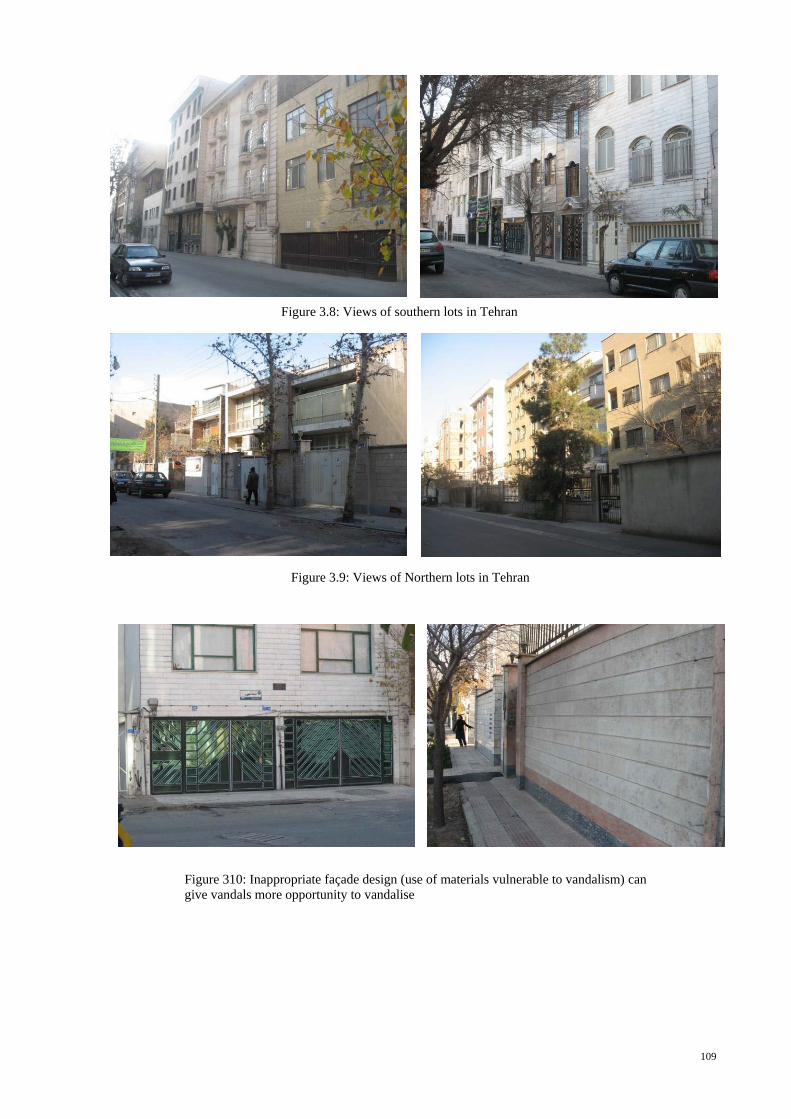
In most of northern lots, the front yard is surrounded by high walls (approximately
3 meter high)8
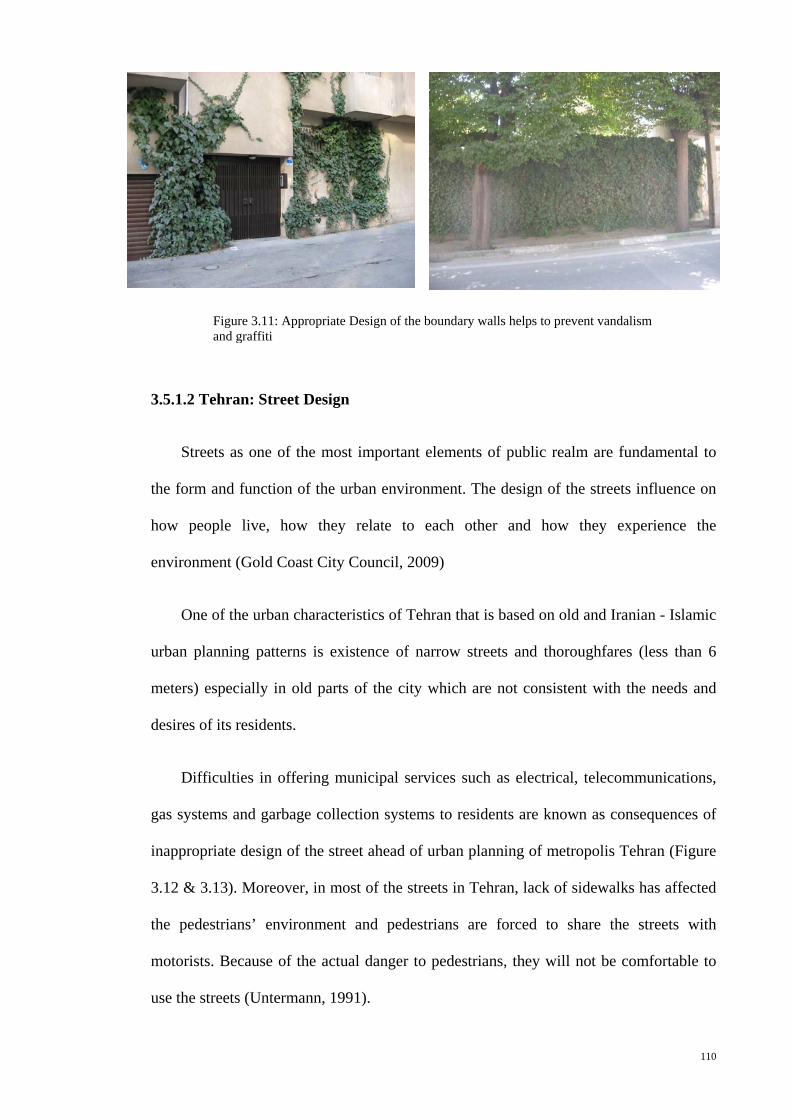
The high walls surrounding the buildings and inappropriate design and use of
materials vulnerable to vandalism can provide opportunities for vandals and graffiti
writers (Figure 3.10). Using specific design on boundary walls such as fresco, green
walls ... can restrict vandals’ activities (Goldstein,1996) (Figure 3.11).
. Due to distance of the building with the entrance gate, owner cannot
usually monitor the boundary walls. Consequently, the walls face to the street can easily
be targeted by vandals and graffiti writers. However, because of the existence of the
walls surrounding the building, the building itself is protected from vandals (Figure
3.9).
8 It is to ensure the owners privacy
109
Figure 3.8: Views of southern lots in Tehran
Figure 310: Inappropriate façade design (use of materials vulnerable to vandalism) can give vandals more opportunity to vandalise
Figure 3.9: Views of Northern lots in Tehran
110
3.5.1.2 Tehran: Street Design
Streets as one of the most important elements of public realm are fundamental to
the form and function of the urban environment. The design of the streets influence on
how people live, how they relate to each other and how they experience the
environment (Gold Coast City Council, 2009)
One of the urban characteristics of Tehran that is based on old and Iranian - Islamic
urban planning patterns is existence of narrow streets and thoroughfares (less than 6
meters) especially in old parts of the city which are not consistent with the needs and
desires of its residents.
Difficulties in offering municipal services such as electrical, telecommunications,
gas systems and garbage collection systems to residents are known as consequences of
inappropriate design of the street ahead of urban planning of metropolis Tehran (Figure
3.12 & 3.13). Moreover, in most of the streets in Tehran, lack of sidewalks has affected
the pedestrians’ environment and pedestrians are forced to share the streets with
motorists. Because of the actual danger to pedestrians, they will not be comfortable to
use the streets (Untermann, 1991).
Figure 3.11: Appropriate Design of the boundary walls helps to prevent vandalism and graffiti
111
Figure 3.12: Inappropriate Designing of Streets and Thoroughfares
112
Figure 3.14: Facades vulnerable to vandalism
Figure 3.13: Inappropriate Designing of Streets and Thoroughfares
Even though the municipality started widening these narrow streets, however, the
buildings are not constructed at the same time. It can create hidden spaces that can give
vandals the opportunities to vandalised properties without being seen by others (Figure
3.14&3.15) since the facades of the new and old buildings are not aligned together.
113
One of the aspects of the street design in Tehran is the design of the intersection in
bevelled form. This design aims to provide a good and early view at intersections to
avoid any cars crashes9
. Based on the author’s observation, this part of the properties
that can be perceived easily by pedestrians and drivers are vulnerable to vandalism
(mostly to commercial graffiti). However in some locations the bevelled form is
covered with green plants (Figure 3.16).
9 “The view on other traffic approaching the intersection is largely determined by the angle at which crossing streets meet” (European Commission Road Safety. www. http://ec.europa.e)
Figure 3.15: The hidden spaces made during the reconstruction of old buildings can give vandals the opportunity to vandalise without being seen
114
Figure 3.17: Inappropriate and inadequate parking lots in the city
Figure 3.16: Facades vulnerable to vandalism
The large number of vehicles parked on the streets is another issues face in Tehran
urban areas especially in congested part of the city. It causes major problems to the
people and drivers that can be costly to life and properties. In most parts of urban areas
of Tehran, there are not enough indoor parking spaces for residents because of either
inappropriate division of the lots or narrow streets. Moreover, lack of enough public
parking lots in the city increase the number of the cars parked illegally on the streets and
pavements. The excessive number of vehicles parked on the streets can limit traffic
flow, emergency services10
and pedestrians’ movement. Apart from that, the vehicles
parked on the streets are more susceptible to vandalism (Scott & La Vigne, 2007)
10“Emergency vehicles did not have ingress or egress due to the number of vehicles parked on the streets”
115
Figure 3.18: Buildings designed without any consideration to their context
3.5.1.3 Tehran: Building Design
Unfortunately, Tehran municipally has no control over the public face of the buildings
in urban areas of Tehran. Existence of the buildings designed without any relation to
their physical context is one of the urban characterises of the city. Poor scale and
proportions, boring repetition of elements, stylistic clichés and poor quality materials
are founded too often in buildings in different part of the city11
. Although Tehran
municipally has started strong commitment to control the design and construction of the
buildings in recent years, however, the control over the maintenance of the buildings is
still a challenge in Tehran urban areas (Figure 3.18).
11 “Since the design of an individual project cannot be judged without some reference to its context, the success of individual works will always be linked to the way in which they deal with their setting. This setting effects the building form and layout, facade composition and articulation, how the buildings relate to each other and how they provide privacy and security, sun access and ventilation, what colours and materials are used and how car parking is resolved” (Maher, 2000)
116
Figure 3.19: A view of the city – North of Tehran
Various Types of Buildings
It is a review on the building types in Tehran, as the building types can cause
limitations or opportunities for vandals and graffiti writers to commit crime.
Irrespective of the land use of buildings, the buildings in Tehran can be classified
and categorised in some various groups:
a. High-Rise Buildings
The high rise buildings are scattered mainly in north, east and west part of the city
which are developing day by day. Shortage of the land and its high cost, concentration
of facilities coupled with pleasant climate are considered as the most important reasons
behind development and expansion of high-rise buildings in these regions (Figure 3.19).
Most of high rise buildings are the single buildings surrounded by high walls. In
such buildings, the interior public spaces (such as hallways, elevators, stairwells, and
lobbies) are protected and defended against the presence of outsiders and intruders12
12 Since the number of families in such buildings are limited and there exists the possibility of monitoring of all interior public spaces and the entryway.
(Figure 3.20). If there are some high-rise buildings on one site, the open spaces
117
Figure 3.20: High-Rise Monuments in Tehran
surrounding the buildings and the corridors to apartments are shared by large number of
people. In such building complex, because of High density of population, the intruders
are less likely to be recognised as outsiders (Newman, 1996) and a lot of spaces in and
around the high-rise complex are not overlooked by residents.
b. Single Buildings
The single buildings in Tehran can be seen in the form of detached and row houses:
I. Detached
Detached buildings are mostly seen in northern parts and outskirts of the city
especially in northern, eastern and western areas. The detached buildings are free
standing buildings usually surrounded with high walls which are so vulnerable to
vandalism (Figure 3.21). However, the building itself is protected from vandalism.
118
Figure 3.21 Detached buildings in Tehran
Figure 3.22: Row buildings in Tehran
II. Row Houses
Most buildings in metropolis Tehran have been constructed as row houses. The
row houses are multi-storey houses located in one area and are at least (if not identical)
consistent in architecture, design and appearance to all adjoining buildings (Figure3.22).
In Tehran, the construction of building five stories is allowed but there is no
controls on the skyline created by the buildings’ facades overlook the streets.
The row houses are divided to northern lot and southern lot. The susceptibility of
both designs to vandalism has been discussed earlier in this chapter.
119
In multi stories row houses, the stairs and landing are shared by families. The
interior public spaces in such buildings are usually neat and well maintained and these
areas are usually defined by families as their own and outsiders are not allowed to
interior public spaces of the building. However, the building facade (southern lot) of the
building or the boundary walls (northern lot) can easily be targeted by vandals.
3.5.1.4 Tehran: Outdoor Lighting
Tehran outdoor lighting system suffers from irresponsible lighting policy resulted
by rapid growth of the city. Apart from the huge budget needed to redesigning the
outdoor lighting system, to improve lighting system, the city urban areas need major
improvement. Resident’s participation is also need to help improving the nighttime’s
atmosphere in Tehran urban areas.
Tehran’s night time street environment can be characterised as a visible
demonstration of bad outdoor lighting. The majority of Tehran’s streetlights are old
style poles and fixtures with poor optical control. Although some of the old style poles
have been replaced with new cobra head fixtures, however, bad placement of the
lighting poles in relation to other roadway elements and inappropriate height of the
poles are the common cause of light pollution in Tehran urban areas (Figure 3.23).
One of the problems is the placement of the poles in low width of streets and
pavements that causes light trespass to the properties. The problem is worsened in very
narrow alleys, although in some alleys the light source is installed on the walls.
Inappropriate placement of the old poles is major problems that also affect pedestrians
and vehicular traffic (Figure 3.24).
120
Figure 3.24: Inappropriate placement of lighting poles in narrow streets
Moreover, inappropriate pole height cause either to diffuse the light into the trees
or shine almost all of the lights onto the tree canopy tops keep the ground under the
trees in deep and dangerous shadow (Figure 3.25).
Figure 3.23: Old style poles are seen extensively in old structure of the city
121
Figure 3.25: Inappropriate pole height can cause safety problems
Glare conditions are a significant part of the Tehran’s current lighting problems.
Yellow – orange glare, light trespass into buildings and up lighting to the sky is the
chief characteristics of the Tehran’s degraded night time environment. There is no
control from municipality on the types of light fixtures and colour that people use to
light the entrances of their houses as well as building facades in residential and business
areas of the city13
.
Underground utility wires14
13 It is based on Informal, conversational interview with 2 experts in Tehran municipally department and electricity department. They were asked if there is any regulations to select the lighting fixtures to lit the buildings' entrance in urban areas of Tehran (Kazemi A. , Safari S., Personal Communication, October 16,17, 2008)
are a key perquisite to achieving adequate street
lighting (Weaver, 1997). Although, underground utility wires implemented in most of
newly built urban areas but majority areas in old structure of the city have over headed
street wires with street light fixtures attached (Figure 3.26).
14 “ The primary advantages of underground utility wires are improve aesthetics and overall improve reliability. Underground utility wires require little tree trimming and much less susceptible to motor vehicle accidents” Marison., Miller , Christie (2005). “Concerns about the reliability of overhead lines, increases in their maintenance and operating costs, and issues of public safety and quality-of-life are leading more and more utilities and municipalities to the realization that converting overhead distribution lines to underground is the best way to provide high-quality service to their customers” (The power to change the face of America, 2009)
122
Figure 3.26: Overhead street wires affect efficiency and aesthetics of the city
Even though under grounding utility wires has been required for new developments
of the city and over-head wiring utility wires can affect the efficiency of the lighting
system and aesthetics of the city but there is no effort to expand underground utility
system due to the budget needed to underground the overhead wires in old parts of the
city.
3.6 Tehran: Individual Characteristics
Tehran has faced sudden changes of industrialisation due to political, economic and
ecological considerations. The tremendous increase in Tehran's population has been due
to migration. The proportion of migrants to total population clearly reflects a new
demographic and cultural change. Most migrants are men but the sex ratio is just 109
men to 100 women and they are mostly 20 to 40, meaning that Tehran is a favourite
destination for the young (Masserat et al. 2005). This portion of population desires to
settle in the capital to begin a new and better life. Because of these considerations,
different ethnicities and groups from different cultural backgrounds have been attracted
123
to the city and subcultures are highly influential in socialisation, acculturation,
solidarity, and integration of the individuals in the society (Navabakhsh, 2005).
People in Tehran are grappling with rising stress and crime because of population
explosion. The high growth of population and poverty in last three decades is known to
cause major problems in Iran (Sheykhi, 2007). Traffic, air and sound pollution and the
high cost of living are some of the major problems of living in Tehran. As a result,
young people have to find alternative ways of employment to make a living and they
have less leisure for other activities and resting. Living in Tehran is stressful for its
residents and e people suffer from severe depression. They are less patient compared
with the people living in other cities of Iran (Hashemi, 2008). The city is divided into
four parts: North, South, West and East. "People living in the southern part of the city
have lower levels of education. They are younger and poorer. They have higher
population densities and have more vulnerable structures in comparison to the social
groups living in the central and northern portions of the city. The central districts have
the richest cultural heritage. A number of cultural buildings are located in this part of
the city and daytime population can be significantly high due to the concentration of
public buildings. Higher income groups, higher literary rates and newer structures,
characterise the northern districts"("Tehran, Iran Disaster ", 2005).
3.6.1 Tehran: Demography
Inhabitants of the metropolitan area were mostly born elsewhere or are children of
those who were not born in the capital. Thus, their identity is unique, new and
constantly changing. The real identity of Tehran’s citizens and their social- cultural
characteristics, especially in new neighbourhoods are neither well understood nor
considered. In 2004, Tehran’ urban area had a population of 12 million. This is the
highest concentration of population in Iran. This proportion has remained almost
124
constant for the past 40 years. Tehran’s urban region, after a period of rapid growth
between 1950 and 1970 similar to other metropolises of the world, is witnessing slow
growth now (Masserat et al. 2005).
Table 3.9: Annual Rate of Population Growth (%) 1916 1926 1936 1946 1956 1966 1976 1986 1996
In Tehran province, the average population density is 5.3 persons per hectare (pph)
while in the city of Tehran it is 92 pph and in province without Tehran it is only 1.9
pph. Tehran is a capital with a low average density because it has vast areas, which are
inbuilt. Southern quarter of the city has the highest density (average density of 300pph)
and northern part of the city has the lowest population density (40 to 90pph). The city
centre that previously had a higher population density is now facing a decrease in
residential population.
Population: Age Structure
Tehran region as in entire country has a young population. 33.8% of its population is
below 15 years of age, but this ratio is lower than the national average (39.4% in 1996)
as in the urban areas of the country. In 1996, the average of the population was 21.1 and
27.6 years in Iran and Tehran respectively. The city of Tehran has a relatively older
population than other parts of the region (the average of age in Tehran is 27 years old
and 30.7% of its population are below 15 years old) (Masserat et al. 2005).
125
Table 3.10: Population of age group (S) Age of population Tehran province Iran Average of age (year) 27.6 25.0 21.1 Youth, 0-14 years (%) 30.7 33.8 39.4 Elders, 15-64 years (%) 64.5 62.1 56.2 65 years and more (%) 4.7 4.1 4.4 Source: Masserat et al. (2005)
Table 3.11 Tehran Population Age structure (2006)
Age
0-4
5-9
10-14
15-19
20-24
25-29
30-34
35-39
40-44
45-49
50-54
55-59
60-64
65-69
70-74
75-79
80-84
85and above
No.
929959
1036246
1402077
1734736
1520903
1164412
1067710
912777
763828
594755
411838
309411
237341
196866
118695
75190
35682
Total: 13422366 Source: Iran statistical centre (2006)
Gender Ratio
The population of men in the province of Tehran is clearly more than that of women
(5.33 million vs. 5.02 million). The reason for such a difference is explained mainly by
occupational migration of men to the capital. Many young men in search of jobs have
resided in the Tehran (Masserat et al. 2005). The main characteristics of the province’s
demographic types include:
• Very high ratio of children and the youth
• Very high ratio of adults to children and the youth
126
3.7 Summary
This chapter was a review on urban physical and environmental characteristics of
Tehran and discussed how environmental variables such as lighting design, housing
design, block layout and street design in Tehran urban areas can provide opportunities
or limitations to occurrences of vandalism and graffiti and how these physical features
effects on implementation of environmental strategies to combat graffiti and vandalism
in urban areas of Tehran.
The focus of this chapter was on lighting as one of the most important aspects of
the built environment that has clearly impact on perception of space by the occupants.
Improved outdoor lighting is widely seen and implemented by public as a useful way of
preventing crime and lessening its’ fear but first, the economical and environmental
reasons and the urgent need to control and limit outdoor lighting level in urban areas
and second, the assumption that lighting can prevent crime and reduce fear of crime has
lead to more investigation on the actual effects of outdoor lighting on crime and fear of
crime. The literatures presented in this chapter, disseminate the results from the studies
examined the effects of improved street lighting on crime and fear of crime in UK and
US.
Several studies and reviews have showed the effectiveness of implementing
outdoor lighting interventions to prevent crime. They have explained the theory that
lighting can prevent crime and have provided evidence on the cost benefits of the
approach. Other studies draw attention to the negative or ineffective impact of improved
lighting on crime rate and one study discussed on the effective role of darkness as a
crime deterrent. To some extent, the assessment of the recent reviews (by Farrington &
Welsh 2002,2008, Clark 2002a, 2002b and Marchant 2004, 2006) are more likely to
indicate that the effects of improved lighting on crime is still in doubt.
127
The review highlights the importance and the need for more studies on the effects
of improved lighting on specific types of crime considering the characteristics of the
area since the reaction of criminals and residents to any environmental changes may
vary between communities. The study on lighting and crime continues with a discussion
on vandalism and lighting. A review on available literature highlights the original
contribution of this research.
The second part of the chapter, discussed urban design issues faced in Tehran resulting
from fast development of the city, concentration and mobility of the population that
contributes to incidence of vandalism. The critical review of the problems and
limitations in public domain of the City resulted from environmental conditions of the
city with respect to high proportion of youth, chaotic urbanisation, and socio-economic
condition, highlighted that Tehran has vulnerable urban areas to vandalism and graffiti
that pose a threat to stability and development of the country.
Understanding Tehran's social, cultural and urban characteristics is a necessity for this
research; through that, a comprehensive study can be performed to relate the research
results with Tehran's specific conditions.
Next chapter describes and justifies the data gathering methods used for this
dissertation, including the survey instrument, reliability of the surveys.