Page 1
85
CHAPTER THREE
METHODOLOGY
Introduction
This chapter discusses about the methodology of the study. The discussion comprises nine
main sections: research design, selection of subjects, data collection, administration of the
interview, instrumentation, pilot study, data analysis, content validity, and reliability.
Research Design
Yin (2003) noted that “a research design is the logic that links the data to be collected
(and the conclusions to be drawn) to the initial questions of study. Every empirical study has an
implicit, if not explicit, research design” (p. 19). Merriam (1998) identified four of the common
types of qualitative research in education as: (a) ethnography, (b) phenomenology, (c) grounded
theory, and (d) case study. Table 3.1 summarizes the characteristics of the four common types of
qualitative research in education.
Table 3.1
Characteristics of the Four Common Types of Qualitative Research in Education
Type Characteristics
Ethnography
1. Focus on society and culture
2. Uncovers and describe beliefs, values, and attitudes that
structure behavior of a group
Phenomenology 1. Is concerned with essence or basic structure of a
phenomenon
2. Uses data that are the participant‟s and the investigator‟s
firsthand experience of the phenomenon
Grounded theory 1. Is designed to inductively build a substantive theory
regarding some aspect of practice
2. Is “grounded” in the real world
Case study 1. Is intensive, holistic description and analysis of a single
unit or bounded system
2. Can be combined with any of the above types
Note. Adapted from “Table 1.2 Common Types of Qualitative Research in Education,” by S. B.
Merriam, 1998, Qualitative Research and Case Study Applications in Education, p. 12.
Page 2
86
In this study, the researcher employed case study research design to examine, in-depth,
preservice secondary school mathematics teachers' subject matter knowledge (SMK) of perimeter
and area. “A case study design is used to gain an in-depth understanding of the situation and
meaning for those involved” (Merriam, 1998, p. 19). Several researchers (e.g., Aida Suraya,
1996; Chew, 2007; Lim, 2007; Rokiah, 1998; Seow, 1989; Sharifah Norul Akmar, 1997;
Sutriyono, 1997) employed case study research design to study Malaysian students, preservice
teachers, and lecturers.
Merriam (1998) noted that “all research design can be discussed in terms of their relative
strengths and limitations. The merits of a particular design are inherently related to the rationale
for selecting it as the most appropriate plan for addressing the research problem” (pp. 40-41). In
the present study, case study research design was employed to examine, in-depth, preservice
secondary school mathematics teachers' subject matter knowledge (SMK) of perimeter and area
because of the nature of the research problem and the research questions being asked. Case study
is considered the appropriate research design for answering the research questions in this study as
its strengths far outweigh its limitations.
As Merriam (1998) observes:
The case study results in a rich and holistic account of a phenomenon. It offers insights
and illuminates meanings that expand its readers‟ experiences. These insights can be
construed as tentative hypotheses that help structure future research; hence, case study
plays an important role in advancing a field‟s knowledge base. Because of its strengths,
case study is a particularly appealing design for applied fields of study such as education.
(p. 41)
According to Merriam (1998), case study research has three main features: (a) “particularistic –
focus on a particular situation, event, program, or phenomenon; (b) descriptive – the end product
is a rich, „thick‟ description of the phenomenon under study; and (c) heuristic – illuminate the
reader‟s understanding of the phenomenon under study“ (pp. 29 – 30).
Page 3
87
The present study: (a) focuses on the way the eight PSSMTs confront each of the eight
categories of tasks related to perimeter and area during the clinical interviews (i.e.,
particularistic); (b) provides a rich, „thick‟ description of the PSSMTs' five basic types of
knowledge of perimeter and area, namely conceptual knowledge, procedural knowledge,
linguistic knowledge, strategic knowledge, and ethical knowledge (i.e., descriptive); and (c)
enhances the reader‟s understanding of the nature and levels of SMK of perimeter and area that
the PSSMTs exhibit (i.e., heuristic). Thus, case study research design was appropriate for the
present study in comparison with other common types of qualitative research design in education,
namely ethnography, phenomenology, and grounded theory.
Selection of Subjects
There are two basic types of sampling, namely probability (random) sampling and
nonprobability (nonrandom) sampling. Generalization is not a goal of qualitative research. Thus,
“nonprobability sampling is the method of choice for most qualitative research” (Merriam, 1998,
p. 61). Purposeful (purposive) sampling is the most common form of nonprobability sampling.
According to Merriam (1998), “purposeful sampling is based on the assumption that the
investigator wants to discover, understand, and gain insight and therefore must select a sample
from which the most can be learned” (p. 61).
Generalization of results of the study from the sample to the population from which it was
drawn was not the goal of the present study. The purpose of this study was to examine, in-depth,
preservice secondary school mathematics teachers' subject matter knowledge (SMK) of perimeter
and area. Thus, the researcher employed purposeful sampling to select the subjects (sample) for
this study. To begin purposeful sampling, the researcher must first determine the essential
selection criteria in choosing the subjects (sample) to be studied (Merriam, 1998). The criteria for
selecting the subjects (sample) for the present study were: (a) preservice secondary school
Page 4
88
teachers enrolled in a public university who majored or minored in mathematics, (b) they enrolled
for a one-semester mathematics teaching methods course during the data collection, (c) they
agreed to serve as case study participants, (d) they agreed to be audiotaped and videotaped
throughout the clinical interview sessions, and (e) they agreed to complete the four clinical
interview sessions. Nevertheless, the subjects (sample) were given the freedom of withdrawals
from the study at any stage at their own will.
The selection of subjects (sample) began when the researcher sought permission from the
mathematics teaching methods course coordinator to conduct the study. The researcher had
explained the purpose and the nature of this study to the course coordinator. The course
coordinator granted the permission and allowed the researcher to enter her class to collect
background information data from the PSSMTs.
The researcher explained the purpose and the nature of this study to all the PSSMTs
before distributed the Background Information Form to them. They were assured that all their
responses in the Background Information Form and clinical interview would be treated as
confidential and would only be used for the purpose of this study. They were also assured that all
their responses in the Background Information Form and clinical interview would not affect the
nature of their grades in the mathematics teaching methods course. The Background Information
Form sought to collect demographic information included PSSMTs' gender, age, national
examinations mathematics results, teacher education programs, major and minor, university
content courses taken and grades attained, cumulative grade point average (CGPA) secured, and
teaching experience (if any) (see Appendix F).
Based on the above selection criteria, eight subjects (sample) were selected for the
purpose of this study. They were PSSMTs from a public university in Peninsula Malaysia
enrolled in a 4-year Bachelor of Science with Education (B.Sc.Ed.) program, majored or minored
in mathematics. These subjects enrolled for a one-semester mathematics teaching methods course
Page 5
89
during the data collection of this study. The mathematics teaching methods course was offered to
B.Sc.Ed. program students who intended to major or minor in mathematics. The researcher had
selected four B.Sc.Ed. program students who majored in mathematics, and four B.Sc.Ed. program
students who minored in mathematics for the purpose of this study.
The results of the analysis on the total of 180 copies of the Background Information Form
collected showed that 94 (52.2%) and 86 (47.8%) of the PSSMTs majored and minored in
mathematics, respectively. For those who majored in mathematics, about 25%, 50%, and 25% of
them minored in biology, chemistry, and physics, respectively. Similarly, for those who minored
in mathematics, about 25%, 50%, and 25% of them majored in biology, chemistry, and physics,
respectively. Thus, two PSSMTs were selected from those who majored in mathematics and
minored in chemistry, and from those who majored in chemistry and minored in mathematics,
respectively. One PSSMT was selected from each of the other combinations of majors and
minors, respectively.
PSSMTs who have selected mathematics as their major in the B.Sc.Ed. program were
required to take 44 units of mathematics content courses. These courses were nine compulsory
mathematics content courses (36 units) and any two (8 units) out of seven mathematics content
courses from the optional component courses throughout the four year B.Sc.Ed. program (see
Table C1 in Appendix C). For those who have selected mathematics as their minor in the
B.Sc.Ed. program, they were required to take 20 units of mathematics content courses.
Specifically, they were required to take any five out of ten mathematics content courses
throughout the four year B.Sc.Ed. program (see Table C2 in Appendix C). Each PSSMT was
given a pseudonym, namely Beng, Liana, Mazlan, Patrick, Roslina, Suhana, Tan, and Usha, in
order to protect the anonymity of all interviewees. The brief background information about the
subjects is shown in Table 3.2.
Page 6
90
Table 3.2
Subjects’ Ethnicity, Gender, Age, Major, Minor, and CGPA
Subject Ethnicity Gender Age Major Minor CGPA
Usha
Mazlan
Patrick
Beng
Roslina
Liana
Tan
Suhana
Indian
Malay
Bidayuh
Chinese
Malay
Malay
Chinese
Malay
Female
Male
Male
Female
Female
Female
Male
Female
(21, 9)
(21, 8)
(21, 7)
(22, 9)
(21, 8)
(21, 5)
(22, 7)
(20, 10)
Mathematics
Mathematics
Mathematics
Mathematics
Biology
Chemistry
Chemistry
Physics
Biology
Chemistry
Chemistry
Physics
Mathematics
Mathematics
Mathematics
Mathematics
2.92
2.70
3.04
3.82
3.15
2.77
3.69
2.52
Data Collection
Data for this study was collected using clinical interview technique. Interviewing is a
common means of data collection for qualitative studies in education (Merriam, 1998). It is noted
to be the only source of data collection in numerous studies (e.g., Aida Suraya, 1996; Ball, 1988;
Fatimah, 1997; Nik Azis, 1987; Lim, 2007; Rokiah, 1998; Sharifah Norul Akmar, 1997;
Sutriyono, 1997). The term "clinical" means direct observation on student's behaviors in the
context of one to one interaction. The term "direct observation" refers to researcher's observation
that focused on student's behaviors when the latter solving problems. The researcher observes
each of the student's behaviors carefully, be it verbal or nonverbal behaviors (Nik Azis, 1999).
Clinical interview is an interactive communication between a researcher or teacher
(interviewer) and a student (interviewee) in which the interviewer seeks to elicit information from
the interviewee about how the latter thinks and learns (Long & Ben-Hur, 1991). The question
posed by the researcher is interrelated with response pattern or answer given by the student to the
Page 7
91
earlier questions. In other words, the researcher use questioning and answering procedure that are
flexible, open, intensive, elicit, explore, and required students to provide explanation about their
actions to enable researcher to understand their thinking (Nik Azis, 1999). The communication is
focused on a problem or task that allowed the student to display behavior from which mental
process used in thinking about that problem or task can be inferred (Hunting & Doig, 1997).
Central to clinical interview is the “recognition of the role of language and the importance of
clarification of meaning as researchers ask questions and pose problems, and students talk about
their mathematics and explain their actions” (Hunting, 1997, p. 2). It gives insights into students'
experiences by allowing the researcher to understand the meanings that students find in
mathematical problems or tasks. It also permits researcher to emphasize process over product,
encourages communication about mathematics, and provide researchers and students instant
feedback (Long & Ben-Hur, 1991).
In the present study, the researcher used the context of one to one interaction to make
direct observation on the subject's behaviors when the latter solving problems. During the
interview, the researcher also use questioning and assessment. In this case, the researcher was
able to elicit preservice secondary school mathematics teachers' SMK of perimeter and area.
Specifically, the clinical interviews techniques permitted the researcher to elicit PSSMTs' five
basic types of knowledge of perimeter and area, namely conceptual knowledge, procedural
knowledge, linguistic knowledge, strategic knowledge, and ethical knowledge. Subsequently, the
researcher was able to determine PSSMTs‟ levels (low, medium, high) of SMK of perimeter and
area.
In this study, the clinical interview was designed to incorporate the following features as
suggested by Nik Azis (1987, 1996): (a) an interview plan that anticipates as many contingencies
as possible as the preservice teachers solving a mathematical problem, (b) the mathematical
problems were structured in such a way that allow the preservice teachers to use the most
Page 8
92
sophisticated strategies available, (c) the settings of the mathematical problems were chosen
carefully to increase motivation so that preservice teachers are interested to attempt each
problem, and (d) the preservice teachers were given every opportunity to attempt each problem.
In the present study, materials collected for analysis consisted of audiotapes and
videotapes of clinical interviews, subject's notes and drawings, and researcher's notes during the
interviews. The audiotapes and videotapes were verbatim transcribed into written form and the
transcriptions were the raw data for this study. The transcriptions include verbal and nonverbal
interaction between researcher and subject.
Administration of the Interview
The clinical interview was conducted in the Mathematics Teaching Room at a public
university in Peninsula Malaysia. Mathematics Teaching Room was selected because all PSSMTs
were familiar with it. They used to attend mathematics teaching methods tutorials in the
Mathematics Teaching Room on a weekly basis. They felt more relax and comfortable.
The physical setting for each interview consisted of a table with two chairs, a tape
recorder, and a digital video camera. Each interview was recorded through the tape recorder and
digital video camera positioned in front of the table. The camera was focused on the subject, the
working area, and the researcher. Blank papers, grid papers, pencil, ruler, thread, compasses, and
calculator were accessible to the PSSMTs throughout the interviews. The interview was
conducted in January 2008. Each of the eight subjects was individually interviewed from 30 to 50
minutes on four separate occasions in a period of approximately four weeks. Each session
involved three or four tasks or subtasks (see Appendix G).
The total time for each interview varied from subject to subject depending on the amount
of time taken to complete the tasks. During the interview, the researcher started the session by
posing a task to the subject. The subject responded to the task. Based on the subject's response to
Page 9
93
this task, the researcher probed, presented the same task in different form or posed a new task.
For instance, after posing Task 1.1 to the subject, the researcher probed with the following
questions: “Why did you select this shape?”, “Why didn't you select this shape?”, "What do you
mean by ____?", or "Could you tell me more about it?". The probes generated by the researcher
were interrelated with the subject's response to the previous probe. Thus, each interview was
different from one another as each subject is unique.
Instrumentation
Eight types of interview tasks were devised for this study (see Appendix G): (a) notion of
perimeter and area, (b) notion of the units of area, (c) comparing perimeter and area, (d)
Converting units of area, (e) relationship between perimeter and area, (f) calculating perimeter
and area, (g) fencing problem, and (h) developing area formulae. The tasks were constructed
based on Topic 11 (i.e., perimeter and area) (see Appendix D) from the Form One Mathematics
Curriculum Specifications and literature review. Tasks 1 and 3 were adapted from Baturo and
Nason (1996) while Tasks 5.1, 5.2, 5.3, and 7 were adapted from Wilson & Chavarria (1993),
Billstein et al. (2006), Ball (1988), and Sgroi (2001), respectively (see Appendix G).
The tasks and standard probes for the clinical interview were given in Appendix G.
Supplementary probes were generated in the course of the clinical interview whenever necessary
so as to get a clearer picture about what the interviewee was thinking. In each case, effort was
channeled at probing as deeply as possible the PSSMTs' SMK of perimeter and area. By asking
PSSMTs to provide an explanation to justify their responses, it gave the researcher a view of their
understanding of the SMK of perimeter and area in the respective tasks of the clinical interview.
The description of the tasks was done in the following subsection.
Page 10
94
Description of the Tasks
Task 1: Notion of perimeter and area
Task 1.1: Notion of perimeter
In Task 1.1, subjects were asked to select the shapes (12 shapes) that have a perimeter.
The objective of this task was to determine the subjects' conceptual knowledge about the notion
of perimeter. According to Beaumont, Curtis, & Smart (1986), “the study of the concept of
perimeter is unified by considering the simple closed curve” (p. 5). Thus, four simple closed
curves (A, C, H, K), each of them has one interior, were used to ascertain whether the subjects
understood the concept of perimeter. For all simple closed curves, the perimeter is the number of
linear units it takes to surround it. Two simple but not closed curves (B, G) were included to
investigate further the subjects' understanding of the concept of perimeter. Another two closed
but not simple curves (D, I), each of which has more than one interior, were included to ascertain
whether the subjects understood the concept of perimeter.
Two 1-dimensional shapes (E, L) were included to ascertain whether the subjects
understood the concept of perimeter. Finally, two 3-dimensional shapes (F, J) were included
because review of research literature has shown that some students and teachers encountered
difficulty in distinguishing between the attributes of perimeter, area, and volume (Baturo &
Nason, 1996; Beaumont, Curtis, & Smart, 1986; Ramakrishnan, 1998; Reinke, 1997).
Task 1.1 was also used to determine the subjects‟ linguistic knowledge of perimeter based
on the language of mathematics (such as mathematical terms and symbols) that the subjects used
to justify their selection of shapes that have a perimeter. There are some good behaviors that the
subjects need to follow when dealing with perimeter and area. Knowledge and justification of
knowledge is an important aspect in any discipline. Thus, this task was also used to determine the
subjects‟ ethical knowledge of perimeter by ascertaining whether the subjects justify the selection
of shapes that have a perimeter.
Page 11
95
Task 1.2: Notion of area
In Task 1.2, subjects were asked to select the shapes (12 shapes) that have an area. The
objective of this task was to determine the subjects' conceptual knowledge about the notion of
area. Six 2-dimensional shapes (A, C, D, H, I, K) were used to ascertain whether the subjects
understood area from a static perspective. Based on this perspective, “area can be considered as
the amount of surface enclosed within a boundary” (Baturo & Nason, 1996, p. 245). Two open
shapes (B, G) were included to investigate further the subjects' understanding of the notion of
area from a static perspective.
Two 1-dimensional shapes (E, L) were included to ascertain whether the subjects
understood area from a dynamic perspective. If a subject selected one or both of these shapes and
explained that the shape(s) had an area of zero, then this response indicated that the subject is
having a dynamic perspective of area (Baturo & Nason, 1996). Finally, two 3-dimensional
shapes (F, J) were included because review of research literature has shown that some students
and teachers encountered difficulty in distinguishing between the attributes of perimeter, area and
volume (Baturo & Nason, 1996; Beaumont, Curtis, & Smart, 1986; Ramakrishnan, 1998; Reinke,
1997).
Task 1.2 was also used to determine the subjects‟ linguistic knowledge of area based on
the language of mathematics (such as mathematical terms and symbols) that the subjects used to
justify their selection of shapes that have an area. This task was also used to determine the
subjects‟ ethical knowledge of area by ascertaining whether the subjects justify the selection of
shapes that have an area.
Task 2: Units of area
In Task 2, subjects were asked to respond to a scenario where three students were
discussing about the units of area. The objective of this task was to determine the subjects‟
Page 12
96
conceptual knowledge about the notion of the units of area. This task was used to determine
whether the subjects knew that square as well as nonsquare (e.g., rectangle, and triangle) can be
used as the units of area measurement. The subjects who responded that only square can be used
as the unit of area indicated that they had a limited idea of unit of area. On the other hand, the
subjects who responded that square as well as nonsquare (e.g., rectangle, and triangle) can be
used as the units of area had an idea about the conceptual knowledge of the units of area. In fact,
any plane figure that tessellates can be used as the units of area measurement.
Task 2 was also used to determine the subjects‟ linguistic knowledge of units of area
based on the language of mathematics (such as mathematical terms and symbols) that the subjects
used to justify their selection of shapes (square and nonsquare) that can be used as the units of
area measurement. This task was also used to determine the subjects‟ ethical knowledge of units
of area by ascertaining whether the subjects justify their selection of shapes (square and
nonsquare) that can be used as the units of area measurement.
Task 3: Comparing perimeter and area
Task 3.1: Comparing perimeter (No dimension was given)
In Task 3.1, subjects were asked to determine whether the given pair of shapes (T-shape
and a rectangle) had the same perimeter. The objective of this task was to determine the subjects'
strategic knowledge of comparing perimeters of two different shapes. It also revealed whether the
subjects know the availability of alternative methods not involving formula for measuring
perimeter.
Task 3.2: Comparing area (No dimension was given)
In Task 3.2, subjects were asked to determine whether the given pair of shapes (L-shape
and a square) had the same area. The objective of this task was to determine the subjects' strategic
Page 13
97
knowledge of comparing areas of two different shapes. It also revealed whether the subjects
know the availability of alternative methods not involving formula for measuring area.
Task 3.3: Comparing perimeter (Nonstandard and standard units)
In Task 3.3, subjects were asked to compare, from the measurements given, which shape
in each set (Sets 1, 2, and 3) has the longer perimeter. In Set 1, perimeters of shapes A and B
were given as the length of 25 paper clips and 12 sticks respectively. In Set 2, perimeters of
shapes A and B were denoted as the length of 10 paper clips and 15 paper clips respectively. In
Set 3, perimeters of shapes A and B were given as 16 cm and 13 cm respectively. The objective
of this task was to determine the subjects‟ conceptual knowledge of comparing perimeter through
nonstandard and standard units. This task was used to determine whether the subjects focused on
the number of unit or the unit of measure when they were comparing perimeters with (a)
nonstandard units, (b) common nonstandard units, and (c) common standard unit. This task was
also used to determine whether the subjects knew that (a) nonstandard units (such as paper clip
and stick) are not reliable for comparing perimeters, (b) common nonstandard units (such as
paper clips) are not reliable for comparing perimeters, and (c) common standard unit (such as cm)
is reliable for comparing perimeters.
Task 3.4: Comparing area (nonstandard and standard units)
In Task 3.4, subjects were asked to compare, from the measurements given, which shape
in each set (Sets 1, 2, and 3) has the larger area. In Set 1, areas of shapes A and B were given as
the area of 25 triangles and 12 squares respectively. In Set 2, areas of shapes A and B were
denoted as the area of 10 squares and 15 squares respectively. In Set 3, areas of shapes A and B
were given as 16 cm2 and 13 cm
2 respectively. The objective of this task was to determine the
subjects‟ conceptual knowledge of comparing area through nonstandard and standard units. This
Page 14
98
task was used to determine whether the subjects focused on the number of unit or the unit of
measure when they were comparing areas with (a) nonstandard units, (b) common nonstandard
units, and (c) common standard unit. This task was also used to determine whether the subjects
knew that (a) nonstandard units (such as triangle and square) are not reliable for comparing areas,
(b) common nonstandard units (such as squares) are not reliable for comparing areas, and (c)
common standard unit (such as cm2) is reliable for comparing areas. Task 3.4 was also employed
to determine the subjects‟ linguistic knowledge of conventions of writing and reading SI area
measurement such as 16 cm2 (16 square centimetres).
Task 4: Converting units of area
In Task 4, subjects were asked to respond to a scenario where several students
encountered difficulty in converting units of area. The objective of this task was to determine the
subjects‟ procedural knowledge of converting units of area measurement.
Task 4 was also used to determine the subjects‟ conceptual knowledge related to
converting units of area. Specifically, this task was used to determine whether the subjects: (a)
knew the relationships between the standard units of length measurement such as 1 cm = 10 mm,
1 m = 100 cm, and 1 km = 1000 m; (b) knew the relationships between the standard units of area
measurement such as 1 cm2
= 100 mm2, 1 m
2 = 10 000 cm
2, and 1 k m
2 = 1 000 000 m
2; and (c)
knew the relationship between area units and linear units of measurement: Area units are derived
from linear units based on squaring.
Task 5: Relationship between perimeter and area
Task 5.1: Same perimeter, same area?
In Task 5.1, a Form One student claimed that he found a way to calculate the area of a
leaf. The student placed a piece of thread around the boundary of the leaf. Then he rearranged the
Page 15
99
thread to form a rectangle and got the area of the leaf as the area of a rectangle. Subjects were
asked how they would respond to this student. The objective of this task was to determine the
subjects' conceptual knowledge of the relationships between perimeter and area of an irregular
figure. Task 5.1 was used to ascertain whether the subjects knew that there is no direct
relationship between perimeter and area. Two shapes with the same perimeter can have different
areas. Woodward (1982), and Woodward and Byrd (1983) found that some students thought that
figure have the same perimeter also have the same area.
Task 5.1 was also used to determine the subjects' ethical knowledge of the relationship
between perimeter and area. This task was used to ascertain whether the subjects (a) examine
pattern within the domain of perimeter and area measurement, (b) formulate generalizations
within the domain of perimeter and area measurement, and (c) test generalizations within the
domain of perimeter and area measurement.
Task 5.2: Longer perimeter, larger area?
In Task 5.2, the subjects were asked to respond to a student, Mary, who claimed that she
could determine whose garden has the larger area to plant flowers. She claimed that the garden
with the longer perimeter has the larger area. The objective of this task was to determine the
subjects' conceptual knowledge of the relationship between perimeter and area of irregular
figures. Task 5.2 was used to ascertain whether the subjects knew that there is no direct
relationship between perimeter and area. The garden with the longer perimeter can have a smaller
area.
Task 5.2 was also used to determine the subjects' ethical knowledge of the relationship
between perimeter and area of. This task was used to ascertain whether the subjects (a) examine
pattern within the domain of perimeter and area measurement, (b) formulate generalizations
Page 16
100
within the domain of perimeter and area measurement, and (c) test generalizations within the
domain of perimeter and area measurement.
Task 5.3: Perimeter increases, area increases?
In Task 5.3, the subjects were asked how they would respond to a Form One student's
claimed regarding the relationships between perimeter and area of a closed figure. The student
claimed that as the perimeter of a closed figure increases, the area also increases. The objective of
this task was to determine the subjects' conceptual knowledge of the relationship between
perimeter and area of regular figures. This task was used to ascertain whether the subjects knew
that there is no direct relationship between perimeter and area. When the perimeter of a figure
increases, the area of the figure may increases, decreases, or remains the same. Ball (1988) found
that some prospective elementary and secondary school mathematics teachers thought that the
area of a figure increases as the perimeter of the figure increases, and vice versa.
Task 5.3 was also used to determine the subjects' ethical knowledge of the relationship
between perimeter and area. This task was used to ascertain whether the subjects test
generalizations within the domain of perimeter and area measurement.
Task 6: Calculating perimeter and area
Task 6.1: Rectangle and parallelogram/triangle
In Task 6.1, subjects were required to help his or her student to calculate the perimeter
and area of the given diagram (Diagram 1) that involved composite figure, namely rectangle and
parallelogram/triangle. The objective of this task was to determine the subjects' procedural
knowledge for calculating perimeter and area for the composite figure. Task 6.1 was used to
determine the subjects‟ linguistic knowledge of standard units of perimeter and area measurement
Page 17
101
by determining whether the subject use the correct standard units of measurement for perimeter
(cm) and area (cm2) when they write the answers for these measurements.
Task 6.1 was also used to determine the subjects‟ strategic knowledge for checking the
correctness of their answers for perimeter as well as area. Task 6.1 was used to determine the
subjects‟ ethical knowledge by ascertaining whether the subjects write units of measurement
upon completing a task. This task was also used to ascertain whether the subjects check the
correctness of their answers.
Task 6.2: Square and trapezium/triangle
In Task 6.2, subjects were required to help his or her student to calculate the perimeter
and area of the given diagram (Diagram 2) that involved composite figure, namely square and
trapezium/triangle. The objective of this task was to determine the subjects' procedural
knowledge for calculating perimeter and area for the composite figure. Task 6.2 was used to
determine the subjects‟ linguistic knowledge of standard units of perimeter and area measurement
by determining whether the subject use the correct standard units of measurement for perimeter
(mm) and area (mm2) when they write the answers for these measurements.
Task 6.2 was also used to determine the subjects‟ strategic knowledge for checking the
correctness of their answers for perimeter as well as area. Task 6.2 was used to determine the
subjects‟ ethical knowledge by ascertaining whether the subjects write units of measurement
upon completing a task. This task was also used to ascertain whether the subjects check the
correctness of their answers.
Task 7: Fencing problem
In Task 7, subjects were required to help his or her student to solve the fencing problem.
The objective of this task was to determine the subjects‟ strategic knowledge for solving the
Page 18
102
fencing problem. Task 7 was also used to ascertain what strategies the subjects have for checking
the correctness of their answer. Task 7 was also used to determine the subjects‟ ethical
knowledge by ascertaining whether the subjects write units of measurement upon completing a
task. This task was also used to ascertain whether the subjects check the correctness of their
answers.
Task 8: Developing area formulae
In Task 8, subjects were asked to show a Form One student the way to develop (derive)
area formulae of a rectangle, parallelogram, triangle, and trapezium. The objective of this task
was to determine the subjects' procedural knowledge of developing or deriving these area
formulae. This task was also used to determine the subjects' conceptual knowledge of the
relationship among area formulae.
Task 8 was also used to determine the subjects' linguistic knowledge based on the
mathematical terms (such as half, length, width, base, height, sum of parallel sides) and symbols
that they employed to develop and explain the meaning of the formulae. Task 8 was also used to
determine the subjects' strategic knowledge of developing or deriving the area formulae as there
was more than one way of doing that. This task was also used to determine the subjects' ethical
knowledge by ascertaining whether the subjects had attempted or taken effort to develop the area
formulae as „doing‟ mathematics also involved the development of area formulae.
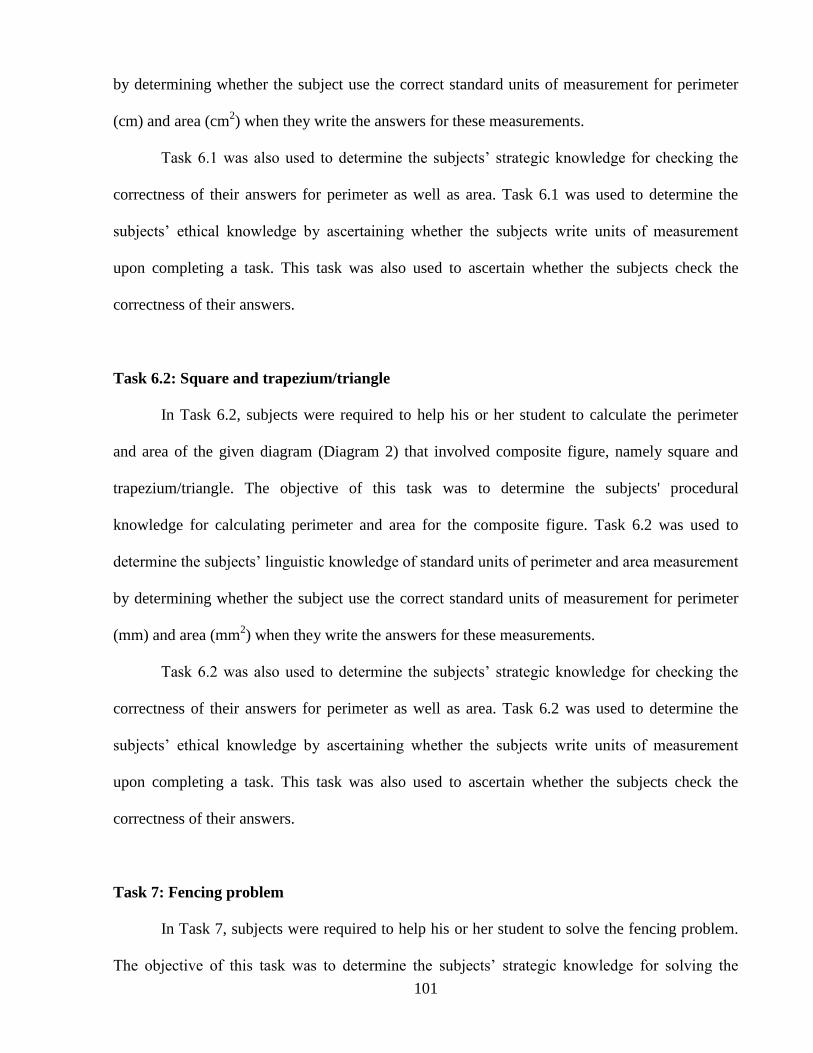
Table 3.3 summarizes the distribution of the five basic types of SMK in the 8 tasks used
for the clinical interview. For the distribution of the components of each type of knowledge that
were assessed during the clinical interview, see Appendix E.
Page 19
103
Table 3.3
Distribution of SMK in the 8 Tasks
Interview Task Conceptual
knowledge
Procedural
knowledge
Linguistic
knowledge
Strategic
knowledge
Ethical
knowledge
1
1.1 x x x
1.2 x x x
2 x x x
2
3.1 x
3.2 x
3.3 x
3.4 x x
3
4 x x
5.1 x x
5.2 x x
5.3 x x
4
6.1 x x x x
6.2 x x x x
7 x x
8 x x x x x
Page 20
104
Pilot Study
Two pilot studies were conducted prior to the actual field of data collection in January
2008. The first pilot study was carried out in October 2006 prior to the vetting of the research
proposal in March 2007. It involved two PSSMTs who had enrolled in a mathematics teaching
methods course at a public university in Peninsula Malaysia. One of them majored in
mathematics and the other one minored in mathematics.
The purpose of this pilot study was to familiarize the researcher with the procedures and
techniques of conducting clinical interview, and to validate the written instruments in terms of
task relevance, content coverage, and language appropriateness. The pilot study also allowed the
researcher to estimate the needed time for each interview and examine the possible responses for
each task of the interviews in order to provide additional probing questions. The tasks were
revised and refined after the first pilot study.
Nevertheless, during the vetting of the research proposal in Mac 2007, the vetting
committee members recommended several constructive amendments to further improve the tasks
of the proposed study. Thus, the tasks were further revised and refined based on the
recommendations from the vetting committee members. The tasks, description of the tasks, Form
One Mathematics Curriculum Specifications, Task Relevance Judgment Form, and Content
Coverage Judgment Form were then submitted to two university lecturers and a secondary school
mathematics teacher to determine the content validity of the tasks (i.e., to determine whether the
tasks were relevant to the topic of perimeter and area and covered the content of the topic of
perimeter and area). They agreed that the tasks were appropriate for the purpose of this study and
suggested that the tasks to be pilot tested.
The tasks were pilot tested in the second pilot study which was conducted in August
2007. The second pilot study also involved two PSSMTs who had enrolled in a mathematics
Page 21
105
teaching methods course at the same public university in Peninsula Malaysia. One of them
majored in mathematics and the other one minored in mathematics. Based on the responses of
these two subjects, the researcher found that the tasks were appropriate in terms of content and
language. These tasks were used in the actual field of data collection in January 2008 (see
Appendix G).
Data Analysis
For the analysis of data in this study, demographic information was drawn from the data
collected from the Background Information Form. The analysis and interpretations of the
preservice secondary school mathematics teachers' SMK of perimeter and area were made using
audiotapes and videotapes of the clinical interview. All interviews data were verbatim
transcribed, coded, categorized, and analyzed.
The data analysis process encompassed four levels. At level one, the audio and video
recording of the clinical interview were verbatim transcribed into written form. The transcription
included the interaction between the researcher and the subject during the interviews as well as
the subject's nonverbal behaviors. At level two, raw data in the forms of transcription were coded,
categorized, and analyzed according to specific themes to produce protocol related to the
description of subjects‟ SMK of perimeter and area. Specifically, to answer research question
one, the nature of the subjects‟ SMK of perimeter and area were coded, categorized, and analyzed
based on the respective components of its five basic types of knowledge of perimeter and area,
namely conceptual knowledge, procedural knowledge, linguistic knowledge, strategic
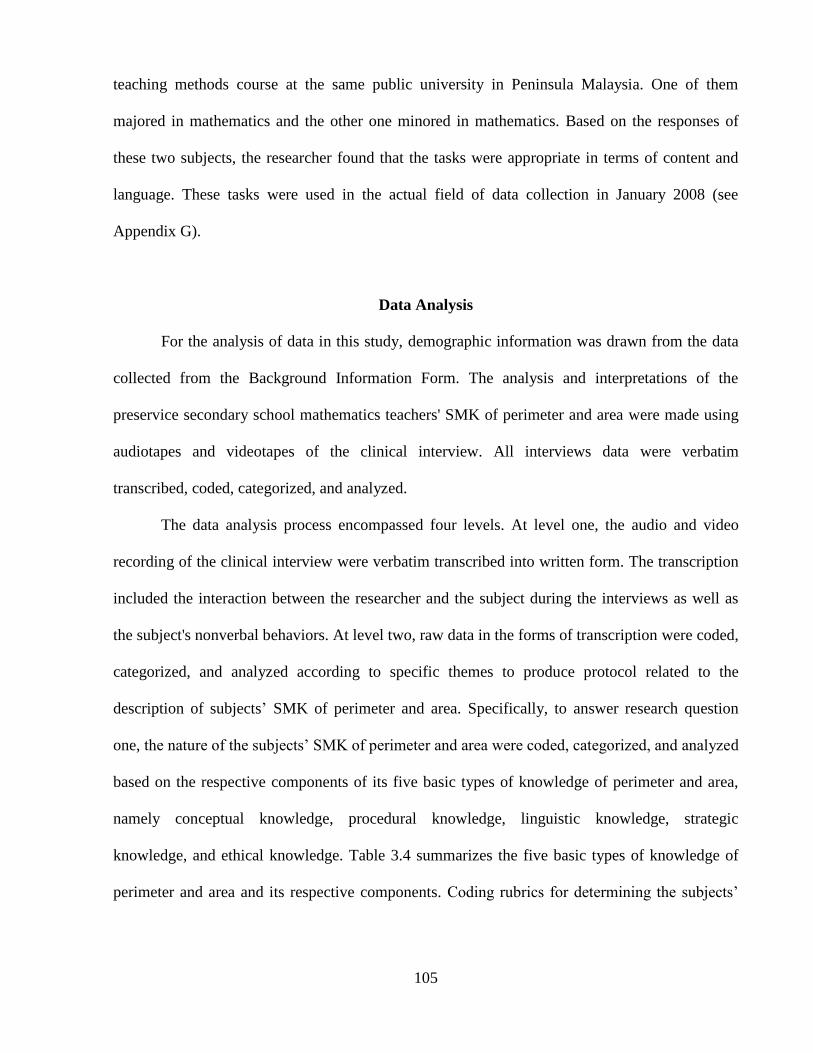
knowledge, and ethical knowledge. Table 3.4 summarizes the five basic types of knowledge of
perimeter and area and its respective components. Coding rubrics for determining the subjects‟
Page 22
106
SMK of perimeter and area was devised to facilitate the coding, categorization, and analysis
processes of each subject‟s SMK of perimeter and area (see Appendix J).
Table 3.4
Summary of the Five Basic Types of Knowledge of Perimeter and Area and its Respective
Components
Type of knowledge Its components Conceptual knowledge
Precedural knowledge
Linguistic knowledge
Strategic knowledge
Ethical knowledge
1. Notion of perimeter 2. Notion of area
3. Notion of the unit of area
4. Number of units and unit of measure 5. Inverse relationship between number of units and unit of measure
6. Relationship between standard units of length (linear units)
7. Relationship between standard units of area (square units) 8. Relationship between area units and linear units
9. Relationship between perimeter and area
10. Relationship among area formulae
1. Converting standard units of area measurement
2. Calculating perimeter of composite figures 3. Calculating area of composite figures
4. Developing area formulae
1. Mathematical symbols
2. Mathematical terms
3. Standard unit of length measurement (linear units) 4. Standard unit of area measurement (square units)
5. Conventions of writing and reading SI area measurement
1. Strategies for comparing perimeter
2. Strategies for comparing area
3. Strategies for checking answer for perimeter 4. Strategies for checking answer for area
5. Strategies for solving the fencing problem
6. Strategies for checking answer for the fencing problem 7. Strategies for developing area formulae
1. Justifies one‟s mathematical ideas 2. Examines pattern within the domain of perimeter and area measurement
3. Formulates generalization within the domain of perimeter and area measurement
4. Tests generalization within the domain of perimeter and area measurement 5. Develops area formulae
6. Writes units of measurement upon completed a task
7. Checks the correctness of their solutions or answers
To answer research question two, each subject‟ levels (low, medium, high) of SMK of
perimeter and area was analyzed in terms of its level of each of the five basic types of knowledge,
namely levels of conceptual knowledge, procedural knowledge, linguistic knowledge, strategic
knowledge, and ethical knowledge as well as the overall level of SMK that were identified from
the clinical interview. Procedure for determining the overall level of each subject's SMK of
perimeter and area was devised using coding rubrics adapted from the Learning Mathematics for
Teaching (LMT) (2006) project which consists of four principal investigators, namely Hill, Ball,
Page 23
107
Bass, and Schilling, from the School of Education, University of Michigan. For the detail of the
description of the procedure, see Appendix K. Based on this procedure, coding rubrics for
determining overall level of each subject‟s SMK was constructed (see Appendix L).
At level three, case study for each subject was constructed based on information from the
written protocol (see Appendix N). At this level, analysis was carried out to describe each
subject's behaviors in solving every tasks or problems. At level four, cross-case analysis was
conducted (see Chapter 4). The analysis aimed to identify pattern of responses of SMK of
perimeter and area held by the subjects. Based on this pattern of responses, preservice secondary
school mathematics teachers' SMK of perimeter and area were summarized.
Content Validity
In general, content validity demonstrates the degree to which the sample of questions or
tasks on a test or instrument is representative of some defined universe or domain of content
(Hogan, 2007; McMillan, 2001; Popham, 2000). Usually, a panel of experts can be asked to
review the instrument, questions by questions, to see if all the questions satisfactorily represent
the domain of content involved. The judgmental procedures can be gathered systematically. A
panel of knowledgeable individuals can be asked to decide: (a) whether each question represents
the designated assessment domain or topic, and (b) the extent to which the assessment domain‟s
important components have been measured by the questions (Popham, 2000).
The panel of experts in the present study consisted of two university lecturers and a
secondary school mathematics teacher. The university lecturers specialized in mathematics
education, and measurement and evaluation in education, respectively. The mathematics teacher
has more than twenty years of experience in teaching secondary school mathematics. The clinical
interview tasks, description of the tasks, Form One Mathematics Curriculum Specifications, Task
Page 24
108
Relevance Judgment Form, and Content Coverage Judgment Form were given to each of the
panel of experts to determine the content validity of the tasks (i.e., to determine whether the tasks
were relevant to the topic of perimeter and area and covered the content of the topic of perimeter
and area). The Task Relevance Judgment Form was used to examine the tasks in terms of its
relevance to the topic of perimeter and area while the Content Coverage Judgment Form was
used to examine the content coverage of the tasks to the topic of perimeter and area.
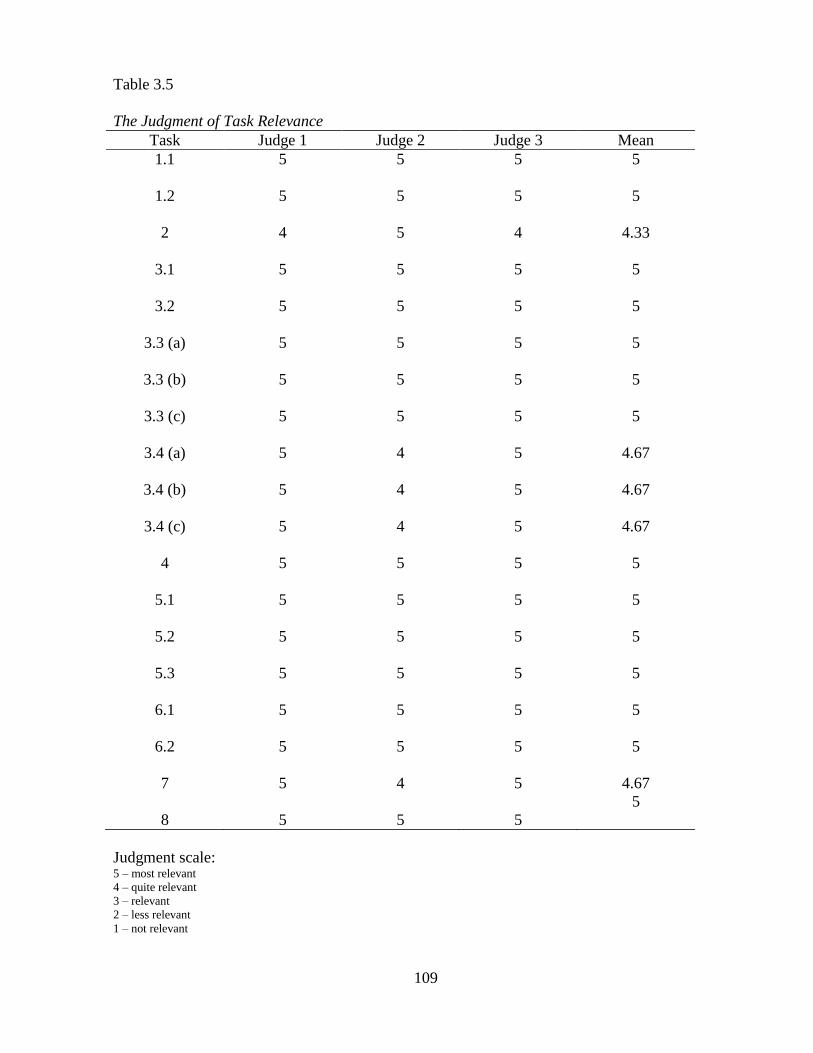
Table 3.5 shows the result of the judgment of task relevance by each panel of expert and
the mean value of the judgment on each task. It was apparent that all the values of judgment
assigned by the three panels of expert were at least 4 and the mean value of the judgment on each
task were more than 4. Thus, it can be concluded that all the tasks were very relevant to the topic
of perimeter and area.
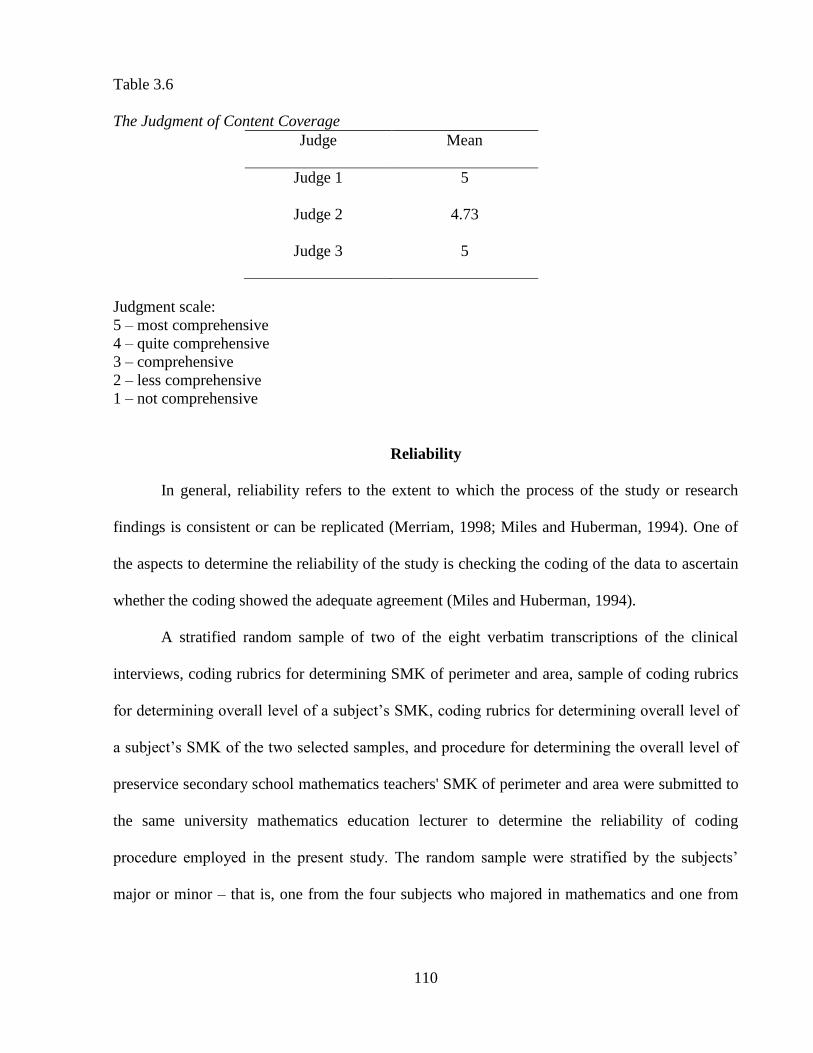
Table 3.6 depicts the mean value of judgment assigned by the three panels of expert
regarding the content coverage of the task. It was obvious that all the mean values of judgment
were more than 4. Thus, it can be concluded that all the tasks covered the topic of perimeter and
area very comprehensively. As a conclusion, the result of the task relevance and content coverage
judgment by the panel of experts demonstrates that the interview tasks in this study contained a
high degree of content validity.
Page 25
109
Table 3.5
The Judgment of Task Relevance
Task Judge 1 Judge 2 Judge 3 Mean
1.1
1.2
2
3.1
3.2
3.3 (a)
3.3 (b)
3.3 (c)
3.4 (a)
3.4 (b)
3.4 (c)
4
5.1
5.2
5.3
6.1
6.2
7
8
5
5
4
5
5
5
5
5
5
5
5
5
5
5
5
5
5
5
5
5
5
5
5
5
5
5
5
4
4
4
5
5
5
5
5
5
4
5
5
5
4
5
5
5
5
5
5
5
5
5
5
5
5
5
5
5
5
5
5
4.33
5
5
5
5
5
4.67
4.67
4.67
5
5
5
5
5
5
4.67
5
Judgment scale: 5 – most relevant
4 – quite relevant
3 – relevant
2 – less relevant
1 – not relevant
Page 26
110
Table 3.6
The Judgment of Content Coverage
Judge Mean
Judge 1
Judge 2
Judge 3
5
4.73
5
Judgment scale:
5 – most comprehensive
4 – quite comprehensive
3 – comprehensive
2 – less comprehensive
1 – not comprehensive
Reliability
In general, reliability refers to the extent to which the process of the study or research
findings is consistent or can be replicated (Merriam, 1998; Miles and Huberman, 1994). One of
the aspects to determine the reliability of the study is checking the coding of the data to ascertain
whether the coding showed the adequate agreement (Miles and Huberman, 1994).
A stratified random sample of two of the eight verbatim transcriptions of the clinical
interviews, coding rubrics for determining SMK of perimeter and area, sample of coding rubrics
for determining overall level of a subject‟s SMK, coding rubrics for determining overall level of
a subject‟s SMK of the two selected samples, and procedure for determining the overall level of
preservice secondary school mathematics teachers' SMK of perimeter and area were submitted to
the same university mathematics education lecturer to determine the reliability of coding
procedure employed in the present study. The random sample were stratified by the subjects‟
major or minor – that is, one from the four subjects who majored in mathematics and one from
Page 27
111
the four subjects who minored in mathematics so as to acquired an equal representation of
responses from each category of subject (Gay & Airasian, 2003).
The reliability is necessary for the coding procedure. The mathematics education lecturer
provided his professional assistance in checking the researcher‟s coding work. “In this situation,
it was considered to be the closest approach to encode as objectively as possible” (Lee, 2002, p.
91). In general, the mathematics education lecturer strongly agreed with the coding work which
was done on the verbatim transcriptions of the clinical interviews.