CHAPTER 08 Trade and Payments The global economy continued to grow at a slow pace during 2015, accompanied by sluggish aggregate demand, declining commodity prices and increasing financial market instability in major economies. Growth of world trade decelerated, due to declining import demand in Europe, and weak aggregate demand in the United States and Japan. As a result, developing countries and economies in transition have seen demand for their exports weaken. Lower export earnings, compounded by domestic demand constraints have also pushed down trade and GDP growth in many developing countries and economies in transition during 2015. The trend of falling exports is being witnessed in developed, emerging, and developing economies. The exports have fallen in USA 7.1 percent, European Union 12.5 percent, China 2.9 percent and India 17.2 percent. However Bangladesh exports grew by 8.1 percent in 2015 as per WTO statistics. Pakistan's export volumes depend (among others) on its competitiveness (market share effect) and on the development in world GDP at constant prices (market volume effect). Pakistan's export volume is estimated to have an elasticity of higher than one with respect to world GDP. Therefore, recent trade data also reflect the dynamics in world economic growth. As discussed above, Pakistan’s major trading partners like US, China, EU witnessed a sluggish economic growth during past few years. Major chunk of exports go to US, China and EU. Therefore, slow down in China and European economies and weak demand have significantly impacted Pakistan’s export growth. Box Item-1: Shares of Pakistan’s Exports in Total World Exports for Selected Commodity Groups Shares in Values USD in percent Selected Commodities Food Cotton Yarn Woven Fabric Special Worn Fabric Clothing, bed linen Carpets, Rugs Rice 2010 13.3 9.0 3.4 15.5 6.0 11.2 2011 15.0 10.3 1.7 14.4 5.8 8.7 2012 16.6 12.3 6.9 13.9 7.9 7.9 2013 14.6 13.2 3.2 14.1 7.8 8.4 2014 13.7 12.2 4.4 14.5 7.6 8.5 Shares in Volumes Kgs in percent Selected Commodities Food Cotton Yarn Worn Fabric Special Worn Fabric Clothing, bed linen Carpets, Rugs Rice 2010 14.4 n.a. 2.5 23.4 n.a. 12.0 2011 17.2 n.a. 2.0 19.1 n.a. 8.5 2012 21.7 n.a. n.a. 19.9 n.a. 10.3 2013 19.9 12.7 2.7 20.9 n.a. 9.6 2014 18.4 13.6 3.8 22.4 n.a. 8.7 The above table shows Pakistan’s exports of selected commodities as a percentage of total world exports for these commodities, both in terms of values and in terms of volumes. The commodities selected represent some of the
Transcript
CHAPTER 08
Trade and Payments The global economy continued to grow at a slow pace during 2015, accompanied by sluggish aggregate demand, declining commodity prices and increasing financial market instability in major economies. Growth of world trade decelerated, due to declining import demand in Europe, and weak aggregate demand in the United States and Japan. As a result, developing countries and economies in transition have seen demand for their exports weaken. Lower export earnings, compounded by domestic demand constraints have also pushed down trade and GDP growth in many developing countries and economies in transition during 2015.
The trend of falling exports is being witnessed in developed, emerging, and developing economies. The exports have fallen in USA 7.1 percent, European Union 12.5 percent, China 2.9 percent
and India 17.2 percent. However Bangladesh exports grew by 8.1 percent in 2015 as per WTO statistics.
Pakistan's export volumes depend (among others) on its competitiveness (market share effect) and on the development in world GDP at constant prices (market volume effect). Pakistan's export volume is estimated to have an elasticity of higher than one with respect to world GDP. Therefore, recent trade data also reflect the dynamics in world economic growth.
As discussed above, Pakistan’s major trading partners like US, China, EU witnessed a sluggish economic growth during past few years. Major chunk of exports go to US, China and EU. Therefore, slow down in China and European economies and weak demand have significantly impacted Pakistan’s export growth.
Box Item-1: Shares of Pakistan’s Exports in Total World Exports for Selected Commodity Groups
Shares in Values USD in percent Selected Commodities Food Cotton Yarn Woven
The above table shows Pakistan’s exports of selected commodities as a percentage of total world exports for these commodities, both in terms of values and in terms of volumes. The commodities selected represent some of the
Pakistan Economic Survey 2015-16
128
most import export products of Pakistan. These shares were calculated over the period 2010 – 2014, where 2014 is the most recent period for which the data on world exports for these commodities are available in the United Nations Comtrade database.
In terms of values (expressed in USD), Pakistan’s exports in 2014 of cotton yarn represented 13.7% of total world exports of cotton yarn. Also Pakistan’s exports of woven fabrics and other clothing (including bed linen) made up more than 10% of total world export values for these products. Although these shares of Pakistan’s exports vary from year to year, there are no fundamental changes in the trends to be observed in Pakistan’s export performance in these product categories. The most important food item in Pakistan’s exports is rice. In 2014 Pakistan’s exports of rice represented 8.5% of the total values of world rice exports.
In terms of volumes (measured in Kgs), a similar picture emerges. In 2014, for cotton yarn, woven fabrics and other clothing (including bed linen) Pakistan’s export shares largely exceeded 10% of the volume of total world exports in these product groups. The share of Pakistan’s rice exports stood at 8.7% of world export volume.
Source: United Nations Commodity Trade Statistics Database (Comtrade). Trends in Exports
During recent years, Pakistan exports recorded a sluggish growth. The exports target for FY2016 was set at US$ 25.5 billion. Exports during July-Mar FY2016 remained at US$ 15.6 billion as compared to US$ 17.9 billion in July-Mar FY2015, decline of 12.9 percent. The main reasons for lower performance of exports are generally weak external demand, slowdown in economic growth of China, lost textile share to new competitors in international markets,and unfavourable terms of trade for exports with little value added.
For the last few years Pakistan’s exports are showing declining trend. Global trade without any quota restrictions has created opportunities for developing and emerging economies. Some countries availed this opportunity and consolidated their exports,whereas others failed to take advantage. Pakistan was among the latter category. India, Bangladesh,Combodia,and Vitnem doubled their exports. However, it is observed that since last two years, slowdown in global economy has also adversely affected the exports of regional countries. India‘s export declined by 17.2 percent in FY2016 as compared to 1.3 percent decline in FY2015.
Lower trend in exports are the results of both supply and demand side factors. On supply side, structural impediments in commodity producing sector, higher cost of production, low level skill and in-competitiveness have also hurled the exports. Investment in exporting sectors has remained disturbingly low, as a cut-throat competition with countries like Vietnam and
Bangladesh, gives tough time to Pakistan’s exports.
On the demand side, the major factors impeding Pakistan’s exports growth is the slump in the economies of major trading partners, like China and EU. In case of USA, although its import demand remained modest through these years, Pakistan has not been able to supply into this market due to change in market preferences.
To enhance exports the government has announced a number of initiatives in the Budget 2015-16 which included establishment of Exim Bank which will be helpful in enhancing export credit and reducing cost of borrowing for exporting sectors on long term basis and help reduce their risks through export credit guarantees and insurance facilities. The government through the State Bank of Pakistan had arranged to reduce its mark-up rate on Export Refinancing Facility (EFR) from 9.0 percent in 2010 to 7.5 percent in 2014 which was further reduced in February 2015 to 6.0 percent and further reduced to 4.5 percent from July 2015 till date. Similarly Long Term Financing Facility (LTFF) for 3-10 years duration from around 11.4 percent to 9.0 percent and further reduced to 7.5 percent in February 2015 and further reduced to 6.0 percent in July 2015 till date, to allow export sector industries to make investments on competitive basis.
A Cabinet sub-Committee comprising members of M/o Commerce, Planning & Development, Industries and Privatization, Parliamentary Secretaries of Finance and Industries & Production also formed under the chairmanship of the Finance Minister to accord greater attention to
Trade and Payments
129
exports related production sector. The Committee has been tasked to device steps and measures which could enhance exports in short-term on one hand and deepen the orientation of economy towards exports on the other-hand. The Sub-
committee is proactively working on the assigned task to increase export level of the country. The government also announced STPF 2015-18 for the exports enhancement.
Box-II: Strategic Trade Policy Framework 2015-18
Ministry of Commerce has launched Strategic Trade Policy Framework (STPF) 2015-18 on March 22, 2016. Its successful implementation would enable Pakistani firms to produce and export more sophisticated and diversified range of products to more markets and it will also help to reduce unemployment and poverty in Pakistan.
The STPF 2015-18 aims to achieve following targets:
� Enhancement of annual exports to US $ 35 billion.
� Improve Export Competitiveness.
� Transition from ‘factor-driven’ economy to ‘efficiency-driven’ and ‘innovative-driven’ economy.
� Increase share in regional trade.
To achieve the above targets, some key enablers are vital to increase productivity and competitiveness and resultantly enhance exports. The key enablers are categorized into four groupings i.e.
� Competitiveness
� Compliance to Standards
� Policy Environment
� Market Access.
The elements of STPF 2015-18 assert to strengthen different aspects of Pakistan’s export competitiveness directly or indirectly. These elements have been identified on the basis of key enabler, an evaluation of STPF 2012-15, an analysis of emerging global trade scenario and extensive consultation with the private sector and other stakeholders. STPF 2015-18 has four pillars
� Product sophistication and diversification
� Market Access
� Institutional development and strengthening
� Trade and facilitation.
Source: Ministry of Commerce.
Structure of Exports During July – March FY2016, the exports reached to US$15.6 billion dollars as compared to US$ 17.9 billion of the same period last year, showing a decline of 12.9 percent. Analysis of group-wise exports suggests that Food group registered a
decline of 11.6 percent during July – March FY2016 compared to the same period last year. Within food group, rice export declined by 12.3 percent in value, despite favorable 7.6 percent growth in quantity. (Table 8.1)
Table 8.1: Structure of Exports (US$ Million) Particulars July-March
Values in Dollars % Change in values
July-March Quantity
% Change in quantity
2014-15 2015-16 P 2014-15 2015-16 P Total 17,921.2 15,606.2 -12.9 - - -
Source : PBS The Basmati rice declined by 27.9 percent in value and 7.5 percent in quantity. While others variety under rice group witnessed a decline of 5.9 percent in value and improved by 9.9 percent in quantity, compared to the corresponding period last year. Fish & fish preparation also declined by 5.3 percent in value and 7.3 percent in quantity, compared to last year. Export of sugar declined by both in quantity and value i.e.; 35.6 percent in quantity and 36.4 percent in value, compared to last year. The exports of spices remained
favorable by 17.8 percent in value and 7.5 percent in quantity during the period.
Export earnings from fruits also registered a decline of 5.3 percent in value and 10.9 percent in quantity, while vegetables also witnessed a decline of 5.4 percent in value and 4.8 percent in quantity. Meat and Meat preparation, however, posted a growth of 16.8 percent in value, and 7.8 percent growth in quantity during July – March FY2016 as compared to the corresponding period last year. This may be on account of government’s
Trade and Payments
131
initiatives and incentives provided to livestock sector.
Textile group, which has 60 percent share in total exports, witnessed a decline of 8.2 percent during July–March FY2016 compared to the corresponding period last year. The exports of intermediate commodity like cotton yarn witnessed decline in value and quantity by 32.5 percent and 31.9 percent, respectively. One reason is that China has continued to reduce its demand for yarn and fabric. Cotton cloth export declined by 10.1 percent in value, however in quantity a positive growth of 2.5 percent is recorded during July – March FY2016 as compared to same period last year. The raw cotton declined by 46.9 percent in value and 46.5 percent in quantity during July-March FY 2016, but on month on month ( February-March) basis its exports increased by 25.2 percent in value and 20.2 percent in quantity. Knitwear registered a decline of 2.1 percent in value but posted a growth of 9.7 percent in quantity during July-March FY 2016 over the same period last year. On month on month in March its value declined by 0.5 percent and quantity improved by 10.1 percent. Export of bed-wear also declined by 4.1 percent but a slight growth of 0.7 percent was observed in quantity during July–March FY2016 as compared to corresponding period last year. Shrinking global demand has affected the export of textile items.
Export earnings of readymade garments and towels grew by 4.2 percent, and 0.2 percent respectively, in value and 1.6 and 3.1 percent in quantity during July-March FY2016 compared to same period last year. The grant of GSP status by EU has a positive impact on these two items both in value and quantity. Whereas exports of towels on month on month increased by 0.6 percent in value and 4.8 percent in quantity.
During July – March FY2016 petroleum and coal groups exports recorded a decline of 74.7 percent over the corresponding period on account of 99.5 percent decline in Petroleum Naphtha exports from US$ 236.3 million in FY2015 to US$ 1.1 million in FY2016. However, on month on month the petroleum and coal group witnessed a growth of 394.1 percent in value. Petroleum crude also registered a negative growth of 58.7 percent in
value and decline by 22.2 percent in quantity during July–March FY 2016 over the same period last year, while on month on month in March it increased by 100 percent both in value and quantity.
During July–March FY2016 other Manufacturers Group also posted a negative growth of 16.4 percent against same period last year. While on month on month in March it declined by 4.5 percent. Carpets, rugs and mats registered negative growth both in value and quantity by 20.3 percent and 26.5 percent respectively, during July-March FY2016 compared to the same period last year. In past Pakistan’s carpets had enormous demand in international markets, but shortage of skilled labor force and failure to cope with the changing trends in world markets has affected the carpets demand and exports. The decline of 27.2 percent is witnessed in Leather Tanned in value and 26.0 percent in quantity, but on month on month it witnessed sharp increase in quantity and value by 30.0 percent and 23.0 percent, respectively. On the other hand, surgical goods and medical instruments recorded a positive growth of 3.1 percent in value during July– March FY2016 over the same period last year. Sports goods posted a slight decline of 1.6 percent in value during July-March FY2016 against the same period last year; while on month on month it registered a growth of 2.3 in value. The export of football during July-March FY2016 increased by 3.2 percent in value and 17.4 percent in quantity, but on month on month it improved by 2.6 percent in value and in quantity declined by 4.8 percent. Canvas footwear and other footwear registered a growth of 64.3 percent and 0.6 in value and 58.2 percent and 6.1 percent in quantity during July-March FY2016 against the same period last year. Likewise on month on month it increased by 38.2 percent and 2.0 percent in value and 121.4 and 12.0 percent in quantity, respectively.
The other non-traditional items like plastic material and pharmaceutical products witnessed an increase of 15.2 percent and 22.6 percent in value and 1.9 and 17.4 percent in quantity on month on month.
Under other items, the Gems during the period July-March FY2016 declined by 50.0 percent in
Pakistan Economic Survey 2015-16
132
value and 36.4 percent in quantity, but on month on month it improved by 35.0 percent in value. The cement although witnessed a decline by 28.9 percent in value and 24.3 percent in quantity
during the period under review but on month on month it increased by 0.8 in value and 2.9 percent in quantity.
Box-III: Evaluation of Pakistan’s exports to European Union (EU) under the GSP Plus regime
Pakistan’s exports to EU Calendar year 2005 – 2014 Pakistan’s exports to EU member states increased from US$ 4.25 billion in 2005 to US$ 6.21 billion in 2013. The Compound Annual Growth Rate (CAGR) of exports to EU has been 4.85 % only. However as a result of grant of GSP Plus to Pakistan by EU, Pakistan’s exports to EU during the year 2014 amounted to US$ 7.54 billion.
Impact of GSP Plus on Pakistan’s exports to EU As a result of GSP Plus Pakistan’s exports to EU have increased from US$ 6.21 billion during 2013 to US$ 7.54 billion in 2014. However, exports witnessed decline of US$6.73 billion in 2015, mainly due to financial crisis in EU countries and depreciation of Euro against Dollar (and Pak- Rupee).
Month Pak exports to EU 2013 (USD million)
Pak exports to EU 2014 (USD million)
Pak exports to EU 2015 (USD million )
January 533.88 694.98 593.98
February 502.65 552.21 546.93
March 514.63 611.48 616.27
April 564.52 593.45 524.60
May 506.03 606.79 525.79
June 495.73 625.42 594.15
July 588.48 703.29 608.64
August 538.72 622.44 544.44
September 521.12 664.14 597.12
October 541.62 711.29 527.39
November 483.37 558.37 511.41
December 426.61 594.06 541.69
Total 6,217.36 7,537.93 6732.41
0100
200300400500
600700800
Janu
aray
Feb
raur
y
Mar
ch
Apr
il
May
June
July
Aug
ust
Sep
tem
ber
Oct
obe
r
Nov
embe
r
Dec
embe
r
Fig- Comparision of Month Wise Exports to EU (US $ Million) 2013 2014 2015
Trade and Payments
133
Analysis of Competitors (US $ Billions) Countries Exports to EU
1. Impact of GSP Plus on exports of Textile products to EU
Pakistan’s exports of Textile products to EU in 2014 amounted to US$ 5.33 billion. This represents an increase of US$ 1.02 billion as Pakistan’s exports of Textiles to EU as in 2013 it amounted to US$ 4.31 billion. This represents an increase in exports by 23.61%. Sector wise break up is given below:
The monthly exports for the period July-March FY2016 remained mostly below the
corresponding months of last year, averaging $ 1734.9 million per month as against an average of $1991.2 million last year. (See Table 8:2)
Table 8.2: Monthly Exports Month ($ Million)
2014-15 2015-16 P July 1923 1588
August 1902 1830
September 2175 1726
October 1951 1722
November 1958 1659
December 2149 1782
January 2058 1768 February 1880 1791
March 1926 1742
Monthly Average 1991 1734 Source: PBS P : Provisional
Pakistan Economic Survey 2015-16
134
Concentration of Exports
Pakistan’s exports are highly concentrated in few items like cotton & cotton manufactures, leather, rice, and few more items. The first three categories of exports accounts for 71.5 percent of total exports during July-March FY2016 with
cotton & cotton manufacture alone contributing 58.1 percent. Traditionally the contribution of these three categories was 68.8 percent during the same period last year, and 65.8 percent during FY 2014.The bifurcation of these items in Table 8.3 shows that exports in these few items are the major factor for lower export earnings.
Sub-Total of three Items 66.4 66.0 62.7 64.1 65.8 67.8 68.8 71.5 Other items 33.6 34.0 37.3 35.9 34.2 32.2 31.2 28.5
Total 100.0 100.0 100.0 100.0 100.0 100 100.0 100.0 P : Provisional, ** Leather & Leather Manufactured. Source: Pakistan Bureau of Statistics Direction of Exports
Although Pakistan trades with a large number of countries; its exports are highly concentrated in few countries. About 60 percent of Pakistan’s exports go to ten countries namely, USA, China, UAE, Afghanistan, UK Germany, France, Bangladesh, Italy and Spain. Furthermore, the USA has largest share in export by 17 percent followed by European countries 22 percent, in total exports. The table suggest that our exports to China has been dropped from 10 percent in FY 2014 to 8 percent in FY 2016 while compare to import in table 8.7 the import share improved
from 17 percent in FY2014 to FY2016 (July-March) to 27 percent which suggests that FTA signed with China apparently is not supportive and need a careful impact assessment. The share of exports to Afghanistan in total exports, however, witnessed a decline in recent years from 8 percent in 2014-15 to 7 percent during current year. Likewise the share of exports to UAE also dropped from 7 percent in FY2014 to 4 percent in FY2015 and remained the same in FY2016 .The share of exports to EU countries like France, Italy, Spain, etc. remained relatively stagnant. Major export markets of Pakistan and their share is given in Table: 8.4
1000
1200
1400
1600
1800
2000
2200
2400
JUl 1
4
Aug
14
Sep
14
Oct
14
Nov
14
Dec
14
Jan
15
Feb
15
Mar
15
Apr
15
May
15
Jun
15
JUl 1
5
Aug
15
Sep
15
Oct
15
Nov
15
Dec
15
Jan
16
Feb
16
Mar
16
$ M
illio
n
Fig-8.1 Monthly Exports
Trade and Payments
135
Table 8.4 : Major Exports Markets (Rs. & US$ Billion & Percentage Share) Country
Like other developing countries, Pakistan also benefitted by the falling global oil and commodity prices. This steep fall of oil prices is clearly reflected in Pakistan’s overall import bill which resulted in US $ 3.3 billion saving, from import of petroleum products, Pakistan’s overall import remained 4.3 percent less during July-March FY2016 compared to the same period last year.
Imports target was set at $43.2billion (an increase of 6 percent) during FY2016. In July-March FY2016, import remained 4.3 percent down compared to same period last year.
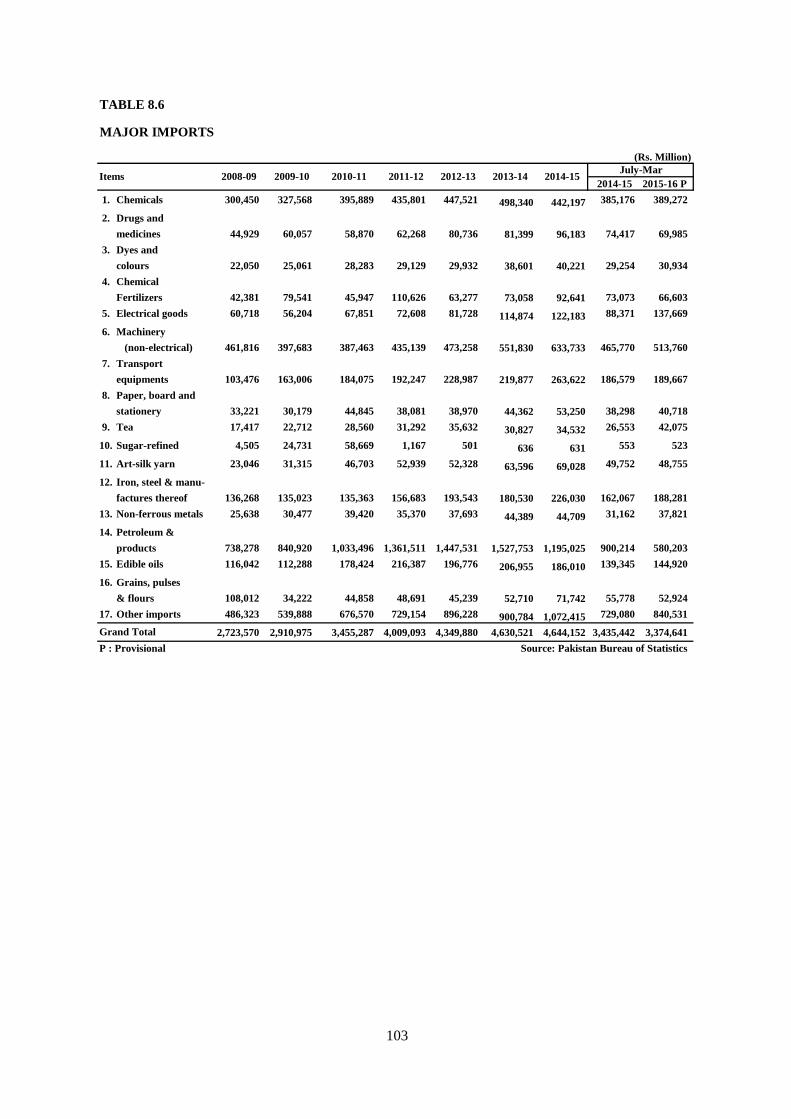
Group-wise data on imports shows that the petroleum, transport and agriculture imports
recorded decline during July-March, FY2016, which partially has been offset by the rise in food, machinery, textile and metal imports during first nine months of FY2016 as compared to same period last year
Food group generally constitute around 12.0 percent of the total import bill. In the first nine month July-March FY2016 the food group witnessed an increase of 2.7 percent. Import of food group reached at US$ 3938.9 million during July-March, FY2016 from US$ 3835.9 million during comparable period last year. The Palm oil import, the heaviest item in food group, declined by 7.4 percent despite significant increase of 19.6 percent in quantity. The decline in palm oil imports is attributed to both higher quantum and
15%
9%
4%
8%
7%
5%
2%3%
3%3%
41%
Share of Exports (July-March FY 2015)
U.S.A
China
U.A.E
Afghanistan
United Kingdom
Germany
France
Bangladesh
Italy
Spain
All Other
17%
8%
4%
7%
8%5%2%3%
3%
4%
39%
Share of Exports (July-March FY 2016)
U.S.A
China
U.A.E
Afghanistan
United Kingdom
Germany
France
Bangladesh
Itlay
Spain
All others
Pakistan Economic Survey 2015-16
136
lower price. A reduction in export duty by Malaysia (the largest producer and exporter of palm oil), could be the primary reason behind the lower prices in the international markets. Other observable items in this group are the import of pulses, tea and milk & related items whose imports surged by 56.2 percent, 53.9 percent and 2.4 percent, respectively. (Table: 8.5)
A surge of 56.2 percent is witnessed in import value of pulses from US$ 284.4 million in July-March FY2015 to US$ 444.4 million in July – March FY2016. Pakistan imports large quantities of pulses to fill the increasing gap between domestic production and demand. Pulses import value increased due to higher import quantity (50.9 percent) of this item during July – March FY2016 over the same period last year. Higher import bill of pulses is also due to increase in international prices of pulses, particularly in Australia and Canada from where we import the maximum pulses. In India the production of
pulses were not to desired level and India being the largest importer of pulses has created pressure on the demand and supply. Pakistan also imports large quantity of pulses but owing to higher prices the import bill of pulses has increased. Moreover, increase in import bill of tea comes from both quantity and price, 53.9 percent in value, and 13.9 percent in quantity, during July – March FY2016 over the same period last year. Pakistan is the 8th largest importer and consumer of tea. Almost the entire tea demand is meeting through imports from Kenya. Moreover a high demand for tea is also one of the main reasons for increasing tea import bill. Tea has become a part of our culture and to some extent it can be considered as a national drink. On average a Pakistani individual consume 2-3 kg of tea in a year. So increasing population led to increase in import of tea. Milk products import bill also increased by 2.4 percent in value and 4.6 percent in quantity during July – March FY2016 over the corresponding period last year. (Table: 8.5)
Table 8.5: Structure of Imports (US$ Million) Particulars July-March
Plastic Material 1,301.8 1,313.7 0.9 795,512 712339 -10.5
Iron & steel Scrap 752.2 776.9 3.2 2,123,725 2702896 27.3
Iron & steel 1,290.3 1,441.1 11.6 1,712,287 2227717 30.1
F. Telecom 1,070.8 1,047.5 -2.2 - - -
G. All other items 8761.6 9175.1 4.7 - - -
Source : PBS Import of crude oil and petroleum products which generally constitute about 17.2 percent of total import bill of Pakistan. Petroleum group declined by 37.2 percent (US$ 5583.2 million) in July-March FY2016 as compared to US$ 8896.6 million of the corresponding period last year. Crude oil import in quantity terms increased by 11.6 percent whereas its import value decreased by 42.7 percent because of decline in the international prices during this period. Between July-March FY2016, international crude oil prices declined by 30 percent from US$ 55 per barrel to US$ 39 per barrel. Moreover, slump in international commodity prices have been witnessed all over the world. Import value of petroleum products decreased by 34.2 percent given that its imported quantity also decreased by only 3.3 percent.
The machinery group contributed about 19.1 percent in the total import bill. Import of Machinery group increased by 14.1 percent from US$ 5,447.4 million in July–March FY2015 to US$ 6,212.9 million in July–March FY2016. Import bill of power generating machinery recorded at US$ 1332.7 million during July–March FY2016 as compared to US$ 934.1 over the same period last year, showing an increase of
42.7 percent reflecting key investment in power sector. Similarly a surge of 51.2 percent (US$ 1320.4 million) is witnessed in Electrical machinery & Apparatus during July–March FY2016 over (US$873.2 million) of the corresponding period last year, on month on month in March the Electrical machinery and apparatus increased by 11.0 percent. Construction and mining machinery witnessed an increase of US$ 228.5 million in FY2016 as compared to US$ 199.2 million as compared to same period last year, reflecting an increase of 14.7 percent in value whereas month on month in March it increased by 44.4 percent. The increase in import of machinery is a good sign as it reflects the growth of economic activities in the country. Another factor attributed to growth in machinery is due to credit expansion to private sector. A welcome development is the increase in net fixed investment. The firms are availing credit for building, modernization and rehabilitation of their industrial unit and other allied sector. The continued increase in public sector spending for the infrastructure, power and other sectors development along with under CPEC programme has created a huge demand and increase construction related activities manifold which led
Pakistan Economic Survey 2015-16
138
to increase in import of construction related machinery and other items. The import bill of textile machinery registered a decline of 1.2 percent (US$ 332.1million) during July-March FY2016 against (US$ 336.1 million) the same period last year. Telecom sector import within machinery group, declined by 2.2 percent (US$ 1047.4 million) during first nine months of the current fiscal year compared with (US$ 1070.8 million) the corresponding period last year. Most of the increase is seen in import of which Mobile phones in Pakistan increased by 6.2 percent during the current financial year 2016 (July-March) as compared to the same period last year. Total imports of mobile phones stood at US$ 573.3 million while these were US$ 539.6 million in the same period last year. The import bill for mobile phones is likely to grow as smart phone adoption in Pakistan is expected to grow due to expanding 3G and 4G networks, and more affordable smart phones are available in the market. Within machinery group, other sub items such as agricultural machinery witnessed a decline of 20.0 percent (US$ 62.5 million) during July-March, FY2016 over (US$ 78.1 million) the same period last year.(Table:8.5)
A slight decrease of 0.6 percent is witnessed in import bill of transport group from US$ 1915.8 in July-March, FY2015 to US$ 1904.6 in July-March, FY2016. Import of road motor vehicle increased by 24.5 percent, CKD/SKO increased by 16.1 percent, buses increased by 31.8 percent, motor cars and motor cycles increased by 9.6 percent, 19.3 percent respectively, during the first nine months of current fiscal year over corresponding period last year reflecting an expansion and growth of manufacturing activities in the country. Import of all other important items in the transport group registered an increasing trend except import of aircraft, boats and ships which were down by 23.6 percent during July-March, FY2016 over the same period last year.(Table:8.5).
In textile group import of raw cotton posted an increase of 161.8 percent increase in value, backed by 254.7 percent increase in quantity during July-March FY2016 as compared to same
period last year. The increase in import bill of cotton is on account of maintaining the supply chain of raw cotton to offset the decline in domestic cotton production due to unfavorable climate condition.
Within agricultural and other chemical group a decline of 11.3 percent is observed in fertilizer manufactured along with a decrease of 8.9 percent in quantity during July-March FY2016 as compared to corresponding period last year. As gas and energy supply continued to increase since the start of current fiscal year and enough utilities are being provided to fertilizer manufacturers therefore, there is less import of fertilizer as demand is being fulfilled domestically.
Metal group bill also surged by 11.5 percent during July-March, FY2016 over the same period last year. Iron & steel and Iron & steel scrap import bill increased by 3.3 percent and 11.7 percent respectively, showing the expansion of construction activities in Pakistan.
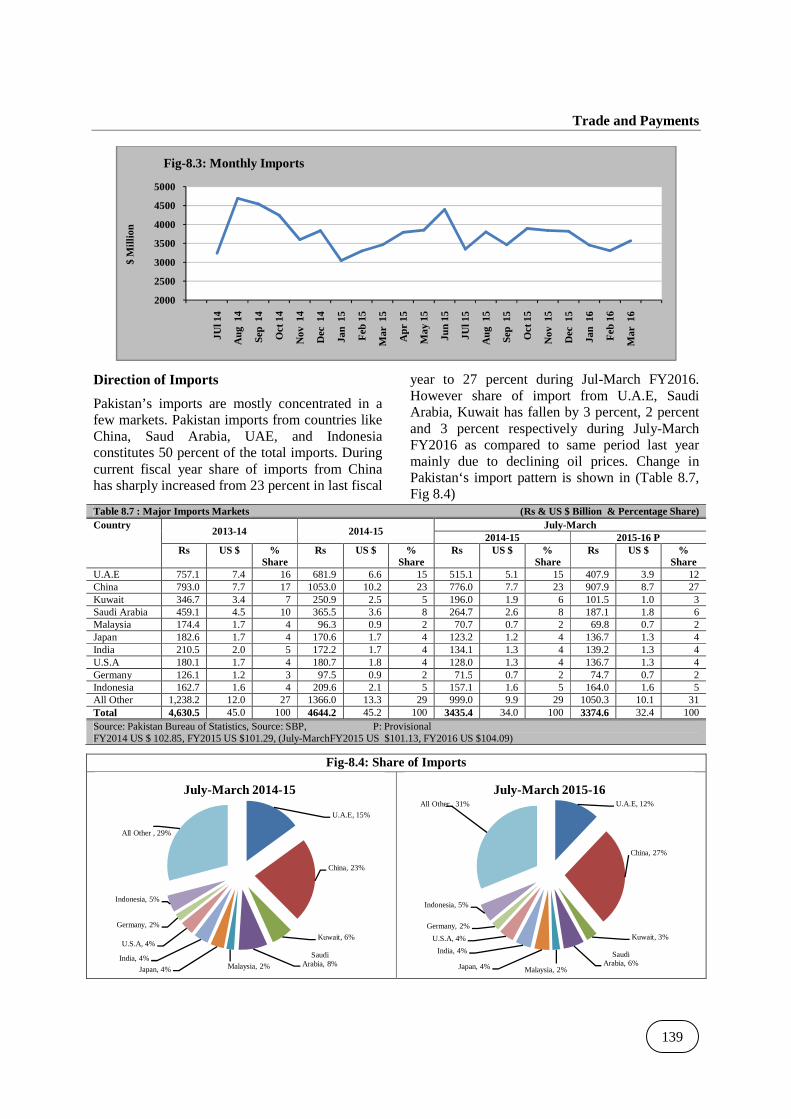
Trends in Monthly Imports
The monthly imports during July-March. FY2016 witnessed flat trend. Import averaged $3610 million per month. On average the monthly import decreased by US $ 162 million per month. The monthly imports are given in Table 8.6.and Fig-8.3
Table 8.6: Monthly Imports
Month ($ Million) 2014-15 2015-16 P
July 3240 3348
August 4691 3802
September 4542 3461 October 4240 3894
November 3598 3840
December 3834 3817
January 3041 3455
February 3298 3304
March 3463 3569
Monthly Average 3,772 3,610
Source : PBS, P: Provisional
Trade and Payments
139
Direction of Imports
Pakistan’s imports are mostly concentrated in a few markets. Pakistan imports from countries like China, Saud Arabia, UAE, and Indonesia constitutes 50 percent of the total imports. During current fiscal year share of imports from China has sharply increased from 23 percent in last fiscal
year to 27 percent during Jul-March FY2016. However share of import from U.A.E, Saudi Arabia, Kuwait has fallen by 3 percent, 2 percent and 3 percent respectively during July-March FY2016 as compared to same period last year mainly due to declining oil prices. Change in Pakistan‘s import pattern is shown in (Table 8.7, Fig 8.4)
Table 8.7 : Major Imports Markets (Rs & US $ Billion & Percentage Share) Country
Box-IV: RECENT MOVEMENTS IN THE TERMS OF TRADE FOR GOODS The terms of trade (TOT) are defined as the ratio of the price index of all exports and the price index of all imports.
In FY 2016 the TOT are improving. The average index of the TOT in the first half of FY 2016 stood at 55.17 against 53.33 in the correspondent period of the previous year
The upward movement in the TOT was the result of a decline in both the unit value of exports (UVEXPORTS) and of the unit value of imports (UVIMPORTS), but the decline in average import prices has been more significant than the decline in export unit values.
The reduction in the price of exports (from index value 758in first half of previous year to 707.4 this year, which represents a decline by 6.7%) was smaller than the reduction in the price of imports (from 1421.9 to 1283.4, which represents a decline by 9.7%).
The downward movement of the export price occurred in a number of specific categories of exported goods.
Table: Export prices for selected export categories for the period July – March FY 2016 COMMODIIES PAASCHE PRICE INDEX
July-March FY 2015 = 100 All groups 94
Food 92
Of which rice 84
Textile group 94
Of which cotton fabrics 88
Petroleum group 55
Other manufacturers group 104
Source PBS and Calculated by Economic Adviser's Wing, Finance Division, GoP
Based on the available evidence for the period July – March, the Paasche price indexes point to a decline in export prices for the categories food, textiles and petroleum. The export prices of other manufactures have increased by 4%.
The decline in the food category is mainly due to the decline in the price of rice, while the price in the textile group is mainly caused by cotton fabrics.
These price declines can be explained by looking at the recent movements in international commodity prices.
Fig-2 shows the movements of international world market prices for rice, cotton and crude oil. Normally these are expressed in USD, but for the sake of comparison, we have converted these prices into Rs and expressed the result in the form of indexes with base year 1990 -1991.
50
52
54
56
58
60
62
200
400
600
800
1000
1200
1400
1600
FY
10
Q1
FY
10
Q2
FY
10
Q3
FY
10
Q4
FY
11
Q1
FY
11
Q2
FY
11
Q3
FY
11
Q4
FY
12
Q1
FY
12
Q2
FY
12
Q3
FY
12
Q4
FY
13
Q1
FY
13
Q2
FY
13
Q3
FY
13
Q4
FY
14
Q1
FY
14
Q2
FY
14
Q3
FY
14
Q4
FY
15
Q1
FY
15
Q2
FY
15
Q3
FY
15
Q4
FY
16
Q1
FY
16
Q2
Fig-1: Terms of Trade, export and import prices, index numbers 1990 – 1991 =100
UVEXPORTS (left scale) UVIMPORTS (Left scale) TOT (Right scale)
Source: PBS
Trade and Payments
141
In the first three quarters of the current fiscal year the three mentioned world price indexes were at a lower level than in the corresponding period of the previous year: the cotton price declined by 1%, rice by 10% and crude oil by 44%.
The strong decline in the Import unit value index is mainly related to the extraordinary decline in world oil prices.
The observed declines in both export and import prices explain the improvement of the TOT, but also exert downward pressure on the value of both exports and imports.
Balance of Payments
The current account balance shrunk by 17.7 percent during July-April FY2016 as compared to last year (US$ 1.519 billion in FY2016 against US$ 1.846 billion). As a percentage of GDP it stood at -0.6 percent compared to -0.8 percent of the comparing period last year. The overall external account balance recorded US$ 0.9 billion during July-April FY2016 as compared to US$ 2.1 billion during the same period last year, the factors like higher financial inflows and lower international oil prices have attributed for this
improvement. The continued growth in remittances which increased by 5.25 percent during the period despite high base along with uptick in FDI in the financial accounts contributed for this improvement.
The remarkable improvement is recorded in country’s foreign reserves, which in May 2016 reached to US$ 21.46 billion with net reserves with SBP US$ 16.63million and commercial banks US$ 4.82 billion, to easily finance 5 months of the country’s import bill).
Table 8.8: Summary Balance of Payments US$ Million Items July-June July-April P
Fig- 2 World price indexes for cotton, crude oil and rice converted into Rs.1990-1991 = 100 PICOTTONRs PICRUDEOILRs PIRICERs
Source IMF Commodity Price Index and Calculated by Economic Adviser's Wing, Finance Division, GoP
Pakistan Economic Survey 2015-16
142
Table 8.8: Summary Balance of Payments US$ Million Items July-June July-April P
2013-14 2014-15 2014-15 2015-16 Of which: Workers’ Remittances 15,837 18721 15,236 16,034 Capital Account 1,857 375 353 296 Financial Account -5553 -4996 -3,320 -2,629 Direct Investment in Pakistan 1700 923 965 1,017 Portfolio Investment (net) -2762 -1882 -1,810 445 Other Investment -1221 -2262 -615 -2,073 Net Errors and Omissions -422 -16 289 -514 Overall Balance -3858 -2646 -2116 -892 Source: State Bank of Pakistan P: Provisional Current Account
The improvement in the current account was due to CSF inflows, growth in worker’s remittances, lower oil prices which reduced import bill as compared to last year, and decrease in deficit of services account, with a deficit of US$ 1.7 billion during July-April FY2016 as compared to US$ 2.1 billion during the same period last year.
The overall trade deficit posted an increase of 2.1 percent during July-April FY2016, mainly reflecting decline in exports. During July-April FY 2016 exports declined by 9.5 percent and stood at US$ 18.2 billion as compared to US$ 20.1 billion in July-April FY2015. The imports declined by 4.7 percent in July – April FY2016 compared to July- April FY2015. In the meantime non-oil imports, particularly machinery and
metal surged significantly.
Services trade deficit fell by 16.6 percent during the first ten months of FY2016 supported by lower imports.
This year Pakistan has received inflows amounting to US$ 937 million on account of CSF during July –April of FY2016 against US$ 1.452 billion in the same period of last fiscal year. During the period under review services exports declined by 14.5 percent, overall exports of services were US$ 4.4 billion in July –April FY 2016 against US$ 5.1 billion in the corresponding period of FY 2015, depicting a decline of US$ 748 million. Moreover, services import fell by 15.1 percent or US$ 1.01 billion to US$ 6.2 billion in July –April FY2016 compared to 7.3 billion in the same period last year. (Fig-8.5)
-900
-700
-500
-300
-100
100
300
500
700
900
Jul-F
Y1
5
Au
g-F
Y1
5
Sep
-FY
15
Oct
-FY
15
Nov
-FY
15
Dec
-Fy1
5
Jan-
FY
15
Feb
-FY
15
Mar
-FY
15
Ap
r-F
Y1
5
May
-FY
15
Jun
e-Fy1
5
Jul-F
Y1
6
Au
g-F
Y1
6
Sep
-FY
16
Oct
-FY
16
Nov
-FY
16
Dec
-FY
16
Jan-
FY
16
Feb
-FY
16
Mar
-FY
16
Ap
r-F
Y1
6
Mill
ion
US
$
Fig- 8.5 Current Account
Trade and Payments
143
Income account registered deficit of US$ 3.8 billion in July-April FY2016 against the deficit of US$ 3.6 billion during the same period last year. Both lower receipts and higher payments contributed to this increase in deficit in income account. While the payment remained at US$139 million higher during July-April FY2016 than the same period last year, receipts fell by US$ 25 million.
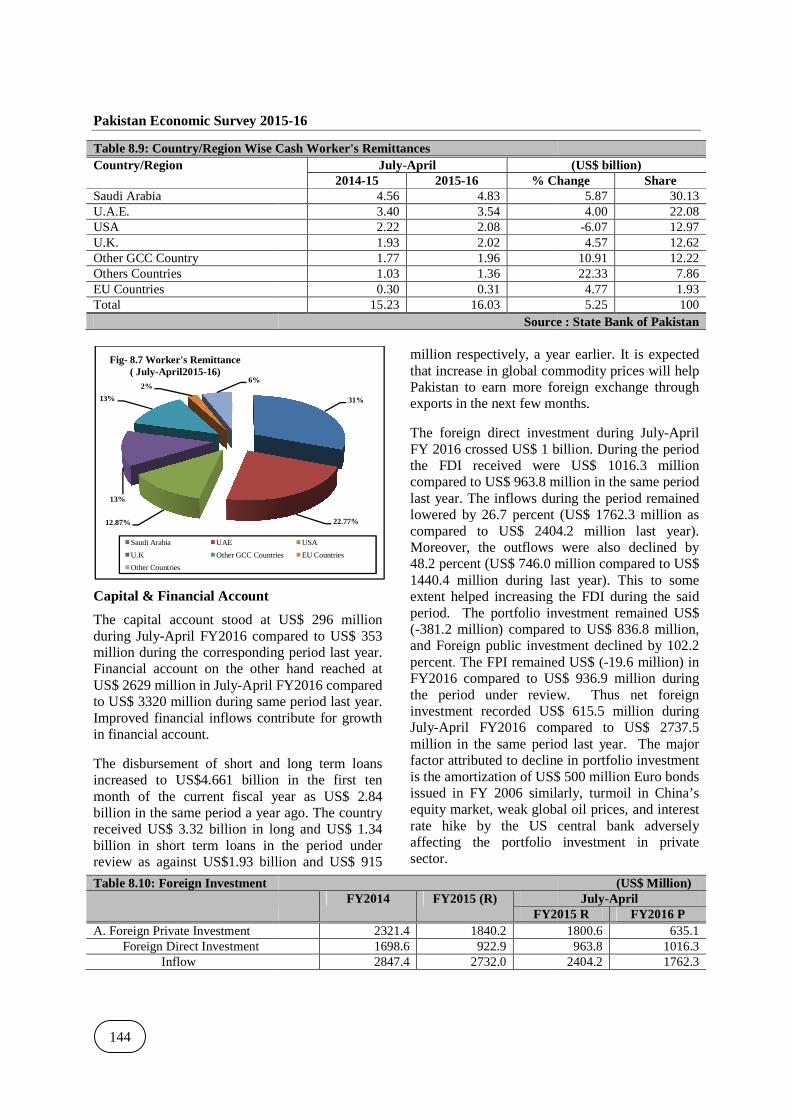
Workers’ Remittances
Remittances is considered as one of the main factor in the stability of external account. Remittances continued its upward growth trajectory since 2013. During FY 2015 the remittances reached at US$ 18.72 billion posting a growth of 18.2 percent over FY 2014, while in FY2014, it posted a growth 13.7 percent over FY 2013. The start of FY 2016 has witnessed a growth of 5.25 percent over last year, and this trend continued during July-April FY 2016, the remittances reached to US$ 16.034 billion as compared to 15.236 billion last year. The growth
is satisfactory, despite a high base and is expected that the target of US$ 19 billion for FY 2016 will be achieved.
The major share of remittances are from Saudi Arabia 30.1 percent(US$ 4833.4 million), U.A.E 22.1 percent (US$ 3545.3 million), USA 13.0 percent (US$ 2087.6 million) ,other GCC countries 13 percent ( US$19.6 million),U.K 12.6 (US$ 2022.4 million) , EU 1.93 percent (US$ 315.6 million) and other countries 7.8 percent. The remittances during July-April FY2016 are 5.8 percent higher from Saudi Arabia , 4.0 percent from UAE, 4.6 percent from United Kingdom, 10.9 percent from other GCC countries, while from other countries 22.3 percent compared to same period last year (Table: 8.9, Fig 8.7)
Despite decline in crude oil prices there is no as such risk observed in flow of remittances from GCC and Saudi Arabia. Overall the export of man power remained 26.7 percent higher over last year.
It is also expected that with the start of Ramadan and Eid, the flow of remittances will increase as workers generally send more money during festivals. It is also expected that development activities in Saudi Arabia, Expo 2020 and FIFA World Cup 2022 in Qatar will generate the demand of workers and consequently flow of remittances will increase.
The present government is trying to increase its labor force participation in infrastructure activities in the Gulf region. Pakistan is also making efforts to promote the use of formal channels for the remittances transfer by encouraging banks to expand their network with leading money transfer operators.
0
200
400
600
800
1000
1200
1400
1600
1800
2000
July August September Octcober November December January February March April
Saudi Arabia U.A.E. USA U.K. Other GCC Country Others Countries EU Countries Total
Capital & Financial Account
The capital account stood at US$ 296 million during July-April FY2016 compared to US$ 353 million during the corresponding period last year. Financial account on the other hand reached at US$ 2629 million in July-April FY2016 compared to US$ 3320 million during same period last year. Improved financial inflows contribute for growth in financial account.
The disbursement of short and long term loans increased to US$4.661 billion in the first ten month of the current fiscal year as US$ 2.84 billion in the same period a year ago. The country received US$ 3.32 billion in long and US$ 1.34 billion in short term loans in the period under review as against US$1.93 billion and US$ 915
Table 8.10: Foreign Investment
A. Foreign Private Investment Foreign Direct Investment Inflow
The capital account stood at US$ 296 million April FY2016 compared to US$ 353
million during the corresponding period last year. Financial account on the other hand reached at
April FY2016 compared to US$ 3320 million during same period last year. Improved financial inflows contribute for growth
The disbursement of short and long term loans increased to US$4.661 billion in the first ten
urrent fiscal year as US$ 2.84 billion in the same period a year ago. The country received US$ 3.32 billion in long and US$ 1.34 billion in short term loans in the period under review as against US$1.93 billion and US$ 915
million respectively, a year earlthat increase in global commodity prices will help Pakistan to earn more foreign exchange through exports in the next few months.
The foreign direct investment during JulyFY 2016 crossed US$ 1 billion. During the period the FDI received were US$ 1016.3 million compared to US$ 963.8 million in the same period last year. The inflows during the period remained lowered by 26.7 percent (US$ 1762.3 million as compared to US$ 2404.2 million last year). Moreover, the outflows were also de48.2 percent (US$ 746.0 million compared to US$ 1440.4 million during last year). This to some extent helped increasing the FDI during the said period. The portfolio investment remained US$ (-381.2 million) compared to US$ 836.8 million, and Foreign public investment declined by percent. The FPI remained USFY2016 compared to US$ 936.9 million during the period under review. Thus net foreign investment recorded US$ 615.5 million during July-April FY2016 compared to US$million in the same period last year. The major factor attributed to decline in portfolio investment is the amortization of US$ 500 million Euro bonds issued in FY 2006 similarly, turmoil in China’s equity market, weak global oil prices, and interrate hike by the US central bank adversely affecting the portfolio investment in private sector.
FY2014 FY2015 (R)
FY2015 R2321.4 1840.2 1698.6 922.9 2847.4 2732.0
31%
22.77%
USA
Other GCC Countries EU Countries
(US$ billion) % Change Share
5.87 30.13 4.00 22.08
-6.07 12.97 4.57 12.62
10.91 12.22 22.33 7.86 4.77 1.93 5.25 100
Source : State Bank of Pakistan
a year earlier. It is expected that increase in global commodity prices will help Pakistan to earn more foreign exchange through exports in the next few months.
The foreign direct investment during July-April FY 2016 crossed US$ 1 billion. During the period
eceived were US$ 1016.3 million compared to US$ 963.8 million in the same period last year. The inflows during the period remained lowered by 26.7 percent (US$ 1762.3 million as compared to US$ 2404.2 million last year).
the outflows were also declined by 48.2 percent (US$ 746.0 million compared to US$ 1440.4 million during last year). This to some extent helped increasing the FDI during the said period. The portfolio investment remained US$
381.2 million) compared to US$ 836.8 million, reign public investment declined by 102.2
The FPI remained US$ (-19.6 million) in FY2016 compared to US$ 936.9 million during the period under review. Thus net foreign investment recorded US$ 615.5 million during
April FY2016 compared to US$ 2737.5 million in the same period last year. The major factor attributed to decline in portfolio investment is the amortization of US$ 500 million Euro bonds issued in FY 2006 similarly, turmoil in China’s equity market, weak global oil prices, and interest rate hike by the US central bank adversely affecting the portfolio investment in private
FY2015 R FY2016 P Outflow 1148.8 1809.1 1440.4 746.0 Portfolio Investment 622.8 917.3 836.8 -381.2 Equity Securities 735.1 917.3 836.8 -381.2 Debt Securities 112.2 B. Foreign Public Investment 2115.2 927.1 936.9 -19.6 Portfolio Investment 2115.2 927.1 936.9 -19.6 Total Foreign Investment (A+B) 4436.6 2767.3 2737.5 615.5 Source: State Bank of Pakistan
The major chunk of FDI is coming from China which constituted US $ 549 million compared to US$ 218 million last year. Other significant investors are Hong Kong (US$ 129 million), Italy (US$ 87 million), Switzerland (US$ 72 million), U.A.E (US$ 137 million) and U.K (US$ 58 million). Saudi Arabia continued to disinvest this year too. The net disinvestment by the kingdom during the ten months under review was US$ 81 million compared to US$ 53 million a year ago, mainly due to lower oil prices and lower fiscal space.
Pakistan’s power sector received the biggest chunk of investment, attracting US$ 518 million this year compared to US$ 168 million during the same period of the last fiscal year. Of the total, US$ 123 million was invested in thermal energy, US$ 104 million in hydro electric and US$ 290 million in coal-fired power plants. The Oil and Gas exploration sector also remained attractive as FDI in this sector stood at US$ 234 million during the ten months compared to US$ 230 million during last year.
The Oil and gas exploration, power, communication and beverages continued to remain on the radar screen of the foreign investors. It is expected that with the passage of time the investment under CPEC programme will help FDI to increase manifold. Pakistan is also expected to join MSCI emerging index which will drastically change the dynamics of equity markets.
Foreign Exchange Reserves and Exchange Rate
The country’s total foreign exchange reserves reached to highest level to US$ 21.4 billion by May18, 2016, compared to US$ 18.6 billion end June 2015. The rise was mainly due to, loans from ADB and World Bank, CSF as well as disbursement of loans under EFF by IMF and higher investment inflows. It is important to mention here that the increase in the reserves was largely attributed to rise in the reserves held by SBP. On the other hand, reserves held by commercial banks were almost stagnant during the period under review.
Exchange rate remained at Rs.104.75 per US$ in May FY2016, compared to Rs 101.78 per US$ at end June 2015. The Pak Rupee’s deprecation was around 2.9 percent during July-May FY2016. This was mainly because of relative stability in the world currency market (except for some volatility in January 2016),sharp fall in global oil prices which decreased Pakistan’s import bill by 4.6 percent and a considerable rise in SBP’s foreign exchange reserves, to absorbs any external shocks.
Conclusion The ongoing slump in global commodity prices continued to support Pakistan’s external sector. Decline in oil prices helped in reduction of Pakistan’s import bill by 4.6 percent. As a result, the current account deficit narrowed down over last year. Country’s foreign exchange reserves
reached to historical high level at US$ 21.46 billion in May 2016. The exchange rate remained stable during the current financial year. Worker’s remittances are continuously rising, and posted a modest growth of 5.2 percent during July-April FY2016. Falling exports are alarming during current fiscal year; a number of exogenous factors are responsible such as very low inflation rates across advanced economies, lackluster economic growth, jittery global equity and currency market weakening in China and policy reversal in the US. Emerging market economies has mostly seen their exports falling and much constrained across border investments. However, the present government is cognizant of this issue and has taken a number of measures and recently launched STPF 2015-18 is a welcome development for our exports.
400
5400
10400
15400
20400
25400
FY
13
FY
14
29-M
ay-1
5
30-J
un-1
5
31-J
ul-1
5
31-A
ug-1
5
30-S
ep-1
5
30-O
ct-1
5
30-N
ov-1
5
31-D
ec-1
5
29-J
an-1
6
29-F
eb-1
6
31-
Ma
r-16
29-A
pr-1
6
18-M
ay-1
6
Foreign Exchange Reserve (US $ Million)
Net Reserves With SBP Net Reserve with Banks Total Liquid Reserve
TRADE AND PAYMENTS
TABLE 8.1
BALANCE OF PAYMENTS (SUMMARY)(US $ Million)
2014-15 2015-16 P
Current account balance 214 -4,658 -2,496 -3,130 -2,709 -1,971 -1,606