+ All Categories
Home > Documents > CHAPTER – V - Shodhgangashodhganga.inflibnet.ac.in/bitstream/10603/30578/13/13_chapter 5.pdf ·...

CHAPTER – V - Shodhgangashodhganga.inflibnet.ac.in/bitstream/10603/30578/13/13_chapter 5.pdf ·...

Date post: 02-Apr-2018
Category:
Upload: truongdat
View: 217 times
Download: 3 times
Share this document with a friend
19
212 CHAPTER – V COMPARITIVE STUDY BETWEEN SBI AND ICICI ON CUSTOMER SATISFACTION TOWARDS SELECTED I.T BASED PRODUTS AND SERVICES In this chapter an attempt is made to study the significant difference between SBI and ICICI based on customer satisfaction towards selected I.T products and services. The present study meticulously deals with the perception of customers of SBI and ICICI on ten selected I.T. based products and services. In particular the Payment System, Settlement System, Centralized Funds Management System, Structured Financial Messaging Solution, Internet System, Debit Card Management Solution, Core Banking, ATM service, Internet Banking and Mobile / SMS services are mainly focused to decide the customer’s notion on the level of satisfaction. This chapter also establishes an empirical relationship between the customers satisfaction levels on selected I.T. based products and services and their overall satisfaction in respect of SBI and ICICI customers by the application of Karl Pearson’s coefficient of correlation and paired t-Test. The overall level of satisfaction of SBI and ICICI customers is based on the variables like adoption of technology in a bank, real time response, service quality, transparent information, variety of products design and services and delivery of services, bank employee attitude, attention towards customers, regulatory norms, security and safety, service charges, care on customer convenience, quickness of service and status of bank considered as factors linked to the overall satisfaction of customers.
Transcript

212

CHAPTER – V COMPARITIVE STUDY BETWEEN SBI AND ICICI ON

CUSTOMER SATISFACTION TOWARDS SELECTED I.T

BASED PRODUTS AND SERVICES

In this chapter an attempt is made to study the significant difference

between SBI and ICICI based on customer satisfaction towards selected I.T

products and services. The present study meticulously deals with the

perception of customers of SBI and ICICI on ten selected I.T. based products

and services. In particular the Payment System, Settlement System, Centralized

Funds Management System, Structured Financial Messaging Solution, Internet

System, Debit Card Management Solution, Core Banking, ATM service,

Internet Banking and Mobile / SMS services are mainly focused to decide the

customer’s notion on the level of satisfaction.

This chapter also establishes an empirical relationship between the

customers satisfaction levels on selected I.T. based products and services and

their overall satisfaction in respect of SBI and ICICI customers by the

application of Karl Pearson’s coefficient of correlation and paired t-Test.

The overall level of satisfaction of SBI and ICICI customers is based

on the variables like adoption of technology in a bank, real time response,

service quality, transparent information, variety of products design and

services and delivery of services, bank employee attitude, attention towards

customers, regulatory norms, security and safety, service charges, care on

customer convenience, quickness of service and status of bank considered as

factors linked to the overall satisfaction of customers.

213

Moreover, authentication trust, privacy, availability of information,

reliability, well understood relationship, performance quality and economy

banking are also contributing factors towards the determination of overall

satisfaction.

MODEL

An empirical model applied for Customer satisfaction on Information

Technology based products and services:

The I.T. based products and services selected for the study have

expressed their level of satisfaction on these factors in Likerts five point scale

that ranges from highly satisfied to highly dissatisfied. The total average

scores of these ten factors and the total average score of overall satisfaction are

created and allowed to act as dependent variables throughout the study. It is

indispensable at this juncture to determine an empirical relationship between

the satisfaction level on Information Technology based products and services

and overall satisfaction of SBI and ICICI customers. This leads to the

application of Karl Pearson’s co-efficient model to establish the relationship

parametrically.

214

Table 5.1. Correlations

OS PS Pearson Correlation .512(**) Sig. (2-tailed) .007 N 546 SS Pearson Correlation .525(**) Sig. (2-tailed) .003 N 546 CFM Pearson Correlation .664(**) Sig. (2-tailed) .007 N 546 SFM Pearson Correlation .776(**) Sig. (2-tailed) .005 N 546 IS Pearson Correlation .573(**) Sig. (2-tailed) .009 N 545 DCM Pearson Correlation .101(*) Sig. (2-tailed) .018 N 546 CB Pearson Correlation .558(**) Sig. (2-tailed) .006 N 546 ATM Pearson Correlation .262(**) Sig. (2-tailed) .000 N 545 IB Pearson Correlation .662(**) Sig. (2-tailed) .000 N 546 SMS Pearson Correlation .452(**) Sig. (2-tailed) .000 N 546

Note: PS: Payment System, SS : Settlement System, CFM :Centralized Funds Management System, SFM: Structured Financial Messaging Solution, IS: Internet System, DCM: Debit Card Management Solution, CB: Core Banking, ATM service, IB: Internet Banking and Mobile / SMS services.

215

From the Table 4.1 it is interesting to observe the highest degree of positive

correlation between the structured financial message solution and the overall

satisfaction (r=0.776, p=0.005). This statistical significance implies that, in SBI

and ICICI bank the structured financial message solution is significant in

measuring the satisfaction level of the respective customers.

A high degree of significant positive correlation is observed between

the centralized funds management system and the overall satisfaction (r =0.664,

p=0.007). Based on this statistical significance, it is understood that the

centralized funds management system adopted in ICICI and SBI, is significant

in measuring the satisfaction level of the respective customers.

An examination of the above table reveals that there is also a high

degree of significant positive relationship exists between the internet banking

and the overall satisfaction (r=0.662, p=0.000). This statistical significance

indicates that in ICICI and SBI, the internet banking service is significant in

measuring the satisfaction level of the respective customers.

The internet system is also to maintain a high degree of significant

positive correlation with the overall satisfaction (r=0.573, p=0.009). Hence, it

is understood that the Internet system plays a vital role in measuring the

satisfaction level of both the SBI and ICICI bank customers.

The above table inferences that the core banking service is positively

correlated with the overall satisfaction (r=0.558, p=0.006). This relationship

gives an indication that in ICICI bank and SBI, the core banking service is

significant in measuring the satisfaction level of their customers.

216

There is a significant positive close relationship between the

settlement system and the overall satisfaction (r=0.525, p=0.003). This

statistical significance implies that in SBI and ICICI, the settlement system is

significant in measuring the satisfaction level of the respective customers.

However, the payment system is also positively correlated with the

overall satisfaction (r=0.512, p=0.007). This statistical significance indicates

that the payment system implemented in ICICI and SBI, is significant in

measuring the satisfaction level of the respective customers.

It is also observed from the above table that another dimension of

Mobile / SMS service has a significant positive correlation with the overall

satisfaction (r=0.452, p=0.000). It can be concluded that, based on the above

statistical significance that the mobile / SMS service activity in SBI, ICICI

bank are significant in measuring the satisfaction level of the respective

customers.

Further, it is observed that the ATM service is positively correlated

with the overall satisfaction (r=0.262, p=0.000). This statistical significant

result supports the ATM service provided by SBI and ICICI banks. It is

significant in measuring the customers satisfaction level of the respective

banks.

It is finally stated that the Debit card management solution has a

significant positive relationship at low degree with the overall satisfaction

(r=0.101, p=0.018). The extension of this result, elicits that the debit card

management solution technique in significant in measuring the satisfaction

level of the customers related to both the banks such as SBI and ICICI.

This leads to the following empirical model influencing the overall satisfaction

(Age, Gender, Marital Status and Number of dependents).

217

Fig.5.1. A MODEL OF CUSTOMER SATISFACTION ON INFORMATION TECHNOLOGY BASED PRODUCTS AND SERVICES

218

Inference

The above empirical model clearly indicated the significant relationship

between the I.T. products and services and customers satisfaction in both SBI and

ICICI banks. The influence of Information Technology based products and

services are arranged numerically based on the correlation co-efficient values. It

actually denotes the measure of influence that is being created on the overall

satisfaction. Infact the model diagrammatically explained in the order of

satisfaction of Information Technology products and services in SBI and ICICI

banks. Besides these relationships, the research ascertained the influence of

independent demographic variable on the customer satisfaction in SBI and ICICI

banks.

The exploitation analysis of variance indicated the age, gender, marital

status and number of dependents in the family significantly influence the level of

satisfaction of customers in SBI and ICICI banks.

PAIRED t-TEST

A comparative study of factors influencing customers satisfaction in SBI and ICICI banks:

The present study focuses on ten Information Technology based products

and services in the dominant public sector and private sector bank. The research

instrument also focuses on measuring the overall satisfaction of the customers of

these two types of banks. In this context it is important to analyze the significant

difference between the SBI and ICICI banks, on the basis of information

technology based products and services and the overall satisfaction.

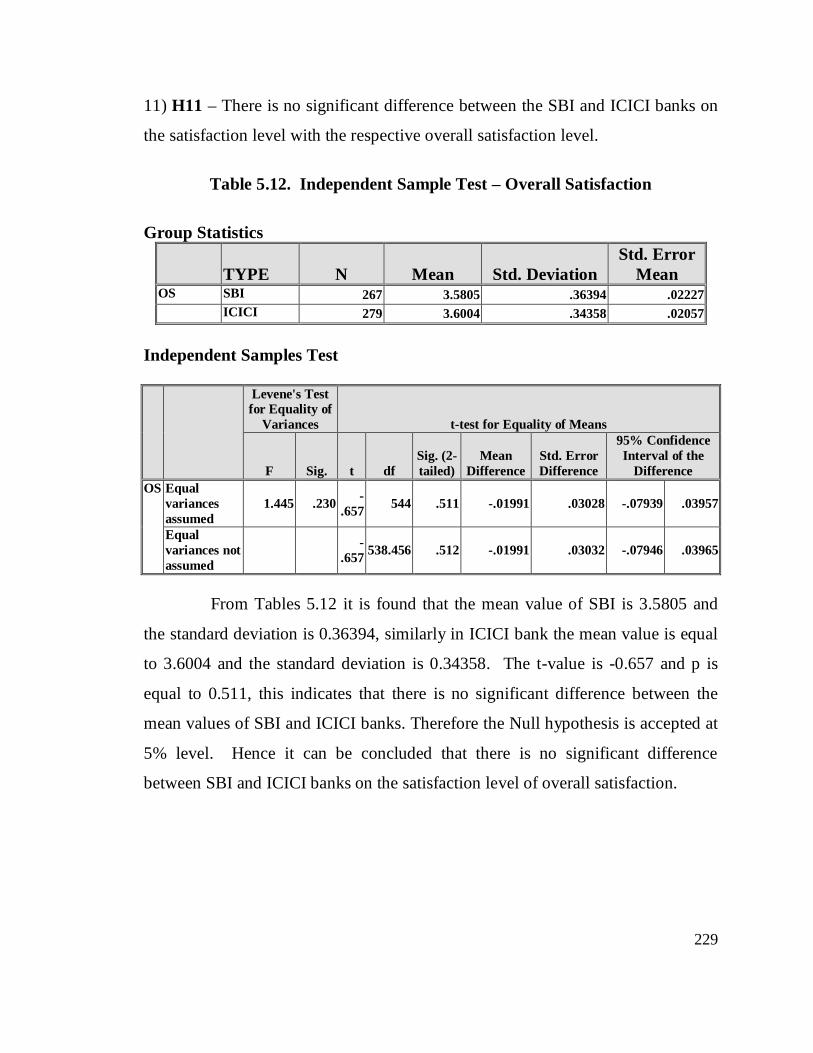
1) H1 – There is no significant difference between SBI and ICICI banks on the

satisfaction level with the respective payment system.

219

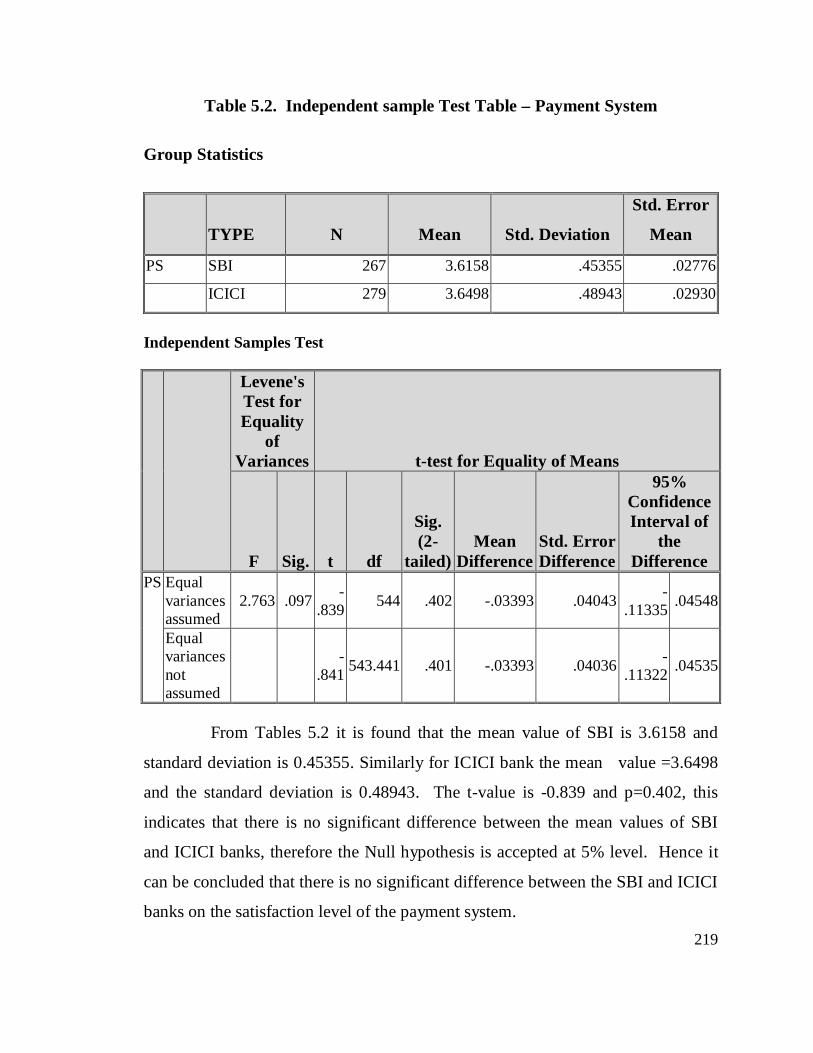
Table 5.2. Independent sample Test Table – Payment System

Group Statistics

TYPE N Mean Std. Deviation

Std. Error

Mean

PS SBI 267 3.6158 .45355 .02776

ICICI 279 3.6498 .48943 .02930

Independent Samples Test

Levene's Test for Equality

of Variances t-test for Equality of Means

F Sig. t df

Sig. (2-

tailed) Mean

Difference Std. Error Difference

95% Confidence Interval of

the Difference

PS Equal variances assumed

2.763 .097 -.839 544 .402 -.03393 .04043 -

.11335 .04548

Equal variances not assumed

-.841 543.441 .401 -.03393 .04036 -

.11322 .04535

From Tables 5.2 it is found that the mean value of SBI is 3.6158 and

standard deviation is 0.45355. Similarly for ICICI bank the mean value =3.6498

and the standard deviation is 0.48943. The t-value is -0.839 and p=0.402, this

indicates that there is no significant difference between the mean values of SBI

and ICICI banks, therefore the Null hypothesis is accepted at 5% level. Hence it

can be concluded that there is no significant difference between the SBI and ICICI

banks on the satisfaction level of the payment system.

220

2) H2 – There is no significant difference between the SBI and ICICI banks on the

satisfaction level with the respective settlement system.

Table 5.3. Independent Sample Test – Settlement System

Group Statistics

TYPE N Mean Std. Deviation Std. Error

Mean SS SBI 267 3.3104 .61221 .03747 ICICI 279 3.4749 .50430 .03019

Independent Samples Test

Levene's Test for

Equality of Variances t-test for Equality of Means

F Sig. t df

Sig. (2-

tailed) Mean

Difference Std. Error Difference

95% Confidence

Interval of the Difference

SS Equal variances assumed

2.444 .119 -3.434 544 .001 -.16452 .04791 -.25864 -.07040

Equal variances not assumed

-3.419 515.594 .001 -.16452 .04812 -.25905 -.06999

From Tables 5.3 it is found that the mean value of SBI is 3.3104 and

standard deviation is 0.61221, similarly for ICICI bank the mean value is equal to

3.3104 and the standard deviation is 0.50430. The t-value is -3.434 and p=0.001,

this indicates there is a significant difference between the mean values of SBI and

ICICI banks, therefore the Null hypothesis is rejected at 5% level. Hence it is

concluded that there is a significant difference between the SBI and ICICI banks,

on the satisfaction level of the settlement system.

Based on the above fact it is found that the ICICI bank customers reached

the good level of satisfaction on the settlement system than the SBI customers.

221

3) H3- There is no significant difference between the SBI and ICICI banks on the

satisfaction level with the respective centralized funds management system.

Table 5.4. Independent Sample Test - Centralized Funds Management System

Group Statistics

TYPE N Mean Std. Deviation Std. Error Mean CFM SBI 267 3.6654 .49559 .03033 ICICI 279 3.7652 .50392 .03017

Independent Samples Test

Levene's Test for Equality of

Variances t-test for Equality of Means

F Sig. T df Sig. (2-tailed)

Mean Difference

Std. Error Difference

95% Confidence Interval of the

Difference CFM Equal

variances assumed

2.670 .103 -2.332 544 .020 -.09981 .04280 -.18388 -.01575

Equal variances not assumed

-2.333 543.593 .020 -.09981 .04278 -.18385 -.01578

From Tables 5.4 it is found that the mean value of SBI is 3.6654 and the

standard deviation is 0.49559, similarly for ICICI bank the mean value is equal to

3.7652 and the standard deviation is 0.50392. The t-value is -2.332 and p is equal

to 0.020 this indicates that there is a significant difference between the mean

values of SBI and ICICI banks, therefore the Null hypothesis is rejected at 5%

level.

Hence it is concluded that there is a significant difference between the

SBI and ICICI banks on the satisfaction level of the centralized funds management

system. Based on this conclusion, it is stated that the ICICI bank customers

reached the good level of satisfaction on the centralized funds management system

than the SBI customers.

222

4) H4 – There is no significant difference between the SBI and ICICI banks on the

satisfaction level with the respective structured financial message solution.

Table 5.5. Independent Sample Test - Structured Financial Messaging Solution

Group Statistics

TYPE N Mean Std. Deviation Std. Error Mean SFM SBI 267 3.7416 .71868 .04398 ICICI 279 3.8769 .64440 .03858

Independent Samples Test

Levene's Test for Equality of Variances t-test for Equality of Means

F Sig. T df Sig. (2-tailed)

Mean Difference

Std. Error Difference

95% Confidence Interval of the

Difference SFM Equal

variances assumed

1.426 .233 -2.319 544 .021 -.13537 .05837 -.25002 -.02072

Equal variances not assumed

-2.314 531.648 .021 -.13537 .05851 -.25030 -.02044

From Tables 5.5 it is found that the mean value of SBI is 3.7416 and the

standard deviation is 0.71868, similarly for ICICI bank the mean value is equal to

3.8769 and the standard deviation is 0.6440. The t-value is -2.319 and p is equal to

0.021 this indicates that there is a significant difference between the mean values

of SBI and ICICI banks. Therefore the Null hypothesis is rejected at 5% level.

Hence it is concluded that there is a significant difference between the SBI and

ICICI banks on the satisfaction level of the structured financial message solution.

Based on the above fact it is understood that the ICICI bank customers reached the

good level of satisfaction towards the structured financial message solution than

the SBI customers.

223

5)H5 – There is no significant difference between the SBI and ICICI banks on the

satisfaction level with the respective internet system.

Table 5.6. Independent Sample Test – Internet System

Group Statistics

TYPE N Mean Std. Deviation Std. Error Mean

IS SBI 266 3.6476 .69810 .04280

ICICI 279 3.7697 .56706 .03395

Independent Samples Test

Levene's Test

for Equality of

Variances t-test for Equality of Means

F Sig. t df

Sig. (2-

tailed)

Mean

Difference

Std. Error

Difference

95% Confidence

Interval of the

Difference

IS Equal

variances

assumed

8.493 .004 -

2.247 543 .025 -.12216 .05436 -.22895 -.01537

Equal

variances not

assumed

-

2.236 510.646 .026 -.12216 .05463 -.22949 -.01483

From Tables 5.6, it is found that the mean value of SBI is 3.6476 and the

standard deviation is 0.69810, similarly in ICICI bank the mean value is 3.7697

and the standard deviation is 0.56706. The t-value is -2.247 and p is equal to

0.025, this indicates that there is a significant difference between the mean values

of SBI and ICICI banks. Therefore the Null hypothesis is rejected at 5% level.

Hence it is concluded that there is a significant difference between the SBI and

ICICI banks on the satisfaction level of the internet system. Based on the above

fact it is resulted that the ICICI bank customers reached the better level of

satisfaction towards the internet system than the SBI customers.

224

6) H6 – There is no significant difference between the SBI and ICICI banks on the

satisfaction level with respect to debit card management solution.

Table 5.7. Independent Sample Test – Debit Card Management Solution

Group Statistics

TYPE N Mean Std. Deviation

Std. Error

Mean

DCM SBI 267 3.6667 .71679 .04387

ICICI 279 3.7336 .65480 .03920

Independent Samples Test

Levene's Test

for Equality of

Variances t-test for Equality of Means

F Sig. T df

Sig. (2-

tailed)

Mean

Difference

Std. Error

Difference

95% Confidence

Interval of the

Difference

DCM Equal

variances

assumed

.046 .831 -

1.140 544 .255 -.06691 .05871 -.18224 .04843

Equal

variances

not assumed

-

1.137 534.397 .256 -.06691 .05883 -.18247 .04866

From Tables 5.7, it is found that the mean value of SBI is 3.6667 and

standard deviation is 0.71679, similarly in ICICI bank the mean value is 3.7336

and the standard deviation is 0.65480. The t-value is -1.140 and p is equal to

0.255, this indicates that there is no significant difference between the mean values

of SBI and ICICI banks. Therefore the Null hypothesis is accepted at 5% level.

Hence it can be concluded that there is no significant difference between the SBI

and ICICI banks on the satisfaction level of the debit card management solution.

225

7) H7 – There is no significant difference between the SBI and ICICI banks on the

satisfaction level of the core banking services.

Table 5.8. Independent Sample Test – Core Banking

Group Statistics

TYPE N Mean Std. Deviation Std. Error

Mean CB SBI 267 3.6386 .61265 .03749 ICICI 279 3.7379 .54858 .03284

Independent Samples Test

Levene's Test

for Equality

of Variances t-test for Equality of Means

F Sig. t df

Sig. (2-

tailed)

Mean

Difference

Std. Error

Difference

95% Confidence

Interval of the

Difference

CB Equal

variances

assumed

2.502 .114 -

1.998 544 .046 -.09933 .04972 -.19700 -.00165

Equal

variances

not

assumed

-

1.993 531.434 .047 -.09933 .04984 -.19724 -.00141

From Tables 5.8, it is found that the mean value of SBI is 3.6386 and

standard deviation is 0.61265, similarly in ICICI bank the mean value is equal to

3.7379 and the standard deviation is 0.54858. The t-value is -1.998 and p is equal

to 0.046, this indicates that there is a significant difference between the mean

values of SBI and ICICI banks. Therefore the Null hypothesis is rejected at 5%

level. Hence, it can be concluded that there is a significant difference between the

SBI and ICICI banks on the satisfaction level of the core banking services.

226

Based on the above conclusion, it is ascertained that the ICICI bank

customers reached the good level of satisfaction towards the core banking services

than the SBI customers.

8) H8 – There is no significant difference between the SBI and ICICI banks on the

satisfaction level with the respective ATM services.

Table 5.9. Independent Sample Test – ATM services

Group Statistics

TYPE N Mean Std. Deviation

Std. Error

Mean

ATM SBI 266 3.1169 .28539 .01750

ICICI 279 3.1147 .27069 .01621

Independent Samples Test

Levene's Test for Equality of

Variances t-test for Equality of Means

F Sig. T df Sig. (2-tailed)

Mean Difference

Std. Error Difference

95% Confidence Interval of the

Difference ATM Equal

variances assumed

.888 .346 .093 543 .926 .00222 .02382 -.04457 .04901

Equal variances not assumed

.093 537.563 .926 .00222 .02385 -.04463 .04907

From Tables 5.9 it is found that the mean value of SBI is 3.1169 and

standard deviation is 0.28539, similarly in ICICI bank the mean value is 3.1147

and the standard deviation is 0.27069. The t-value is 0.093 and p is equal to

0.926, this indicates that there is no significant difference between the mean values

of SBI and ICICI banks. Therefore the Null hypothesis is accepted at 5% level.

Hence, it can be concluded that there is no significant difference between the SBI

and ICICI banks on the satisfaction level of ATM services.

227

9) H9 – There is no significant difference between the SBI and ICICI banks on the

satisfaction level with the respective internet banking services.

Table 5.10. Independent Sample Test – Internet Banking

Group Statistics

TYPE N Mean Std. Deviation

Std. Error

Mean

IB SBI 267 3.1936 .24637 .01508

ICICI 279 3.1762 .22888 .01370

Independent Samples Test

Levene's Test

for Equality

of Variances t-test for Equality of Means

F Sig. t Df

Sig. (2-

tailed)

Mean

Difference

Std. Error

Difference

95% Confidence

Interval of the

Difference

IB Equal

variances

assumed

1.440 .231 .857 544 .392 .01743 .02034 -.02253 .05738

Equal

variances

not

assumed

.855 536.603 .393 .01743 .02037 -.02260 .05745

From Tables 5.10, it is found that the mean value of SBI is 3.1936 and the

standard deviation is 0.24637, similarly in ICICI banks the mean value is 3.1762

and the standard deviation is 0.2288. The t-value is 0.857 and p is equal to 0.392

this indicates that there is no significant difference between the mean values of

SBI and ICICI banks. Therefore the Null hypothesis is accepted at 5% level.

Hence, it can be concluded that there is no significant difference between the SBI

and ICICI banks on the satisfaction level of the internet banking services.

228

10) H10 - There is no significant difference between the SBI and ICICI banks on

the satisfaction level with the respective Mobile / SMS services.

Table 5.11. Independent Sample Test – Mobile / SMS services

Group Statistics

TYPE N Mean Std. Deviation

Std. Error

Mean

SMS SBI 267 3.6571 .43649 .02671

ICICI 279 3.6758 .42925 .02570

Independent Samples Test

Levene's Test for Equality of

Variances t-test for Equality of Means

F Sig. t df Sig. (2-tailed)

Mean Difference

Std. Error Difference

95% Confidence Interval of the

Difference SMS Equal

variances assumed

.094 .760 -.506 544 .613 -.01873 .03705 -.09152 .05405

Equal variances not assumed

-.505 541.999 .614 -.01873 .03707 -.09154 .05408

From Table 5.11 it is found that the mean value for SBI is 3.6571 and

the standard deviation is 0.43649, similarly in ICICI bank the mean value is

3.6758 and the standard deviation is 0.42925. The t-value is -0.506 and p is equal

to 0.613, this indicates that there is no significant difference between the mean

values of SBI and ICICI banks. Therefore the Null hypothesis is accepted at 5%

level. Hence it can be concluded that there is no significant difference between

the SBI and ICICI bank on the satisfaction level of the Mobile / SMS services.

229

11) H11 – There is no significant difference between the SBI and ICICI banks on

the satisfaction level with the respective overall satisfaction level.

Table 5.12. Independent Sample Test – Overall Satisfaction

Group Statistics

TYPE N Mean Std. Deviation Std. Error

Mean OS SBI 267 3.5805 .36394 .02227 ICICI 279 3.6004 .34358 .02057

Independent Samples Test

Levene's Test for Equality of

Variances t-test for Equality of Means

F Sig. t df Sig. (2-tailed)

Mean Difference

Std. Error Difference

95% Confidence Interval of the

Difference OS Equal

variances assumed

1.445 .230 -.657 544 .511 -.01991 .03028 -.07939 .03957

Equal variances not assumed

-.657 538.456 .512 -.01991 .03032 -.07946 .03965

From Tables 5.12 it is found that the mean value of SBI is 3.5805 and

the standard deviation is 0.36394, similarly in ICICI bank the mean value is equal

to 3.6004 and the standard deviation is 0.34358. The t-value is -0.657 and p is

equal to 0.511, this indicates that there is no significant difference between the

mean values of SBI and ICICI banks. Therefore the Null hypothesis is accepted at

5% level. Hence it can be concluded that there is no significant difference

between SBI and ICICI banks on the satisfaction level of overall satisfaction.

230

HYPOTHESIS TESTING-2

There is no significant difference between SBI and ICICI banks with respect

to customer satisfaction towards I.T. based products and services.

The exploitation of paired t-Test for SBI and ICICI customers over

customer satisfaction towards Information Technology based services clearly

identified the significant differences between these two customers over their

satisfaction level. Therefore, the null hypothesis is rejected at 5% level and

concluded that there is a significant difference between SBI and ICICI customers

over their level of satisfaction with I.T. based products.

Conclusion:- After examine the selected Ten Information Technology based

products and services, it can be concluded that there is significant difference

between SBI and ICICI banks with respect to customer satisfaction towards I.T.

based products and services.


Recommended