Page 1
177
177
Chapter - V
EGS AND SGRY IN NASHIK DISTRICT: GRASSROOTS
LEVEL IMPLEMENTATION AND PERFORMANCE IN
COMPARATIVE PERSPECTIVE
5.0 Introduction:
The second objective of this study was to understand the
salient features of administration and implementation mechanisms
of EGS and SGRY on the basis of empirical data. The third objective
of this study was to empirically evaluate the performance of EGS
and SGRY in a comparative perspective. This fifth chapter is
designed to analyse the data in the context of both the second and
the third objective of the present research. As noted in the chapter
on methodology, 12 villages from Nashik district were selected as a
sample and an attempt to understand the salient features of
administration and implementation mechanisms of both EGS and
SGRY works was made. To guide the inquiry for fulfilling both the
above mentioned objectives of this research, the following questions
were kept in mind:
a) What are the salient features of administration and
implementation mechanisms of EGS and SGRY? Which
PEP is more effective in its implementation at the
grassroots level?
b) What are the conditions that resulted in good or bad
implementation of both the PEPs at the grassroots level?
c) How the implementation of the two PEPs is different in
terms of the level of development in three areas in the
district?
This chapter is mainly based on the empirical observations,
evidences and data related to implementation and performance of
EGS and SGRY. The Sarpanch, Deputy Sarpanch, Gram Sevak,
Page 2
178
178
Talathi, Mukadam and the workers, were the six main categories of
the respondents. Informal interviews with the political leaders,
higher level implementing officers, scholars and members of civil
society organisations were also conducted to seek detailed and
comprehensive understanding of the scheme implementation and
performance.
The data collected from the six main categories of respondents
enable us to compare the 12 EGS projects and 12 SGRY projects
according to a range of variables selected to compare EGS projects
with SGRY. The inferences are drawn on the basis of the responses
gathered from these respondents.
The chapter has been divided into four sections as under:
Section One- Profiles of different categories of
respondents selected as sample
Section Two- A Comparison of Implementation of EGS
with SGRY in Nasik District
Section Three- A Comparison of Performance of EGS
with SGRY in Nasik District
Section Four- Implementation and Performance of EGS
and SGRY: A Critical Evaluation
Now, let us see the three sections one by one.
SECTION –I
5.1 Section One- Profiles of different categories of
respondents selected as samples
As noted in the chapter II the researcher selected six main
categories of respondents. Those include- EGS and SGRY workers
(85), Mukadams (24), Sarpanchs (12), Deputy Sarpanchs (12), Gram
Sevaks (12) and Talathis (12). The profile of the each these
categories of the respondents are given below:
Page 3
179
179
5.1.1 Profile of the workers
The workers working on the worksites selected as a sampled
respondents were 85. 51 of them were EGS workers and 34 were
SGRY workers. The data are presented in Table 5.1 the proportion of
young workers (25 to 35) years was high (40%) by those who were in
the age group off 18 to 34 were (28.2%). Others belonging to different
age categories were less than 20% each. Number of female workers
under sample was very low (18.8%) against male workers (81.2%).
Among the sampled workers, majority of them were from ST
category (81.2%). The workers belonging to Mahadev Koli, tribal
group were highest in number in the sampled workers (41.2%).
Following this were the Koknas (28.2%) and Warli (5.9%). Nav
Baudhha workers were very low in number (3.5%). Higher caste
groups like Vanjari and Marathas were 4.7% and 1.7% respectively.
Socio-economic backwardness of the workers thus remains the major
factor that pushes them to seek work under the EGS and SGRY.
Among the tribals, the Mahadev Kolis relatively have less access to
land and that is why their number was high among the workers.
Looking at the educational background of the sample workers,
it can be seen that 32.9% of the workers were illiterate. Those
educated up to 5th and 10th standard were 22.4 and 34.1%
respectively. It was striking that about 10% of the workers were
college going youths. Helping parents during the vacations for
earning bread might have been the main cause.
The livelihood means of the workers were not very diverse.
40% of them were wage labourers and 23.5% were small farmers and
simultaneously also were wage labourers. Workers relied on
agriculture for their livelihoods were 34.1% and 2.4% and involved
were involved in part time service and part time agriculture. 35.3%
workers had no access to land at all. Those who had land were either
Page 4
180
180
small land holder or dry land holder. Among the sample workers
3.6% were having some irrigated land.
More than 54% of the workers were living in nuclear type
family. The tribal workers were leading among them. Rest of the
45.9% workers hailed from joint type of family. 44.7% of the workers
had family size ranging 6 to 9 members followed by another 40%
having family size of 2 to 5 members. The average family size was
just above 5 members per family.
About 50% of the workers had two earning members in their
family. No. of families of the workers with three earning members
was 22.4% and more than three members was 23.3%.
To assess family income of the workers is rather a difficult job.
The workers were not able to tell about their earnings. I simply
asked them to calculate their earnings from different sources of the
all family members roughly. There has been the tendency among the
workers to disclose less total family earnings. More than 78% of the
workers reported that they had family average earnings less than
Rs. 30 000 a year. Workers with earnings more than Rs. 70 000/- a
year were just 1.2%.
There has been cycles and flows of migration from less
developed areas to developed areas of Nashik district. The tribal belt
of Nashik district, being less developed belt has remained the core
area of out migration. 16.5% said they only migrated when there
were conditions of droughts. More than 68% of the workers were
regular migrants to developed belts of the district. That is either
towards Nashik city for any casual unskilled works or towards
agriculturally richer zone like Niphad, Pimpalgaon Baswant. The
tribals (popularly known here as Koknis) were among the leading
migrants to other developed areas.
Page 5
181
181
Table 5.1
SAMPLE WORKER’S PROFILE Sr.
No. Variable Category Frequency Percentage
1) EGS
2) SGRY
51
34
60.0
40.0
1 Scheme Name
and No. of
workers Total 85 100.0
18 to 24 Years 24 28.2
25 to 35 Years 34 40.0
36 to 45 Years 13 15.3
46 to 55 Years 8 9.4
56 to 60 Years 2 2.4
60 Plus Years 2 2.4
Below 18 Years 2 2.4
2 Age
Total 85 100.0
Male 69 81.2
Female 16 18.8
3 Sex
Total 85 100.0
Maratha 1 1.2
Vanjari 4 4.7
Dhor 1 1.2
Nav Baudhha 3 3.5
Kokana 24 28.2
Mahadev Koli 35 41.2
Warli 5 5.9
Thakar 2 2.4
Vadar 2 2.4
Bhill 2 2.4
Mang 1 1.2
Lonari 2 2.4
Dawar 2 2.4
Muslim 1 1.2
4 Caste/Tribe/
Community
Total 85 100.0
Non Reserved
Caste Category
1 1.2
SC 3 3.5
ST 69 81.2
NT/DT/VJ 7 8.2
OBC 4 4.7
Muslim Monority 1 1.2
5 Caste Category/
Religion
Total 85 100.0
Illiterate 28 32.9
Up to 5th 19 22.4
5th to 10th 29 34.1
11th to 12th 6 7.1
FY to Graduate 3 3.5
6 Education
Total 85 100.0
Page 6
182
182
Service +
Agriculture
2 2.4
Agriculture 29 34.1
Agriculture +Wage
Labourer
20 23.5
Wage Labourer 34 40.0
7 Means of
Livelihood
Total 85 100.0
No land 30 35.3
Below 2 acres dry 12 14.1
2-5 dry 30 35.3
6-10 dry 4 4.7
11 and above dry 6 7.1
Below 2 Irrigated 2 2.4
Irrigated + Dry 11
acres and above
1 1.2
8 Family Land
Holding
Total 85 100.0
Joint 39 45.9
Nuclear 46 54.1
9 Family Type
Total 85 100.0
2-5 34 40.0
6-9 38 44.7
10-15 9 10.6
More than 15 4 4.7
10 Family
Members
Total 85 100.0
1 5 5.9
2 42 49.4
3 19 22.4
4 11 12.9
5 and more 8 9.4
11 Earning
members
of the family
Total 85 100.0
Less than 10 000 25 29.4
10 000 - 20 000 42 49.4
21 000- 30 000 12 14.1
31 000 - 40 000 2 2.4
41 000 - 50 000 2 2.4
More than 70 000 1 1.2
Cannot say 1 1.2
15 Yearly Family
income
Total 85 100.0
Never 13 15.3
Only in conditions
of drought
14 16.5
1 month a year 12 14.1
2-3 months in a
year
25 29.4
12 Trends of
Migration
To city
4 months in a year 12 14.1
Page 7
183
183
More than 4
months in a year
3 3.5
Frequent
interaction with
city
6 7.1
Total 85 100.0
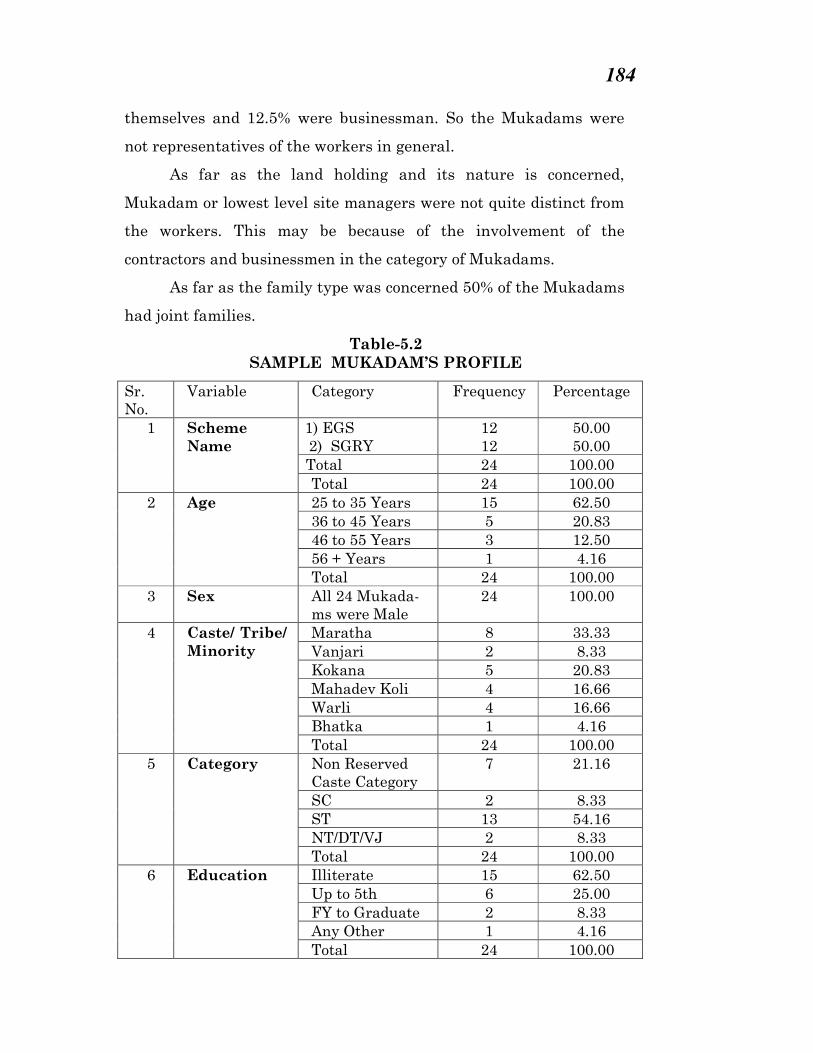
5.1.2 Profile of the Mukadams
The Mukadam is the lowest level on site manager of the
works. The data relating to the sample Mukadams are presented in
the table 5.2. From 24 worksites all 24 Mukadams were selected as a
sample. Mukadams were relatively younger in age. 62.5% of the
Mukadams belonged to 25 to 35 years age category followed by
another 20.83% of them who belonged to 36 to 45 years age category.
All of them were male. More than 54% of the Mukadams working on
EGS- SGRY sites were tribals. However as compared to the workers
the percentage of non tribal Mukadams was on higher side. 33.3% of
the Mukadams were Marathas. 20.83% of the Mukadams were
Kokana, Warli and Mahadev Koli 16.66% each and 4.2% belonged to
Nomadic Tribes. Marathas or higher caste Mukadams were 21.16%,
predominantly from the developed and semi developed areas where
as tribal Mukadams (54.16%) were dominant in less developed belt.
Mukadams were supposed to be educated enough to handle
accounts work but 62.5% of the Mukadams were illiterate. Another
25% were educated up to 5th standard and only 4.16% were educated
up to college level. Here skill and qualification was not important
but the reliability and ability to handle the human, non human
resources and especially the outsiders was considered more
important.
Mukadams had diverse livelihood avenues. 25% of them were
government serviceman or lowest agency men and another 25% were
wage labourers. 20.8% of the Mukadams were contractors
Page 8
184
184
themselves and 12.5% were businessman. So the Mukadams were
not representatives of the workers in general.
As far as the land holding and its nature is concerned,
Mukadam or lowest level site managers were not quite distinct from
the workers. This may be because of the involvement of the
contractors and businessmen in the category of Mukadams.
As far as the family type was concerned 50% of the Mukadams
had joint families.
Table-5.2
SAMPLE MUKADAM’S PROFILE
Sr.
No.
Variable Category Frequency Percentage
1) EGS
2) SGRY
12
12
50.00
50.00
Total 24 100.00
1 Scheme
Name
Total 24 100.00
25 to 35 Years 15 62.50
36 to 45 Years 5 20.83
46 to 55 Years 3 12.50
56 + Years 1 4.16
2 Age
Total 24 100.00
3 Sex All 24 Mukada-
ms were Male
24 100.00
Maratha 8 33.33
Vanjari 2 8.33
Kokana 5 20.83
Mahadev Koli 4 16.66
Warli 4 16.66
Bhatka 1 4.16
4 Caste/ Tribe/
Minority
Total 24 100.00
Non Reserved
Caste Category
7 21.16
SC 2 8.33
ST 13 54.16
NT/DT/VJ 2 8.33
5 Category
Total 24 100.00
Illiterate 15 62.50
Up to 5th 6 25.00
FY to Graduate 2 8.33
Any Other 1 4.16
6 Education
Total 24 100.00
Page 9
185
185
Service 6 25.00
Service +
Agriculture
2 8.33
Agriculture+
Wage Labourer
2 8.33
Wage labourer 6 25.00
Contractor 5 20.83
Business 3 12.50
7 Means of
livelihood
Total 24 100.00
No land 7 21.16
Below 2 acres
dry
2 8.33
2-5 dry 8 33.33
11 and above
dry
4 16.66
6-10 Irrigated 2 8.33
11 and above
Irrigated
1 4.16
8 Family Land
Holding
Total 24 100.00
Joint 12 50.00
Nuclear 12 50.00
9 Family
nature
Total 24 100.00
5.1.3 Profile of the Sarpanchs
All the 12 Sarpanchs from the sampled villages were selected
as a sample. The data relating to the socio-economic background of
the Sarpanchs are presented in the table 5.3. Majority (58.33%) of
the Sarpanchs were from age group of 25 to 35 years. Again, 58.3 of
them were male and 41.7% of them were female. Reservation for
women in Panchayati Raj is the only reason there to see why these
women could reach there to become Sarpanch. The percentage of
young Sarpanches seems to be increasing in recent years.
Out of 12 Sarpanchs, 6 (50%) were tribals, and 4 (33.3%) were
Dalit. Ramoshi and Vanjari were 8.33% each. This shows that all
the Sarpanches were from SC, ST and OBC category. Nav Baudhha
and Koakanas were dominant among these (33.33% each). Caste
reservations played dominant role here.
All the Sarpanchs in the sample were having moderate
educational level; SSC passed. 16.66% of the Sarpanchs and 8.33% of
Page 10
186
186
the Deputy Sarpanchs had completed their graduation. Their
background in terms of land holding revealed that, 25% of the
Sarpanchs were landless labourers (two of them told that they have
land access but they do not get any benefit from the family land) and
one was contractor/businessman. All the remaining 8 (66.7%) were
dependent on agriculture.
Only 8.3% of the Sarpanches were without land holding. All
the others were farmers. 41.6% of them had some irrigated land.
This indicates that, those who had better economic position could
reach to acquire position of Sarpanch. Half of the Sarpanches had
joint family background.
Table- 5.3
BACKGROUND PROFILE OF THE SAMPLE SARPANCHS
Sr.
No.
Variable Category Frequency Percentage
1 Scheme Name EGS and SGRY 12 100
Below 25 Years 2 16.7
25 to 35 Years 7 58.3
36 to 45 Years 2 16.7
56 to 60 Years 1 8.3
2 Age
Total 12 100.0
Male 7 58.3
Female 5 41.7
3 Sex
Total 12 100.0
Vanjari 1 8.3
Nav Baudhha 4 33.3
Kokana 4 33.3
Mahadev Koli 2 16.7
Ramoshi 1 8.3
4 Caste/ Tribe/
Minority
Total 12 100.0
SC 4 33.3
ST 6 50.0
NT/DT/VJ 2 16.7
5 Category
Total 12 100.0
SSC to HSC 2 16.7
SSC +Diploma 8 66.7
Graduate 2 16.7
6 Education
Total 12 100.0
Page 11
187
187
Agriculture 8 66.7
Landless Labour 3 25.0
Business
+Contractor 1 8.3
7 Means of
livelihood
Total 12 100.0
No land 1 8.3
Below 2 acres dry 1 8.3
2-5 dry acres dry 2 16.7
6-10 acres dry 3 25.0
Below 2 Irrigated 1 8.3
Irrigated +Dry
up to 5 acres 2 16.7
Irrigated +Dry 6-
10 acres 1 8.3
Irrigated + Dry
11 acres and
above
1 8.3
8 Family Land
Holding
Total 12 100.0
Joint 6 50.0
Nuclear 6 50.0
9 Family Type
Total 12 100.0
5.1.4 Profile of the Deputy Sarpanchs
The 12 Deputy Sarpanchs belonging to the 12 sample were
selected as sample respondents. Among the Deputy Sarpanchs, an
overwhelming majority (i.e. 75%) belonged to young age group i.e.
they were below 35 years of age. All the Deputy Sarpanchs were
male. 50% of the Deputy Sarpanchs were belonging to tribal
category. Vanjari and Mali constituted 25% and 8.3% respectively;
they were relatively better positioned. In terms of their educational
level, 83.2% of the Deputy Sarpanchs had matriculation and post
matriculation education to their credit whereas 8.33% of them had
completed their graduation. Deputy Sarpanchs were found relatively
better off economically than the Sarpanchs. 83.3 were engaged in
agriculture, 8.3 in services and 8.3 were doing agriculture with
supportive earnings from wage labour. No one of them was landless.
66.7% of the Deputy Sarpanchs were having joint type of family
background.
Page 12
188
188
Table: 5.4
PROFILE OF THE DEPUTY SARPANCHS
Sr.
No. Variable Category Frequency Percentage
1 Scheme
Name and
Number
EGS and SGRY 12 100
Below 25 Years 1 8.3
25 to 35 Years 8 66.7
36 to 45 Years 2 16.7
46 to 55 Years 1 8.3
2 Age
Total 12 100.0
3 Gender Male 12 100.0
Vanjari 3 25.0
Mali 1 8.3
Nav Baudhha 1 8.3
Kokana 1 8.3
Mahadev Koli 5 41.7
Ramoshi 1 8.3
4 Caste/ Tribe/
Minority
Total 12 100.0
SC 1 8.3
ST 6 50.0
NT/DT/VJ 4 33.3
Minority 1 8.3
5 Category
Total 12 100.0
Up to SSC 2 16.7
SSC to HSC 3 25.0
SSC + Diploma 4 33.3
HSC + Diploma 1 8.3
Graduate 1 8.3
Post Graduate 1 8.3
6 Education
Total 12 100.0
Service 1 8.3
Agriculture 10 83.3
Agri+ Labour 1 8.3
7 Means of
livelihood
Total 12 100.0
No land 1 8.3
Below 2 acres
dry 1 8.3
2-5 dry 3 25.0
6-10 dry 1 8.3
11 and above dry 1 8.3
8 Family Land
Holding
11 and above
Irrigated 2 16.7
Page 13
189
189
Irrigated + Dry
11 acres and
above
3 25.0
Total 12 100.0
Joint 8 66.7
Nuclear 4 33.3
9 Family
Type
Total 12 100.0
5.1.5 Profile of the Gram Sevaks
The 12 Gram Sevaks were selected as sample who belonged to
the sampled villages. The data regarding their socio-economic
background are presented in table 5.5. Majority of them (53.3%)
belonged to higher age group of 25 to 35 followed by those belonging
to year’s age group 36 to 45 years age group (41.7%). Only one Gram
Sevak hailing from semi developed belt was female. Majority of the
Gram Sevaks were from the castes like Marathas (58.3%), Lingayat
(8.3%) and Dhangar (8.3%). Only 16.6% were tribals representing
relatively better of tribal groups in the regions like Kokna and
Warli.
The Gram Sevaks are expected to complete SSC or HSC with
agriculture diploma. Gram Sevaks in this category of education were
relatively few in number and 41.66% of them were graduates. All the
Gram Sevaks were involved in service. Besides, 58% of them were
having agricultural income as means of livelihood. Nearly 50% of
them had owned irrigated land. Most of them (75%) were having
nuclear type of family background.
Page 14
190
190
Table: 5.5
PROFILE OF THE SAMPLE GRAM SEVAKS
Sr.
No.
Variable Category Frequency %
1 Scheme
Name
EGS and SGRY 12 100
25 to 35 Years 7 58.3
36 to 45 Years 5 41.7
2 Age
Total 12 100.0
Male 11 91.7
Female 1 8.3
3 Sex
Total 12 100.0
Maratha 7 58.3
Dhangar 1 8.3
Kokana 1 8.3
Warli 1 8.3
Lingayat 1 8.3
Chambhar 1 8.3
4 Caste/ Tribe/
Minority
Total 12 100.0
Non Reserved Caste
Category 8 66.7
SC 1 8.3
ST 2 16.7
NT/DT/VJ 1 8.3
5 Category
Total 12 100.0
Education SSC to HSC 1 8.3
SSC +Diploma 2 16.7
HSC + Diploma 4 33.3
Post Graduate 5 41.7
6
Total 12 100.0
Service 5 41.7
Service + Agriculture 6 50.0
Agriculture 1 8.3
7 Means of
livelihood
Total 12 100.0
No land 5 41.7
2-5 dry land 1 8.3
6-10 Irrigated 3 25.0
11 and above Irrigated 2 16.7
Irrigated +Dry up to 5
acres 1 8.3
8 Family Land
Holding
Total 12 100.0
Joint 3 25.0
Nuclear 9 75.0
9 Family Type
Total 12 100.0
Page 15
191
191
5.1.5 Profile of the Talathis
The Talathi is lowest ranked official from the revenue
department. The 12 Talathis selected as a sample were relatively
older than the Gram Sevaks (66.7%) belonged to age group of 36 to
45 years and 25% to the age category of 46 to 55). Except one female
Talathi (8.3%) all were male. Like Gram Sevaks, majority of them
were from the Maratha Castes (50%) and the rest half of them were
from the backward caste/tribe; SCs (16.7%) and STs (33.3%).
In terms of education 8.33% were graduates and 16.66% had
education less than SSC. All the remaining Talathis had education
up to SSC and HSC (16.7% respectively). New generation Talathis
and Gram Sevaks were better educated. The newly recruited female
Talathis and Gram Sevaks were visible although not welcomed for
these hitherto male dominated jobs.
66.66% of the Talathis were having agriculture as a side
business. 25% of them had irrigated land. The other 33.33% relied
only on their service as a source of livelihood.
25.0% of the Talathis did not have access to land as owners.
Those having land were supported by some irrigational facilities.
They said their land and agriculture was managed by the family
members since they were very busy in their service. Half of the
Talathis were hailing from joint type of families.
Table: 5.6
PROFILE OF THE TALATHIS
Sr.
No.
Variable Category Frequency %
1 Scheme Name
and No. of
Talathis
EGS and SGRY 12 100
25 to 35 Years 1 8.3
36 to 45 Years 8 66.7
46 to 55 Years 3 25.0
2 Age
Total 12 100.0
Page 16
192
192
Male 11 91.7
Female 1 8.3
3 Sex
Total 12 100.0
Maratha 6 50.0
Nav Baudhha 2 16.7
Kokana 2 16.7
Mahadev Koli 1 8.3
Bhill 1 8.3
4 Caste/
Tribe/Minority
Total 12 100.0
Non Reserved
Caste Category 6 50.0
SC 2 16.7
ST 4 33.3
5 Caste Category
Total 12 100.0
Up to SSC 2 16.7
SSC to HSC 4 33.3
SSC+Diploma 2 16.7
HSC + Diploma 2 16.7
Graduate 1 8.3
Post Graduate 1 8.3
6 Education
Total 12 100.0
Service 4 33.3
Service +
Agriculture 8 66.7
7 Means of
livelihood
Total 12 100.0
No land 3 25.0
2-5 dry 5 41.7
6-10 dry 1 8.3
3-5 Irrigated 2 16.7
6-10 Irrigated 1 8.3
8 Family Land
Holding
Total 12 100.0
Joint 6 50.0
Nuclear 6 50.0
9 Family Type
Total 12 100.0
5.2 Section Two- A Comparison of Implementation of EGS
with SGRY in Nashik District
Section two analyses aspects of implementation of EGS and
SGRY in Nashik District, with dimension of variation observed in
Developed, Semi Developed and Less Developed areas of Nashik
District.
Page 17
193
193
Implementation is a process of achieving the goals of the
scheme through a chain of organized human resources plus
administrative machinery of the governing body. Scheme design of
framework, planning, administration, institutional bases, execution
of the scheme activities and the way of running work sites, role of
the implementing agencies, distribution of wages and amenities to
actual beneficiaries etc. are the aspects of the implementing
processes.
The main variables relating to the process of implementation
aspects that have been considered here for analysis include: a)
Demand patterns and decision making in bringing EGS-SGRY
works; b) Decision making in selection of works; c) Means of
communication to the concerned people in the village about the
starting of work; d) Nature of work and Agency of implementation;
e) Nature of Monitoring and supervision- who did it, visits,
frequency; f) Number of days workers worked on the sample sites; g)
Selection of workers: Social Inclusion and Social exclusion-bases,
reasons and implications, h) Sufficiency of EGS/SGRY workers,
alternatives; i) Wages and Income gains to workers, j) Amenities
provided on work sites, k) Gaps in the work and its reasons, l)
Measurement- who did, when, how; m) Observance of the procedures
or norms laid down: cards, contractor, local and outsiders, 60:40
ratio; o) Unofficial Involvement of Political leaders and stakeholders,
p) Which scheme is better implemented, q) Role of Agency, agency
officers and the Implementers and r) The Level of Political
Involvement.
Instead of analyzing them separately, let us evaluate them by
clubbing the interrelated variables. An overall attempt was made to
seek answer to the questions: How the works were began, planned
and executed at the grassroots level?
Page 18
194
194
How the EGS and SGRY works began and were planned in the
villages? This was the initial important aspect to understand their
implementation. This can be understood in the context of the
regulations and guidelines of the schemes and what practices
actually were followed at the village level.
The researcher attempted to collect the data relating to the
following: Wheather workers and some of the implementers had
adequate knowledge of the schemes or not? Did the EGS workers
demanded the work by following procedure laid down?
1) How the EGS and SGRY works were brought to the villages?
How decision making took place while selecting the works? How
workers were communicated about the starting of the works?
2) How the worker beneficiaries were included or excluded? What
could be the implications of this inclusion and exclusion? What
was the nature of the works? Which were started? How the works
were supervised, monitored and measured? What was the nature
of onsite problems? In what way the workers were benefitted?
(Wages, foodgrains, amenities, employment opportunities)
3) How there was an involvement of intermediaries, machine and
elite stakeholders?
4) What was the role of agency officers and implementers? What
about the quality of implementation?
5.2.1 Knowledge about the Scheme and Pattern of
Demanding the work:
As a scheme EGS is a very complex scheme in its
implementation. The workers, Talathis, and others associated with
the scheme, must have basic knowledge of various procedures
involved in its implementation.
Page 19
195
195
During the field-work visits, the researcher found that many
such procedures that were important to avail the benefits of the
scheme were not known to the workers and even to some of the
Sarpanchs, Gram Sevaks and the Talathis. 64.7% workers working
on the EGS sites did not know the scheme-name under which they
were working.
EGS is a demand driven scheme. The article 3 of the
Employment Guarantee Act of 1988, says that every adult person in
the rural areas in Maharashtra shall have the right to get a
guaranteed employment for doing unskilled manual work and to
receive wages thereof weekly, or in any case, not later than a
fortnight. Unless and until the workers from the villages demand for
the work under EGS in writing, EGS will not be allotted or started
in the village concerned. Each worker has to demand for EGS work
by filling up form No. 4. Then, Talathis are expected to register the
names of the potential workers on the basis of such demands and he
is also expected to distribute EGS identity cards to the workers.
It was revealed during the field visits that, workers did not
take initiative in registering their name as potential workers
because 91.8% of them did not know the demand driven nature of
the EGS works. No worker had registered the demand by filling in
form No. 4. Though 13.72% of the EGS workers had made demands
for the works, the correct procedure was, however, not followed by
them. They had put the oral demands through mediators and other
stakeholders. In some instances, the demands were also initiated by
the implementing officers who wanted to start particular EGS works
in certain villages. Not all the workers were issued the identity cards
by the Talathis. Only 23.5% of the workers from the sample were
having EGS cards.
Page 20
196
196
Then, the question arises as to how most of the workers could
get EGS works without demanding on their own. The information
elicited through the personal interviews revealed that, the local
political leaders, Sarpanches, Gram Sevaks, Talathis, Gram
Panchayat members made demands on behalf of the workers. In
doing so, the procedures were not followed in most of the cases.
Thus, the verbal request, collective general demands made by the
Gram Panchayat could bring the EGS works to the villages. 3.92% of
the EGS workers did not know how or by whose efforts they got the
work. Making collective demands through representatives or by
Gram Panchayats is not illegal but it showed the inability of the
workers to follow the procedures to get EGS works.
Demand making in EGS is also shaped and influenced by the
stake-holders’ interests. Contractors, Agency Officer’s intervention
and elite stakeholder’s demands also played role in bringing EGS
work to particular villages. One Sarpanch from the developed belt
said, “you need good interactions and connections to bring EGS
works to your village. Just demand making is not enough. Constant
follow-up at Tehsil office or agency level is also required.”
All the 12 Sarpanchs reported that they did make serious
efforts to bring EGS to their respective villages. Eleven Assistant
Sarpanchs also told that they made some efforts to bring EGS and
that too with the help of Gram Panchayat decisions. But workers, on
the other hand, hold the view that nobody from the villages was
serious to bring EGS works to them and to their villages.
Talathi is the lowest ranked EGS officer placed at the
grassroot level to collect the demands and forward these to Tehsildar
office of the Taluka. The data showed that half of the Talathis were
not sufficiently aware of their role in EGS.
Page 21
197
197
Table 5.7
Answer of the Talathis about their Role in EGS
Implementation
Responses of Talathis Frequency Percent
Know very well 1 8.3
Fairly good 5 41.7
Confused about the role 4 33.3
Do not know the role 2 16.7
Total 12 100.0
Although the Gram Sevaks did not have direct concern with
EGS they are expected to deliver information of all policies and
programmes in Gram Sabhas and in Gram Panchayats. This has not
been done by most of them; 4 of the 12 Gram Sevaks claimed that
they did made efforts to aware people and encouraged them to make
EGS demands. The rest 8 (66.7%) of them said they did not do
anything to bring EGS in their villages.
SGRY: SGRY is basically not a demand driven scheme. The specific
work under the first stream is given to specific village on the basis of
selection of the village done either by Panchayat Samiti member or
by ZP member. Under second stream, specific funds are allotted to
each Panchayat on certain fixed criterion. The villagers cannot
further demand the extra work besides the one which happens to be
based on the given funds despite they are in more vulnerable
condition. For successful implementation of the scheme, knowledge
about the SGRY scheme is essential.
During the field visits, it was revealed that most of the
workers and even some Sarpanchs did not know even the name of
SGRY. Some of them still called it by its earlier name ‘Jawahar
Yojana’. 91.8% of the workers did not know that their respective
Page 22
198
198
villages get SGRY funds annually to plan and complete the works for
generating employment for the poor.
Thus, it was noticed that was lack of awareness about both the
EGS and SGRY schemes among most of the workers, Sarpanchs,
Talathis and Gram Sevaks who are the key persons in the process of
implementation at the grassroots level.
Regional Variation: It is interesting to note that 71.42% of the
EGS workers, who had made demands for the work were from the
less developed areas. This may be due to several reasons like-high
incidences of poverty, vulnerability and less alternative employment
opportunities, earlier experience of working under EGS, need to
avoid migration and relatively better knowledge of the scheme. Some
efforts of the civil society organizations also influenced the demand
making (its details would be covered in the next sections and
chapter).The tribals from the less developed areas were not just
better awared of making demands but also one step ahead in making
collective demands in order to put higher some pressure on the
implementing body to open the work in their respective villages.
The tribal took collective decisions regarding the works. This
might not be done through the Gram Sabha every time but some sort
of collective interest has been taken by the tribal poor.
Page 23
199
199
Case No. 5.1: “Innovative Experiments in Making EGS
Demand collectively”
This is the case of one of the tribal villages. The villagers were
worried about possible leaking of percolation tank that was build
for more than 10 years back. The village was entirely dependent
on the tank for water (both for drinking and agriculture). There
was shortage of water in the village and strength of the
percolation tank was declining due to the leakage. The villagers
made several applications to the concerned departments but did
not get any response from them. They collectively decided to
repair the tank by making use of EGS. Some agency men, when
they were convinced about the issue, helped them. The whole
village made an effort to get the work sanctioned under EGS.
They took labour contract and the whole village was working for
the tank repair work. The poor from the tribal village said, we
were desperate to save the tank and were ready to do anything
for it. Finally they did it by collective efforts.
5.2.2 Decision making in selection of works
EGS: As per the guidelines under EGS workers do not have much
say in decision making about the selection of the works. This mainly
applies to SGRY scheme. SGRY: Who decided the nature of the
works is an issue related to the SGRY. SGRY provides the
opportunity to take decision about the work by the Gram Sabha in
participatory, democratic manner. 26.47% of the SGRY workers said
that the Gram Sabha was conducted for deciding, planning and
managing the works. 29.49% said since they did not attend the
Gram Sabhas regularly, therefore, they did not know about it.
Page 24
200
200
Table 5.8
Was Gram Sabha conducted to discuss and decide about
SGRY work?
Development Category
Developed Semi Developed Less Developed
Total
Yes 1 4 4 9
No 4 2 9 15
Do not
know 5 3 2 10
10 9 15 34
Table 5.9
Did workers participate in discussion in G.S.
about SGRY Works?
Development Category
Developed
Semi
Developed
Less
Developed
Total
Yes 1 1 2
No 4 7 13 24
Not
Applicable 5 2 1 8
Total 10 9 15 34
During informal discussions, most of the villagers and
members from Gram Panchayat said that they did not know about
the collective-democratic decision making and planning incorporated
in SGRY. The Gram Sevak did not explain the basics of SGRY in the
meetings. A question was asked to the workers was ‘who took final
decision about the SGRY work?’ The responses are presented in
table 5.10.
Page 25
201
201
Table 5.10
Who took final decision about the SGRY work?
Responses Developed Semi
Developed
Less
Developed Total
Gram Sabha
Collectively 0 0 1 1
Gram
Panchayat
Collectively
0 0 2 2
Sarpanch 1 1 2 4
Gram Sevak 2 5 4 11
Sarpanch +
Gram Sevak 2 5 4 11
Contractor 2 2
Do not know 5 3 5 13
12 14 18 34
The data presented in the table 5.10 clearly reveal that, the
decision about the selection of the works is not being taken in
according to the procedure laid down.
Regional Variation: Discussions in Gram Sabha and participation
of the workers in the deciding and planning of the SGRY works was
little higher in semi developed and less developed areas. The
principle of participatory-democratic decision making in the Gram
Sabhas about the SGRY works largely remains on paper. Instead of
decision making in Gram Sabhas, the final decision in most of the
cases is taken by other stakeholders having their extraneous vested
interests. The Sarpanch and Gram Sevaks were leading decision
makers in semi and less developed areas whereas, such elites had
upper hand in developed areas as well.
Page 26
202
202
5.2.3 Means of communication to village about the starting
of work
Sargrantha, the bible of EGS, says that, each and every
worker from the village should be communicated before
commencement of work at EGS worksite. Drum beating and
announcing is the usual method used for such communication. This
provides maximum opportunity to rural poor to participate in the
work project and selection bias is removed. SGRY procedures also
expect the same thing. The village authorities and the agency
officers undertaking the work in the village under EGS or SGRY
work projects were expected to communicate the information about
the commencement of the works by drum beating in the village, by
holding separate gram Sabha or at least putting the notice about
commencement of the works on the Gram Panchayat notice board.
Against this backdrop, let us look at the empirical realities at the
grassroots level.
EGS: Drum beating method for communication was used in only one
case EGS work. Notice on Gram Panchayat board was another
method used by another one village. In case of still another village
special Gram Sabha meeting was held to convey the message of
opening of the EGS work. In all other cases no such method of
communicating the commencement of the work project was used.
SGRY: The guidelines regarding communicating information about
the commencement of work were not followed seriously in most of
the SGRY works too. In 91.6% SGRY cases the workers were not
communicated about the commencement of SGRY works before. One
Gram Sevak put the notice of the work on the Gram Panchayat
notice board. A general apathy, ignorance about the guidelines and
sometimes deliberate intentions of hiding the information could be
Page 27
203
203
some of the main reasons for this. In some cases, the message was
given to some of the potential workers.
Regional Variation: There was no much regional variation
observed with regard to the issue of prior communication to workers
about the commencement of works. Less developed/Tribal areas too
did not pay much attention to communicate the commencement
information to the village poor. One Sarpanch reported that since,
the tribal poor are generally more desperate in seeking work
opportunities, no such method was required.
5.2.4 Aspects of Work Implementation
The specific aspects of the work implementation examined and
discussed below include: (a) place of worksite, (b) nature of work and
implementing agency, (c) allocation of funds, (d) supervision,
monitoring and managerial issues, (e) gaps in the work, (f) schedule
of measurement of work, (g) who took the measurement of the work,
(h) sufficient availability of workers. Let us look at these aspects one
by one.
(a) Place of worksite:
After decision making, the process of works implementation
starts at the location of the site. Variation with regard to place of
worksites of EGS and SGRY works was also observed.
EGS: According to 31.37% of the EGS workers, the sites were
located within the respective villages, 54.90 said those were close to
the villages and 13.7% were noted that the site located in radious of
more than 3 kms i.e. far from the villages concerned.
SGRY: In case of SGRY sites, according to 73.52% workers, the
worksites were located within the villages and 26.47% told that they
were close to the villages. No SGRY worksite was away from the
villages concerned. (See table 5.11)
Page 28
204
204
Some EGS sites were far from the villages. This may be
because of the nature of the EGS sites. Generally, water
conservation works tend to be relatively bigger and need particular
catchment areas which may away from the village concerned.
Table 5.11
Place of the worksite: Respondent Workers Responses
Place of the worksite
Scheme Inside the
village
Close to
village
Far away
from the
village
Total
EGS 16 28 7 51
SGRY 25 9 0 34
Total 41 37 7 85
The other dimensions of site implementation can be analysed
as under-
(b) Nature of work and Agency of implementation
The PEPs like EGS and SGRY have an important objective of
creating rural infrastructure that would boost the development of
the village. The government emphasized Water conservation and
Soil conservation works. These two work -types were considered
central for development of village economy and agriculture. What
kinds of works were undertaken under EGS and SGRY? who
selected those works? with what intensions? were the main issues of
our concern here.
There are many agencies and their officers involved in the
programme implementation. They are supposed to be onsite
implementers. Minor Irrigation (MI), Building and Construction (B
and C), Agriculture, Public Works Department (PWD), Forest and
others were the leading agencies or departments involved both in
EGS and SGRY. Only 10.6% of the workers were unaware of the
Page 29
205
205
implementing agency of the work where they were engaged. About
43% of the workers from the sample did work under Minor Irrigation
agency or department that showed that they were engaged in water
conservation works.
EGS: EGS policy regulations say that workers can only demand
EGS works and they do not have ultimate choice to select the nature
of the work. EGS being the centralized, bureaucratic oriented
scheme, the policy implementers and especially the agency officials
are supposed to decide the nature of EGS work.
The nature of the EGS works implemented in the 12 sample
villages were as under: 3 Soil Bandhara, 1 Aforestration+ Mazgi, 1
Afforestation, 2 Plants Development, 1 Cement Bandhara, 1
Bandhara reaping work, 1 Village tank works, 1 Road construction+
Aforestration, 1 CCT.
Minor Irrigation (6), Agriculture (02), Forest department (02)
and Social Forestry (03), PWD (01) were the agencies by which the
EGS works in the 12 villages were going on. In two villages more
than one EGS works were undertaken.
SGRY: The SGRY works were undertaken in 12 villages include: 1
Soil Bandhara, 4 Stone Bandhara, 1 Cement Bandhara, 1 Gutters /
Raw (Kaccha) road, 1 Land leveling for play ground, 1 Kitchen shed,
1 Gram Panchayat office building, 2 Funeral shed, 2 Well
construction, 1 Waste soil lifting, 1 Wall compound to Gram
Panchayat office with 2 Urinary around. Some villages did more
than one work at a time.
58.2% of the SGRY works were water or soil conservation
works and the remaining 49.8% of the works were of buildings and
construction works.
Minor Irrigation, Agriculture, Forest department were the
prominent agencies in SGRY. PWD and B and C are the least
Page 30
206
206
engaged agencies. They are more involved in SGRY works in
comparison with the EGS. Some building construction works like
construction of Gram Panchayat building, kitchen shed for schools
are allowed in SGRY.
So the nature and government agencies associated with the
works under EGS and SGRY were different. EGS was specialized in
forest development and plantation and thus given scope to agencies
like forest and social forestry while as SGRY did also emphasized
construction works and invited agencies like Building and
Construction.
Regional Variation: It can be seen from the data presented in the
table 5.12 that majority of the works in tribal areas were water and
soil conservation works. In the developed and semi developed areas
on the other hand, roads construction and other infrastructural
works were predominant.
Table: 5.12
Nature of the work projects
EGS SGRY
Development
Category
Worksite
No. Nature of work Nature of work
1 Aforestration +
Plant
Development
4 Stone Bandharas
2 Plants
Development
Gutters / Kaccha
road
3 Cement Bandhara Construction of
latrines
4 Soil Bandhara Funeral shed
Developed
5 Aforestration/
Mazgi
Kitchen shed Semi
Developed
6 Plants
Development
Land leveling for
play ground
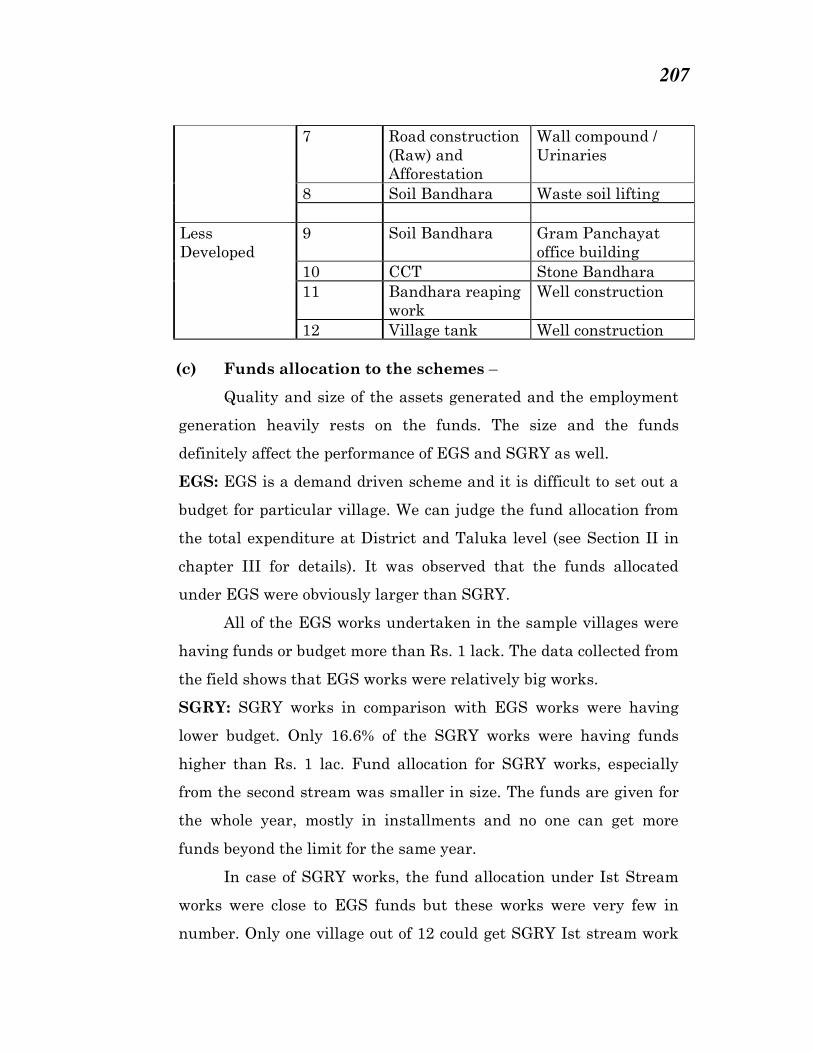
Page 31
207
207
7 Road construction
(Raw) and
Afforestation
Wall compound /
Urinaries
8 Soil Bandhara Waste soil lifting
9 Soil Bandhara Gram Panchayat
office building
10 CCT Stone Bandhara
11 Bandhara reaping
work
Well construction
Less
Developed
12 Village tank Well construction
(c) Funds allocation to the schemes –
Quality and size of the assets generated and the employment
generation heavily rests on the funds. The size and the funds
definitely affect the performance of EGS and SGRY as well.
EGS: EGS is a demand driven scheme and it is difficult to set out a
budget for particular village. We can judge the fund allocation from
the total expenditure at District and Taluka level (see Section II in
chapter III for details). It was observed that the funds allocated
under EGS were obviously larger than SGRY.
All of the EGS works undertaken in the sample villages were
having funds or budget more than Rs. 1 lack. The data collected from
the field shows that EGS works were relatively big works.
SGRY: SGRY works in comparison with EGS works were having
lower budget. Only 16.6% of the SGRY works were having funds
higher than Rs. 1 lac. Fund allocation for SGRY works, especially
from the second stream was smaller in size. The funds are given for
the whole year, mostly in installments and no one can get more
funds beyond the limit for the same year.
In case of SGRY works, the fund allocation under Ist Stream
works were close to EGS funds but these works were very few in
number. Only one village out of 12 could get SGRY Ist stream work
Page 32
208
208
during the study period. The second stream fund allocation under
SGRY was so meager that only those two villages out of the 12,
received funds more than one lac.
Regional Variation: SGRY funds are largely dependent on the
population of the village. Smaller villages with low population
reduce the funds. The villages from the less developed regions full of
people from S.C. – S.T. categories received higher per head funds
than the other categories but those were the typical villages with
lower population and thus got lower funds under SGRY.
(d) Supervision, Monitoring and Managerial Issues on the
site Problems
The supervision and monitoring mechanisms of the two
schemes are distict from each other.
EGS: EGS sites are required to be managed by the agency officials.
But in practice Mukadams, owners of the land where water
conservation works were going on, contractors also kept records and
supervised the works.
SGRY: Under SGRY, the responsibility to manage, supervise and
monitor the works goes to the respected Gram Sevaks, Sarpanches
and the members of the Gram Panchayats and sometimes to the
agency officers. Special committees are appointed from National
level to Taluka level for vigilance and monitoring. Their visits on
sites were rare. At the empirical level it was found that, 33.33%
(four) of these works were also recorded and managed by the
contractors, one from the workers themselves, one from Gram
Panchayat Peon and in one case no supervision or recording man
was visible.
Technical monitoring and supervision for the EGS works was
better than the SGRY projects.
Page 33
209
209
Regional Variation: It was observed during the fieldwork that, the
Works from the developed areas were more likely to be recorded and
supervised by the agency officers and contractors and works in semi
and less developed areas were recorded and managed by the
Mukadams, land owners in association with the agency men.
As far as SGRY works were concerned, the Sarpanch and
Gram Sevaks from the semi and less developed areas were more
serious about their duties than in the developed areas. Agencies
were more or less seemed negligent.
(e) Gaps in the work and its reasons
After the starting of the work on the sites, gaps in work are
frequently observed and most of the time they are inevitable. They
also reflect lacunae in the scheme implementation. In all, 44.7 % of
workers experienced gaps in the works they were working.
EGS: 25.9% of the workers reported that they experienced shorter
and occasional gaps in works and 20% of them experienced huge
gaps mostly observed on EGS sites. EGS projects are not ruled by
the annual budgetary cycle. They are larger and technically more
complex than SGRY projects, and therefore intrinsically more likely
to fall victim to logistical or organisational delays.
SGRY: The gaps were small and rare in the case of SGRY projects.
SGRY projects are relatively small, and supposed to be completed
within one year, and there is considerable organisational pressure to
complete work quickly.
Regional Variation: There was no much variation in case of gaps
in ongoing work on the basis of level of development area.
It is interesting to find out the reasons for such gaps in the
work. Workers were asked about the gaps. 2.4 % of the workers said
that the delays were due to lapses from implementing authority.
While as 1.2% of them said that it was due to natural obstructions.
Page 34
210
210
Another 1.2% reported that it was due to funding problems. 14.1%
workers said that non availability of workers as the reason. The
remaining workers did not know the reasons.
(f) Frequency of Measurement of the work done by the
workers:
Measurement of the work done by the workers is one of the
important factors relating to the implementation.
EGS: EGS works are expected to be measured every fortnight.
Measurement of the work was considered a responsibility of agency
officer. Measurements should be taken in front of workers so that
the workers could realize and relate the proportion of work they did
and the amount of payment they received. The data of the present
study reveal that, all such regulations were rarely followed on EGS
sites. At the time of visit, the researcher could not see sample pit,
brass measuring sample, onsite guiding board showing links
between amount of wages to the nature and amount of work were
absent in all of the 12 EGS sites under sample. On 8.33% EGS
worksites measurement was being taken as per schedule, sincere as
well as frequent. Measurements after every 15 days were present on
50% of the EGS sites but there were still some amount of
irregularities at times. On 41.66% EGS sites measurement was very
irregular.
SGRY: The SGRY norms are not directly saying anything about the
frequency of measurements but norm no. 3.4 from its guidelines say
that the wages should shall be made on a fixed day in every week.
That means measurement should be taken on every week. In case of
only 16.66% of SGRY worksites, measurements were being taken
after every week. In 16.66% it was taken after every 15 days. That
means measurement was fairly regular there. On 66.66% of the
SGRY works measurements were very irregular.
Page 35
211
211
Regional Variation: The measurement was relatively regular in
less developed regions rather than in the case of developed and semi
developed regions. (see Table 5.13)
Table 5.13
Frequency of measurement of the Works
Development Category Frequency of
measurement
Scheme
Name Developed Semi
Developed
Less
Developed
Total
EGS 0 1 0 1 Very Frequent
Total 0 1 0 1
SGRY 0 1 1 2 Weekly
Total 0 1 1 2
EGS 3 3 0 6
SGRY 1 1 0 2
After 15 days
Total 4 4 0 8
EGS 1 1 0 2
SGRY 0 2 0 2
After a month
Total 1 3 4
EGS 0 1 2 3
SGRY 3 2 1 6
After the work /
very late
Total 3 3 3 9
f ) Who took measurements?
68.2% of the EGS and SGRY workers said the measurements
were done by the agency officer; 28.2% said the lowest level Agency
men took measurements and 2.4% said the Mukadams on the site
took the measurements. (See table 5.14)
Page 36
212
212
Table 5.14
Who took measurements?
Who took
measurements Frequency Percent
1 Agency Officer 58 68.2
2 Lowest Level
Agency men 24 28.2
3 Mukadam 2 2.4
4 Do not Know 1 1.2
Total 85 100.0
Taking measurement is ultimately a responsibility of the
concerned agency officer but on occasions Mukadam, Gram Sevaks
too took measurements. Measurement by genuine Agency officer
was more common in EGS rather than the SGRY. Semi developed
areas were better in this regard. (see table 5.15)
Table 5.15
Who took measurements of the works done
Development Category Who took
measurements
Scheme
Name Developed Semi
Developed
Less
Developed
Total
EGS 1 5 2 8
SGRY 0 1 0 1
Agency Officer
Total 1 6 2 9
EGS 3 1 0 4
SGRY 1 1 0 2
Lowest Level
Agency men
Total 4 2 0 6
SGRY 0 2 0 2 Mukadam
Total 0 2 0 2
SGRY 1 1 2 4 Gram Sevak
Total 1 1 2 4
SGRY 2 1 0 3 Don’t know
Total 2 1 0 3
EGS: Some workers, especially the workers in EGS land leveling
work from the tribal belt complained that the measurement work
did not executed seriously. Measuring the work done in land leveling
Page 37
213
213
work is already very ambiguous work. The lapses from the
measurement really affect badly to the wages the workers earn
under the scheme and encourages malpractices and manipulations
of different kinds. These lapses, more specifically on EGS worksites,
were also responsible to the delayed payments.
The data collected from the Mukadams have presented in the
table 5.15. The data from the table reveal that in case of all the 12
EGS worksites, the measurements were taken by either agency
officer or lowest level agency men.
SGRY: In case of SGRY worksites, 50% of the measurements were
either done by the Mukadams or Gram Sevaks. These
measurements were relatively more irregular. Since SGRY II stream
works were shorter in time and budget, the some implementers tend
to measure the work after completion. Technical support and
measurement exercise was not prompt. Measurement was not
significantly done by the agencies associated with the DRDA or ZP.
This was not expected by the regulations.
EGS was little better than the SGRY in measurement
concerns.
Regional Variation:
The measurement of the EGS and SGRY works from
developed and semi developed regions were observed better the
works from the less developed areas because comparatively more of
them were conducted either by agency officer or lowest level agency
men.
g) Sufficiency of EGS/SGRY workers
75% of the Mukadam respondents said that the number of
workers were sufficient on their respective EGS and SGRY projects.
EGS: From Mukadam’s point of view on 50% of the EGS works
number of workers was sufficient and on 16.66% of the EGS projects
Page 38
214
214
workers were more than sufficient. On remaining 33.33% EGS
projects workers were short or insufficient.
SGRY: The Mukadam from all of the 12 SGRY projects said that the
number of workers working there was sufficient. 2 Sarpanch, 3
Gram Sevaks however, said there was problem of insufficient
workers for SGRY projects.
Regional Variation
EGS projects from the developed region clearly showed
shortage of workers. Out of 25 % of the total EGS works (all from
developed belt) and 8.33% of total EGS works (all from semi
developed belt) workers were short. (see table 5.16)
Table 5.16
Sufficiency of EGS workers
Development Category Sufficiency of
EGS workers
Scheme
Name Developed Semi
Developed
Less
Developed
Total
EGS 1 4 1 6
SGRY 4 6 2 12
Yes
Total 5 10 3 18
EGS 3 1 4 No
Total 3 1 4
EGS 1 1 2 More than
sufficient Total 1 1 2
Source- Data collected from Mukadams
On two SGRY worksites (one from semi and one from less
developed area worksite) the response of the workers was so high
that they had many workers did not get chance to work on those
sites.
For both SGRY and EGS, most of the respondents from
developed and semi developed belt believe that inviting contractors
and contract labour from outside is wise because workers were
insufficient severally.
Page 39
215
215
5.2.5 Following of the procedures or norms of Scheme
Implementation
The scheme implementation at various levels is expected to
follow certain procedures and norms. Did the implementers of EGS
and SGRY were keen to follow the procedural norms of the scheme
implementation? Giving preference to the local workers, adhering to
wage-material ratio of 60:40, controlled use of machines and
contractors were few of such norms considered while collecting data
to study the implementation process.
a) Were the local workers given preference in employment?
EGS: According to the norms local workers should have been
preferred and they were entitled to get work on EGS and SGRY. The
researcher found that around 10% of the workers from both the
schemes were brought from far outside. Needless to say that these
workers were brought by the professional, big contractor involved in
the schemes.
SGRY: SGRY scheme too gives preference to the local workers. But
the involvement of outsider workers, mostly linked with the big
outsider contractor was not uncommon on the SGRY sites, the
researcher noticed.
Regional Variation: The workers and villagers of less developed
tribal regions did know better about the entitlements to be given to
the locals. They were more aware of the rights of the local people
over the employment generated under the PEPs in and around of
that particular village.
The number of insider or local workers was relatively highest
in less developed areas. Workers from long distance (beyond 10 kms)
were higher in one EGS and three SGRY projects from the developed
and semi developed areas. EGS did slightly better in providing
employment to the local workers.
Page 40
216
216
b) Wage and Material components (60:40 ratio)
The norms of both the schemes clarify that more expenditure
(60%) should be made on the wages for labour and not beyond 40%
of the expenses should go for the material component that include-
machine, contracts, raw material etc.
EGS: The data obtained from the Talathis and Mukadams reveal
that, in 33.3% of the EGS cases the 60:40 ratios was not followed.
EGS regulations do provide some exceptions to the rule. On road
projects or big water conservation projects this limit was extended
up to 51:49. But still proportion of expenditure on machines and
material was higher. Two Talathis were of the view that following
60:40 ratio of expenditure was rather very difficult in recent years.
SGRY: The data from the Gram Sevaks reveal that, the ratio of
60:40 related to the expenditure on wages and material was not
followed in case of 66.6% of the SGRY cases. As the employment of
contractors, machine and material component increases the benefits
to the poor worker decreases.
Not following wage material/machine (60:40) ratio was higher
in SGRY than EGS and therefore, EGS was better in this concern.
Regional Variation: There was no prominent regional variation as
far as following the 60:40 ratio of expenditure on workers and
machine/material respectively in case of EGS worksites. On SGRY
projects, however, such variation was observed. The data obtained
from the Sarpanchs reveal that, in semi-developed areas overriding
the 60:40 ratio was as much as the double than what was observed
in case of the SGRY projects from the developed and less developed
areas.
Page 41
217
217
Case No. 5.2: Why 60:40 norm get overruled?
One EGS officer explained that non-observance of 60:40 rules
might be inevitable for several times. The unexpected hard stone
found while digging the holes, increased cost of material, machine
charges and several other practical on site problems make it
impossible to follow the 60: 40 ratio. But many times due to
illegal use of machinery, illegal entry of big contractor and such
other reasons also results in violation of 60:40 labour –material
ratio.
c) Involvement of Intermediaries, contractors in the
implementation
EGS: The guidelines of both EGS and SGRY schemes reject the idea
of existence of intermediary between the implementers and the
beneficiaries. Contractors, middle men are not allowed. Task-work
system is normal in EGS implementation but unofficial contracts are
not allowed in EGS. If the budget is higher, the contracts can be
given to Labour Cooperative Societies and if the work is still bigger
the tenders from Government contractors (up to 10% of the total
expenditure) are invited and passed by certain procedures.
As per the information given by Mukadams, there were 8.3%
cases of EGS where there was 100% involvement of big outside
contractors was observed. In two EGS works (16.66%) cases of EGS
not complete but higher involvement of around 75 to 99% of the big
outside contractors was found.
SGRY: Works under SGRY on the other hand, are expected to be
planed, manage and implemented by the locals. They can take
technical help from the agency departments but here too contractors,
middle men are not allowed. Under SGRY, Contractors are not
permitted to be engaged for execution of any of the works under the
Page 42
218
218
programme (SGRY Guidelines: 5.16.1:19). But still the involvement
of middleman or and other intermediate agency was observed while
executing the works under the programme. The data from the
Mukadams reveal that, 33.3% of SGRY works, there was 100%
involvement of big outside contractors (see Table 5.18). The use of
machines causing exclusion of the human labour was obviously
highest on those sites. In 8.3% SGRY cases, there was higher
involvement (approximate 75 to 99%) of the big outside contractors.
However, the involvement of small/part-time outside contractors was
observed in higher proportion in EGS than SGRY works.
As a result of this the employment generation ability of the
schemes was negatively affected.
The norms of both the schemes clarify that 60% of the
expenses should go to the labour component of the schemes and not
beyond 40% of the expenses should go for the material component of
expenses that include- use of machine, contracts, raw material etc.
This 60:40 ratio of wage-material expenditure was not followed in
66.6% of the SGRY cases (Gram Sevak data) against 33.3% of the
EGS cases. This was evident from the data collected from Talathis
and Mukadams. As the employment of contractors, machine and
material component increases, the benefits and transfers to the poor
workers decreases. This was higher in SGRY.
In case of both the EGS and SGRY sites illegal involvement of
big contractors was observed. However, the general trend is that the
EGS works were more accessible to the rural poor than SGRY. In
33.33% SGRY cases, due to the involvement of the contractor
middlemen, there was almost no room for the poor sections to get the
employment.
Regional Variation: Involvement of contractors and middleman
was observed and middleman in all the three regions. However, the
Page 43
219
219
involvement of big outsider contractors was highest (20.83%) in
developed regions, followed by semi developed regions (8.33%) and
less developed regions (4.16%). Involvement of small contractors
with less participation in the work was observed more in less
developed regions. As reported by the Mukadams point of view the
number of no contract works were 3 in developed region, 4 in semi
developed region and 3 in lees developed region. On 50% of the EGS
projects and 33.33% of the SGRY projects any kind of contractor was
not involved. (See Table 5.17)
Table 5.17
Percentage of the work given to big outsider contractor
Development Category Total Percentage
of the work
on big
outsider
contract
Developed Semi
Developed
Less
Developed
1 0 0 1
1 0 0 1
0 1 0 1
0 1 0 1
0 0 1 1
100%
Total 2 2 1 5
1 0 0 1
1 0 0 1
1 0 0 1
75-99
Total 3 0 0 3
0 1 0 1
0 0 1 1
50-74
Total 0 1 1 2
0 0 1 1
0 0 1 1
25-49
Total 0 0 2 2
0 1 0 1
0 0 1 1
1-24
Total 0 1 1 2
1 0 0 1
1 0 0 1
0%
1 0 0 1
Page 44
220
220
0 1 0 1
0 1 0 1
0 1 0 1
0 1 0 1
0 0 1 1
0 0 1 1
0 0 1 1
Total 3 4 3 10 Source: The primary data obtained from Mukadams.
On EGS and SGRY worksites 100% use of contractor was
observed by Mukadam in all regions; developed (16.66%
worksites), semi developed (16.66% worksites) and less developed
(8.33% worksites).High involvement of contractor (i.e. about 75 to
99%) was more visible in developed region only (25.00%
worksites). Low participation of the contractors (i.e. below 25%)
was observed in semi and less developed regions (8.33% each).
(See table 5.18)
5.2.6 Selection of Worker Beneficiaries
a) Selection of workers: Social Inclusion and Social
exclusion:
Measuring social exclusion is difficult task. However, Arjan de
Haan (1997) believes that it is possible to measure social
exclusion and to develop multi dimensional aspects of
deprivation. Arjan de Haan (1999:5) clarifies that, “the central
definition of the notion of exclusion stresses the processes
through which people are being deprived, taking the debate
beyond descriptions of merely the situation in which people are.”
Thus, to identify areas of social exclusion one has to look at the
hurdles, gaps, forces and inabilities in the process of inclusion in
social networks in general and particularly in the
implementation of PEPs.
Page 45
221
221
Let us see how caste, class, gender, region and other socio-
economic parameters played their role in social inclusion and
exclusion of the workers and the beneficiaries.
i) Female Participation in EGS and SGRY:
Averages of female participation from the data collected for
the study reveal that female workers were very less in number in
both EGS and SGRY schemes.
EGS: There were two data sets regarding the percentage of
female participation among the EGS. The sampled data revealed
that among the sampled workers the 15% participation of women
workers.
However, when the rates of female participation was
calculated on the basis of total female workers working on all the
12 EGS worksites, the percentage of female participation was
found to be around 74.9%. Why it is that female participation was
low at some specific worksites?
The use of contract labour and involvement of big contractors
with their own hired labour, were the main reasons for decreased
participation of female workers on EGS worksites.
SGRY: In general terms, considering the total number of workers
working on the SGRY worksites (not only from the sampled sites)
female participation in the labour force of SGRY works was
26.25%. Average female participation on EGS sites was 47.91%
against 26.25% on SGRY projects.
In case of five sampled villages women were totally excluded from
the SGRY works. There were several case specific reasons for
that. SGRY works in four villages were given to outsider big
contractors. These contractors used their own men for the EGS
works. Women were totally excluded from the works. SGRY
works of well construction were undertaken in two of the villages
Page 46
222
222
where only men were employed who were professional well
construction contractor workers. They thought women were not
required in this work. Low participation of women in SGRY was
clearly found contradictory to the guidelines that specifically
favourable for female participation by reserving their quota i.e.
30%.
Regional Variation: Average female participation in case of
developed and semi developed belt was surprisingly higher on the
EGS sites (25% and 15.38% respectively). But Female
participation in semi developed and less developed areas was
higher in SGRY works (22.22% and 33.33% respectively). (See
table 5.18)
Table 5.18
Averages of female participation data
Development
category
Total
Workers
Female
workers
Female
participation
on EGS in %
Total
Workers
Female
workers
Female
participation
on SGRY in %
Developed 20 05 25.00
10 01 10.00
Semi
Developed
13 2 15.38 09 02 22.22
Less
Developed
18 1 5.55 15 05 33.33
Total 51 8 15.68
34 8 23.52
There were some noteworthy case stories about this from the field.
Two of them are given as below-
Case No. 5.3: Contracts and women: A women worker from a
village complained that under both EGS and SGRY women
worker and older workers have declining employment protection
since the gang of workers dealing the contract / task work, avoid
women and elders to maximum the work and in turn maximum
the returns.
Page 47
223
223
Case No. 5.4: Skilled works and women: SGRY have tendency
to generate more skilled work than EGS and thus without such
specified skills women workers are kept aside. For example-
SGRY works in few villages and many other works like well
construction and building construction works hardly provided the
working opportunity to women workers.
ii) Caste System, worker’s inclusion and their
participation in PEPs.
EGS: The caste system in India and economic inequality has
clear association with each other. This is especially true in rural
sections of India. Significant number of the workers (both on EGS
and SGRY worksites) belong mainly to the backward castes. The
backward castes and tribes had almost no problem in inclusion in
the workforce of EGS and SGRY.
There have been very negligible cases of fighting among the
members of different castes in getting EGS works. The castes like
Maratha, Vanjari, Mali, Dhangar were very rarely observed on
EGS sites. There were several reasons for that. First, they had
better land access. Second, they were power holders in Developed
and Semi developed areas. Third, they are better off people and
least interested in manual works outside their farms. The
sample comprises of only three workers from these castes.
SGRY: Generally, the local workers belonging to lower castes and
tribes were present on PEPs. Caste composition of the SGRY
workers was little different. Higher rate of outsider workers did
change the caste composition of workers on SGRY sites. Two
workers belonging to Dawar caste were working on SGRY work
in the developed region. (See the case no. 5.5)
Page 48
224
224
Case No. 5.5: Outsider Workers brought from Labour
Market
The two Dawar workers, migrated from Madhya Pradesh were
working on a SGRY work project in one village from developed
region. They did not know about SGRY. They readily accepted the
job which was giving assurance of work for more than a month
and above Rs. 150/- wages per person per day.
The labour contractor cum Mukadam admitted that the workers
were brought from labour market and said that, bringing outside
workers was inevitable since local labourers were not willing to
work there.
Regional Variation: More than 80 percent of the total EGS and
SGRY workers in the sample were tribal. Around 5 percent of
them were from dalit castes and the other constitute from the
middle castes and nomadic tribes. Among tribals, Mahadev Kolis
(42.68%) and Koknas (28.2%) were the prominent tribals mostly
situated in less developed region. Their higher level of inclusion
was obvious for the reason that they have poor land access in the
Nashik region. Koknas, Thakurs and Warlis were the tribes with
relatively better land access. (See Table 5.19).
Page 49
225
225
Table 5.19
Caste/Tribe/Minority composition and participation of
Workers
Scheme
No.
Caste/Tribe/
Minority Development Category Total
Developed
Semi
Developed
Less
Developed
Maratha 0 0 1 1
Vanjari 2 0 0 2
Dhor 1 0 0 1
Kokna 4 1 5 10
Mahadev Koli 7 9 7 23
Warli 1 0 4 5
Thakar 1 1 0 2
Vadar 0 2 0 2
Bhill 1 0 1 2
Mang 1 0 0 1
Lonari 2 0 0 2
EGS
Total 20 13 18 51
Vanjari 2 0 0 2
Nav Baudhha 1 2 0 3
Kokna 0 1 13 14
Mahadev Koli 4 6 2 12
Dawar 2 0 0 2
Muslim 0 1 0 1
SGRY
Total 10 9 15 34
Regional Variation: The tribal workers were mostly
representing the semi developed and the less developed areas.
While as most of the other castes were representing the
developed and semi developed areas.
b) Wages and Foodgrain gains to workers
EGS: Wages to the workers on EGS and SGRY are paid partly in
cash and partly in the form of food grains. On an average, EGS
workers were comparatively better paid.
On an average, the EGS workers got wages per day at the rate of
Rs. 56.35 (including the amount of foodgrain). It was better than
the scheduled rates under minimum wages which was Rs. 47/- for
Page 50
226
226
the Nashik region during the period of this research. The highest
wage rate the worker under EGS received was Rs. 150/- per day
and the minimum was Rs. 28/-. The machine drivers and skilled
workers usually get highest returns. The lowest paid workers
received fewer wage because they were working in gangs and
sometimes the labour contract fails to yield the desired wage rate.
Agency officers hold that, those who work less receivedless
amount as wage. EGS wages were generally based on the task
work wage system and not daily wage system. It is important to
note that a large number of the workers (86.2%) working on the
sites did not receive payments in the form of foodgrains.
Table 5.20
Daily average wages to workers including foodgrain
Sex Total Daily average wages
including FG Scheme
Male Female
SGRY 00 01 01 No payment in Cash
Total 00 01 01
EGS 01 01 02
SGRY 01 00 01
20-30
Total 02 01 03
EGS 05 00 05
SGRY 01 01 02
31-40
Total 06 01 07
EGS 17 06 23
SGRY 06 03 09
41-50
Total 23 09 32
EGS 06 01 07
SGRY 07 03 10
51-60
Total 13 04 17
EGS 05 00 05
SGRY 04 00 04
61-70
Total 09 00 00
EGS 04 00 04
SGRY 01 00 01
71-80
Total 05 00 00
EGS 02 00 02 81-90
Total 02 00 00
Page 51
227
227
EGS 01 00 01
SGRY 02 00 02
91-100
Total 03 00 00
EGS 01 00 01 101-120
Total 01 00 00
SGRY 04 00 04 121-150
Total 04 00 00
EGS 01 00 01 Not Applicable/
Salaried worker Total 01 00 01
SGRY: Average wages to workers, including the amount of
foodgrain, under SGRY were at the rate of Rs. 70.70 per day. The
highest wages paid under SGRY were at the rate of Rs. 150/- and
the lowest was at the rate of Rs. 32/-. On this issue of wages
SGRY was better paid.
This is because the higher number of skilled and contract
works under SGRY increased the rate of wages in case of SGRY
workers.
The four skilled workers, who worked on SGRY works received
highest wages (i.e. between Rs. 121/- to Rs. 150/-). 86% of the
workers from EGS and 64.7% from SGRY reported that they did
not receive food grains as a part of their wages and received
wages only in terms of cash. The maximum foodgrain they
received was 5kg and the minimum 2 kg. One of the responsible
respondents informally told the researcher that in his SGRY
project the workers did not receive wages or food grain, but
instead, rather forcefully they were given the material required
for toilet construction.
Regional Variation: The workers from the developed region
received average wages under EGS (including the amount of food
grain) at the rate of Rs. 58.68 as against SGRY at the rate of Rs.
73.55. The workers from the semi developed regions received
Page 52
228
228
average EGS wages at the rate of Rs. 61.57 as against SGRY at
the rate of Rs. 96.0. In the less developed region workers received
EGS wages of Rs. 58.35 against SGRY wages of Rs. 52.13.
The highest wage earners were the SGRY workers from the
semi developed areas. This was mostly due to the higher
involvement of big outsider contractors and due to the higher
machine use there. Involvement of contractors increases
involvement of skilled workers and thus those workers generally
receive higher wages. Higher level unofficial contracts on the
sites, however, decreases the work opportunity or mandays
generation under the schemes. Workers of both EGS and SGRY
from less developed areas received lowest wages. (see table Table
5.21)
Table 5.21
Averages wages to workers
EGS wages in
Rs.
EGS wages
in Rs.
Developed areas 58.68 73.55
Semi Developed
areas
61.57 96.00
Less Developed
areas
58.35 52.13
Many studies and the World Bank Report published in 1998
hold that wage employment programmes based on PEPs have
most effective potential to reach the benefits to the poor, both
directly and indirectly. Direct benefits to the poor go in the form
of wages and food grains. Both of these two factors indicate direct
income gain. The workers from the sample villages selected under
present study (EGS and SGRY sites) did receive wages that
helped to generate income but the picture is rather ambiguous.
The calculations of the wages and food grain they received are
Page 53
229
229
difficult to measure. The wages were paid on irregular basis, on
the criterion of work the workers did and the measurements
made by the implementing officials. The calculations made on the
basis of work days they worked on and the amount of Rupees and
the valuation of the amount of Food grain they received in Kgs.
Thus, the averages of the amount of wages plus value of Food
grain was roughly used for the assessment and analysis of the
income gains.
c) Difference observed in the delivery of wages and
foodgrains:
EGS and SGRY: There was no age bias as such while delivering
wages and Food grain. But gender and skill bias was observed
while delivering wages.
Minimum and Equal wages to male and female workers, is the
norm firstly incorporated in EGS and later on also become a
routine in PEPs. At least at the rate of Rs. 47/- per worker per
day should be given to by these norms. Against this norm,
however, 13.72% workers from EGS and 8.82% SGRY workers
reported that they received wages less than at the rate of Rs. 40/-.
Clearly, in these cases the norm of minimum wages was not
followed. All the 16 female workers from the sample from both
EGS and SGRY received wages including the amount of the food
grain not exceeding Rs. 60/-. However 24 male workers mostly
engaged in relatively better skilled jobs, and contracted skilled
workers received wages between Rs. 60/- to Rs. 150/-. SGRY
workers, since they were engaged more in skilled and contract
works, earned more than that of EGS workers. But as far as
unskilled work is concerned, EGS workers got better wages.
Page 54
230
230
d) Promptness or Delays in wage distribution
EGS: Delays in paying wages and food grains to workers on PEPs
have been considered as negative side from the worker’s point of
view.
Nobody from EGS workers received wages in stipulated 15
days time. 27.1% of the EGS workers from the sample received
much delayed payments and 17.64% had to wait for more than a
month for the wages.
SGRY: More than 50% of the workers from SGRY sites said that
they received wages in stipulated 7 days time. 17.6% SGRY
workers from the sample received very delayed payment of wages
and waited for more than a month. Delays in payments are
comparatively less in cases of SGRY for relatively faster
availability of funds. Nine EGS workers and 12 SGRY workers
had to wait for more than a month to get food grains funds in
hand but waiting for the food grain is specialty of SGRY. The
Sarpanch, Gram Sevaks said the government machinery to make
available food grain to the workers is seriously faulty and time
taking. Delays in payments and food grains are coupled with the
delayed workers’ work reports and measurements.
Regional Variation: Under EGS relatively prompt payment of
wages were observed in semi developed areas. 11.76 % of the
workers who received timely wages were from the semi developed
areas as against 2.35% from the developed areas and 5.88% from
less developed areas. There was no significant regional difference
in delays in delivering foodgrains to workers as a part of
payments.
Page 55
231
231
Table 5.22
Delays in payment of wages to workers
Development Category Total Whether
delays in
wages
Scheme No. Developed
Semi
Developed
Less
Developed
EGS 00 02 00 02 1-8 Days
Total 00 02 00 02
EGS 01 04 00 05
SGRY 01 06 05 12
9-15
Total 02 10 05 17
EGS 11 07 11 29
SGRY 01 00 04 05
16-30
Total 12 07 15 34
EGS 08 00 06 14
SGRY 00 00 03 03
31-60
Total 08 00 09 17
SGRY 00 00 03 03 More
than 60 Total 00 00 03 03
SGRY 08 03 00 11
EGS 00 00 01 01
No
delays
Total 08 03 01 12
EGS guidelines expect that Sarpanch, Gram Sevak, Talathis
must be present while distributing wages. Actually only one
Sarpanch (out of 12) and 2 Gram Sevak (out of 12) were remained
present regularly while distributing wages. Only one Sarpanch
and one Gram Sevak did regularly remain present while
distributing foodgrains to EGS workers.
On SGRY sites workers from semi developed areas received
relatively prompt wages.
e) Amenities provided on work sites
EGS act of 1979 prescribed that amenities to its workers must
be provided almost equal to the factory workers. Potable water,
crèches for the children coming with working mothers, sheds,
temporary accommodations for the outsider workers, free first aid
and medical facilities and half the daily wage rate for injuries; in
Page 56
232
232
case of death at the work-site, Rs. 50000/- to the next of kin of the
deceased; in case of disablement, an ex-gratia payment,
maternity leave for female worker were the basic amenities that
were supposed to be provided at work sites. Expenditure involved
for providing these facilities should be made out of the non-wage
component under the programme. EGS was applauded for
providing such amenities that were close to factory act provisions
for the oragnised factory workers. Most of these amenities were
also needed to be provided to SGRY workers.
EGS: However, there has been very serious apathy and sheer
negligence by the agencies and the implementers involved in EGS
and SGRY in providing these amenities to the workers. 30 EGS
workers out of 51 (58.82%) said that they did not receive any kind
of amenities on working site, not even potable water.
Ten of 12 Gram Sevaks (83.3%) did not even know about the
amenities to be provided on EGS worksites. One of the remaining
two Gram Sevaks said that, there were no amenities at all
provided to EGS workers and one said only water was provided.
SGRY: 76.47% of the SGRY workers said that they did not
receive any of the amenities on working site including potable
water. These works were closer to the village houses and the
implementers thought that water would be easily available there
around. (see table 5.23)
Page 57
233
233
Table: 5.23
Specification of amenities to onsite workers
Nature of Amenities Frequency Percent
No Amenities 59 69.4
Only Water 17 20.0
Water + Shelter 6 7.1
Water + Medicine+Shelter
+Tools 1 1.2
Crushes + Water 2 2.4
Total 85
100.
0
Regional Variation: Baring few exceptions with regard to some
amenities which were provided on some sites, no significant
variation in this regard was observed in terms of level of
development.
Table: 5.24
Regional variation in amenities to workers on sites
Development Category Specification
of Amenities Scheme No.
Developed Semi
Developed
Less
Developed
Total
EGS 13 6 11 30
SGRY 7 9 13 29
No Amenities
Total 20 15 24 59
EGS 5 7 0 12
SGRY 3 0 2 5
Only Water
Total 8 7 2 17
EGS 0 0 6 6 Water +
Shelter Total 0 0 6 6
EGS 1 0 0 1 Water +
Medicine+
Shelter+Tools Total 1 0 0 1
EGS 1 0 1 2 Crushes +
Water Total 1 0 1 2
In general terms, we can say, amenities at work were almost
absent except drinking water. Water, the basic amenity, was not
Page 58
234
234
even made available in few cases. Shelter for shed was observed
only in 6 workers. In general, EGS is relatively better in
providing amenities to the workers. EGS implementers at least
knew about the provision of such amenities but SGRY
implementers generally did not know much about it.
5.2.7 Intervention of Political leaders and stakeholders:
Involvement is nothing but the undue intervention of political
leaders and stake holders in demanding, sanctioning and
implementing the worksites. For example; -1) giving priority to
one’s own village or region or caste while demanding, allotting
the EGS or SGRY (first stream) works, 2) Influencing the
worksites and its implementation to facilitate or satisfy the
interest of one’s own party men, kins or class-castes etc.
Implementing officers from Minor Irrigation, Agriculture did
often complain about such undue interventions. They believed
that this was the most unpleasant part of their duty.
EGS: Political representatives at various levels are directly or
indirectly associated with EGS implementation. EGS being a
State Government Scheme, politicians got some responsibilities
and rights regarding framing, planning and implementing EGS.
They are--1) Each and every MLA, MLC and MP gets some
authority and control over the governmental programme carried
out in his electorate. 2) Some political leaders like MLA and MLC
could get opportunity to be the members of State and District
EGS Councils and they can play role in policy decisions and state
level planning as well as supervising of EGS activities. 3)
Political representatives from various levels for example MLA,
M.P., members of Z.P. and Panchayat Samiti are part of EGS
committees at District and taluka level. 4) Political leaders
including Sarpanch from the villages can put demands for EGS
Page 59
235
235
works on behalf of their voters. 5) Political leaders can start or
demand enquiry of EGS officers by charging allegations of
malpractices and corruption.
The cases studied in this research revealed that when EGS
demand makers were weak, unorganized and experienced
difficulties in putting their demands, they often used to go to the
politicians. Political interventions in EGS projects were observed.
Fair political involvement was also observed in both of the
schemes. Establishing patron client relationship with the village
masses benefits them so that they could get electoral footage.
Political leaders, leaders of labour organizations, Panchayat
Samiti and ZP members, MLAs do play such role in both EGS
and SGRY.
However, in recent times there has been change in this regard.
The political will regarding EGS or SGRY implementation has
been declining sharply. Interventions (both positively and
negatively directed) by the politicians are declining remarkably.
Case No. 5.6: Connections to tehsil office and towns works
The local elites from one tribal village were planned to grab
benefits of Jawahar well scheme under EGS. The real poor, their
preferences were kept aside and they brought sanctions for the
two Jawahar wells on their name. Local leaders and their
connections with the MLA, ZP and Panchayat Samiti members
are interested in seeking the benefits of the schemes. The local
villagers said four to five times a week, these so called leaders
visit the Taluka Panchayat Samiti or Tahsil office and pass their
time in maintaining the connections.
Page 60
236
236
SGRY: Political interventions in SGRY were more at local levels.
In SGRY first stream works, ZP and Panchayat Samiti members
do have any role to play and intervene.
Case No. 5.7: Dilemma between need and democratic
choice
One of the Shramajivi activists got elected as Panchayat Samiti
member. He said he did not know that SGRY I stream works
were allotted to certain villages of Panchayat Samiti member’s
choice. In allotting such works to certain villages, the members
see their personal stakes and the whole selection process were
thus politically biased.
Regional Variation: Political interventions did not have
significant regional variation. Such interventions were found
everywhere. In developed and semi developed regions their extent
might have been little higher.
Case No. 5.8: Double Game
The political leader from a village who also happened to be the
member of Taluka Panchayat Samiti opted for the nearing village
for big SGRY work under the first stream. When asked as to why
he selected the other village instead of his own village or the
village that would provide political mileage, his answer was
interesting. He said, the nearing village that he selected for water
conservation project was on the higher lands and the percolated
water would provide the benefits to his own village. He played
double game. On one hand, he posed himself free of bias in
selecting the village and on the other; he managed to benefit his
own village interests.
Page 61
237
237
Case No. 5.9: Political power and exclusion
One tribal village from semi developed area from one of the
sampled talukas was full of mixed caste-tribe categories. The
political leaders of Kokana tribe who had good contacts at
Panchayat Samiti office managed to earn EGS work on labour
contract. All the workers selected for the contract were Kokanas.
The Mahadev Kolis, the real poor from the village were excluded
from the work despite the Sarpanch women from there was
Mahadev Koli.
It is pertinent to note that, practically intermediaries have
emerged in between people and government for the reason that
the workers cannot get EGS work on their own strength as per
their demand easily. Thus, they have either go to the
intermediary like political leaders or they have to keep constant
follow up for getting the EGS work.
It is very difficult for the poor, tribals and women to go to the
Taluka place every now and then and keep follow up with agency
officer or with Tahsil office. They cannot afford spending time and
money for that. They even do not know how to keep follow up and
how to meet the officers. As a result, intermediaries get
opportunity to exploit the conditions in their favour.
5.2.8 Role of Agency, agency officers and the Implementers
General strengths and weaknesses as well as specific actions of
the implementing agencies do influence the performance of the
schemes. Extra ordinary contribution by the implementing actor
or agency, which would be unexpected in normal circumstances
need to be focused.
EGS and SGRY: To understand the dynamics of
implementation of PEPs one must study the interactions among
Page 62
238
238
the village leaders, officers and agency men. Gram Sevak,
Talathis, Sarpanch and Asst. Sarpanch were having better
liaison with the agency men. They admitted that they frequently
try to maintain good relations with the agency men. Village
elites and especially those having better land access too take keen
interest in maintaining relations with the agency men. These
relations help them to bring the works under either of the
schemes and see that they benefit most from it. One such
benefitted elite from the developed belt remarked that, the
agency men too were in search of safety pockets and safety
supporter from the villages under their area. PEPs and especially
EGS is very complicated scheme where anybody with little
knowledge of scheme regulations could catch the implementers.
‘Safe pockets’ technique of the agencies has been observed and
reported by some of the researchers who did field work on EGS
sites.
The stakeholder elites from the villages who sought works
especially promoting their agricultural benefits found to be the
unofficial supervisor. (Sony Pellissery called them unofficial
owners of the sites) These stakeholder elites thus acted handily
for the agency men who kept them engaged in multiple works at
a time and also did work in short of muster clerks of lowest
agency men.
The implementing agencies (e.g., line Ministries of the
government, private contractors, nongovernmental agencies or a
combination of the above) and the main office bearers involved in
the onsite implementation also influence how much benefits the
program transfers to the poor.
Page 63
239
239
Case No. 5.10: Role of Agency officer is important
Agency officers do influence the work positively or negatively. In
some pockets, some agency officers have good reputation and
workers join those works without hesitation. Some Agriculture
Officers have good reputation among the workers from their
respective belts. In case of a village from one Taluka, when the
researcher visited the just started EGS worksite, he observed
many workers working there did not know about the payment
details. The researcher found it strange. The workers said, “its so
and so Tatya’s work. We do not bother about the rates because he
will pay us what we deserve and we trust him”.
S. Liberman’s onsite observations based on the interviews of
EGS implementing officers from Pune and Ahmednagar are
worth to quote here. Liberman has noted, “ In fact, apart from the
general principles set out in the (EGS) Compendium, the field
staff appear to have been left largely to their own devices in
handling everyday matters and in coping with the crisis that
arise in EGS operation. It would seem that the success in
implementing EGS projects depends on how field officers respond
to circumstances in which they enjoy some discretionary powers
but are at the same time susceptible to various administrative
and political pressures.” The EGS implementing officers in
Nashik district experienced such crisis conditions of pressures
and onsite problems. The most threatening part of their job was
the complexity of EGS regulations of implementation. They said,
despite taking all the precautions and abiding the regulations of
implementation, some lacuna, errors are bound to happen. Many
of lacunas on the site for example delayed payments are part of
broader bureaucratic mechanisms. Any authority, journalists,
Page 64
240
240
politicians can catch them there. EGS and SGRY to some extent
seemed to make the implementing officers vulnerable for
blaming, for pressures and action against them.
5.2.9 Which is better implemented PEP?
EGS: Among the respondent’s categories, only Talathis and
workers thought that EGS was better implemented than the
SGRY. They think EGS has comprehensive mechanisms and
structure to help the rural poor and to strengthen the rural
infrastructure. Workers were not happy due to the delayed
payments and mistimed works under EGS but they said EGS,
provided them handful employment assurance, especially in
adverse conditions.
SGRY: Sarpanchs and Deputy Sarpanchs from the 12 villages
did think that SGRY was better implemented than EGS. This
may be due to their involvement in the scheme. SGRY received
58.3% votes from Sarpanchs and Deputy Sarpanchs and EGS got
33.3% of the votes from Sarpanches. 8.3% that is, one Sarpanch
could not judge which was better.
The most important reasons they advanced for their
judgments were varied. Some said ‘SGRY was better accessible to
the villagers’. Some others said, ‘it was locally managed’ so that
they could decide the nature of the work as per their needs. Those
who opted for EGS said, ‘it was better funded and thus provided
bigger works’. It was better in generating employment on larger
scales. Still some others said, ‘there was less politics in it and
thus it could reach to the commons’.
Regional Variation:
On scales of implementation, Sarpanches and Deputy
Sarpanchs in general and from semi developed and less developed
Page 65
241
241
areas in particular, preferred SGRY than EGS. Gram Sevaks
from all the regions said SGRY was better implemented.
Table: 5.25
Which is better implemented Scheme?
Which is better
implemented Type of Respondent
EGS SGRY Cannot
say
Total
Sarpanch 4 7 1 12
Deputy Sarpanch 4 7 1 12
Gram Sevak 2 10 0 12
Talathi 10 1 1 12
Total 20 25 3 48
The workers from semi and less developed areas prefer
EGS for longer and better employment opportunities.
A General Observation of EGS-SGRY Implementation
General strengths and weaknesses of the schemes, as well as
specific actions of the implementing agencies do influence the
implementation of the schemes.
Ground level contextual issues like social, economic, cultural,
political interests of the stakeholders do influence the
performance of the schemes. The state of developmental levels of
the regions and politics and economics associated with that also
influenced the scheme performance.
Historical factors that shaped the ground level contextual
factors also shaped the performance. The villages where EGS and
SGRY works were frequently undertaken did well in
implementing the scheme. The capabilities and experiences of the
implementers and the workers also raised the quality of
implementation.
Page 66
242
242
EGS projects have been observed to be relatively superior to
SGRY projects. In a number of ways, the EGS better meets the
needs of poor rural people for manual wage work and especially
for work at times when no other employment is available. The
most noteworthy reasons include a) SGRY work is driven by the
limited annual budget cycle rather than employment needs and
thus produced meager employment opportunities; b) SGRY
funding is spread almost evenly across all areas on population
and backwardness basis and they cannot satisfy the local
employment needs as well as the size and quality of
infrastructure it produces. c) First Stream SGRY funds are
concentrated very heavily on politicized Panchayati Raj
interventions. Their funds reached to less than 5% of the villages.
d) Politics around EGS was on the higher levels. However, it did
not influence much in the inclusion and exclusion of the workers
on the worksites. e) Involvement of contractors and machines was
relatively less in EGS despite the works under EGS were bigger
in size.
SGRY on the other hand did well in several aspects such as
better wages, timely wages, fewer gaps, better quantity of
foodgrain distribution. The villagers think that diverse local
needs like Gram Panchayat office building, kitchen cabinet for
the school (useful for Mid Day Meal preparations) and latrines
could be met under the SGRY projects. Implementation of the
SGRY however, found a difficult responsibility to some of the
Sarpanch and Gram Panchayat members. Without training and
sufficient information to them SGRY implementation could not be
systematic and fruitful.
Page 67
243
243
5.3 Section Three- A Comparison of Performance of EGS
with SGRY in Nasik District
We already defined in the first chapter that ‘Performance of
the scheme’ is a qualitative and quantitative output of a
particular scheme associated with its results towards achieving
the intended objectives. The performance indicators of the
qualitative aspects of the scheme that include- targeting,
implementations, quality, quality of assets, benefits, leakages,
distortions, diversions, capabilities and relative deprivations.
It is not easy to come to the generalised conclusions about the
performance of the two schemes from the limited study of 12
sample villages. Performance assessment is more than the cost
benefit analysis, on which the economists would rely. While
evaluating the performance of the two schemes in comparative
perspective, we have raised some questions and asked them to
the respondents who were workers and some of others who
involved as implementers.
The set of questions which the researcher asked while
assessing the performance of the schemes include following
questions:
1) How did the institutional framework, design of the scheme
pertaining to the administrative mechanisms, financial
provisions etc. worked in favour of the poor and for their
inclusion? Scheme design determines institutional capability
of the scheme.
2) What institutional arrangements generate employment
opportunities and transfer them to poor? For example in case
of SGRY, its design of democratic decentralization, local
management certainly influences levels of participation of the
Page 68
244
244
poor and in case of EGS the right to work was the main
outstanding feature. Did these schemes benefit the rural poor?
3) What was the quality of assets created under these schemes?
How far these assets have ability to generate the chain of
employment through development?
4) What are the direct and indirect benefits to the village
community in tackling poverty, unemployment and seasonal
adversities/vulnerabilities and migration?
To answer these questions, the data from the field was
analysed on the basis of following parameters:
Objectives and Design of the schemes, Funds allocation to the
schemes, Income gains through wages and foodgarin, Punctuality
of wages distribution, Amount of machine use replacing the
labour participation, Leakages and malpractices, Number of
mandays generated, Nature of monitoring and vigilance and its
impact, Completion of the work in time and delays-reasons for
delays, Quality of works, Level of Utility of works, Who benefitted
from the assets, Relevance of the scheme in need satisfaction,
Future profits of the work/asset, Outputs for the village.
5.3.1 Objectives and Design of the schemes
The program features (especially the level of the wage rate
and the timing of the program) and the design features
(implementing agencies and the institutional framework)
together determine the program’s efficacy as an anti-poverty
intervention and its cost- effectiveness. Legislative Provisions
and rights involved in the schemes also do influence the scheme
implementation and performance.
Page 69
245
245
A) Objectives of the schemes:
As far as the objectives of the two PRPs are concerned they are
not much different. But the provisions and characteristic features
of the two schemes were different.
EGS: EGS is more comprehensive for having wider objectives of
employment generation that must provide gainful results to the
workers and productive assets to the economy of the state. A
guarantee aspect of the EGS assuring to provide manual work is
another important aspect that empowers the workers targeted
under it. Targets like mitigation to drought, floods and conditions
of scarcity were also emphasized. (for more details see
Sargrantha 1989:2)
SGRY: The SGRY has two sets of objectives- First, the primary
one is to provide additional wage employment in all rural areas
and thereby provide food security and improve nutritional levels
and secondary one is the creation of durable community, social
and economic assets and infrastructural development in rural
areas (SGRY Guidelines:2001:2).
Regional Variation: There no regional dimension in their
objective and provisions but both of the schemes intended to focus
more on the areas of less developed, backward sections. SGRY
stood better here since 22.5% of the annual allocation under first
stream of the SGRY both at District and Block levels were
embarked for the individual beneficiaries of the SC and ST
families living below poverty lines and 30% employment
opportunities were reserved for women (SGRY
Guidelines:2001:3).
B) Nature of works and developments:
Not much difference is observed in the nature of works in EGS
and SGRY. Antecedents of SGRY were more focused on building
Page 70
246
246
construction works. However, SGRY although insisted on the
water and soil conservation works it undertook more building
construction works.
The institutional framework says EGS can go for big works
but SGRY cannot take big works like watershed development.
EGS did well in constructing soil and water conservation works.
Plantation and forest development works done by EGS is its
specialty. The nature of works under SGRY is required to be such
that they could be completed in one or two years, thus watershed
development projects require a large period to get such projects
completed.
Plantation and forest development works under EGS were
taken up in developed and semi developed areas. EGS and SGRY
projects from less developed belt were more concentrated on soil
and water conservation.
EGS has performed better in producing assets that would
benefit the villages in the long run.
5.3.2 Funds allocation to the schemes –
The size and the funds definitely affect the performance of
these PEPs. Quality and size of the assets generated and the
employment generation heavily rests on the funds.
EGS: EGS is demand driven for it is difficult to set out a budget
for particular village. We can judge the fund allocation from the
total expenditure at District and Taluka level (see Section II of
chapter III for details). But Funds under EGS were obviously
larger than SGRY. All of the EGS works under the sample were
having funds or budget more than Rs. 1 lacks. The data collected
from the field shows that EGS works were relatively big works.
SGRY: SGRY in comparison with EGS were having allocation of
meager funds. Only 16.6% of the SGRY works were having funds
Page 71
247
247
higher than Rs. 1 lac. Fund allocation for SGRY works, especially
from the second stream was smaller in size. The funds are given
for the whole year, mostly in installments and no one can get
more funds beyond the limit for the same year. SGRY- I st stream
works were close to EGS funds but these works were very rare to
get opened. Only one village out of 12 could get SGRY – I st
stream work during the study period.
The nature of work required under SGRY should to be such
that it could be completed in one or two years, thus on non
economic terms too, big projects like watershed development were
not possible. So on these line EGS has better performing abilities.
Regional Variation: The availability of SGRY funds were
largely depend on the population of the village. Smaller villages
with low population reduce the funds still further. The villages
from the less developed regions full of people belonging to SC-ST
categories, were having lower population and thus could get
lower funds under SGRY in Nashik district. The performance of
the SGEY in these small villages was hampered due to less
availability of funds. No village from the less developed areas
received SGRY funds more than one lac.
5.3.3 Income gains through wages and foodgarin
PEPs are generally criticized for wages paid to the workers
which are lower than the wage rate, or minimum wage decided
per person per day ( Rs. 47/- in the Nashik region).
What did the workers get while working on these sites? What
was the level of earnings? Did the earnings help the poor in
getting rid of their adversity? Let us see the findings of the
present study.
Page 72
248
248
Wages to the workers
EGS and SGRY: The minimum wages rule is applied to both
the schemes but still in some cases wages were paid to the
workers which were below the level of minimum wages for
agricultural work (for Nasik it is Rs. 47/- per day). Around 30% of
the workers received wages blow the standard line of Rs. 47/-.
The implementing officers reacted to this fact saying “in piece
rate type work, we cannot guarantee the wages. Workers did get
what they deserved for. Their wages were bound to the
measurements of their work.”
There were 3.92% of the workers from EGS and 2.94% of the
worker from SGRY who received wages below Rs. 30/-. Again,
9.80% workers from EGS and 5.88% from SGRY received wages
in the range of Rs. 31/- to Rs. 40/-. Another 40.09% from EGS and
26.47% from SGRY received wages in the range of Rs. 41/- to Rs.
50/-. There was not much difference between the earnings of EGS
and SGRY workers between the range of Rs. 51 to Rs. 120/- . But
11.76% of SGRY workers earned more than Rs. 120/-. This was
striking. The picture of the earnings of EGS and SGRY workers is
rather confusing. Still, it apparently showed that the skilled
contract work under SGRY could deliver better wages than EGS.
So, on an average SGRY workers were paid better wages than
EGS and performed well in this regard.
Average Wages to workers, including the amount of foodgrain,
under SGRY workers were Rs. 70.70 per day. This is because the
higher number of skilled and contract works under SGRY
increased the wage averages.
Page 73
249
249
Table 5.26
Wage Earnings in comparison: Workers
Daily average
wages including
FG
EGS
(workers
in
numbers)
EGS
(Workers
in %)
SGRY(workers
in numbers)
SGRY
(Workers
in %)
No payment in
Cash 00 00 01 2.94
20-30 2 3.92 01 2.94
31-40 5 9.80 02 5.88
41-50 23 40.09 09 26.47
51-60 07 13.72 10 29.41
61-70 05 9.80 04 11.76
71-80 04 7.84 01 2.94
81-90 02 3.92 00 00
91-100 01 1.96 02 5.88
101-120 01 1.96 00 00
121-150 00 00 04 11.76
Not Applicable
/Salaried worker
01 00
Total 51 34
Regional Variation: Regional variation was also observed in
the earnings. The workers from the developed and especially semi
developed regions earned more wages than the workers from the
less developed regions. The workers from the semi developed
regions received higher average wages. EGS wages they earned
Rs. 61.57 as against SGRY Rs. 96.0.
Table 5.27
Amount of daily average wages including foodgrain
Development. Category Total Daily average
wages
including FG
Scheme
Name Developed Semi
Developed
Less
Developed
SGRY 00 00 01 01 No payment
in Cash Total 00 00 01 01
EGS 01 00 01 02
SGRY 00 00 01 01
20-30
Total 01 00 2 03
Page 74
250
250
EGS 04 01 00 05
SGRY 00 00 02 02
31-40
Total 04 01 02 07
EGS 09 05 9 23
SGRY 02 01 6 09
41-50
Total 11 06 15 32
EGS 02 02 03 07
SGRY 03 04 03 10
51-60
Total 05 06 06 17
EGS 01 03 01 05
SGRY 02 00 02 04
61-70
Total 03 03 03 09
EGS 00 02 02 04
SGRY 00 01 00 01
71-80
Total 00 03 02 05
EGS 02 00 00 02 81-90
Total 02 00 00 02
EGS 01 00 00 01
SGRY 02 00 00 02
91-100
Total 03 00 00 03
EGS 00 00 01 01 101-120
Total 00 00 01 01
EGS 00 00 00 00
SGRY 01 03 00 04
121-150
Total 01 03 00 04
EGS 00 00 01 01 Not
Applicable /
Salaried
worker
Total 00 00 01 1
5.3.4 The Punctuality in wage distribution:
Did the workers receive wages as per the guidelines of the
schemes? Were they paid promptly?
The workers and most of the implementers did not know the
standard guidelines and amount of standard minimum wages
and foodgrains to be given to the workers. The implementers,
however, instructed to pay the piece rate wages to the workers for
the type and quantity of the works completed.
Page 75
251
251
EGS and SGRY: EGS norms say that the workers should be
paid their wages with 15 days of the work. (Ro. Ha. Yo.
Sargrantha: 8.3.8:89) SGRY norms say that they should be paid
within a week. (SGRY Guidelines: 3.4:8). The payment of wages
and food grain under EGS were relatively more delayed. The data
from the workers show that only 13.74% of the EGS workers and
majority i.e. 67.64% of the SGRY workers could get timely wages.
The statistical analysis shows that, 27.45% of the EGS workers
and 8.82% of the SGRY workers received payments very late (i.e.
is within 30 to 60 days) after the work. 8.82% of SGRY workers
complained for getting very late payment (i.e. after 60 days) after
the work.
Irregular and delayed measurements, red-tapism,
distributional blunders, were the typical reasons given by the
workers. The implementers on the other hand blamed the
complicated systems and procedure of releasing funds under
EGS.
SGRY had the same problems but relatively, it was better in
payments and delivering food grains for, having the funds and
food grains availability with the implementing agency. However,
SGRY Ist stream works were similar to the EGS works. (see table
5.2.30)
Regional Variation: Regional variation in late payments was
considerable. The data in the table shows that, 37.25% of the
EGS workers from developed region received late payments
against 13.72% from semi developed region and 33.33 from less
developed region.
Late payments in SGRY were very low proportion in case of
developed (3.94%) and semi developed regions (0.0%). But in less
developed region SGRY payments were late (29.41%). This was
Page 76
252
252
striking. The ignorance of the Sarpanch and miss coordination
between Sarpanch and Gram Sevak were the major reasons for
this.
Table 5.28
Delays in wage Distribution to workers on EGS and SGRY
Development Category Whether
delays in
wages
Scheme
Name Developed Semi
Developed
Less
Developed
Total
EGS 0 2 0 2 1-8 Days
Total 0 2 0 2
EGS 1 4 0 5
SGRY 1 6 5 12
9-15
Total 2 10 5 17
EGS 11 7 11 29
SGRY 1 0 4 5
16-30
Total 12 7 15 34
EGS 8 0 6 14
SGRY 0 0 3 3
31-60
Total 8 0 9 17
SGRY 0 0 3 3 More than
60 Total 0 0 3 3
SGRY 8 3 0 11 No delays
Total 8 3 0 11
EGS 0 0 1 1 Not
Applicable /
Salaried
worker
Total
0 0 1 1
It can be said from the data that SGRY performed relatively
better with respect to the timely payment of wages and
foodgrains to workers.
5.3.5 Use of Machine and involvement of Contractors:
A) Use of machines
Use of machines and contractors has been considered as the
dark side of the PEPs. It not only encourages leakages but also
negatively influences the share of workers working under the
Page 77
253
253
scheme. EGS and SGRY guidelines and objectives consider this
as a serious and most objectionable matter against worker’s
interests and their employment opportunities.
52.9% of the workers from the sample reported about the use
of machine. 20% of the workers did see JCB machines on the
worksites. Another 32.9% workers said they observed heavy legal
(like concrete mixer, road roller machines) and small machines
like simple Crain machine, tractors on the sites. Remaining
41.7% of the workers said there were no machines on the site.
(see Table 5.29)
Table 5.29
Workers observations regarding the use of machines
Level of Machine use Frequency Percent
JCB Machine 17 20.0
Legal Heavy Machine 6 7.1
Tractors and Trolleys 15 17.6
Crain, Fire-Blasting
machine 7 8.2
No Machine 40 47.1
Total 85 100.0
The general impression was that the use of machines was
relatively higher in SGRY worksites.
EGS: Machines are permitted under EGS. For example- Road
roller, water tankers are essential in road construction works.
Special permission can be taken for use of some machines in some
specific working condition. Data from Mukadam did reveal that
in 16.66% of the EGS works, occasional JCB machine was used.
In 16.66% EGS works, small machines were frequently used in
Page 78
254
254
16.66% cases; occasional, small machines were used. EGS works
with no machines were 41.66%.
SGRY: There was more widespread use of illegal heavy
machinery, especially JCB earthmovers, to substitute for labour
in SGRY projects than the EGS. The data from the Mukadams
also showed that on 8.33% of the SGRY works frequently JCB
machine was used. JCB machine was occasionally used in case of
16.66% SGRY works. Frequent small machines (8.33%) and
occasional small machines (50.00%) were used in SGRY
worksites. EGS works with no machines were 16.66%.
Regional Variation: The data obtained from Mukadam did
depict that, the less developed tribal region was better in case of
machine use. There were no JCB machines used at all. Use of
small machines was also very low (16.66% cases). In semi
developed belt, however, use of JCB machines was highest
(33.33% worksites) and use of small machines was observed in
case of 83.33% worksites. Developed region did show moderate
use of machines, big JCB machines (8.33% worksites) and small
machines (33.33% worksites). Table 5.30 reveals the data from
the Mukadams.
Table 5.30
Amount of machine used
Development Category Amount of
machine
used
Name of
the
Scheme Developed Semi
Developed
Less
Developed
Total
SGRY 0 1 0 1 Frequent
JCB
Machine Total
0 1 0 1
EGS 0 2 0 2
SGRY 1 1 0 2
Occasiona
l JCB
Machine Total 1 3 0 4
Page 79
255
255
EGS 2 0 0 2
SGRY 1 0 0 1
Frequent
Small
Machines Total 3 0 0 3
EGS 0 2 1 3
SGRY 1 4 1 6
Occasional
Small
Machines Total 1 6 2 9
EGS 2 2 1 5
SGRY 1 0 1 2
No
Machines
allocated Total 3 2 2 7 Source- the data provided by the Mukadams
Frequent and occasional use of JCB like big machines and
small legal machine was little higher in semi developed areas
than the developed and less developed belts.
Thus it can be said that there was not much difference in
machine-use in both of the schemes. But considering the size,
nature and funds available for the works, use of machine under
SGRY was higher despite strict regulations of banning all sorts of
machine. EGS however, permits some kind of machines (not
JCBs) that are required for specific works. Taking these points
into consideration, it can be inferred that EGS did better in terms
of relatively less use of machines on the worksites.
B) Involvement of Contractor-middleman
EGS: Task-work system is normal in EGS implementation but
unofficial contracts are not allowed in EGS. If the budget is
higher, the contracts can be given to Labour Cooperative
Societies and if the work is still bigger the tenders from
Government contractors (up to 10% of the total expenditure) are
invited and passed by following certain procedures. The
responses from the Mukadams revealed that, there were 8.3%
cases of EGS where 100% involvement of big outside contractors
was observed. In case of two EGS works (16.66%), higher
involvement (75 to 99%) of the big outside contractors was found.
Page 80
256
256
SGRY: Under SGRY, contractors are not permitted to be
engaged for execution of any of the works under the programme
(SGRY Guidelines: 5.16.1:19). But still the involvement of
middleman or any other intermediate agency was more in
executing the works under the programme. There were 33.33%
cases of SGRY where very few from poor sections had chance to
get the employment.
The data from the Mukadams revealed that there were 33.3%
of SGRY cases of 100% involvement of big outside contractors (see
Table 5.31).
Table 5.31
Percentage of the work given on big contract
Percentage of the work on big outsider contract Name of
the
scheme 100% 75-
99
50-
74
25-
49
1-
24
0%
EGS 01 02 01 01 01 06
SGRY 04 01 01 01 01 04
Total 05 03 02 02 02 10
Source: Data obtained from the Mukadam respondents
The machines causing exclusion of the human labour was
obviously highest on those sites. In 8.3% SGRY cases, higher
involvement (75 to 99% involvement) of the big outside
contractors was found. However, small/part-time outsider
contractors were observed higher in EGS than SGRY.
As a result of this, the employment generation ability of the
schemes was curtailed. General trend is that EGS works are
more accessible to the rural poor than SGRY and thus EGS
performed slightly better than SGRY.
Regional Variation: Involvement of contractors and middlemen
was observed in all the three regions. Involvement of big outsider
Page 81
257
257
contractors was highest (20.83%) in developed region. It was
followed by semi developed regions (8.33%) and less developed
region (4.16%). Involvement of small contractors with less
participation in the work was observed more in less developed
regions. Mukadams reported that the number of works where
there was given no contract were 3 in developed region, 4 in semi
developed region and 3 in lees developed region. (See Table 5.32)
Table 5.32
Percentage of the works on big outsider contract
Development Category Percentage of
the work on big
outsider contract
Developed
Semi
Developed
Less
Developed
Total
1 0 0 1
1 0 0 1
0 1 0 1
0 1 0 1
0 0 1 1
100%
Total 2 2 1 5
1 0 0 1
1 0 0 1
1 0 0 1
75-99
Total 3 0 0 3
0 1 0 1
0 0 1 1
50-74
Total 0 1 1 2
0 0 1 1
0 0 1 1
25-49
Total 0 0 2 2
0 1 0 1
0 0 1 1
1-24
Total 0 1 1 2
1 0 0 1
1 0 0 1
1 0 0 1
0 1 0 1
0 1 0 1
0%
0 1 0 1
Page 82
258
258
0 1 0 1
0 0 1 1
0 0 1 1
0 0 1 1
Total 3 4 3 10 Source: Data obtained from the Mukadam respondents
5.3.6 Leakages and malpractices:
It is hard to collect data and find out proof of leakages and
malpractices precisely. An attempt was made to see how some of
these things happen.
High amount of leakages and malpractices were reported in
case of some of the sites. Both the schemes were to be blamed for
rampant corruptions and irregularities. EGS has better
mechanisms to control the malpractices. However, these were not
effective in reality for variety of reasons. Role of agency men,
their irregular follow up, their nexus with local politicians and
contractors, use of unofficial machine, involvement of unofficial
contractors, rural elites turned out to be unofficial implementers
of the works, forging of the muster records and the allied
manipulations were routine malpractices both in case of EGS and
SGRY sites.
Leakages in PEPs were generally the results of multiple
factors. Use of illegal machine, bogus muster records,
substandard work, no or less provision of amenities, use of
contractors or labour contractors, inviting and allowing outside
workers, fraud at measuring the works etc. can be some of them.
There was very little difference, but the level of leakages was
comparatively higher in the SGRY cases than EGS cases.
EGS: Keeping Muster duly filled at the EGS worksite is
necessary. Actually, it is a Junior Engineer’s or agency
personnel’s responsibility. Generally, however, the Mukadam
Page 83
259
259
appointed by the agency officer, keeps the muster. The official
data from Mukadam, however, did show that in 83.33% of the
EGS cases, the agency officer kept the record and in 8.33% of the
cases Mukadam and in 8.33% cases owner of the land where the
work was going on kept the attendance record.
Fudging the record, incorporating bogus enlarged number of
workers, recording the false attendance, keeping the record blank
in order to do further manipulations are some of such types of
malpractices have been observed by the grievances committee’s
reports and PEO studies. Off the record information tells the
stories of it but no such precise data could be gathered from the
field in this study. It was difficult to collect realistic data about it.
However, cases of grievances from the government record took
account of such manipulations. (A report for EGS Legislative
Council Committee, Vidhi Mandal Samiti Ahawal 2008)
Manipulation in distributing food grains, in providing
amenities, deliberate, unrecorded but actual gaps in the work
were the common discrepancies between ideal and actual was
unofficially admitted by some of the Mukadams.
SGRY: In case of SGRY, muster keeping is the responsibility of
the Gram Sevak. 75.0% of the Gram Sevak reported that they did
this job on their own. Sarpanch-Gram Sevak combo, contractor,
peon and one of the workers (8.3% each) also did keep the
musters. 66.7% of the Gram Sevak informally said that they did
not follow 60:40 ratios as per the rule. Amenities were not
provided as per the guidelines. Discrepancy in the number of
workers reported and actually observed on the site was there.
Regional Variation: Contractor from semi developed region and
one of the workers from less developed region handled
Page 84
260
260
supervising and muster recording responsibility on behalf of the
Gram Sevaks.
The data from the Collector office, Nashik district created for the
EGS Legislative Council Committee meeting in February 2008
showed the nature extent of cases of vigilance. The data referred
to above shows the nature of malpractices and leakages on the
EGS worksites-bogus muster records, lacunas in distribution of
wages, expenditure more than the estimates, corruption, use of
JCB machine on sites, irregularities in implementation, poor
quality of work, implementing the works on another place than
the sanctioned one, over payments to the workers, discrepancies
in the measurements, technical faults in construction of assets
and so on. (A report for EGS Legislative Council Committee
meeting in February 2008, pp-360 to 444).
If the implementing agencies and the institutional framework
are supported by supervision, vigilance and grievances redressal
mechanisms are strongly followed, the amount of leakages might
certainly reduce the leakages and thus might help the poor who
participate in the program. But there were hardly any serious
attempts to control the malpractices and improve their
performance.
5.3.7 Number of Mandays Work Generated
How much mandays of work was generated under EGS and
SGRY? It can be said that the more the employment generation
better the performance. The general observation can be noted
here that the EGS workers got better employment than SGRY
workers. The analysis of the data on the mandays generated has
been studied here on two levels.
a) At one level, the data are based on the information collected
from the Mukadams. To calculate the mandays generated on the
Page 85
261
261
12 EGS and 12 SGRY worksites was very difficult. Senior officers
on site too were not sure about this data. The best the researcher
could do was just to calculate the total workdays and multiply
them with the number of total workers worked on. The
researcher took help of Mukadams in this matter. 87 per cent of
the Mukadams said they could tell about the total employment
generation on that particular work project. Mukadams could not
assess the mandays on the 3 EGS worksites for, their long
duration of work and employing multiple Mukadams in between.
b) The second set of data on mandays generated was based on
the information collected from the individual worker respondents
from the EGS and SGRY worksites. The number of days they
worked on the site was calculated. Their averages are calculated
to have an idea of how much of mandays the workers earn while
working on these sites at individual level.
EGS: Data from the Mukadams did reveal us that, total 12,445
mandays and average 1382.77 mandays from each of the nine
villages were generated under EGS. Here the average has been
calculated by excluding three EGS villages from which the data
was not available. The average mandays generated under the
EGS for each workers under sample comes to 24.43 days.
SGRY: The mandays generated under SGRY are given as
follows-
a) When we look at the averages, we can notice, as compared to
the EGS, SGRY created less employment generation and less
number of mandays for each village.
b) The average mandays generated under the SGRY for each
worker under sample was 17.54 mandays.
Page 86
262
262
Regional Variation:
Developed Region
a) Data obtained from Mukadams did reveal that the actual EGS
worksite from developed region created 3520 mandays of
employment generation with average of 1760 for each village. On
the other hand SGRY works could generate 4,995 mandays of
employment with average of 1248.75 days for each village.
Table: 5.33
Mandays generated from EGS and SGRY worksites from
developed areas
EGS SGRY
Worksite 1 2520 527
Worksite 2 Data not Available 136
Worksite 3 1000 4200
Worksite 4 Data not Available 132
Total 3520 4995
Averages 1760 1248.75
Source: Data obtained from the Mukadam respondents
b) Data obtained from Workers did reveal that, the actual
mandays created for the EGS workers under the sample averaged
28.05 for the each EGS worker under the sample from the region.
On the other hand, SGRY works could produce average of 38.5
mandays for each village and 17.11 mandays for the each worker
in the village.
i) Semi Developed areas
a) In semi developed region the mandays employment created
under EGS was 2065 with average of 688.33 and SGRY generated
3238 mandays with average of 809.5. Here SGRY exceeded in
relation to EGS in this matter. One work from this region had
Page 87
263
263
created 2310 mandays, did make the difference. They used two
years funds for SGRY work and thus had better funds to spend
on.
b) In semi developed region the average mandays created for
EGS workers under the sample were average of 25.78 mandays
for the each EGS sampled workers under the region. SGRY
generated average of 19.8 mandays for the each sampled worker
under the region.
Table: 5.34
Mandays Work Generated for Worksites:
Semi developed areas
EGS SGRY
Worksite 1 460 720
Worksite 2 Data not Available 2310
Worksite 3 900 196
Worksite 4 705 12
Total 2065 3238
Averages 688.33 809.5
Source: Data obtained from the Mukadam respondents
a) Total 6860 mandays were generated in less developed regions
under EGS with average of 1715 in contrast with 4220 mandays
and average of 1055 under SGRY.
b) In less developed region, the average number of mandays created
for EGS workers under the sample was 20.22 for each of the EGS
sampled worker under the region. SGRY generated average of
15.73 mandays for the each sampled worker under the region.
Page 88
264
264
Table: 5.35
Mandays work generated for worksites:
less developed areas
EGS SGRY
Worksite 1 5700 768
Worksite 2 4800 2320
Worksite 3 2530 828
Worksite 4 6860 304
Total 6860 4220
Averages 1715 1055
Source: Data obtained from the Mukadam respondents
Table: 5.36
Mandays generated under EGS and SGRY
Development
Regions
Average
Mandays
EGS
Average
Mandays
SGRY
Developed 28.05 17.11
Semi Developed 25.78 19.8
Less Developed 20.22 15.73
Average 24.68 17.54
Source: Data obtained from the worker respondents
SGRY works do generate less number of working days/
mandays. In some cases, work opportunities/mandays generated
were so meager that it almost excluded the poor from getting
employment opportunities in real sense of the term. For
instance, in one SGRY case just 12 mandays were created and big
machine and contractor was employed. The number of workers
involved in SGRY works is again less in comparison with EGS in
general. This is for the two reasons- 1) Funds are short 2) Use of
machine and involvement of contractor is higher.
Page 89
265
265
The EGS on the other hand was more effective at meeting the
employment need of the village poor. Reasons include: better
planning of the local administration to maintain a 'shelf or
reserve’ of EGS projects implementable at short notice in case of
drought, many are designed, at least in outline, long before they
reach the construction stage), better implementing organization,
better monitoring and some deterrence of vigilance. By contrast,
SGRY projects are designed once the money becomes available.
5.3.8 Nature of Monitoring:
Monitoring and supervision includes the record keeping,
supervising, quality checking, addressing irregularities and also
social auditing.
EGS: In general, the EGS sites were better supervised and
monitored than that of SGRY. But still, this supervision was not
up to the expectations of the scheme. Talathi, the lowest level
responsible person of EGS administrative line did not visit the
EGS sites regularly. 41.67% Talathis did not visit the site at all.
EGS works were supervised commonly by the Mukadams or
agency men. Agency officers and Muster clerks visit the site for
monitoring maximum for once or twice a day.
SGRY: At grassroot level Gram Sevak, the responsible supervisor
under second stream SGRY works. He is generally very busy
person. He is given the charge of at least two to three Gram
Panchayats. It is quite hectic for him. Therefore, generally, he
prefers to share his responsibility with some of the workers or
professional contractors to avoid supervision. Without proper
supervision and day-to-day technical informational support, the
quality of assets generated decreases. Most of the Gram Sevak
claimed that they visited SGRY sites regularly. Only 1 out of 12
Gram Sevaks told that he visited EGS worksite of the village
Page 90
266
266
frequently. More than 58% admitted that they did not visit the
EGS sites at all. In SGRY Higher level monitoring mechanism
was found almost non working.
The consolidated data from the EGS and SGRY workers reveal
that, 29.4% of them were recorded and supervised by the Agency
officials. 15.3% said they were recorded and supervised by the
Sarpanch and Gram Sevak. Thus, more than 50% of the workers
said they were recorded and supervised by the unofficial
supervisors like - One of the workers (4.7%), Owner of the land
(7.1%), Contractor (9.4%) and in one case even the Gram
Panchayat Peon (5.9%). Surprisingly 10.6% workers said they
were neither recorded nor supervised by any specialized person.
The workers did their job for themselves.
Monitoring and supervision by the implementers and the
village level officers and leaders are regarded as key aspects in
performance of PEPs. Both EGS and SGRY have made many
provisions of monitoring and supervision of the works under the
schemes. However, ground reality reveals the fact that
monitoring and supervision was very poor on the projects in the
sample.
Regional Variation: Most of the SGRY works were supervised
and recorded by the Gram Sevaks. In less developed regions some
assistance by the Sarpanch and one of the workers was taken. In
semi developed region on one SGRY (8.66%) worksite was
recorded as well as supervised by the contractor engaged on the
worksite. Higher level monitoring was nonexistent in all the
regions.
5.3.9 Quality of Vigilance and Grievance Redressal:
Vigilance and grievances redressal mechanisms are the two
distinguished features of quality control and management of
Page 91
267
267
human resources. Vigilance committees at Taluka level were
almost inactive during the study period. Local committees at
worksite where more than 100 workers were working were too
absent. This finding seems consistent with observations of the
other studies on EGS, like PRAYAS, a Pune based NGO. (Rohayo
kadun Magrarohayokade (2008).
EGS: Under EGS these duties were assigned at the divisional
level to the commissioner with assistance of the officer on Special
duty in each division. In addition to this, Collectors, CEOs of Zilla
Parishads, Deputy Collectors, Tahsildars and Supervisory
Officers of the implementing agencies have given responsibilities
to inspect the EGS works as per the norms prescribed.
Legislative Council/State level EGS Committee, Divisional level
EGS Committees, Taluka level EGS Committees are formed to
monitor the EGS work operations. Vigilance squads have also
formed at Secretary, Divisional and District level to control
corruption. EGS is planned in such a manner so that checks and
balances are neatly created at every stage of the implementation.
Data obtained from Talathis reveal that, on three (25%) EGS
work projects they observed vigilance visit by the Tahsildar and
upper level agency officers.
Table: 5.37
Data from Talathi about No. of vigilance visits to EGS site:
Development Category No. of vigilance
visits to EGS site Developed Semi
Developed
Less
Developed
Total
One visit 2 1 0 3
No visit 0 1 4 5
Don't know 2 2 0 4
Total 4 4 4 12
Page 92
268
268
The field data showed that inspection of the EGS works was
done by the Tahsildar / BDO and Upper Level Agency Officers.
EGS committees at Taluka level and district level were on visible
on grounds. Nobody directly approached the workers and asked
them about their difficulties out there on the sites. When asked
did they see somebody on vigilance visit during the work on EGS
or SGRY, 22.4% of the workers replied that they observed some
kind of vigilance on working site.
A detailed record of vigilance and cases of grievances has
made available from the Collector office, Nashik district. This
record was specially created for the EGS Legislative Council
Committee meeting in February 2008. This record shows that
there have been 107 cases of grievances in Nashik district during
last two decades. The highest cases of grievances registered were
from Minor Irrigation department (Sthanik Staar-Local Level)
(22 cases) and the lowest were from Agriculture Department,
Nashik (2 cases).
The data from the report reveal the following facts:
• Various irregularities in implementation were reported many
a times from the political leaders, social workers, actionists and
from the committees of vigilance from state level to district level,
monitoring and quality control committees at agency level.
• Very few cases were explored by these committees
• Very few of the implementers involved in the grievances were
actually punished
• The court cases, and inquiries took long time to produce
results
• The whole process of grievances redressal is very complex
• Non-governmental committees were highly inactive and
complaisant
Page 93
269
269
(See Rohayo kadun Magrarohayokade (2008: 83-93), a Study
based book by the Prayas, Pune for the details)
SGRY: Vigilance & Monitoring Committees at the State, District
& Panchayat Samiti level constituted for overseeing the various
programmes of the Ministry of Rural Development are held
responsible to monitor the implementation of the works under the
first & second streams of the SGRY. According to the Gram
Sevaks vigilance committee visited on only 4 SGRY projects
(33.33%) under the second stream. On one site the committee
visited for more than three times, on the remaining three sites, it
visited for one time.
From the cases it is record observed that monitoring under
SGRY is less effective than EGS.
Regional Variation: The data obtained from Talathis reveal
that, frequent vigilance visits were observed in 2 villages from
developed region (16.66%) and in 1 village from semi developed
region (8.33%). One EGS work from the village under semi
developed belt and all the four villages from less developed areas
were reported for no vigilance visit at all. They were not sure
about the visits in two cases of developed and two cases from the
semi developed regions.
Workers, however, could not distinguish the vigilance officer
from any agency officer or politician, however observed that
vigilance visitors were higher in number in developed belt than
semi and less developed belt and on EGS sites than SGRY sites.
Page 94
270
270
Case No. 5.11: Just keep it
A woman from the tribal belt was active in the village
development activities initiated by a social worker from the
Nashik. One journalist working in the area recommended her
name for the Taluka EGS committee. She became the member of
this committee but received no training and no knowledge
support from the EGS office there. She said, “I just went on to
attend the occasional meetings of the committee and did not
realize my role and responsibilities.” For few times she received
amount ranging Rs. 500 to 2000 from some agency men. When
she asked, “what for this money?” The answer was “just keep it”.
Later on she came to know that the money was for not visiting
the sites and for not raising problematic issues pertaining to the
sites.
5.3.10 Completion of the work in time and Reasons for the
Delays-
EGS: EGS works are generally long lasted and big works. It is,
not lacuna on the part of the implementation agency. Most of the
time, local conditions, technical factors, workers’ problems, and
land acquisition problems have been responsible for delays in
completing the EGS works. When asked Gram Sevaks about the
problems occurred at EGS worksites, all the 12 Gram Sevaks said
they did not know the problems there. There was almost no
coordination among the Talathis, Sarpanchs and the Gram
Sevaks from all of the sampled villages. When the question was
asked to the Gram Sevaks about the timeliness in completing
works, their responses revealed that 50% of the EGS works were
completed in time. Another 17.6% works were completed but
little late, 8.3% works were completed very late. Some works
Page 95
271
271
(8.3%) did not get completed or were left unfinished. Plantation
and nursery works, the two EGS works, (16.7%) were continuous
works.
It has been a major issue in criticizing EGS that these works
are not getting completed in time. The delays in completing
works have been quite common thing. The official statistics about
EGS reported that 32 works have been remained incomplete for a
period of 5 to 10 years while 80 works were still incomplete even
after 10 years. (Vidhi Mandal Samiti Ahawal 2008:245-316)
The general reasons reported in the report 2008 are:
1. Objections by the owner of the land
2. Objections by the forest department regarding the forest land
3. Local objections
4. Local problems on the sites
5. Pending cases of inquiries of the implementers on the site etc.
SGRY: One Sarpanch from semi developed region said that his
village got SGRY fund very late. He said the funds were received
funs in March and the target to complete the SGRY work was 31st
March. Under such conditions late completion of works was
bound to happen. But this experience was very rare in case of
SGRY. The Sarpanch and Gram Sevaks of particular village
generally receive SGRY funds twice in a year. They have to spend
that amount for SGRY works before that official year ending
before 31st of March. They can plan out a bigger work by adding
the two years funds together but two-year period was the
maximum limit. SGRY works in two villages (16.66%) which did
not follow two-year limit were very late to complete the works.
Importantly there were no significant reason for delayed
completion of planning and executing the works.
Page 96
272
272
Regional Variation: The information given by the Gram Sevak
and the villagers reveals that one EGS work from the semi
developed region did not get completed as per the norms. The
villagers had some objections about the quality of work. Still they
did not follow any official procedure to register their complaint.
Villages from developed regions took longer time to manage and
implement EGS works. The involvement of middleman, apathy
might be the reasons for that. However, one SGRY work from the
tribal-less developed region, also took long time to get it
completed. The lack of coordination was observed between the
groups of Gram Panchayat members, especially between the
Sarpanch and Panchayat members from another village where
the work was proposed.
Case No. 5.12: Power matters
The lady Sarpanch from one village was unaware about the
SGRY procedures. She said her husband, manages everything.
When asked to the husband, who was acting as if he himself was
Sarpanch, about the delays for completing SGRY works, he
replied, “the political patriarch (godfather) from that village did
not yet ordered to think about SGRY works. He also said, “we
discussed this issue in Gram Panchayat meeting and decided to
wait for the order from the leader. We were not aware of the two-
year limit either.”
When asked, what he would do if the funds were called back by
the government for not completing the work in the scheduled
time, he laughed and said, “this will not happen especially about
this particular village because the so called leader had good chair
and also connections with the concerned authorities.” Later on,
after six months they did this work from outsider professional
contractor.
Page 97
273
273
5.3.11 Quality of work and assets
A good and useful quality of assets generation is obviously
expected under both EGS and SGRY.
EGS: The workers from the two PEPs under the sample said
22.4% of the EGS works were ‘very good’ in quality, 49.4% were
‘good’ in quality and another 20.0% were ‘fair enough’. 7.1%
workers said, the EGS works generated were ‘bad’ in quality and
1.2% said those were ‘very bad’ in quality.
The reality observed from the data provided by the Sarpanch
was not much different.
The Sarpanchs under the study said, 16.7% of the EGS works
were of ‘very good’ quality, 50% were of ‘good’ quality and 16.7%
of ‘fair quality’. The percentage of very poor quality assets
generated under EGS was just 8.3%.
SGRY: Gram Sevaks’ data reveal that 25.0% of SGRY works
were ‘very good’ in quality. 41.66% were ‘good’ and another
16.66% were of ‘fair’ quality. The per cent of ‘poor’ and ‘very poor’
quality was 16.66%. The Sarpanch rated the quality of SGRY
works as having ‘better quality’.
The one of the Gram Sevaks said, most of the stone
bandharas, small bandharas (bunding) were generally useless for
their technical limitations. The quality of such works under
SGRY was so bad that the purpose of such scheme to generate
sustained employment through assets, did not get satisfied.
Ordinary quality of assets has been a major point for which
the PEPs are undermined. Good quality of the assets ensures
targeted all round development of the villages. The quality of the
assets generated under the EGS and SGRY was found not very
bad, although, it was not good enough either.
One of the agency officers said, in general the EGS works were
Page 98
274
274
‘better in quality’ than the SGRY. He put some reasons for the
comparatively poor quality of the works under SGRY like - a)
Meager funds, b) Poor monitoring and supervision, c) Higher
amount of works done by the contractors, d) lack of experience of
the Gram Sevaks and Talathis in managing such kind of works.
Regional Variation:
EGS: Following table based on the data obtained from the
Talathi reveal that, the EGS works in less developed areas were
of better quality.
Table: 5.38
Level of quality of EGS Assets
Development Category Level of quality
of EGS/SGRY
assets Developed Semi
Developed Less Developed
Total
Don’t know 0 1 0 1
Very Good 0 1 1 2
Good 3 1 3 7
Poor 1 1 0 2
Total 4 4 4 12
Source: Data obtained from the Talathi respondents
SGRY: According to the Gram Sevaks, 25% of the works in semi
developed and 50% of the SGRY works from the less developed
regions were very good in quality. 50% from the developed, 25%
from the semi-developed and 25% works from the less developed
region were of good quality and 25% of the SGRY works from
semi and less developed region were of fair quality. The Gram
Sevaks observed that the 50% works from the developed region
were bad in quality. It reveals the fact that the developed region
where more contractors for building the assets were employed,
did not maintain the minimal quality.
Page 99
275
275
Table: 5.39
Quality of SGRY work done
Quality of SGRY work done
Development
Category Very
Good Good Fair Poor Total
Developed 0 2 0 2 4
Semi Developed 1 2 1 0 4
Less Developed 2 1 1 0 4
Total 3 5 2 2 12
Source: Data obtained from the Gram Sevak respondents
Using substandard material, stakeholders’ nexus, negligence
in technical supervision, poor monitoring, inexperienced local
management and absence of vigilance were some of the general
reasons for the poor quality of asset generation.
Case No. 5.13: Beneficiaries suffered due to poor quality:
One EGS work from the developed region took more than three
years to complete the percolation tank there. The muster clerk
who was given charge of the work was very busy in many other
projects. He visited this site very rarely. Professional contracts,
substandard material, irregular workers, poor technical
supervision and low participation of the villagers, lack of
monitoring and vested interests of the neighboring farmer
stakeholder made this work of very bad quality. The neighboring
farmer did suffer and lost some crop and cultivable soil when the
percolation tank broke up in the first heavy rain after its faulty
construction.
But there are success stories too. See Case No. 5.14.
Page 100
276
276
Case No. 5.14: A lady Sarpanch could make it a success
story
A lady Sarpanch from a tribal village was very keen in
managing SGRY work. She took consent of the Gram Sabha.
They collectively decided to build well for drinking water and
tried to avoid undue interventions by the local elites. She
personally devoted attention for supervision of the site. The local
workers having interest in getting drinking water from the
proposed well did perform their role in better manner. Now the
well is full of water. Due to her differences with the Gram Sevak
there, however, could not complete the tap water scheme in the
village.
5.3.12 Level of Utility
The level of utility of assets generated under the scheme is
very hard to judge. Asking the respondents about the usability of
the works was the only way to judge this.
EGS: The data from the Sarpanchs (as given in the table) reveal
the fact that only 8.3% of works were useful for all. 16.7% of the
EGS assets were useful for majority, 8.3% of the works were
useful for the poor and 66.7% of the works were either useful for
very few or were of least use. The Sarpanchs told that the
affroestation works near the village, and works of farm tanks,
stone bandharas and plant development works close the village
were of least use.
28.2% worker believed that the EGS assets were useful for all,
24.7% said the works were useful for majority. 7.1% workers felt
that they will benefit the poor. 10% of the workers told the assets
Page 101
277
277
will benefit local elites. 1.2% workers have marked the EGS
works, as works not useful for anybody.
Table: 5.40
Level of utility of Assets generated under EGS
Level of utility of EGS assets
Development
Category Useful
for all
Useful
for
majority
Useful
for
poor
Useful for
very
few/least
useful
Total
Developed 0 0 0 4 4
Semi Developed 0 1 1 2 4
Less Developed 1 1 0 2 4
Total 1 2 1 8 12
Source: Data obtained from the Sarpanch respondents
SGRY: Surprisingly, 25.0% of the Sarpanchs said that they could
not tell whether the SGRY assets generated in their respective
villages were useful or not. 41.7 % said those works were useful
for all and 25.0% of them said they were useful for poor. Only
8.3% works were useful only for the local elites.
Table: 5.41
Level of utility of Assets generated under SGRY
Level of utility of SGRY asset
Devt. Category Do not
know
useful
for all
Useful
for
poor
Useful
for local
elites
Total
Developed 2 0 1 1 4
Semi Developed 0 3 1 0 4
Less Developed 1 2 1 0 4
Total 3 5 3 1 12
Source: Data obtained from the worker respondents
Page 102
278
278
Regional Variation:
EGS: There was no considerable deviation when the data for
assessing regional variation was analysed. But still, it can be
said that the tribal-less developed region created assets under
both EGS and SGRY which were more useful for the community.
The data from the Talathis (given in the table) reveal that, the
number of assets useful for few and useful for elite was on little
higher side in semi developed area and assets from the less
developed areas were more useful for the village community. (See
table 5.42)
Table: 5.42
Regional variation in the level of utility of assets
generated
Development Category Level of utility of
EGS/SGRY assets Developed Semi
Developed
Less
Developed
Total
Do not know 0 1 0 1
Useful for all 1 0 3 4
Useful for majority 1 1 0 2
Useful for local
elites/farmers 1 0 0 1
Useful for very few/least
useful 1 1 1 3
For local elites+ For very
few 0 1 0 1
Total 4 4 4 12
Source: Data obtained from the Talathi respondents
Page 103
279
279
Case No. 5.15: Land leveling enhanced livelihood levels
The villagers from a tribal belt approached the agriculture officer
and requested him to start land leveling (mazgi) works on their
agricultural land. Lands in this belt are uneven and thus less
productive. The EGS work completed in this village benefitted
more than 20 tribal farmers. The beneficiaries got almost doubled
production of Nagali, and rice on their improved farm lands.
Table: 5.43
Level of utility of EGS assets: A combined view
Type of Respondent Level of utility of
EGS/SGRY assets Sarpanch Deputy
Sarpanch
Gram
Sevak Talathi
Total
Do not know 0 0 0 1 1
Useful for all 1 1 1 4 7
Useful for majority 2 2 6 2 12
Useful for poor 1 3 1 0 5
Useful for local
elites/farmers 0 3 3 1 7
Useful for very
few/least useful 8 3 1 3 15
11.00 0 0 0 1 1
Total 12 12 12 12 48
Source: Data obtained from the Sarpanch, Deputy Sarpanch, Gram
Sevak and Talathi respondents
EGS works were expected to be more beneficial for the village
poor for, 1) Assets generated are big 2) They are demand driven
3) Those seem technically more sound, durable with proper
supervision, vigilance and technical support.
Page 104
280
280
SGRY: The data collected from Sarpanchs tells us that SGRY
works from semi developed and less developed region were more
useful than the works from the developed region.
Table: 5.44
Level of utility of SGRY assets: Sarpanch view
Development Category Level of utility of
SGRY asset Developed Semi
Developed
Less
Developed
Total
Do not know 2 0 1 3
useful for all 0 3 2 5
Useful for poor 1 1 1 3
Useful for local
elites 1 0 0 1
Total 4 4 4 12
Source: Data obtained from the Sarpanch respondents
The data collected from the Sarpanchs reveals that the assets
generated under SGRY were more useful than the EGS. SGRY
works, because they were since planned and managed at local
level and had distinct potentials in generating useful assets.
5.3.13 Who were benefitted the most?
EGS: 33.33% of the Sarpanch said, the EGS worksite from their
village would benefit the elites. 25% of them said it would help
the farmers, 41.7% of them said it would help to backward
sections. When asked the workers that did they personally
benefited from the EGS assets directly or indirectly, only 20%
said yes.
SGRY: Sarpanchs believed that the EGS works would more
benefit to the local elites than SGRY. 25% of them said that the
works provided benefit to the farmers, 50.0% said it benefited the
villagers in general, 16.7% thought that the works would benefit
to the backward sections and 8.3% said the SGRY work from
Page 105
281
281
their village would benefit the school children. 8.88% of the
Talathis and 16.66% of the Gram sevak however believed that the
SGRY assets have benefited to the local elites. 8.88% of the
Talathis said elites and backward section both were benefited
from the SGRY work.
The responses from different categories of respondents were
confusing. However, a general impression among the
respondents was that, the SGRY scheme was superior in
delivering benefits to the villagers than the elites.
Regional Variation:
EGS: According to 8.33% of the Gram Sevaks, the EGS work
from the less developed region benefitted the local elites. The
Gram Sevaks in one village said that the local tribal political
leader by using all his connections at the taluka level authorities
constructed village tank close to his house and he was the
unofficial owner-user of the tank.
In general terms one can say that, the backward sections or
the semi and less developed areas were benefitted slightly more
from the EGS assets than the developed areas.
SGRY: The data obtained from the Gram Sevaks (given in the
table) reveal that, the SGRY assts have comparatively more
benefitted the elites from developed and semi developed areas.
Villagers from backward section have also been benefitted more
than the ones from the developed and semi developed areas.
Page 106
282
282
Table: 5.45
Who benefited by the assets under SGRY
Who Benefited Development
Category
Elites Villagers Backward
Sections
School
Children
Elites+ Backward
Sections
Total
Developed 1 2 1 0 0 4
Semi
Developed 1 2 0 1 0 4
Less
Developed 0 3 0 0 1 4
Total 2 7 1 1 1 12
Source: Data obtained from the Gram Sevak respondents
5.3.14 Relevance of the scheme
Which of the two programmes tends to satisfy the needs of the
respondents by the assets it created? How far does it meet urgent
local needs?
EGS: When asked the question that ‘did they find EGS relevant
today’? the answers reveal that for 16.66% of the Talathis EGS
was very relevant today. The 75% of the Gram Sevaks on the
other hand reported EGS was of very much of relevance today.
The Sarpanch (75.0%) and more than 50% of the Talathis said
EGS was relevant today.
Table 5.50 indicates that 8.88% of the Sarpanchs and Talathis
each did say that EGS was of very little relevance today.
70.83% of the Sarpanches, Deputy Sarpanches, Gram Sevaks
and Talathis together did reveal that EGS was relevant for
supportive employment in lean agricultural season and in
adverse conditions. 14.71% of them believed that EGS is relevant
for poverty alleviation, 8.47% for distress management, 4.44% for
stopping migration to cities, 14.85% for development, 10.55% for
asset generation, 6.38% for comprehensive reasons and 4.44%
since having doubts about relevance of EGS any more. So in
Page 107
283
283
general it can be said that EGS was believed to be relevant for
generating supportive employment only during the lean
agricultural season or during the adverse conditions like drought.
They did not believe that it would eradicate their poverty or it
would develop the villages.
58.82% workers also said that EGS and SGRY were relevant
because they provided them additional employment.
SGRY: SGRY on the other hand was felt relevant by the Gram
Sevaks, Sarpanch and the Deputy Sarpanch for the development
of the village. The workers relatively in more percentage believe
that SGRY did better job in satisfying their local, village level
needs.
Responses of the workers revealed that when they were in
urgent and desperate need of employment EGS was better option
for them. EGS projects come out on average as markedly superior
to SGRY projects here in producing employment.
Regional Variation: Both EGS and SGRY were felt of desperate
relevance in the less developed regions. There was no significant
difference between the three regions showing the relevance of
EGS verses SGRY. However, most of the workers working on the
EGS sites from the developed area said EGS was of little
relevance now.
5.3.15 Future profits or outputs of the work assets
The workers working under the schemes categorized the works
concerning the arenas of future profits. Almost half of them said
that, the works on which they worked on would help to conserve
water. 3.5% said that it would enrich the agriculture there. Some
of them could not categories the profits but replied that the work
or asset would help any way for village development.
16.5% of the workers said the work or asset would
Page 108
284
284
development of plantation and forestry and add to the future
profits. Rest of the workers said the assets would generate other
future profits like sanitation of the village (2.4% workers),
performing religious ceremonies (7.1% workers), and drinking
water supply (7.1% workers). One worker (1.2%) could not tell
what kind of profit the work will generate.
EGS and SGRY: Most of the EGS and SGRY workers from the
less developed areas said that the assets would help them in
reducing water problems. The workers from developed and semi
developed areas thought that the assets would benefit them in
future in satisfying their civil needs directly. EGS was also
considered outstanding for generating forestry and plantation
assets that would benefit the villagers in comprehensive but
indirect way.
PEPs were meant to generate employment. The assets
generated under these programmes were expected to help in
creating new employment opportunities and a chain of works
through works will go on. This chain was considered to be the
essence of the poverty reduction potentialities of wage based
PEPs. Assets generated under SGRY rarely found to have such
potential. EGS relatively did better in this regard.
Regional Variation: The data based on the workers perceptions
reveals that there was no significant difference on the basis of
areas of development. Only exception was that the workers from
the semi and less developed region believe that the EGS works
from their village would help to agriculture and solve water
problems. They also felt that SGRY works would also help in the
village development even better than the EGS works.
Page 109
285
285
5.3.16 Outputs for the village
What exactly were the developmental benefits delivered to the
village by means of assets generated under these two PEPs?
EGS: EGS did slightly better in producing water and soil
conservation works. The water and soil conservation works under
EGS works relatively more sustainable and useful. Village tank
construction under EGS in the tribal area was not profitable for
the villagers there but old bandhara repairing work was very
important for the tribal village from the less developed region.
The villagers said, in the absence of repairy work, they would
have spoiled the main water source of the village. It was huge
work and might not be produced under SGRY second stream.
EGS stood outstanding in creating six assets of plant
development and forest conservation and on the other side SGRY
did not do any of such works. Soil conservation and Mazgi
(agricultural land leveling) works under EGS were very useful
and different from SGRY.
Road constructed in semi developed area under EGS was of
better quality and of better use than the two roads under SGRY.
SGRY: SGRY works produced different outputs. Those works
were more of building construction type works. Gram Panchayat
building, toilet, kitchen shed, death ceremony sheds and Latrine
were the construction works under SGRY. Well construction
works under SGRY in the two less developed villages did
outstanding work in generating future profits for its villagers.
Some useless works were also taken under the SGRY. Waste soil
lifting from the bandhara, kachha road for the inclination
towards protection of two developed villages did prove futile. The
SGRY works reflect the interests of the villagers and the local
elites. The needs satisfied from the SGRY works were not so
Page 110
286
286
urgent but to some extent those were of interest of local
aspirations.
Regional Variation: There was no remarkable difference
between EGS works on the regional grounds. Plant and Forest
development works were slightly more in number in less
developed region.
Outputs produced by the SGRY assets however show
remarkable variation. The works from less developed villagers
were more focused on strengthening sources of potable water.
Villages from developed and semi developed region produced
building construction, road and sanitation type works. The
interests of the local elites were reflected in those works.
To sum up it can be said that, no conclusive evidence was
found to assert that one scheme was superior to other. There
were different areas where both of these schemes performed
better than the other.
Page 111
287
287
References:
Lieberman, Samuel. S. 1985. Field-level perspectives on
Maharashtra’s Employment Guarantee Scheme, Public,
Administration and Development, Vol. 5( No.2), Edited
by Brian Smith,Vol.-5,Number-2, John Wiley and Sons
Publication, pp. 109–127.
De Haan, Arjan. 1997. ‘Poverty and Social Exclusion: Comparison
of Debates’, PRUS working Paper No. 2, University of
Sussex, Brighton, UK
-----. 1999. Social Exclusion: Towards an Holistic Understanding
of Deprivation, a mimeo
A report for EGS Legislative Council Committee (Vidhi Mandal
Samiti Ahawal prepared for meeting in February 2008,
pp-360 to 444
“Rohayo kadun Magrarohayokade (MREGS)… :
Magrarohayochya Sandharbhat Rohayochi Chikitsa”
(2008:83-93), a Study based book by the Prayas, Pune.
Reports:
Government of India, SGRY Guidelines: 2001