Page 1
129
Chapter VI
Economics and Marketing of Cashew Cultivation
6.1 Introduction
This chapter presents various economic and marketing aspects of
cashew cultivation in the selected area of the South Konkan. Basically
South Konkan is the important area of cashew cultivation in the
Maharashtra. It contributes significant share in cashew production and
cashew processing also. Economics and marketing of cashew production
activities are important part in the study region. The changing trend of
agriculture from subsistence to commercial cultivation affects the
agricultural landuse and economic viability of cashew cultivation.
An attempt is made here to study the cost benefit ratio and the
levels of the profit received to the growers from the cashew crop. It is
based on primary data for the period of 2007-08 to 2009-10. For the
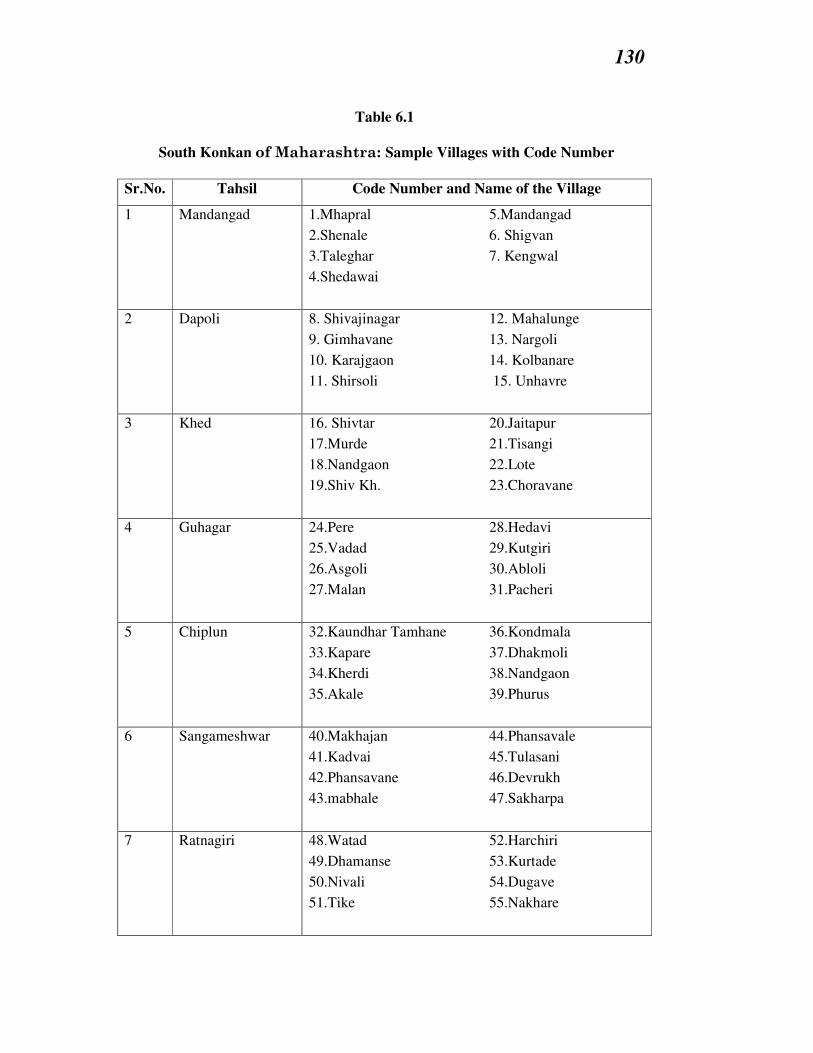
present investigation ten per cent villages (130) are selected by
stratified random sample technique where altitude zones were
considered as strata (Fig 6.1). From each of the sample village, three
farmers are selected for filling up of schedules for which size of holdings
criteria was chosen. As such 390 farmers were interviewed for the
present investigation. The correlation regression has been employed to
show the relation between altitude and per hectare yield. Informal
interviews and discussions with cashew cultivators were also organized
during the visits. The tahsils and village level data pertaining to the
area under cashew, per hectare production, cost of marketing, gross
and net returns of selected crops and cashew crop were generated
through intensive field work.
Page 2
130
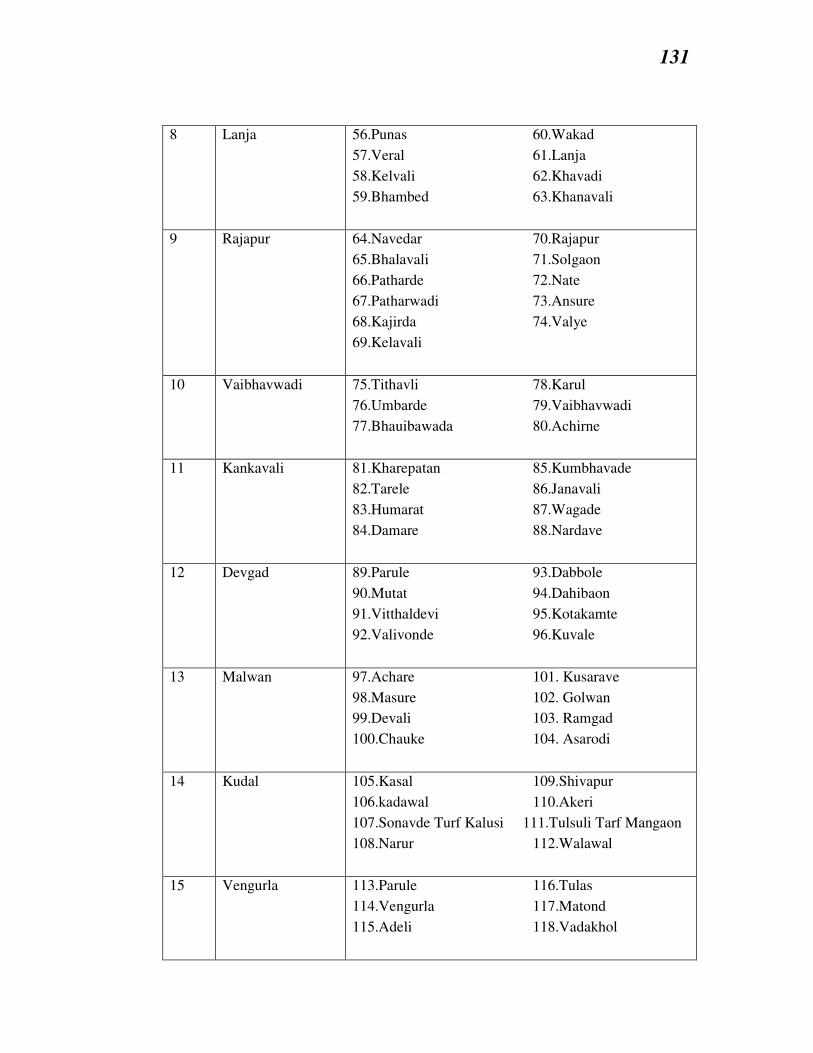
Table 6.1
South Konkan of Maharashtra: Sample Villages with Code Number
Sr.No. Tahsil Code Number and Name of the Village
1 Mandangad 1.Mhapral 5.Mandangad
2.Shenale 6. Shigvan
3.Taleghar 7. Kengwal
4.Shedawai
2 Dapoli 8. Shivajinagar 12. Mahalunge
9. Gimhavane 13. Nargoli
10. Karajgaon 14. Kolbanare
11. Shirsoli 15. Unhavre
3 Khed 16. Shivtar 20.Jaitapur
17.Murde 21.Tisangi
18.Nandgaon 22.Lote
19.Shiv Kh. 23.Choravane
4 Guhagar 24.Pere 28.Hedavi
25.Vadad 29.Kutgiri
26.Asgoli 30.Abloli
27.Malan 31.Pacheri
5 Chiplun 32.Kaundhar Tamhane 36.Kondmala
33.Kapare 37.Dhakmoli
34.Kherdi 38.Nandgaon
35.Akale 39.Phurus
6 Sangameshwar 40.Makhajan 44.Phansavale
41.Kadvai 45.Tulasani
42.Phansavane 46.Devrukh
43.mabhale 47.Sakharpa
7 Ratnagiri 48.Watad 52.Harchiri
49.Dhamanse 53.Kurtade
50.Nivali 54.Dugave
51.Tike 55.Nakhare
Page 3
131
8 Lanja 56.Punas 60.Wakad
57.Veral 61.Lanja
58.Kelvali 62.Khavadi
59.Bhambed 63.Khanavali
9 Rajapur 64.Navedar 70.Rajapur
65.Bhalavali 71.Solgaon
66.Patharde 72.Nate
67.Patharwadi 73.Ansure
68.Kajirda 74.Valye
69.Kelavali
10 Vaibhavwadi 75.Tithavli 78.Karul
76.Umbarde 79.Vaibhavwadi
77.Bhauibawada 80.Achirne
11 Kankavali 81.Kharepatan 85.Kumbhavade
82.Tarele 86.Janavali
83.Humarat 87.Wagade
84.Damare 88.Nardave
12 Devgad 89.Parule 93.Dabbole
90.Mutat 94.Dahibaon
91.Vitthaldevi 95.Kotakamte
92.Valivonde 96.Kuvale
13 Malwan 97.Achare 101. Kusarave
98.Masure 102. Golwan
99.Devali 103. Ramgad
100.Chauke 104. Asarodi
14 Kudal 105.Kasal 109.Shivapur
106.kadawal 110.Akeri
107.Sonavde Turf Kalusi 111.Tulsuli Tarf Mangaon
108.Narur 112.Walawal
15 Vengurla 113.Parule 116.Tulas
114.Vengurla 117.Matond
115.Adeli 118.Vadakhol
Page 4
132
16 Sawantwadi 119.Ajgaon 122.Chaukul
120.Kolgaon 123.Konas
121.Varle 124..Banda
17 Dodamarg 125.Talakat 128.Usap
126.Kalne 129. Konal
127.Kasai 130. Terwan
6.2 Economics of Cashew Cultivation:
The cashew, one of the important fruit crops in the study region
has a special economic status. Keeping the theoretical views of
economics of cashew cultivation, the data is collected through field
survey in the form of questionnaires, schedule, personal interviews and
observations of selected villages in the South Konkan of Maharashtra
to understand the economics of cashew cultivation in the particular
area. Fruit farming may be extended beyond this limit; the traditional
cereal cropping has reached its areal limits.
In the study region, various fruit crops are cultivated, such as
cashew, mango, jackfruit, coconut, arecanut (betelnut), pineapple,
kokam, jambul, banana etc. The most important fruit crops like cashew
and mango have been considered for comparative study on area base,
which occupies more than 96 per cent of total area (Table 4.2) under all
fruit crops in the study region. The cereals such as rice, ragi, vari, and
kodra as well as some pulses are cultivated in the study region. Out of
them, only two major crops i. e. rice and ragi, which cover 87.97 per
cent of total area (Table 4.2) under food grain crops in the study region,
are selected for the comparison of cost benefit with that of cashew crop
on the basis of area occupied.
6.2.1 Per hectare yield of cashew and selected crops
Per hectare yield of crops is the composite result of agro-climatic,
pedological, socio-economic and technological factors. The production
Page 5
133
depends on the nature of crop which gives response to inputs applied by
farmers. Considering this view it is necessary to indicate per hectare
yield of selected crops and cashew in the study region.
6.2.2 Physical yield of cashew and selected Crops per Hectare
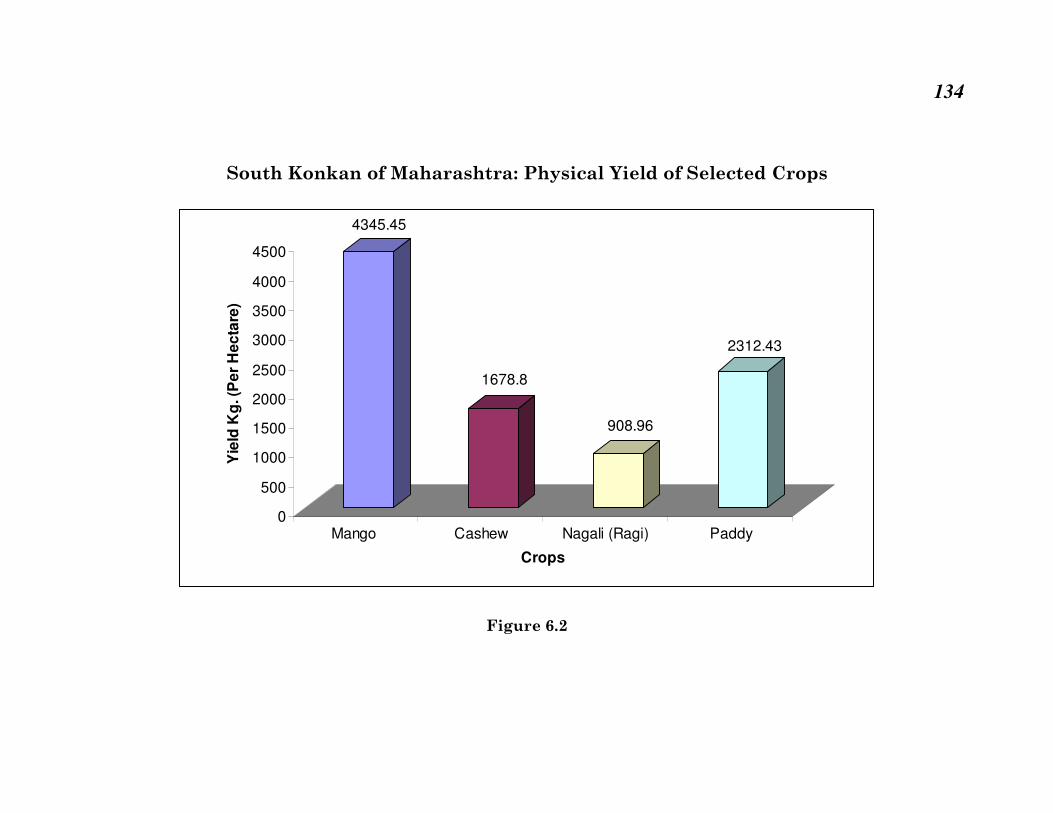
Per hectare physical yield of cashew and selected crops is
essential to know comparative yield of cashew compared to other major
selected crops produced by farmers in the study area. Physical yield is
per hectare production of the specific crop in kilograms. The analysis of
survey data collected reveals that physical yield of mango is higher
(4345.45 Kg / ha) as compared to that of cashew, nagali (ragi) and
paddy. Table 6.2 and Figure 6.2 reveals that, physical yield of mango is
4345.45 Kg / ha. The physical yield of cashew, paddy and nagali is
1678.80, 2312.43 and 908.96 kg / hectare respectively.
Table 6.2
South Konkan of Maharashtra : Physical yield of Cashew and
selected Crops per Hectare
Sr. No. Crops Yield (Per Hectare in kg)
1 Mango 4,345.45
2 Cashew 1,678.80
3 Nagali (Ragi) 908.96
4 Paddy 2,312.43
Source: Based on field work
Page 6
134
South Konkan of Maharashtra: Physical Yield of Selected Crops
4345.45
1678.8
908.96
2312.43
0
500
1000
1500
2000
2500
3000
3500
4000
4500
Yie
ld K
g. (P
er
He
cta
re)
Mango Cashew Nagali (Ragi) Paddy
Crops
Figure 6.2
Page 7
135
6.2.3 Cost of Cashew Cultivation
Cost of cashew cultivation includes establishment cost, recurring
cost and marketing cost. These are essential costs for cashew
cultivation practices. The said costs are explained as further;
A. Establishment Cost
Establishment cost is inevitable for cashew cultivation. It is fixed
cost which consists cost on land preparation, digging and filling of pits,
fencing, cost on plants, tools and equipments, maintenance of land,
application of manures, plantation of cashew plants and other casual
costs.
B. Recurring Cost
Recurring cost is variable cost of cashew cultivation. It includes
cost of filling of gap, pesticides and fungicides, labour charges,
fertilizers (Farm yard manure), harvesting by labours, cutting and
mulching, irrigation and other charges. Here, irrigation cost is
recurring cost because it is observed that there are no permanent
irrigation facilities in the study area. However, very few farmers are
having permanent water supply facilities on their farm, but most of
farmers manually supply water to the plants for 3-4 years from the
plantation of cashew.
C. Marketing Cost
Generally marketing cost includes cost of transportation and
commission charges, local tax, packaging, grading and storage. But it is
observed that, in case of cashew only transportation cost is important
because most of farmers sell their raw cashew to the local traders /
dealers as well as cashew processing units near by the farm. Some
times, traders / dealers collect raw cashew from cashew farm.
Page 8
136
6.2.4 Cost of Cashew Cultivation
As per the field survey it is observed that, establishment and
recurring cost of cashew cultivation are important costs. Among the
overall cost of cashew cultivation cost on land preparation, digging of
pits, fencing and cost of plant are major costs in establishment cost.
Total establishment cost of per hectare is Rs 18421 (Table 6.3). Per
hectare recurring cost of cashew cultivation is Rs 18802 which includes
cost of labour charges, fertilizers (farm yard manure) and irrigation.
Per hectare cost of pesticides, fungicides and fertilizers is low due to the
least use of it. The cost of labour charges per hectare regarding
harvesting is also very low (Rs 307). Per hectare marketing cost is Rs.
911; it is very low as compared to other costs. It is observed that, most
of farmers sell their raw cashew to the local traders by using auto
rickshaw, tempo and S.T. buses as means of transportation.
Table 6.3
South Konkanof Maharashtra: Factor wise Cost of
Cashew Cultivation
Establishment Cost Rs.
Per ha Recurring Cost
Rs per
ha
Preparation of land 4345 Filling of gap 684
Digging 4174 Pesticides / Fungicides 809
Filling of pits 939 Labour charges 4617
Cost of plants 4938 Fertilizers (Farm yard
manure)
2882
Maintenance of land 931 Harvesting by labour 307
Fencing 1396 Cutting and Mulching 491
Tools and equipments 1478 Irrigation 6473
other 220 Other (electricity charges,
etc.)
1628
Total cost 18421 Marketing Cost 911
Total cost 18802
Grand Total cost 37223
Source: Based on field work.
Page 9
137
6.2.5 Cashew Farming and Size of Holdings in South Konkan of
Maharashtra
As per the survey conducted in the study region it is observed
that, selected 390 respondents are producing cashew on 522.76
hectares of land. Out of them, 27.83 per cent of farmers are marginal
farmers, 26.80 per cent are small farmers, 21.24 per cent are semi-
medium farmers, 10.32 per cent of farmers are medium farmers and
13.81 per cent are big farmers. However, most of area under cashew
crop belongs to marginal, small and semi-medium farmers in study
area.
6.2.6 Size of Holding and Cost Benefit
The size of holdings and the size of a farm decide the degree of
risk that a farm operator can bear. In general larger the size of the
farm, greater the capacity of the farmer to take the risk and vice versa
(Husain, 2007). Particularly the fruit farming enterprises is very
sensitive, higher skill requiring, new approach and technology based.
In this regards the socio-economic status of farmers has prime
consideration (Pawar and Phule 2001). Theories relating to cost of
agriculture production and size of holdings indicate that, large size of
holdings are cost effective and profitable in the agriculture production
and small size of holdings are less cost effective in the agricultural
practices.
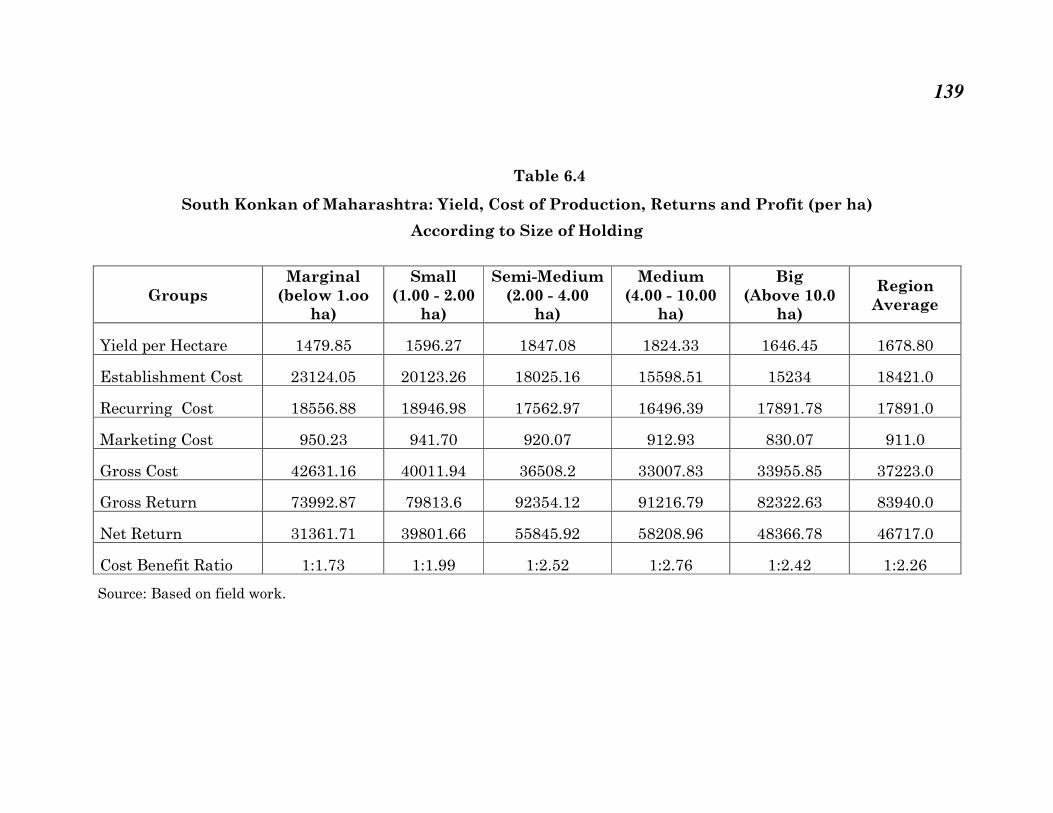
The analysis of facts (Table 6.4) reveals that, per hectare
establishment cost is very high in case of marginal farmers (Rs
23124.05) followed by small size of holdings (Rs 20,123.26), semi
medium size of holdings (Rs 18,025.16), medium size of holdings (Rs
15,598.51) and big / large size of holdings (Rs 15234). The trend
indicates that per hectare establishment cost decreases as size of
holdings increases. Recurring cost and marketing cost of cashew is high
in case of marginal farmers.
Page 10
138
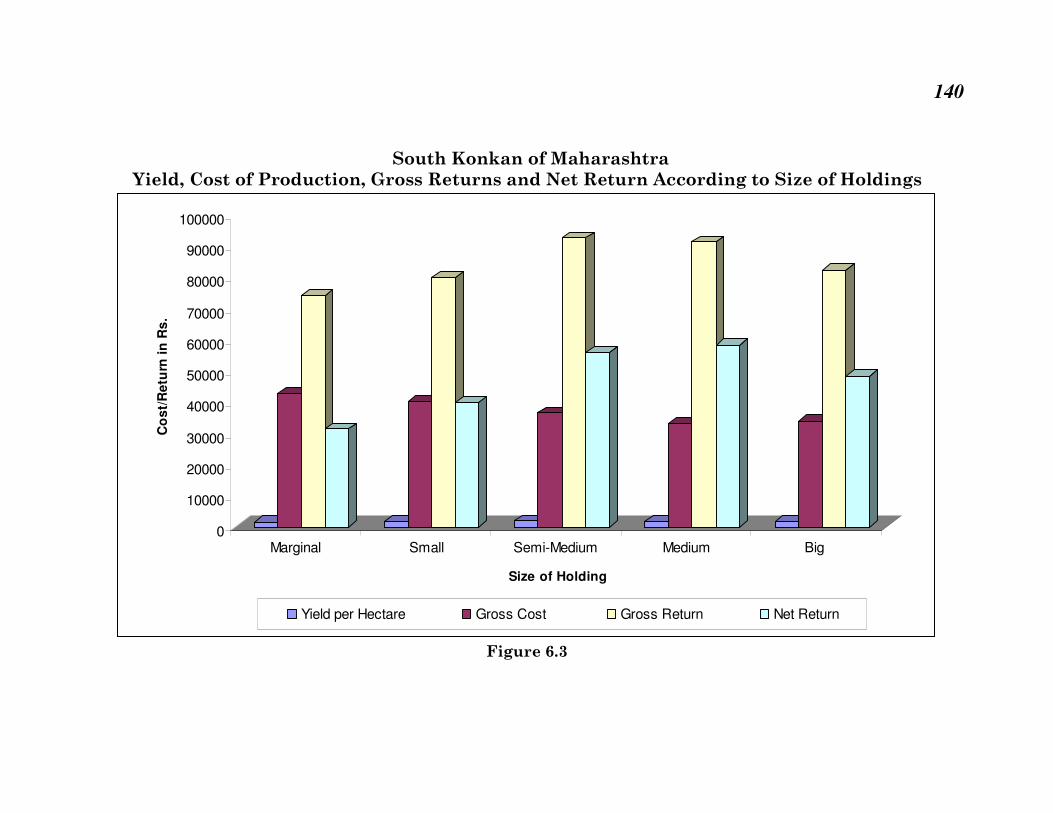
Establishment cost, recurring cost including marketing cost
constitute the gross cost, which is Rs 37223 as the region n average.
The gross cost of semi medium size of farmers is nearer to the regional
average (Fig 6.3). On the other hand marginal farmers and small
farmers have to spend high cost i.e. Rs 42,631.16 and Rs 40,011.94
respectively. The gross cost of medium and big size of farmers is
relatively less (Table 6.4).
The net return is an input output ratio. Table 6.4 reveals that,
the regional average of per hectare net return is Rs 46717. There is
variation in net profit according to size of holdings. The medium size of
farmers indicate highest net return (Rs 58208.96) followed by semi
medium size of farmers (Rs 55845.92). The net profit of big size of
farmers (Rs 48366.78) is nearer to regional average. The marginal (Rs
31361.71) and small (Rs 39801.66) size of farmers noted low net returns
as compared to others and regional average too (Fig 6.3).
The cost benefit ratio per hectare of cashew crop at regional level
is 1:2.26. The analysis reveals that intensive farming practices have
been made by medium, semi medium and large size of farmers which
have recorded high cost benefit ratio i. e. 1:2.76, 1: 2.52 and 1:2.42
respectively. On the other hand the small and marginal size of farmers
have below regional average cost benefit ratio (1:1.99 and 1:1.73). It is
due to the fact that improved agricultural practices are not well
practiced on small size of holdings. It results in increasing labour and
material inputs which contribute to increase overall costs resulting in
low returns from cashew crop in the study region. Thus the hypothesis
postulated that “the returns from cashew cultivations varies according
to the size of holdings” is tested positively.
Page 11
139
Table 6.4
South Konkan of Maharashtra: Yield, Cost of Production, Returns and Profit (per ha)
According to Size of Holding
Groups
Marginal
(below 1.oo
ha)
Small
(1.00 - 2.00
ha)
Semi-Medium
(2.00 - 4.00
ha)
Medium
(4.00 - 10.00
ha)
Big
(Above 10.0
ha)
Region
Average
Yield per Hectare 1479.85 1596.27 1847.08 1824.33 1646.45 1678.80
Establishment Cost 23124.05 20123.26 18025.16 15598.51 15234 18421.0
Recurring Cost 18556.88 18946.98 17562.97 16496.39 17891.78 17891.0
Marketing Cost 950.23 941.70 920.07 912.93 830.07 911.0
Gross Cost 42631.16 40011.94 36508.2 33007.83 33955.85 37223.0
Gross Return 73992.87 79813.6 92354.12 91216.79 82322.63 83940.0
Net Return 31361.71 39801.66 55845.92 58208.96 48366.78 46717.0
Cost Benefit Ratio 1:1.73 1:1.99 1:2.52 1:2.76 1:2.42 1:2.26
Source: Based on field work.
Page 12
140
South Konkan of Maharashtra
Yield, Cost of Production, Gross Returns and Net Return According to Size of Holdings
0
10000
20000
30000
40000
50000
60000
70000
80000
90000
100000
Co
st/
Re
turn
in
Rs
.
Marginal Small Semi-Medium Medium Big
Size of Holding
Yield per Hectare Gross Cost Gross Return Net Return
Figure 6.3
Page 13
141
6.2.7 Altitude (zone) Wise Yield and Returns of Cashew
Cultivation
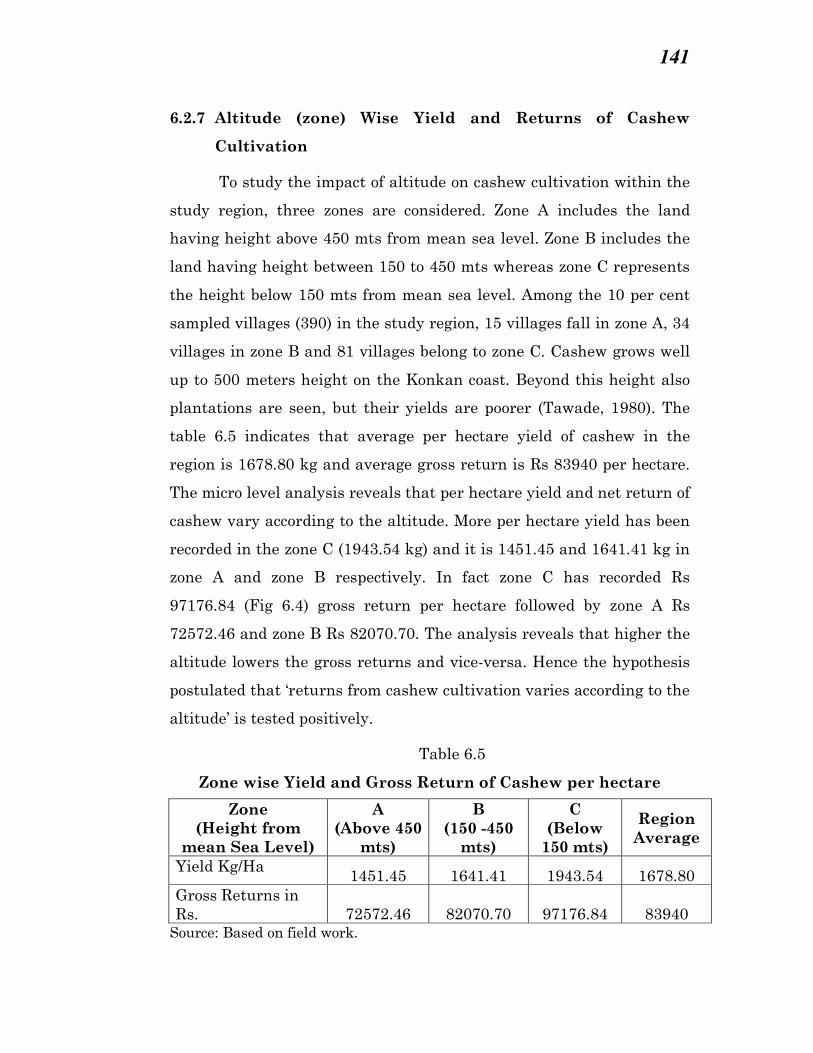
To study the impact of altitude on cashew cultivation within the
study region, three zones are considered. Zone A includes the land
having height above 450 mts from mean sea level. Zone B includes the
land having height between 150 to 450 mts whereas zone C represents
the height below 150 mts from mean sea level. Among the 10 per cent
sampled villages (390) in the study region, 15 villages fall in zone A, 34
villages in zone B and 81 villages belong to zone C. Cashew grows well
up to 500 meters height on the Konkan coast. Beyond this height also
plantations are seen, but their yields are poorer (Tawade, 1980). The
table 6.5 indicates that average per hectare yield of cashew in the
region is 1678.80 kg and average gross return is Rs 83940 per hectare.
The micro level analysis reveals that per hectare yield and net return of
cashew vary according to the altitude. More per hectare yield has been
recorded in the zone C (1943.54 kg) and it is 1451.45 and 1641.41 kg in
zone A and zone B respectively. In fact zone C has recorded Rs
97176.84 (Fig 6.4) gross return per hectare followed by zone A Rs
72572.46 and zone B Rs 82070.70. The analysis reveals that higher the
altitude lowers the gross returns and vice-versa. Hence the hypothesis
postulated that ‘returns from cashew cultivation varies according to the
altitude’ is tested positively.
Table 6.5
Zone wise Yield and Gross Return of Cashew per hectare
Zone
(Height from
mean Sea Level)
A
(Above 450
mts)
B
(150 -450
mts)
C
(Below
150 mts)
Region
Average
Yield Kg/Ha 1451.45 1641.41 1943.54 1678.80
Gross Returns in
Rs. 72572.46 82070.70 97176.84 83940 Source: Based on field work.
Page 14
142
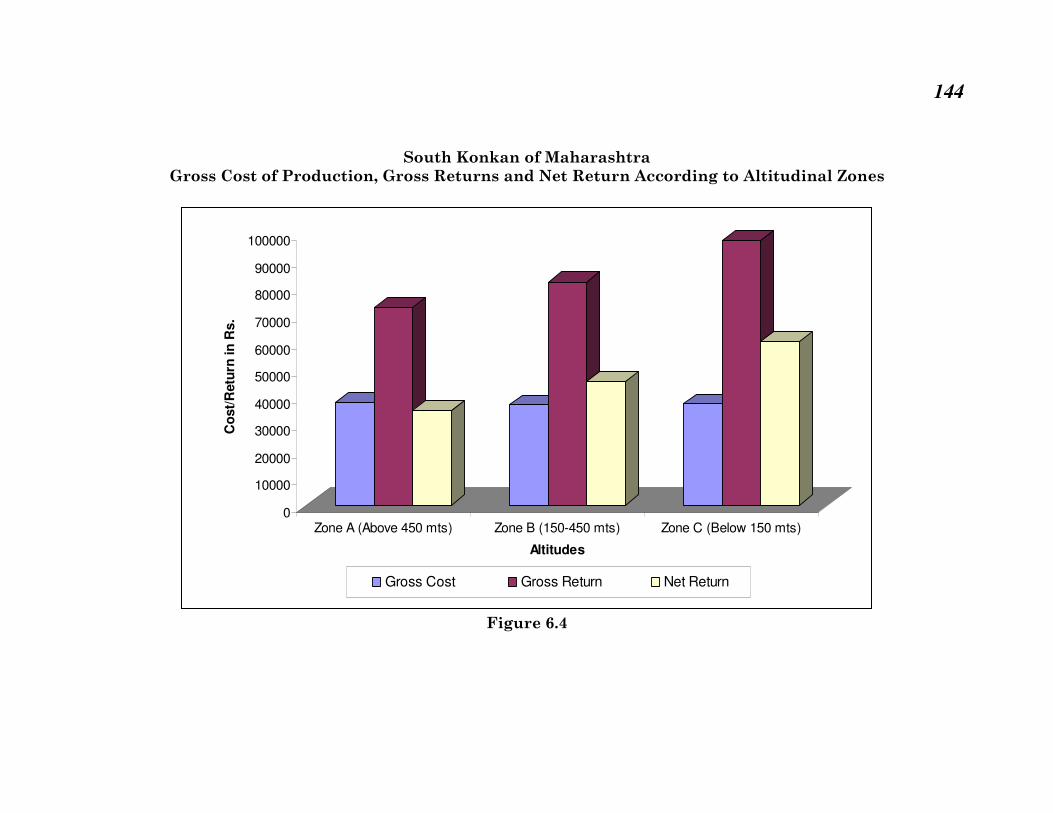
6.2.8 Altitudinal Zone Wise per Hectare Cost, Return and Cost
Benefit Ratio of Cashew
The analysis shows that per hectare cost and returns of cashew
cultivation changes according to the altitude. Per hectare average gross
cost is Rs 37223 (Table 6.6). It is higher in the zone A (Rs 37704.88).
There is no much variation in per hectare gross cost in zone B and C
i. e. Rs 36793.96 and Rs 37170.18 respectively (Fig 6.4).
In the study region per hectare high gross cost is confined in zone
A. It has been observed that farmers of zone A have to pay high cost on
preparation of land, digging, water facility, interculturing, spraying
and manuring. Nature of lateritic rock with hilly slope increases the
cost of land preparation and digging of pits. Due to changes in
pedological conditions the cost of water supply, spraying and manuring
also increases. As a result it leads to the high gross cost of cashew
cultivation in the zone A. As per field observation in the zone A, there
is poor quality of cashew production and high cost of interculturing. It
results in low net returns and low cost benefit ratio. By contrast, the
villages of zone B have noted low recurring (intercultural) and
marketing (transport) cost of cashew per hectare as compare to regional
average (Table 6.6). Villages in zone C, using high proportion of
manures and spraying of pesticides in particular cultivation practices
as well as favorable varkas soil are the contributing factors for
increasing the physical yield (1943.54 kg / ha) and ultimately gross
return.
In general, the average cost benefit ratio of South Konkan is
1:2.26, where as zones A, B and C represent 1:1.92, 1:2.23 and 1:2.67
respectively. In fact zone C followed by zone B is suitable for cashew
cultivation practices. It proves significant correlation between altitude
and cost benefit ratio i.e. lower the altitude higher the cost-benefit ratio
Page 15
143
and vice-versa. Thus the hypothesis postulated ‘return from cashew
plantation varies according to the altitudinal zones’ is tested positively.
Table 6.6
South Konkan of Maharashtra
Cost of Production, Returns and Profit of Cashew
According to Altitude
Zone (Height from mean Sea Level)
A (Above 450
mts)
B (150 -450 mts)
C (Below 150 mts)
Region Average
Yield Kg/ha 1451.45 1641.41 1943.54 1678.80
Establishment
Cost 21454.56 19475.43 17367.98 18421
Recurring Cost 15787.43 15546.98 18234.57 17891
Marketing Cost 1067.75 766.42 898.83 911
Gross Cost 37704.88 36793.96 37170.18 37223
Gross Return 72572.46 82070.70 97176.84 83940
Net Return 34867.58 45276.74 60006.66 46717
Cost Benefit
Ratio 1:1.92 1:2.23 1:2.67 1:2.26
Source: Based on field work.
Page 16
144
South Konkan of Maharashtra
Gross Cost of Production, Gross Returns and Net Return According to Altitudinal Zones
0
10000
20000
30000
40000
50000
60000
70000
80000
90000
100000C
ost/
Retu
rn in
Rs.
Zone A (Above 450 mts) Zone B (150-450 mts) Zone C (Below 150 mts)
Altitudes
Gross Cost Gross Return Net Return
Figure 6.4
Page 17
145
6.2.9 Cost benefits analysis of selected crops
Rice, ragi (nagali), mango are the major crops cultivated in the
South Konkan, which together occupy 50.86 per cent of gross cropped
area (Table 4.2, chapter IV). These are the representative of traditional
crops since long time. The cost of production and output is measured in
terms of rupees and yield in kilograms. Then for cost benefit ratio all
inputs and outputs are measured in average money value which is
based on field survey conducted during 2007-08 to 2009-10 on the basis
of current market prices.
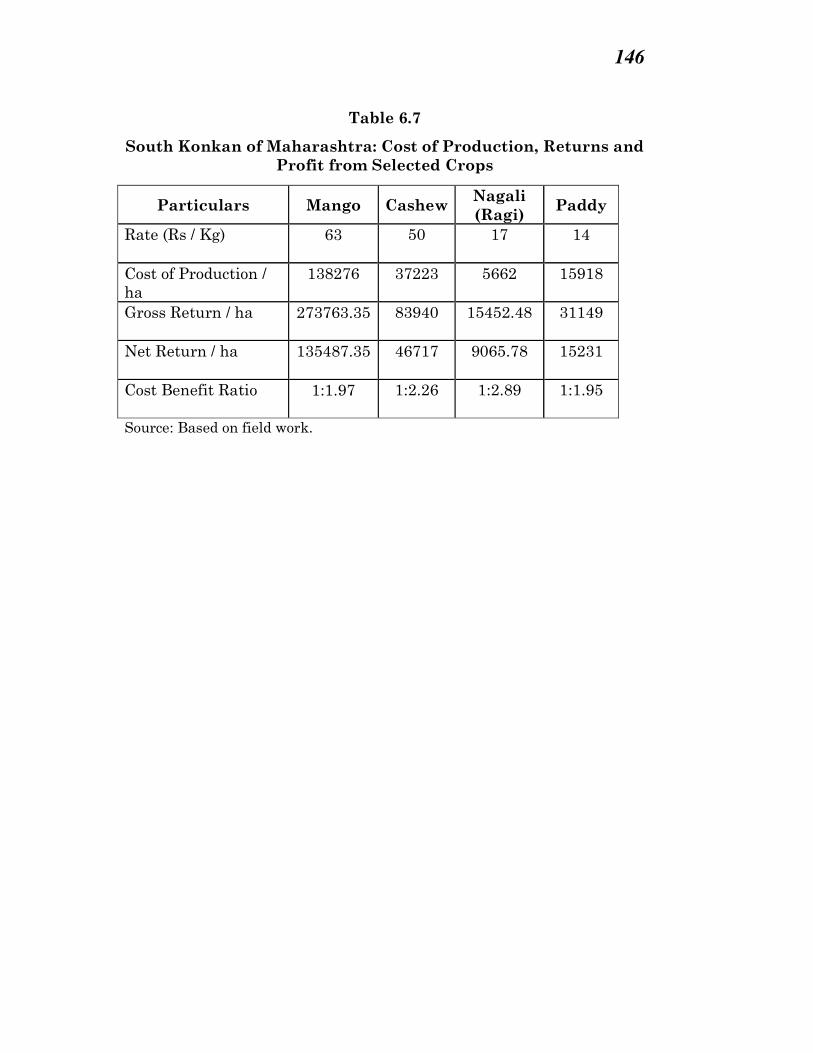
The table 6.7 indicates per hectare inputs and output of rice, ragi
and mango crops in the study region. The cost benefit ratio of mango,
nagali and paddy is 1:1.97, 1:2.89 and 1:1.95 respectively. The ragi and
paddy cultivation is at subsistence level, while mango cultivation is a
commercial farming. In ragi and paddy cultivation input cost in the
form of high yield variety seeds, fertilizers and pesticides is
insignificant as compare to mango and cashew cultivation.
Mango a commercial fruit crop getting good return have a cost
benefit ratio of 1:1.97 where as crops like ragi and paddy have noted
cost benefit ratio 1:2.89 and 1:1.95 respectively (Table 6.7). Remarkable
difference is also observed in ragi and paddy farming getting little
profit due to limitations of physical yield and low marketing prices.
Page 18
146
Table 6.7
South Konkan of Maharashtra: Cost of Production, Returns and
Profit from Selected Crops
Particulars Mango Cashew Nagali
(Ragi) Paddy
Rate (Rs / Kg) 63 50 17 14
Cost of Production /
ha
138276 37223 5662 15918
Gross Return / ha 273763.35 83940 15452.48 31149
Net Return / ha 135487.35 46717 9065.78 15231
Cost Benefit Ratio 1:1.97 1:2.26 1:2.89 1:1.95
Source: Based on field work.
Page 19
147
South Konkan of Maharashtra
Total Cost of Production, Gross Returns and Net Return of Cashew and Selected Crops
0
50000
100000
150000
200000
250000
300000
Co
st
in R
s.
Mango Cashew Nagali (Ragi) Paddy
Crops
Cost of Production / ha Gross Return / ha Net Return / ha
Figure 6.5
Page 20
148
6.2.10 Yield, Cost of Production, Returns and Profit from
Selected Crops
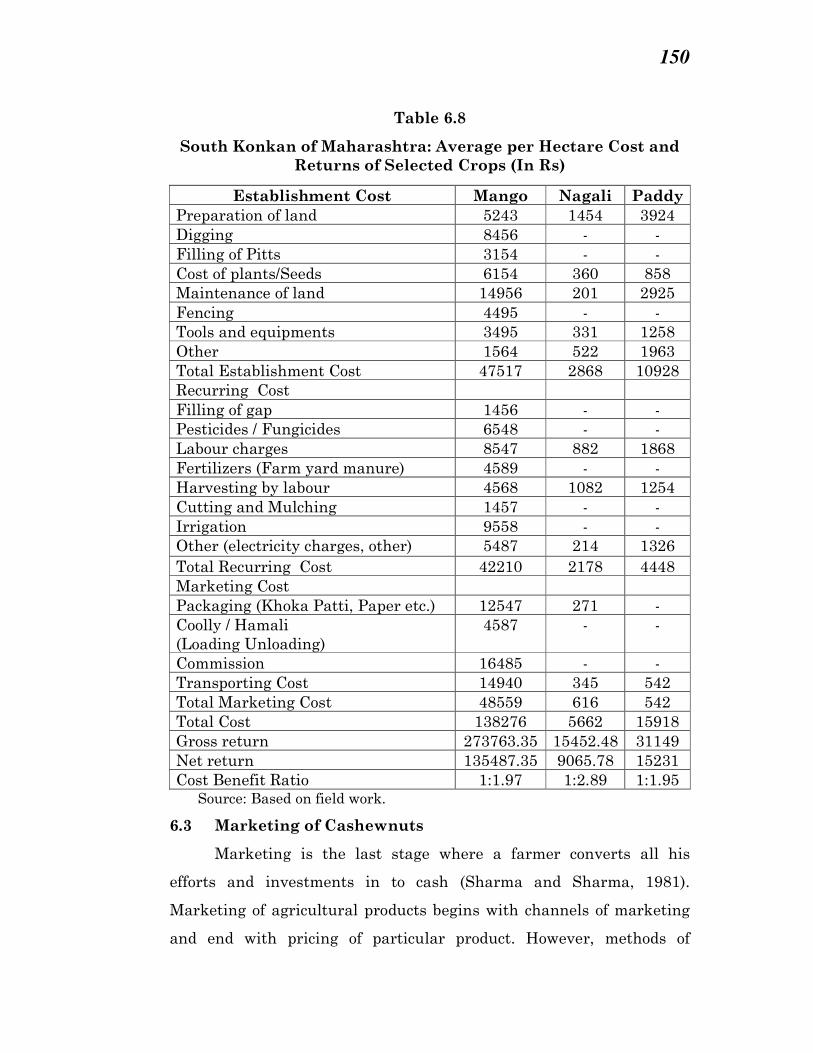
Table 6.8 indicates that, average per kg rates of selected crops is
ranging from Rs 14 to Rs 63. However, it is observed that per kg rate of
mango is Rs 63 which is higher, followed by cashew, nagali and paddy.
It is also observed that average per hectare cost of production is higher
in case of mango cultivation followed by cashew, paddy and nagali.
Average per hectare gross return is higher in case of mango crop
followed by cashew; Average per hectare gross return of paddy and
nagali is observed very low. It is noticed that, gross return in mango
and cashew cultivation is higher than nagali and paddy but cost of
production is also higher in case of mango and cashew. Therefore, most
of poor farmers are producing the cereals like nagali and paddy. In fact,
cost benefit ratio indicates that, there is higher ratio found in case of
nagali (1:2.89) which is higher than other selected crops. It is observed
that, cost benefit ratio is higher but few farmers (only 5.32 per cent to
regions total) produce nagali in the South Konkan because the demand
of nagali is very low in the local market. Its physical yield (965.78 Kg /
ha) is very low as compared to other crops (Table 6.2). The cereal crop
rice also indicates low yield, in fact it indicates least benefit ratio
1:1.95. As per table 6.7, mango is third ranking crop in term of cost
benefit ratio. Although, the net profit from mango crop is higher as
compared to other crops in South Konkan, the mango cultivation
practices are very costly (Rs 85567 per hectare) as compared to other
selected crops (Fig 6.5); because it needs high investment for plantation
and protection of mango plants. Mango has cost benefit ratio of 1:1.97,
however cost benefit ratio of cashew crop is 1:2.26 which is ranking
second in selected crops and its net return on investment is
considerable. Therefore, cashew has become one of the important
commercial crops in the study region.
Page 21
149
6.2.11 Comparative analysis of per hectare cost and returns of
selected crops and cashew
The table 6.8 shows the variations in the cost of production for
selected crops and cashew. Normally per hectare cost of production of
cashew is 2 to 7 times more than that of ragi and paddy cropping. But
comparing mango, it is 4 to 5 times low (Table 6.8). Because mango
cultivation requires, high investment in plantation and timely plant
protection treatments. The marketing cost of the cashew is very less as
compare to mango crop. Majority of cashew grower’s sell their raw
cashew in the local market such as circle or tahsil level, so it is below
1000 Rs per unit. On the other hand mango farming is facing lot of
marketing cost i.e. heavy cost of packing material, coolie, commission (2
to 3 per cent of total return), transportation (from study region to
Poona, Mumbai etc). All these facts have increased the marketing cost.
The crops like ragi and paddy are occasionally sold and only in local
market. Hence they do not require more marketing cost.
Noticeable variation is found in net return received from selected
crops and cashew. Per hectare net return from cashew cultivation is of
Rs 456717, Mango is a more profitable crop recording net return of Rs
135487. The ragi and paddy give less net returns (Table 6.8). Thus
mango followed by cashew gives attractive response to high inputs in
existing climatic and pedological conditions. For better net returns from
cashew cultivation there is need to enhance crop protection treatments.
On the other hand the traditional cereal crops i.e. paddy, ragi have
their own botanical limitations of its yield and net returns too. In fact
cost benefit ratio of cashew is higher i.e. 1:2.26, where as mango fruit
farming has recorded 1:1.97; ragi and paddy recorded 1:2.89 and 1: 1.89
benefit ratio respectively.
Page 22
150
Table 6.8
South Konkan of Maharashtra: Average per Hectare Cost and
Returns of Selected Crops (In Rs)
Establishment Cost Mango Nagali Paddy
Preparation of land 5243 1454 3924
Digging 8456 - -
Filling of Pitts 3154 - -
Cost of plants/Seeds 6154 360 858
Maintenance of land 14956 201 2925
Fencing 4495 - -
Tools and equipments 3495 331 1258
Other 1564 522 1963
Total Establishment Cost 47517 2868 10928
Recurring Cost
Filling of gap 1456 - -
Pesticides / Fungicides 6548 - -
Labour charges 8547 882 1868
Fertilizers (Farm yard manure) 4589 - -
Harvesting by labour 4568 1082 1254
Cutting and Mulching 1457 - -
Irrigation 9558 - -
Other (electricity charges, other) 5487 214 1326
Total Recurring Cost 42210 2178 4448
Marketing Cost
Packaging (Khoka Patti, Paper etc.) 12547 271 -
Coolly / Hamali
(Loading Unloading)
4587 - -
Commission 16485 - -
Transporting Cost 14940 345 542
Total Marketing Cost 48559 616 542
Total Cost 138276 5662 15918
Gross return 273763.35 15452.48 31149
Net return 135487.35 9065.78 15231
Cost Benefit Ratio 1:1.97 1:2.89 1:1.95 Source: Based on field work.
6.3 Marketing of Cashewnuts
Marketing is the last stage where a farmer converts all his
efforts and investments in to cash (Sharma and Sharma, 1981).
Marketing of agricultural products begins with channels of marketing
and end with pricing of particular product. However, methods of
Page 23
151
marketing differ according to the type of product, durability of the
product. Marketing of cashew consist marketing channels, period of
sale, methods of sale, pricing and quality of cashew, grading and drying
of raw cashew, means of transportation etc.
6.3.1 Cashewnut Selling Period
After harvesting of cashewnut, it needs to find out market, that’s
why cashew grower’s sale their raw cashew through various linkages.
The raw cashew should be dried for 2 to 3 days before selling. The table
6.9 reveals the sale of raw cashew in the study region. Out of total
respondent farmers, 74.19 per cent of cashew growers sale their raw
cashew within one month from the period of harvesting. About 3/4th of
raw cashew is sold within a month from the period of harvesting. This
is due to lack of storage facility for raw cashew and the farmers need
early money by selling of raw cashew. Between 2 months to 4 months,
only 6.52 per cent respondent growers sell their raw cashew and above
4 months, 9.24 per cent of farmers sale their raw cashew, as these
farmers are economically sound. Whereas some of them have own
storage houses for raw cashew. As per field observation most of cashew
growers sell their raw cashew in month of March and April. It is
observed (personal interview) that the cashew growers obtain highest
price in rainy season, particularly in the month of August and
September.
Table 6.9
Schedule of Sale after Harvesting of Cashewnuts
Sr.
No. Period No of Respondents
% of
response
1 Within 1 Month 273 74.19
2 1 to 2 Months 37 10.05
3 2 to 4 Months 24 6.52
4 After 4 months 34 9.24
Total 368 100
Source: Based on field work.
Page 24
152
6.3.2 Marketing Channels of Cashewnut:
Table 6.10 reveals the marketing channels of cashewnut in the
study region. The analysis reveals that most of cashew growers (75.90
per cent) sell their raw cashew to the local traders in the study region,
after harvesting the cashew; similarly 16.67 per cent of cashew growers
sell their raw cashew to local cashew processing units. Remaining 7.43
per cent of cashew growers are linked with whole seller.
Table 6.10
South Konkan of Maharashtra: Marketing Channels
of Cashewnut
Sr.
No. Channels No. of Respondent Percentage
1 Local Traders 296 75.90
2 Wholesale Traders 29 7.43
3 Processing Units 65 16.67
Total 390 100
Source: Based on field work.
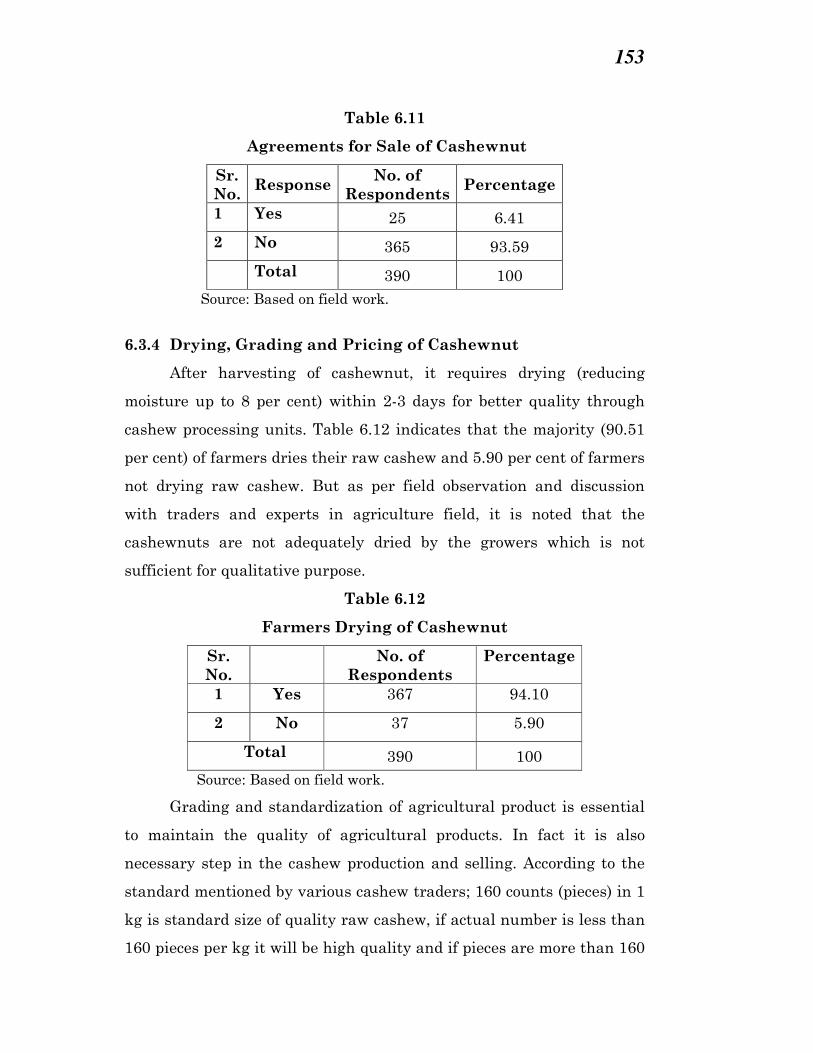
6.3.3 Agreements for Sale of Cashewnut
The agreement is one of the important methods of selling in the
modern era. In this system an agreement is made between producer
and trader. Accordingly very few cashew producers sign agreements for
selling their cashew to the traders before production of cashew.
Majority of traders are outside from the study region. Table 6.11
indicates that, only 6.41 per cent of farmers sign contracts with traders
and 93.59 per cent farmers sell their raw cashew after production to the
traders without signing contract before cashew production. Such
traders are mostly local.
Page 25
153
Table 6.11
Agreements for Sale of Cashewnut
Sr.
No. Response
No. of
Respondents Percentage
1 Yes 25 6.41
2 No 365 93.59
Total 390 100
Source: Based on field work.
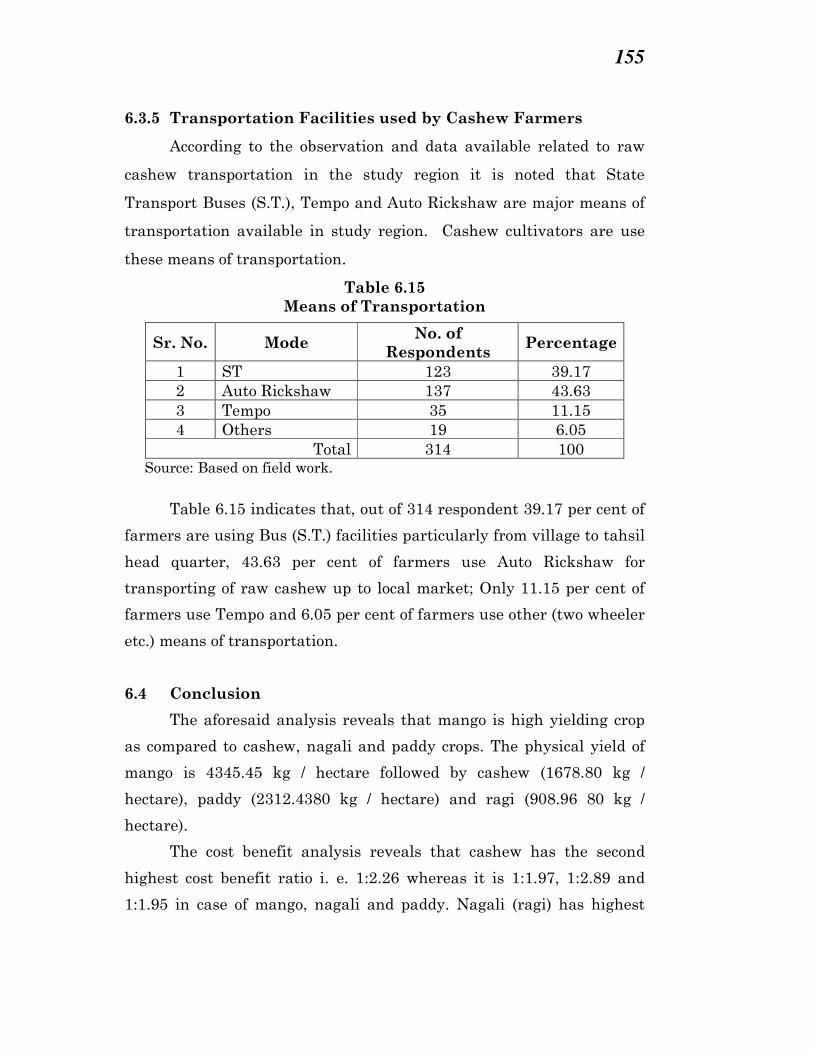
6.3.4 Drying, Grading and Pricing of Cashewnut
After harvesting of cashewnut, it requires drying (reducing
moisture up to 8 per cent) within 2-3 days for better quality through
cashew processing units. Table 6.12 indicates that the majority (90.51
per cent) of farmers dries their raw cashew and 5.90 per cent of farmers
not drying raw cashew. But as per field observation and discussion
with traders and experts in agriculture field, it is noted that the
cashewnuts are not adequately dried by the growers which is not
sufficient for qualitative purpose.
Table 6.12
Farmers Drying of Cashewnut
Sr.
No.
No. of
Respondents
Percentage
1 Yes 367 94.10
2 No 37 5.90
Total 390 100
Source: Based on field work.
Grading and standardization of agricultural product is essential
to maintain the quality of agricultural products. In fact it is also
necessary step in the cashew production and selling. According to the
standard mentioned by various cashew traders; 160 counts (pieces) in 1
kg is standard size of quality raw cashew, if actual number is less than
160 pieces per kg it will be high quality and if pieces are more than 160
Page 26
154
per kg then it will be of low quality (Kolekar,2008). The analysis
reveals (Table 6.13) that, only 8.38 per cent of farmers grade their raw
cashewnuts according to size and quality. Where as majority (91.62 per
cent) of farmers sell their cashew to the traders without doing
gradation of raw cashew because they are ignorant about gradation of
cashew. As a result these farmers get very low per kg rate for raw
cashew.
Table 6.13
Grading of Cashewnut
Sr. No. Response No. of Respondents Percentage
1 Yes 28 8.38
2 No 306 91.62
Total 334 100
Source: Based on field work.
Fluctuation in the prices of agricultural commodities is one of the
major constrains in the improvement of economy of Indian farmers.
Recently Government has started this practice, but it is not operated
timely. Many times rates of agricultural products are determined by
traders, processing units or consumers. Same fact has been observed
relating to the pricing of raw cashew in the region. Table 6.14 indicates
that, only 7.18 per cent of farmers fix the prices of their cashew; those
are the big farmers and sell large quantity of raw cashew. However,
92.82 per cent of farmers accept prices offered by the traders which are
very uneconomic to the cashew growers.
Table 6.14
Price Fixation of Cashewnuts
Sr. No. No. of Respondents Percentage
1 Self 28 7.18
2 By traders 362 92.82
Total 390 100
Source: Based on field work.
Page 27
155
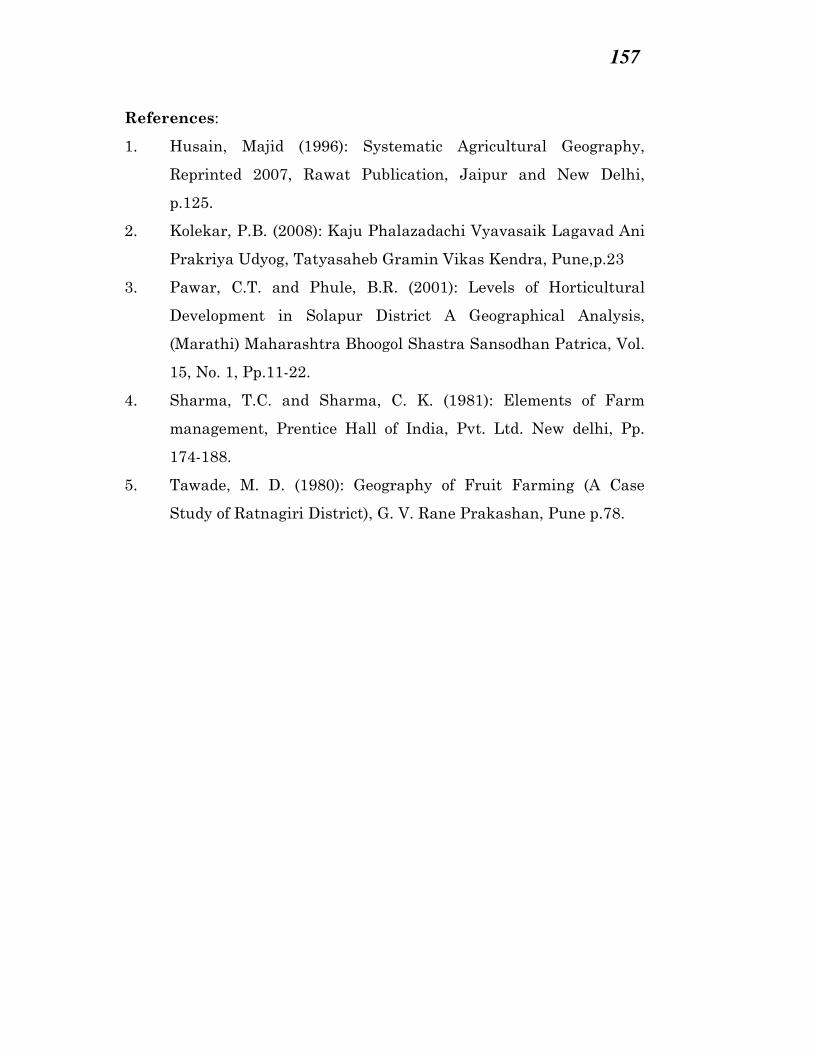
6.3.5 Transportation Facilities used by Cashew Farmers
According to the observation and data available related to raw
cashew transportation in the study region it is noted that State
Transport Buses (S.T.), Tempo and Auto Rickshaw are major means of
transportation available in study region. Cashew cultivators are use
these means of transportation.
Table 6.15
Means of Transportation
Sr. No. Mode No. of
Respondents Percentage
1 ST 123 39.17
2 Auto Rickshaw 137 43.63
3 Tempo 35 11.15
4 Others 19 6.05
Total 314 100 Source: Based on field work.
Table 6.15 indicates that, out of 314 respondent 39.17 per cent of
farmers are using Bus (S.T.) facilities particularly from village to tahsil
head quarter, 43.63 per cent of farmers use Auto Rickshaw for
transporting of raw cashew up to local market; Only 11.15 per cent of
farmers use Tempo and 6.05 per cent of farmers use other (two wheeler
etc.) means of transportation.
6.4 Conclusion
The aforesaid analysis reveals that mango is high yielding crop
as compared to cashew, nagali and paddy crops. The physical yield of
mango is 4345.45 kg / hectare followed by cashew (1678.80 kg /
hectare), paddy (2312.4380 kg / hectare) and ragi (908.96 80 kg /
hectare).
The cost benefit analysis reveals that cashew has the second
highest cost benefit ratio i. e. 1:2.26 whereas it is 1:1.97, 1:2.89 and
1:1.95 in case of mango, nagali and paddy. Nagali (ragi) has highest
Page 28
156
cost benefit ratio due to low input cost but it has low yield due to its
physical limitations and low market price.
Reverse relationship is observed between altitude and cost
benefit ratio. So far cashew cultivation is concerned. Thus the
hypothesis postulated, “the returns from cashew plantation vary
according to the altitudinal zones” is tested positively. As such lower
the altitude from sea level higher the cost-benefit ratio and vice-versa.
The cost benefit ratio as well as net returns per hectare also
varies according to size of holdings. Semi medium size and medium size
of cashew farmers have received higher production, net return and cost
benefit ratio too. Hence the hypothesis postulated, “the returns from
cashew cultivation vary according to the size of holding” is tested
positively.
The comparative analysis of selected crops and cashew crop
reveals that mango is more profitable crop which has noted net returns
of Rs 135487 per hectare followed by cashew Rs 46717 whereas nagali
(Rs 9065.78) and paddy crops (Rs 15231) have recorded low profit.
Hence the hypothesis postulated, “returns from cashew culture yields
high as compared to cereal crops particularly paddy and ragi” is tested
positively.
The work of picking of cashewnuts from trees starts from
February and continues up to early June. In this work it is observed
that most of family members are engaged.
The cashewnuts produced in the region is sold in local market
(mainly for local cashew processing units) and some product goes to
regional and national market.
In the study region it is observed that there is no strong farmers
organization to present their difficulties to the Government to support
cashew marketing practices. However ‘Kaju Ratna Samooh’ movement
in Ratnagiri district helps cashew growers through Mahila Bachat gats.
Page 29
157
References:
1. Husain, Majid (1996): Systematic Agricultural Geography,
Reprinted 2007, Rawat Publication, Jaipur and New Delhi,
p.125.
2. Kolekar, P.B. (2008): Kaju Phalazadachi Vyavasaik Lagavad Ani
Prakriya Udyog, Tatyasaheb Gramin Vikas Kendra, Pune,p.23
3. Pawar, C.T. and Phule, B.R. (2001): Levels of Horticultural
Development in Solapur District A Geographical Analysis,
(Marathi) Maharashtra Bhoogol Shastra Sansodhan Patrica, Vol.
15, No. 1, Pp.11-22.
4. Sharma, T.C. and Sharma, C. K. (1981): Elements of Farm
management, Prentice Hall of India, Pvt. Ltd. New delhi, Pp.
174-188.
5. Tawade, M. D. (1980): Geography of Fruit Farming (A Case
Study of Ratnagiri District), G. V. Rane Prakashan, Pune p.78.