2017 Spring Biostatistics http ://cbb.sjtu.edu.cn/~jingli/courses/2017/bi372/ Dept of Bioinformatics & Biostatistics, SJTU Jing Li jing.li @sjtu.edu.cn Chapter10 Analysis of binary/categorical outcomes: Matched and correlated data
df=1, and total sample size (total of numbers in the table) is less than 40
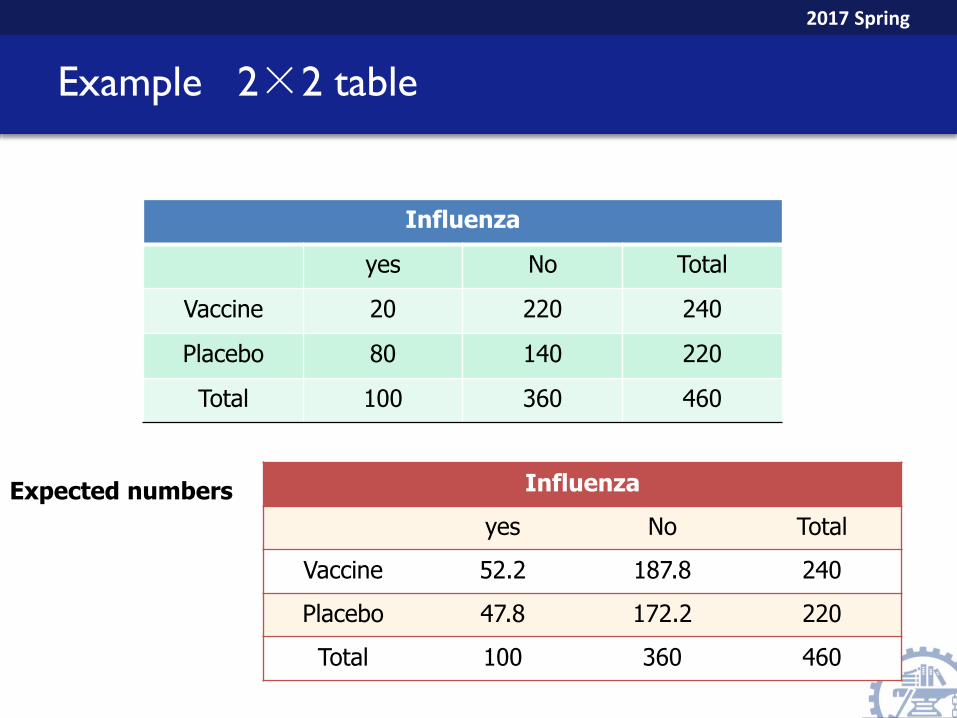
or, df=1, and the smallest expected number is less than 5
Cochran (1954) recommended
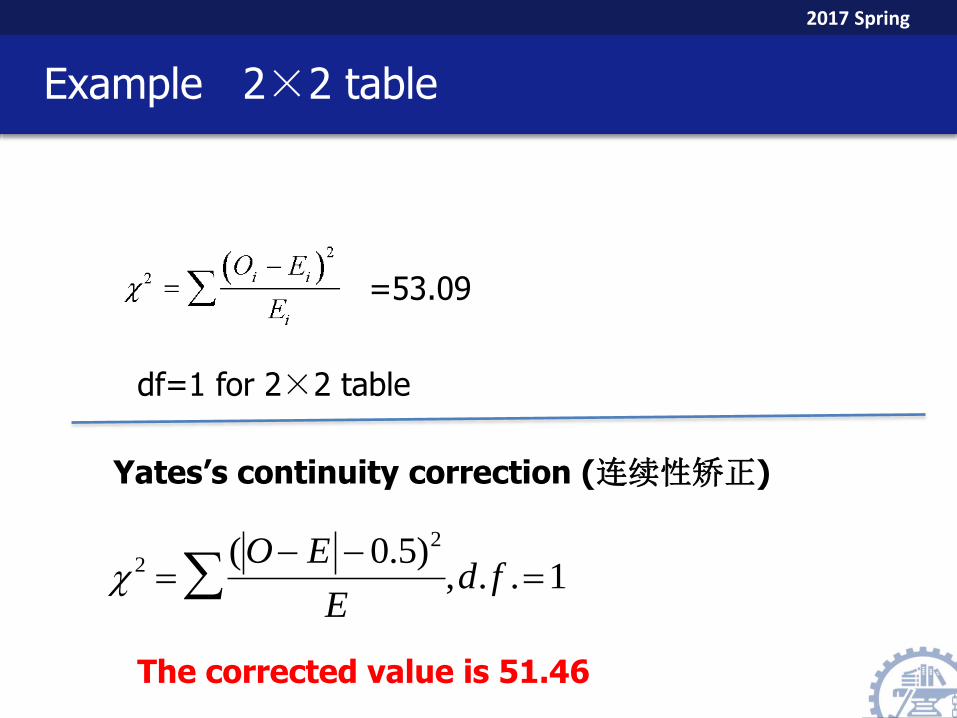
It reduces the size of the chi-square value and so reduces the chance of finding a statistically significant difference, so that correction for continuity makes the test more conservative.
2017 Spring
Yates’s continuity correction (连续性矫正)
When df>1, NO Yates’s continuity correction !
Cochran (1954) recommended
When df>1, the chi-squared test is valid when less 20% of the expected numbers are under 5 and none is less than 1; data is randomly selected.
2017 Spring
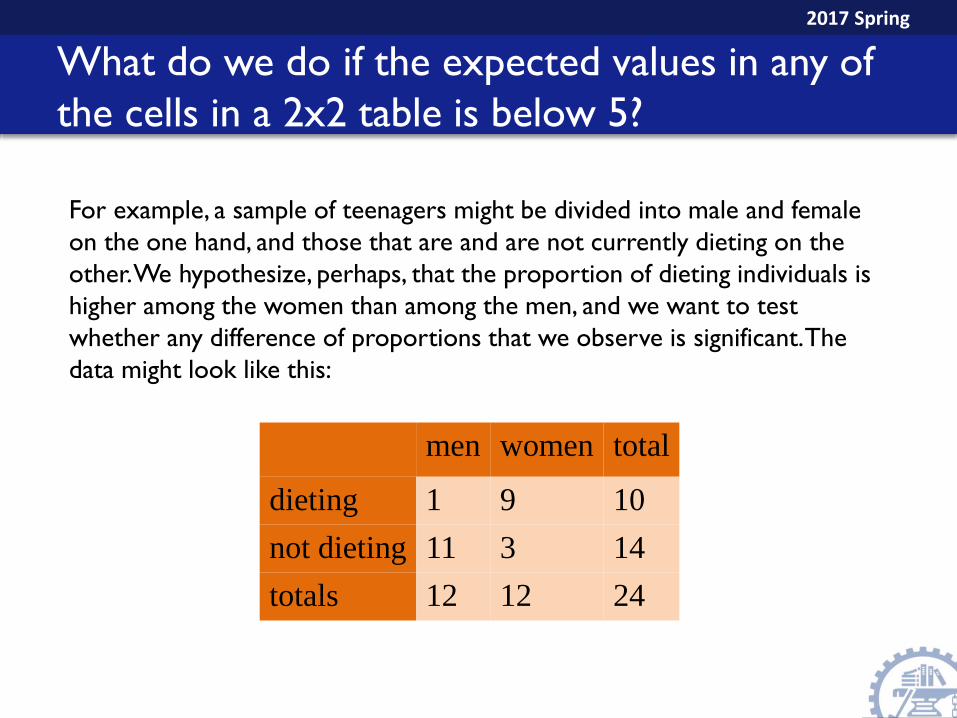
What do we do if the expected values in any of
the cells in a 2x2 table is below 5?
For example, a sample of teenagers might be divided into male and female
on the one hand, and those that are and are not currently dieting on the
other. We hypothesize, perhaps, that the proportion of dieting individuals is
higher among the women than among the men, and we want to test
whether any difference of proportions that we observe is significant. The
data might look like this:
men women total
dieting 1 9 10
not dieting 11 3 14
totals 12 12 24
2017 Spring
What do we do if the expected values in any of
the cells in a 2x2 table is below 5?
For example, a sample of teenagers might be divided into male and female
on the one hand, and those that are and are not currently dieting on the
other. We hypothesize, perhaps, that the proportion of dieting individuals is
higher among the women than among the men, and we want to test
whether any difference of proportions that we observe is significant. The
data might look like this:
men women total
dieting 5 5 10
not dieting 7 7 14
totals 12 12 2
The expected values:
2017 Spring
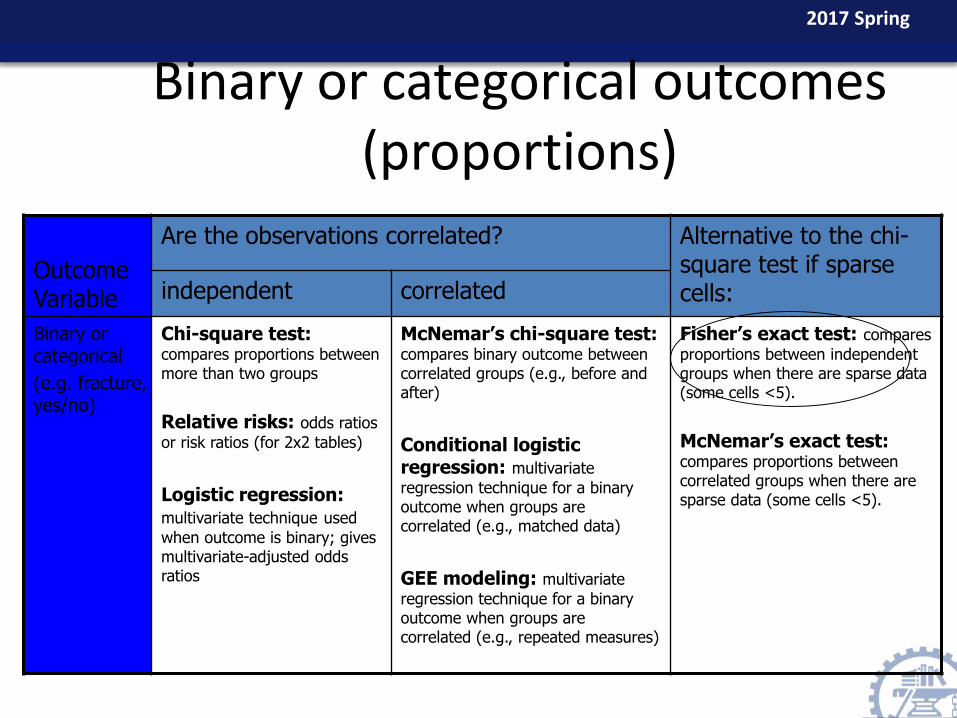
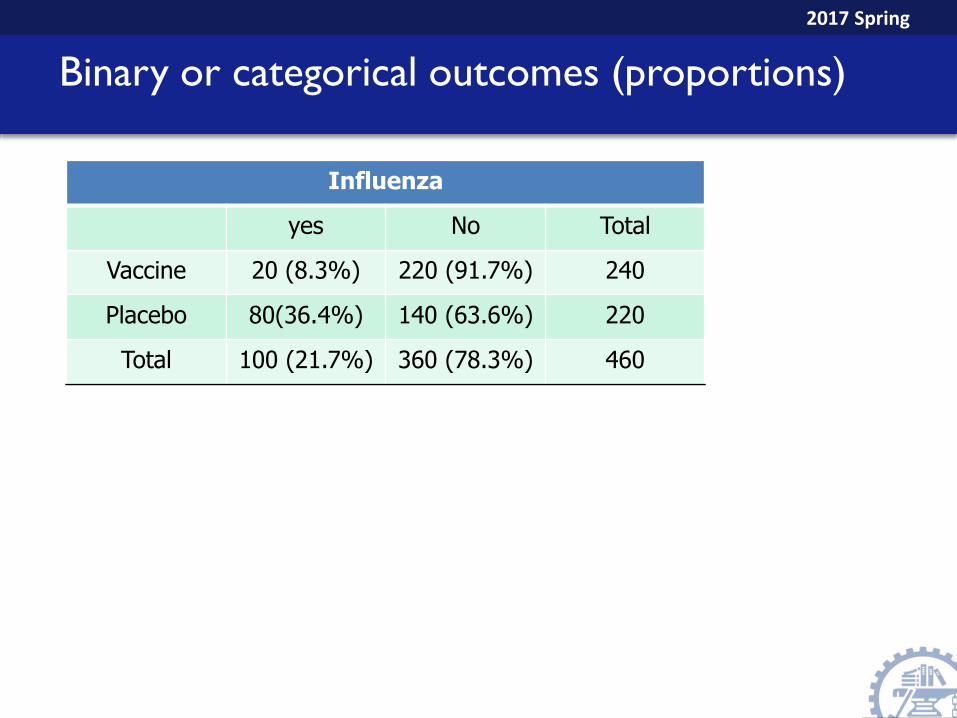
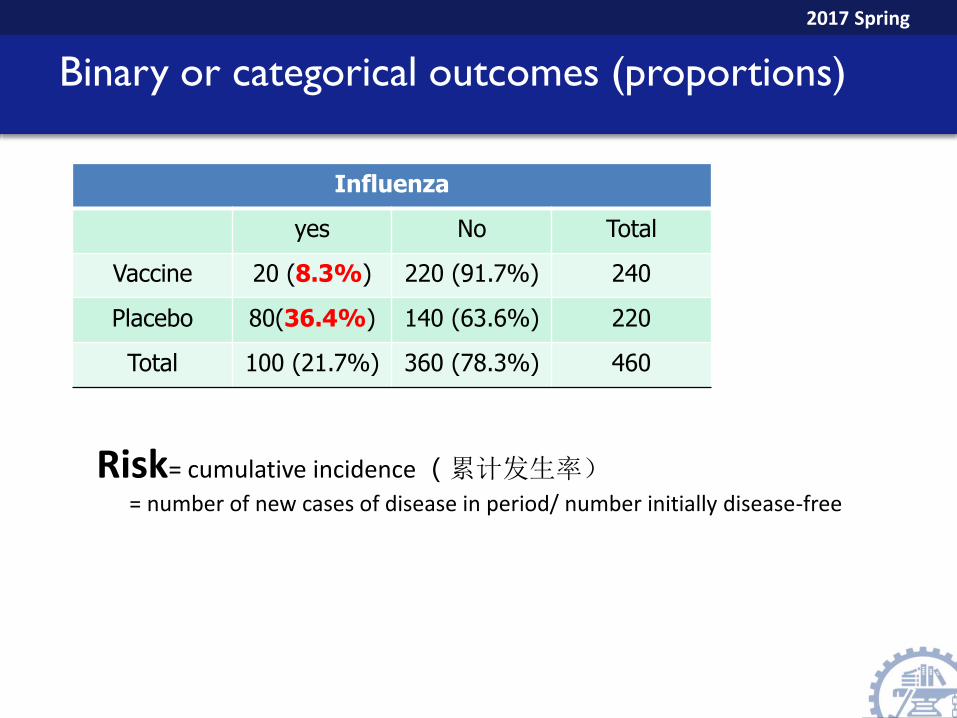
Binary or categorical outcomes (proportions)
Outcome Variable
Are the observations correlated? Alternative to the chi-square test if sparse cells:independent correlated
Binary or categorical
(e.g. fracture, yes/no)
Chi-square test:compares proportions between more than two groups
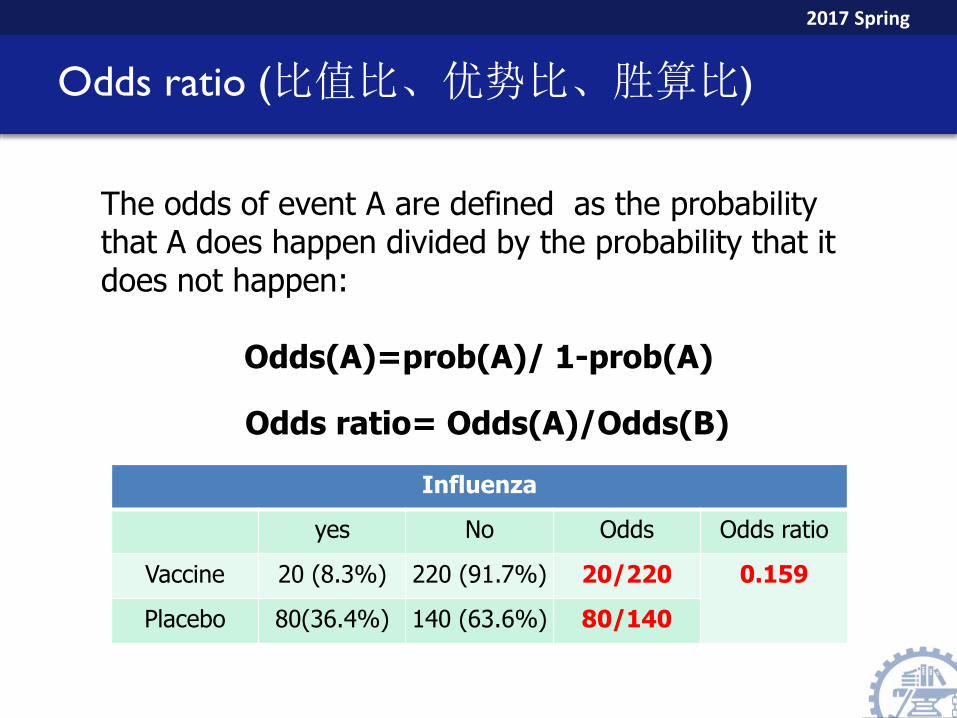
Relative risks: odds ratios
or risk ratios (for 2x2 tables)
Logistic regression:multivariate technique used
when outcome is binary; gives multivariate-adjusted odds ratios
McNemar’s chi-square test:compares binary outcome between correlated groups (e.g., before and after)
Conditional logistic regression: multivariate
regression technique for a binary outcome when groups are correlated (e.g., matched data)
GEE modeling: multivariate
regression technique for a binary outcome when groups are correlated (e.g., repeated measures)
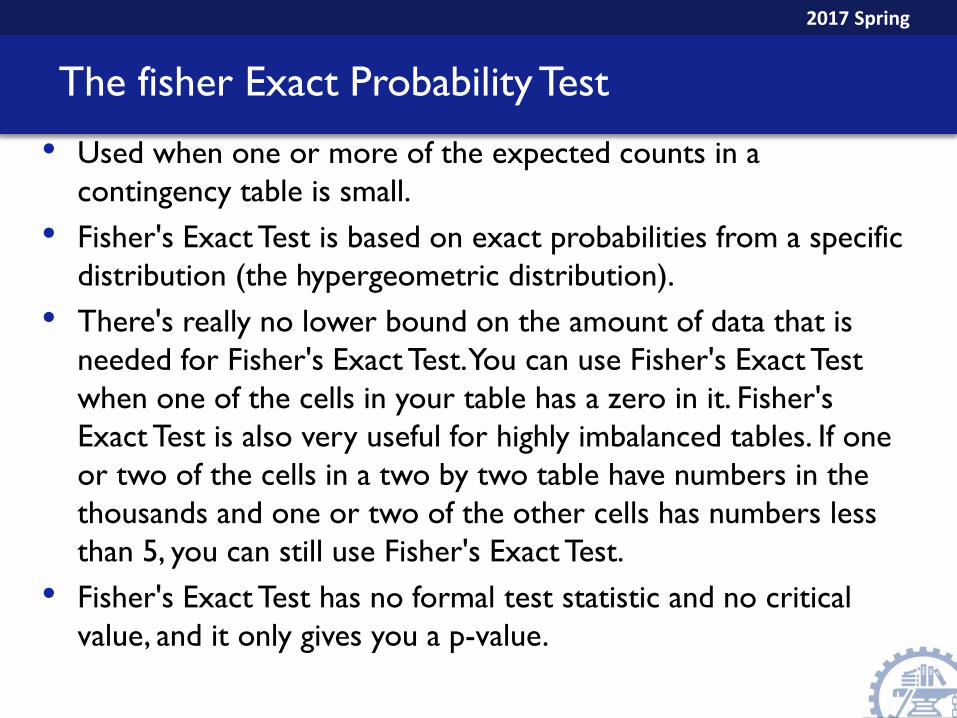
Fisher’s exact test: compares
proportions between independent groups when there are sparse data (some cells <5).
McNemar’s exact test:compares proportions between correlated groups when there are sparse data (some cells <5).
2017 Spring
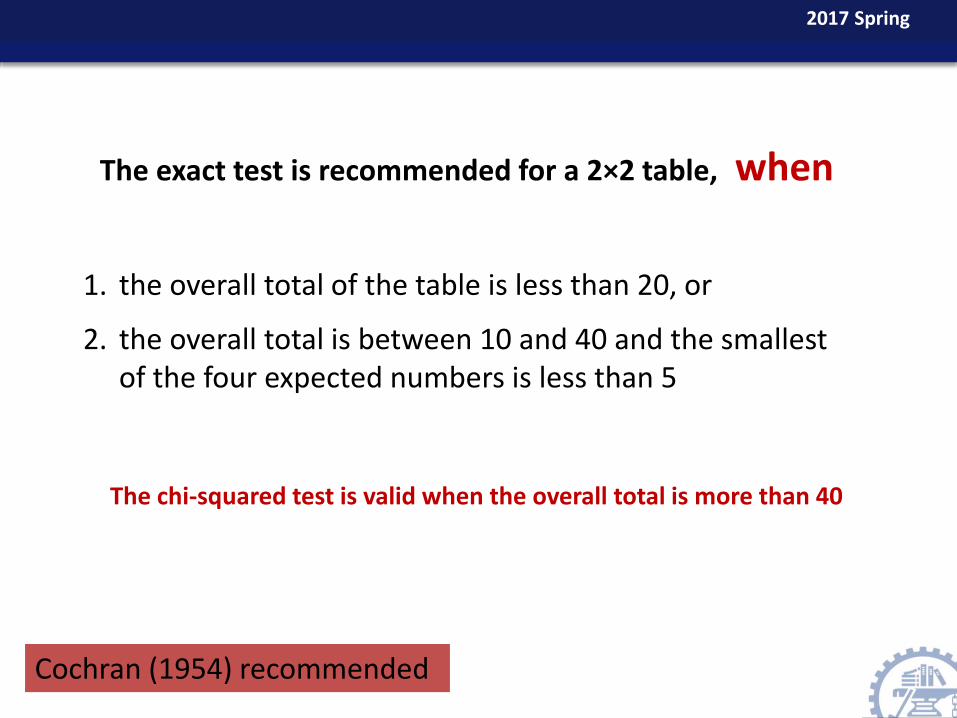
The exact test is recommended for a 2×2 table, when
1. the overall total of the table is less than 20, or
2. the overall total is between 10 and 40 and the smallest of the four expected numbers is less than 5
The chi-squared test is valid when the overall total is more than 40
Cochran (1954) recommended
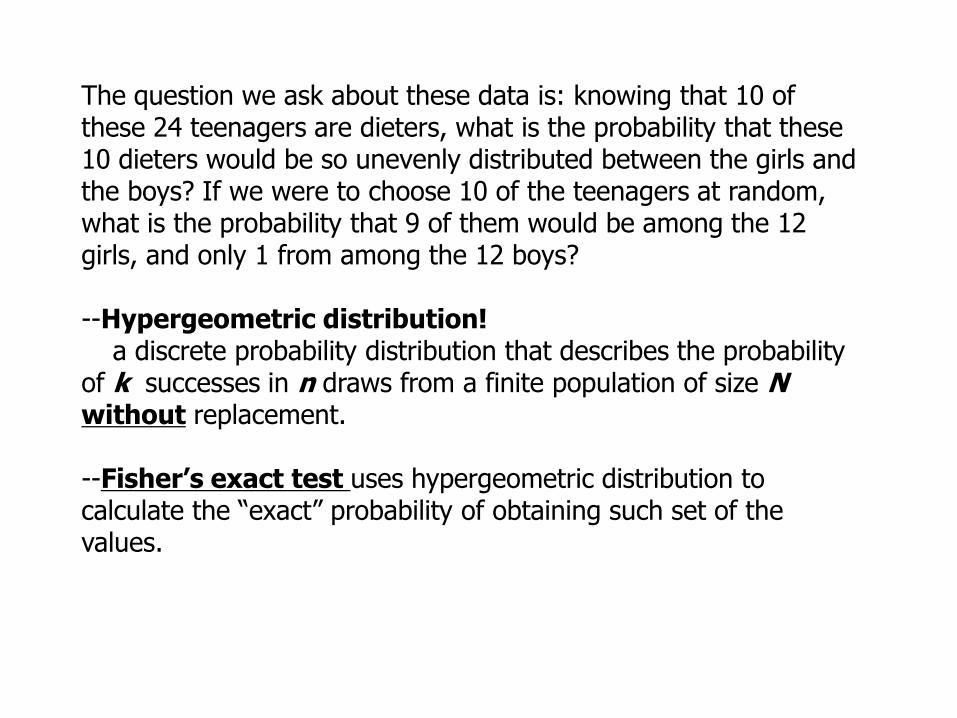
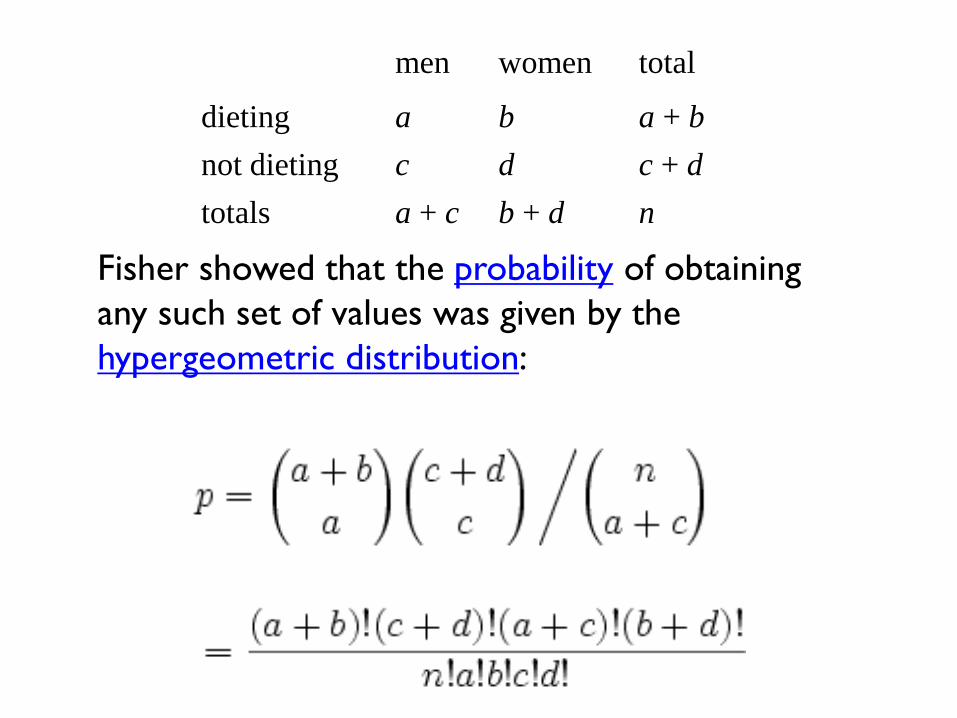
The question we ask about these data is: knowing that 10 of these 24 teenagers are dieters, what is the probability that these 10 dieters would be so unevenly distributed between the girls and the boys? If we were to choose 10 of the teenagers at random, what is the probability that 9 of them would be among the 12 girls, and only 1 from among the 12 boys?
--Hypergeometric distribution!a discrete probability distribution that describes the probability
of k successes in n draws from a finite population of size Nwithout replacement.
--Fisher’s exact test uses hypergeometric distribution to calculate the “exact” probability of obtaining such set of the values.
2017 Spring
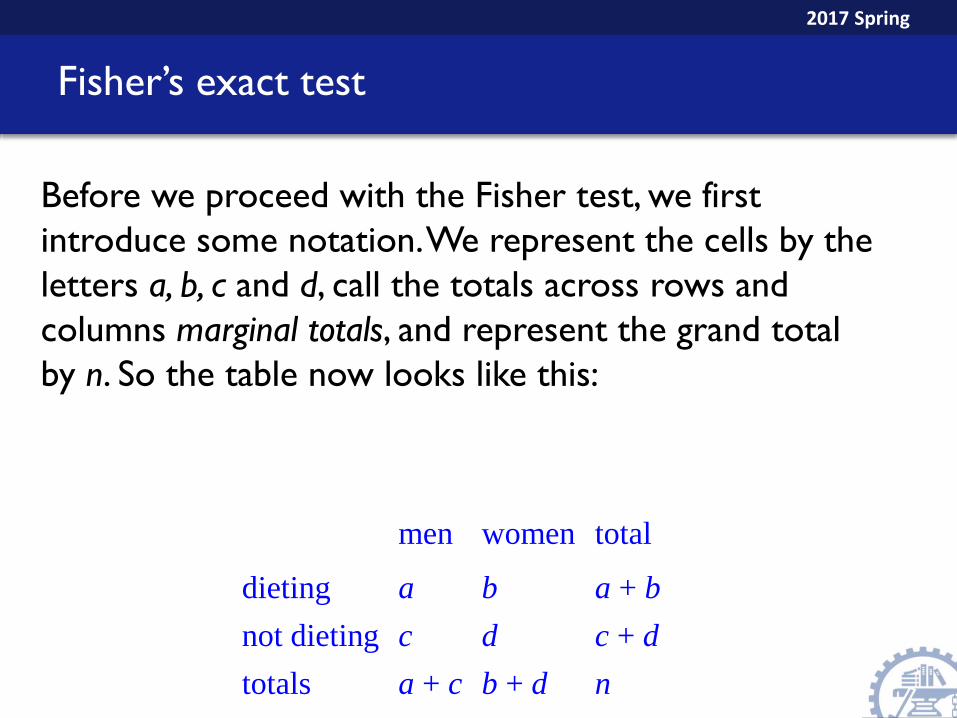
Fisher’s exact test
Before we proceed with the Fisher test, we first
introduce some notation. We represent the cells by the
letters a, b, c and d, call the totals across rows and
columns marginal totals, and represent the grand total
Recall that p-value is the probability of observing data as extreme or more extreme if the null hypothesis is true. So the p-value is this problem is 0.00137.
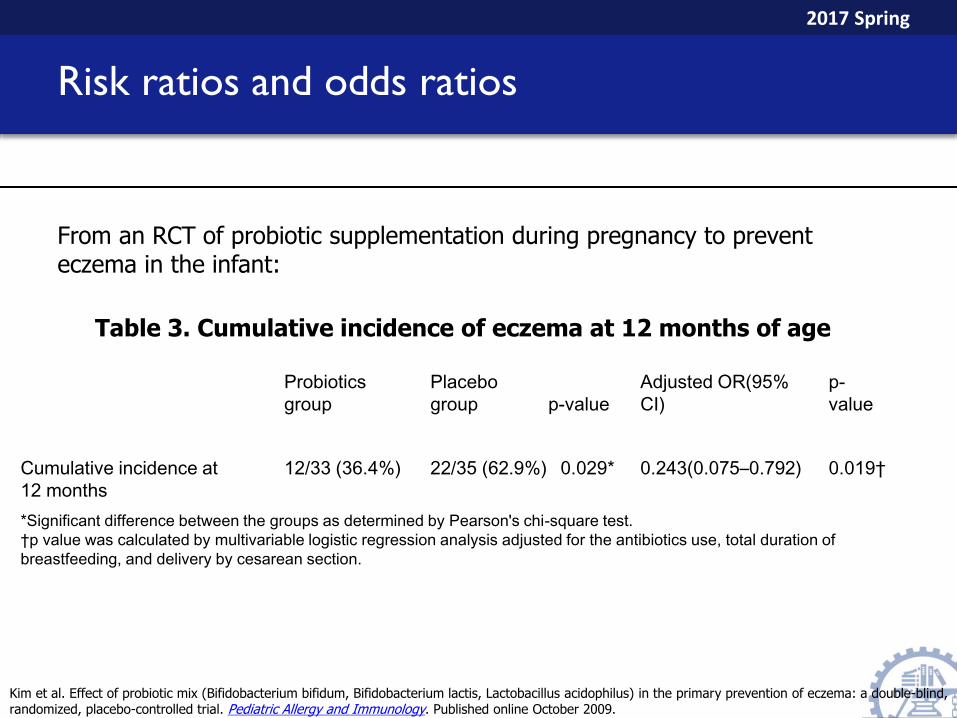
*Significant difference between the groups as determined by Pearson's chi-square test.
†p value was calculated by multivariable logistic regression analysis adjusted for the antibiotics use, total duration of
breastfeeding, and delivery by cesarean section.
Kim et al. Effect of probiotic mix (Bifidobacterium bifidum, Bifidobacterium lactis, Lactobacillus acidophilus) in the primary prevention of eczema: a double-blind, randomized, placebo-controlled trial. Pediatric Allergy and Immunology. Published online October 2009.
Table 3. Cumulative incidence of eczema at 12 months of age
From an RCT of probiotic supplementation during pregnancy to prevent eczema in the infant:
treatment and placebo: 36.4%-62.9%=-26.5% (p=.029,
chi-square test).
• Risk ratio:
• Corresponding odds ratio:
58.0%9.62
%4.36
34.0%)9.621/(%9.62
%)4.361/(%4.36
2017 Spring
Example
• Johnson et al.(NEJM 287: 1122-1125, 1972) selected 85Hodgkin (霍奇金病)’s patients who had a sibling of the same sex who was free of the disease to investigate the correlation between Hodgkin and Tonsillectomy (扁桃体切除). They presented the data as….
Hodgkin’s
Sib control
Tonsillectomy None
41 44
33 52
From John A. Rice, “Mathematical Statistics and Data Analysis.
OR=1.47 ((52/33)/(44/41)); chi-square=1.53 (NS)
2017 Spring
Example
But several letters to the editor pointed out that those investigators had made an error by ignoring
the pairings. These are NOT independentsamples because the sibs are paired.
2017 Spring
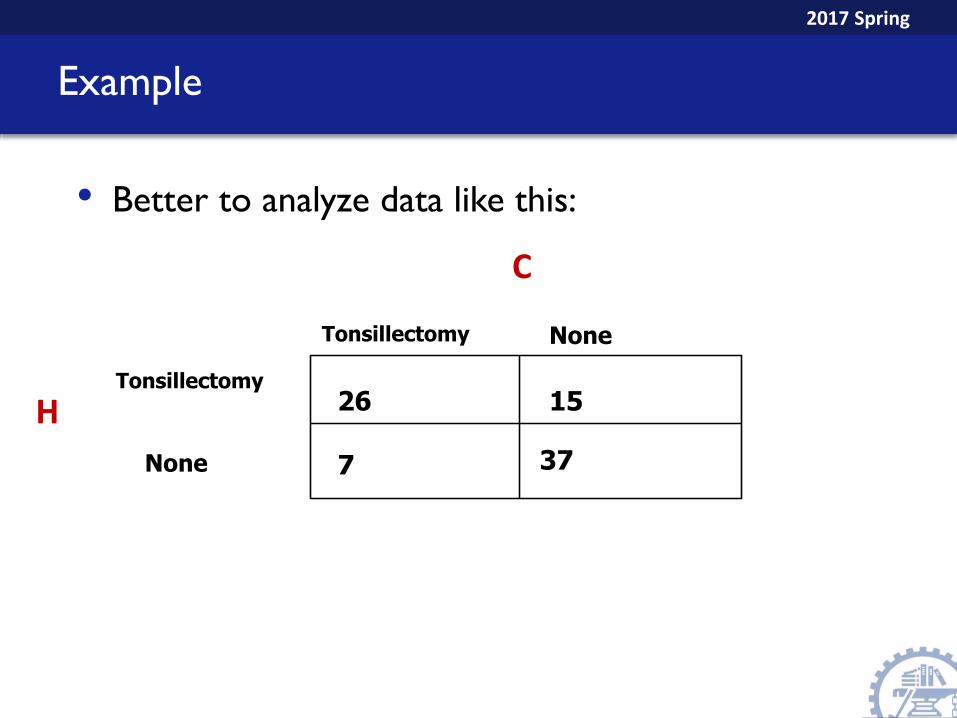
Example
• Better to analyze data like this:
Tonsillectomy
None
Tonsillectomy None
26 15
7 37
H
C
2017 Spring
Example
• Better to analyze data like this:
Tonsillectomy
None
Tonsillectomy None
26 15
7 37
H
C
From John A. Rice, “Mathematical Statistics and Data Analysis.
OR=2.14*; chi-square=2.91 (p=.09)
2017 Spring
Binary or categorical outcomes (proportions)
Outcome Variable
Are the observations correlated? Alternative to the chi-square test if sparse cells:independent correlated
Binary or categorical
(e.g. patency, revision)
Chi-square test:compares proportions between more than two groups
Relative risks: odds ratios
or risk ratios (for 2x2 tables)
Logistic regression:multivariate technique used
when outcome is binary; gives multivariate-adjusted odds ratios
McNemar’s chi-square test:compares binary outcome between correlated groups (e.g., before and after)
Conditional logistic regression: multivariate
regression technique for a binary outcome when groups are correlated (e.g., matched data)
GEE modeling: multivariate
regression technique for a binary outcome when groups are correlated (e.g., repeated measures)
Fisher’s exact test: compares
proportions between independent groups when there are sparse data (some cells <5).
McNemar’s exact test:compares proportions between correlated groups when there are sparse data (some cells <5).
2017 Spring
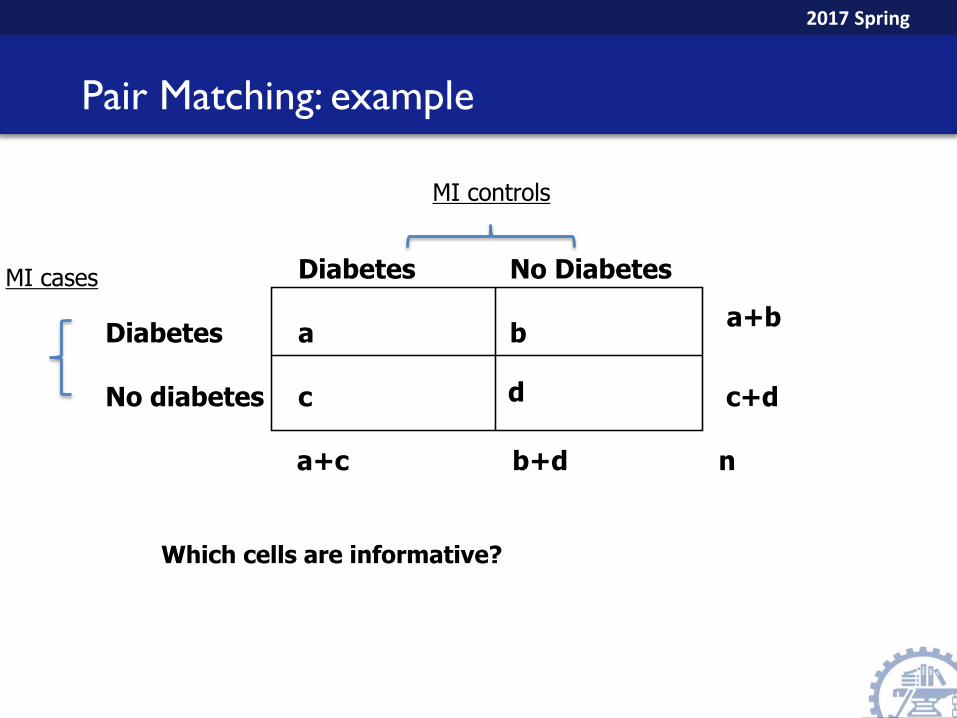
Pair Matching: another example
Match each MI(心肌梗死) case to an MI control based on age and gender.
Ask about history of diabetes to find out if diabetes increases your risk for MI.
2017 Spring
Pair Matching: example
Which cells are informative?
Diabetes
No diabetes
a+c b+d
Diabetes No Diabetes
a b
c d
a+b
c+d
n
MI cases
MI controls
2017 Spring
Pair Matching: example
Which cells are informative?
Diabetes
No diabetes
a+c b+d
Diabetes No Diabetes
a b
c d
a+b
c+d
n
MI cases
MI controls
2017 Spring
Pair Matching: example
Which cells are informative?
Just the discordant cells are informative!
Diabetes
No diabetes
25 119
Diabetes No Diabetes
9 37
16 82
46
98
144
MI cases
MI controls
2017 Spring
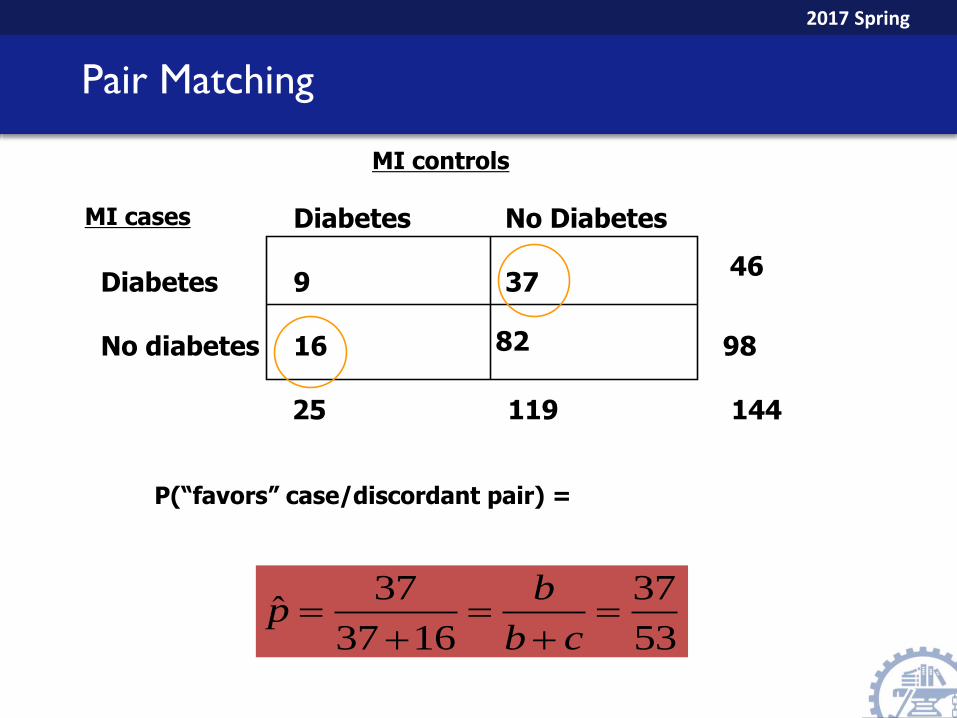
Pair Matching
Diabetes
No diabetes
25 119
Diabetes No Diabetes
9 37
16 82
46
98
144
MI cases
MI controls
OR estimate comes only from discordant pairs!
The question is: among the discordant pairs, what proportion are discordant in the direction of the case vs. the direction of the control.
2017 Spring
P(“favors” case/discordant pair) =
Diabetes
No diabetes
25 119
Diabetes No Diabetes
9 37
16 82
46
98
144
MI cases
MI controls
53
37
1637
37ˆ
cb
bp
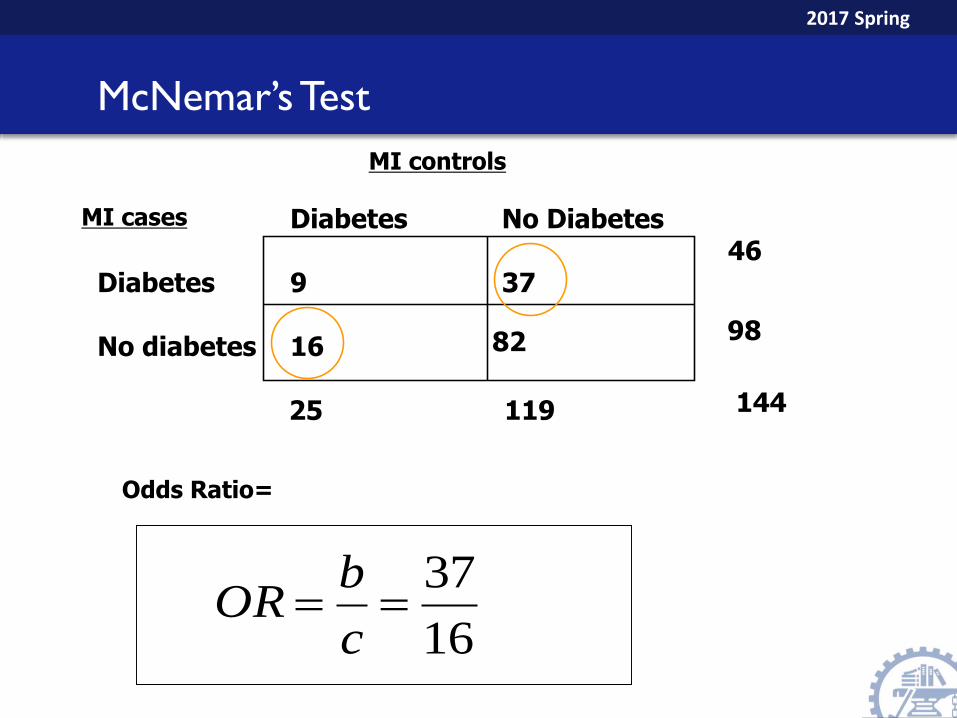
Pair Matching
2017 Spring
Diabetes
No diabetes
25 119
Diabetes No Diabetes
9 37
16 82
46
98
144
MI cases
MI controls
Odds Ratio=
16
37
c
bOR
McNemar’sTest
2017 Spring
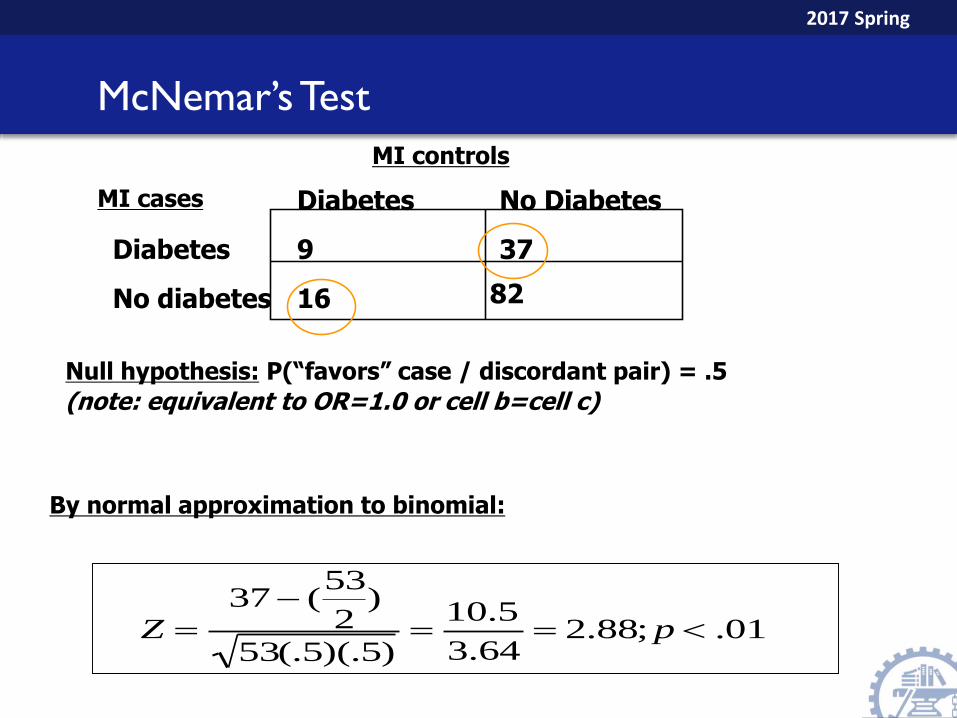
McNemar’sTest
Diabetes
No diabetes
Diabetes No Diabetes
9 37
16 82
MI cases
MI controls
Z 37 (
53
2)
53(.5)(.5)
10.5
3.64 2.88;p .01
Null hypothesis: P(“favors” case / discordant pair) = .5
(note: equivalent to OR=1.0 or cell b=cell c)
By normal approximation to binomial:
2017 Spring
McNemar’s Test: generally
cb
cb
cb
cb
cb
cbb
Z
4
22
)5)(.5)(.(
)2
(
By normal approximation to binomial:
Equivalently:
cb
cb
cb
cb
222
1
)()(
exp
No exp
exp No exp
a b
c d
cases
controls
2017 Spring
Diabetes
No diabetes
Diabetes No Diabetes
9 37
16 82
MI cases
MI controls
McNemar’s Test
01.;88.232.853
21
53
)1637( 222
2
1
p
McNemar’s Test:
2017 Spring
The headmaster of a school is concerned that the maths results are dependent
on the maths teacher. There are 3 teachers and the results for each grade have
been shown below. These are the observed values. Test at the 5% level of
significance to see if the grades are independent of the teacher.
1 2 3 4 5 6 7 Total
Mr. P 2 3 5 4 3 1 0 18
Ms. Q 1 2 5 6 4 1 1 20
Mrs. R 0 1 2 5 5 1 2 16
Total 3 6 12 15 12 3 3 54
Practice
2017 SpringPractice
A matched case-control study to investigate the association between use of oral contraceptives and thromboembolism. Try to calculate the OR and test the association(p<0.05).