Page 1
CHARACTER ASSOCIATION AND GENETIC DIVERSITY
ANALYSIS OF MAIZE (Zea mays L.) VARIETIES IN
BANGLADESH
MD. NAZMUL HUDA
DEPARTMENT OF GENETICS AND PLANT BREEDING
SHER-E-BANGLA AGRICULTURAL UNIVERSITY,
DHAKA-1207
JUNE, 2015
Page 2
CHARACTER ASSOCIATION AND GENETIC DIVERSITY
ANALYSIS OF MAIZE (Zea mays L.) VARIETIES IN
BANGLADESH
By
MD. NAZMUL HUDA
REGISTRATION NO.:- 09-03450
A Thesis
Submitted to the Faculty of Agriculture,
Sher-e-Bangla Agricultural University, Dhaka,
In partial fulfillment of the requirements for the degree of
MASTER OF SCIENCE
IN
GENETICS AND PLANT BREEDING
SEMESTER: Jan- June, 2015
Approved by
……………………………………….
(Dr. Md. Ashaduzzaman Siddikee)
Associate Professor
Supervisor
………………………………
(Dr. Firoz Mahmud)
Professor
Co-supervisor
……………………………………
(Prof. Dr. Md. Sarowar Hossain)
Chairman
Examination Committee
Page 3
………………………………………
(Dr. Md. Ashaduzzaman Siddikee) Supervisor
Dr. Md. Ashaduzzaman Siddikee Associate Professor
Department of Genetics and Plant Breeding Sher-e-Bangla Agricultural University
Dhaka-1207, Bangladesh Phone: +880 29180921, extn. 238
Mob: +8801986584723, fax: +08802 8155800 E-mail: [email protected]
CERTIFICATE
This is to certify that thesis entitled, “CHARACTER ASSOCIATION AND
GENETIC DIVERSITY ANALYSIS OF MAIZE (Zea mays L.) VARIETIES
IN BANGLADESH” submitted to the Faculty of Agriculture, Sher-e-Bangla
Agricultural University, Dhaka, in partial fulfillment of the requirements for the
degree of MASTER OF SCIENCE in GENETICS AND PLANT BREEDING,
embodies the result of a piece of bona fide research work carried out by Md. Nazmul
Huda, Registration No: 09-03450 under my supervision and guidance. No part of
the thesis has been submitted for any other degree or diploma.
I further certify that such help or source of information, as has been availed
of during the course of this investigation has duly been acknowledged.
Dated: June, 2015
Place: Dhaka, Bangladesh
Page 4
DEDICATED TO
MY
BELOVED PARENTS
Page 5
i
Some commonly used abbreviations
Full word Abbreviation Full word Abbreviation
Percent % Etcetera etc.
Degree Celsius ⁰C Edition ed.
Abstract Abst. Food and Agricultural
Organization
FAO
At the rate @ Gram g
Agro-Ecological Zone AEZ Genotype G Agriculture Agric. Genetic advance GA
Agricultural Agril. Genetics Genet.
Agronomy Agron. General combining ability GCA
Analysis of variance ANOVA Hectare ha
Annals Ann. International Intl.
Applied Appl. Journal J.
Archives Arch. Least significant difference LSD
Bangladesh Agricultural
Research Institute
BARI kilogram kg
Bangladesh Bureau of
Statistics
BBS Meter m
Biology Bio. Muriate of potash MP
Biological Boil. Ministry of agriculture MOA
Biological science Biosci. Pharmaceutical Pharm
. Biotechnology Biot. Principal component
analysis
PCA
Botany Bot. Principal coordinate
analysis
PCO
Breeding Breed. Randomized Complete
Block Design
RCBD
Centimeter cm Research Res.
Cytology Cyt. Sher-e-Bangla Agricultural
University
SAU
Canonical variate analysis CVA Science Sci.
Degrees of freedom df Specific combining ability SCA
Ecology Ecol. Squre meter m2
And others et al.
Page 6
ii
ACKNOWLEDGEMENT
First of all, I would like to bow my heartfelt gratitude and praise to the Almighty
ALLAH, the most beneficent and merciful who granted me to complete the
dissertation work successfully.
I sincerely express my deepest sense of gratitude, respect, profound appreciation to
my research supervisor Dr. Md. Ashaduzzaman Siddikee, Associate Professor,
Department of Genetics and Plant Breeding, Sher-e-Bangla Agricultural
University, Dhaka for his kind and scholastic guidance, untiring effort, valuable
suggestions, inspiration, co-operation and constructive criticisms through the entire
period of the research work and the preparation of the manuscript of this thesis.
I would like to express my deepest respect and boundless gratitude to my co-
supervisor Dr. Firoz Mahmud, Professor, Department of Genetics and Plant
Breeding, Sher-e-Bangla Agricultural University, Dhaka for his valuable teaching,
direct continuous direction, constructive criticism, encouragement and valuable
suggestions in carrying out the research work and preparation of this thesis.
I am also highly grateful to my honorable teacher Prof. Dr. Md. Sarowar Hossain,
Chairman, Department of Genetics and Plant Breeding, Sher-e-Bangla Agricultural
University, for his valuable teaching, direct and indirect advice and encouragement
and cooperation during the whole study period.
I am also highly grateful to my honorable teachers Prof. Dr. Md. Shahidur Rashid
Bhuiyan, Prof. Dr. Naheed Zeba, Prof. Dr. Mohmmad Saiful Islam, Prof. Dr.
Jamilur Rahman, Associate Prof. Dr. Md. Abdur Rahim and all the teachers of
Department of Genetics and Plant Breeding, Sher-e-Bangla Agricultural University
for their valuable teaching, direct and indirect advice and encouragement and
cooperation during the whole study period.
Page 7
iii
I feel proud of expressing my sincere appreciation and gratitude to Minister of
Science and Technology of People’s Republic of Bangladesh for selecting me
National Science and Technology (NST) fellow and funding.
I would like to thank all my friends and well aishers who always inspired me
during my research specially Md. Nazmul Huda, Arif Hossain, Md. Mehedi hassan,
Md Anisur Rahman, Farhana Parvin, Khondakar Sadia Siddika, Tanjina Arfin and
elder brother Md. Delowar Hossain who helped me with their valuable suggestions
and directions during the preparation of this thesis paper.
I can never repay the debt of my beloved Father Md. Golam Mostafa, Mother
Ferdowshi Begum, uncle, brothers, cousins and well wishers for their inspiration,
constant encouragement and sacrifice for my higher education
Finally, I expresses my immense gratefulness to all of them who assisted and
inspired me to achieve higher education and regret for my inability for not to
mention every one by name.
June, 2015. The Author
Page 8
iv
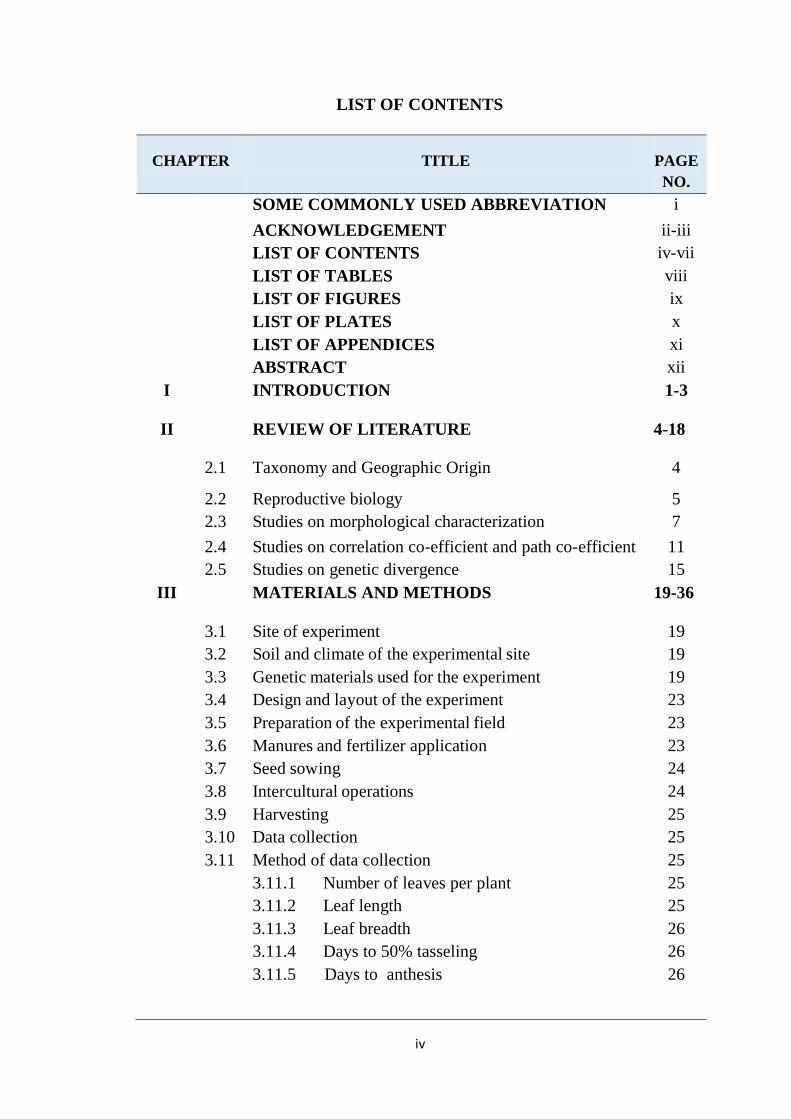
LIST OF CONTENTS
CHAPTER TITLE PAGE
NO.
SOME COMMONLY USED ABBREVIATION i
ACKNOWLEDGEMENT ii-iii
LIST OF CONTENTS iv-vii
LIST OF TABLES viii
LIST OF FIGURES ix
LIST OF PLATES x
LIST OF APPENDICES xi
ABSTRACT xii
I
INTRODUCTION 1-3
II
REVIEW OF LITERATURE 4-18
2.1 Taxonomy and Geographic Origin 4
2.2 Reproductive biology 5
2.3 Studies on morphological characterization 7
2.4 Studies on correlation co-efficient and path co-efficient 11
2.5 Studies on genetic divergence 15
III
MATERIALS AND METHODS 19-36
3.1 Site of experiment 19
3.2 Soil and climate of the experimental site 19
3.3 Genetic materials used for the experiment 19
3.4 Design and layout of the experiment 23
3.5 Preparation of the experimental field 23
3.6 Manures and fertilizer application 23
3.7 Seed sowing 24
3.8 Intercultural operations 24
3.9 Harvesting 25
3.10 Data collection 25
3.11 Method of data collection 25
3.11.1 Number of leaves per plant 25
3.11.2 Leaf length 25
3.11.3 Leaf breadth 26
3.11.4 Days to 50% tasseling 26
3.11.5 Days to anthesis 26
Page 9
v
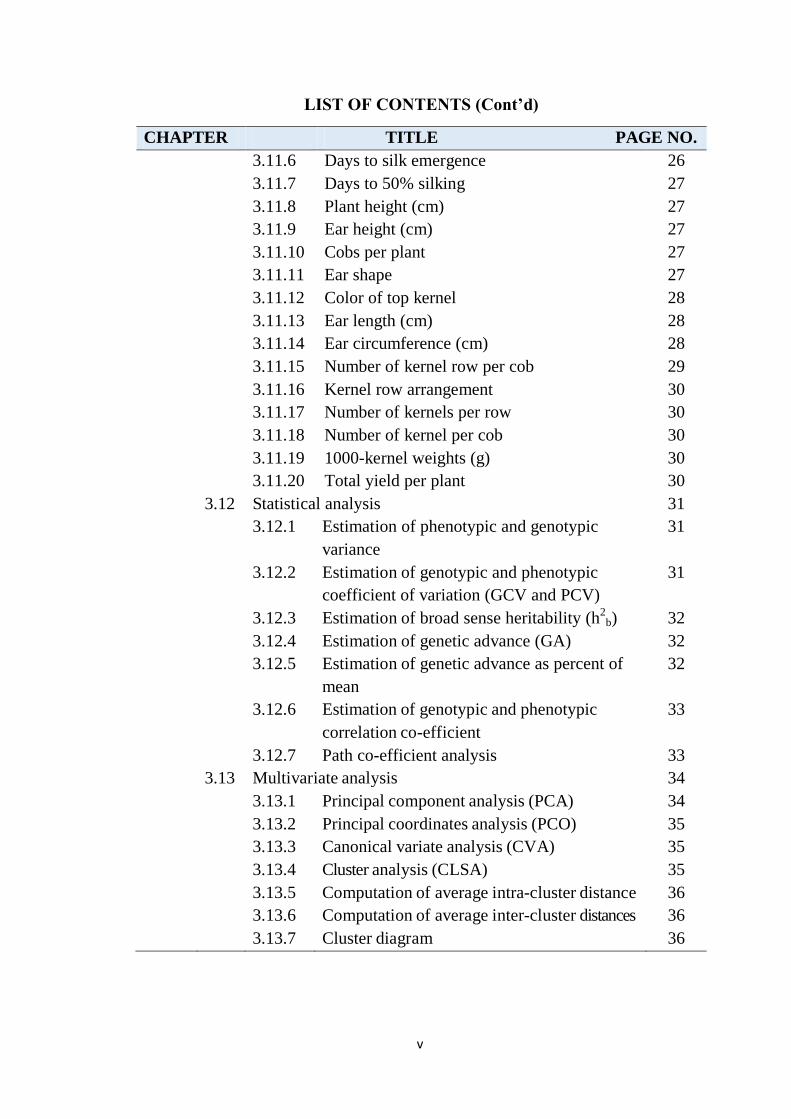
LIST OF CONTENTS (Cont’d)
CHAPTER TITLE PAGE NO.
3.11.6 Days to silk emergence 26
3.11.7 Days to 50% silking 27
3.11.8 Plant height (cm) 27
3.11.9 Ear height (cm) 27
3.11.10 Cobs per plant 27
3.11.11 Ear shape 27
3.11.12 Color of top kernel 28
3.11.13 Ear length (cm) 28
3.11.14 Ear circumference (cm) 28
3.11.15 Number of kernel row per cob 29
3.11.16 Kernel row arrangement 30
3.11.17 Number of kernels per row 30
3.11.18 Number of kernel per cob 30
3.11.19 1000-kernel weights (g) 30
3.11.20 Total yield per plant 30
3.12 Statistical analysis 31
3.12.1 Estimation of phenotypic and genotypic
variance
31
3.12.2 Estimation of genotypic and phenotypic
coefficient of variation (GCV and PCV)
31
3.12.3 Estimation of broad sense heritability (h2
b) 32
3.12.4 Estimation of genetic advance (GA) 32
3.12.5 Estimation of genetic advance as percent of
mean
32
3.12.6 Estimation of genotypic and phenotypic
correlation co-efficient
33
3.12.7 Path co-efficient analysis 33
3.13 Multivariate analysis 34
3.13.1 Principal component analysis (PCA) 34
3.13.2 Principal coordinates analysis (PCO) 35
3.13.3 Canonical variate analysis (CVA) 35
3.13.4 Cluster analysis (CLSA) 35
3.13.5 Computation of average intra-cluster distance 36
3.13.6 Computation of average inter-cluster distances 36
3.13.7 Cluster diagram 36
Page 10
vi
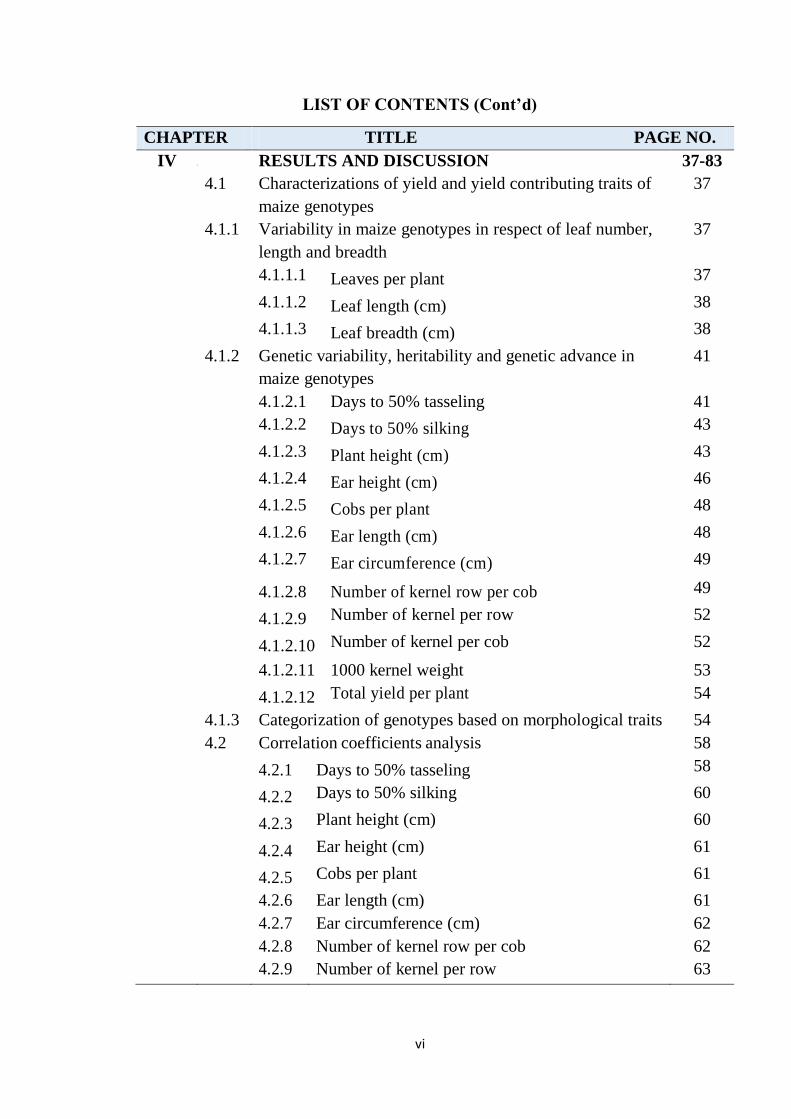
LIST OF CONTENTS (Cont’d)
CHAPTER TITLE PAGE NO.
IV 3. RESULTS AND DISCUSSION 37-83
4.1 Characterizations of yield and yield contributing traits of
maize genotypes
37
4.1.1 Variability in maize genotypes in respect of leaf number,
length and breadth
37
4.1.1.1 Leaves per plant 37
4.1.1.2 Leaf length (cm) 38
4.1.1.3 Leaf breadth (cm) 38
4.1.2 Genetic variability, heritability and genetic advance in
maize genotypes
41
4.1.2.1 Days to 50% tasseling 41
4.1.2.2 Days to 50% silking 43
4.1.2.3 Plant height (cm) 43
4.1.2.4 Ear height (cm) 46
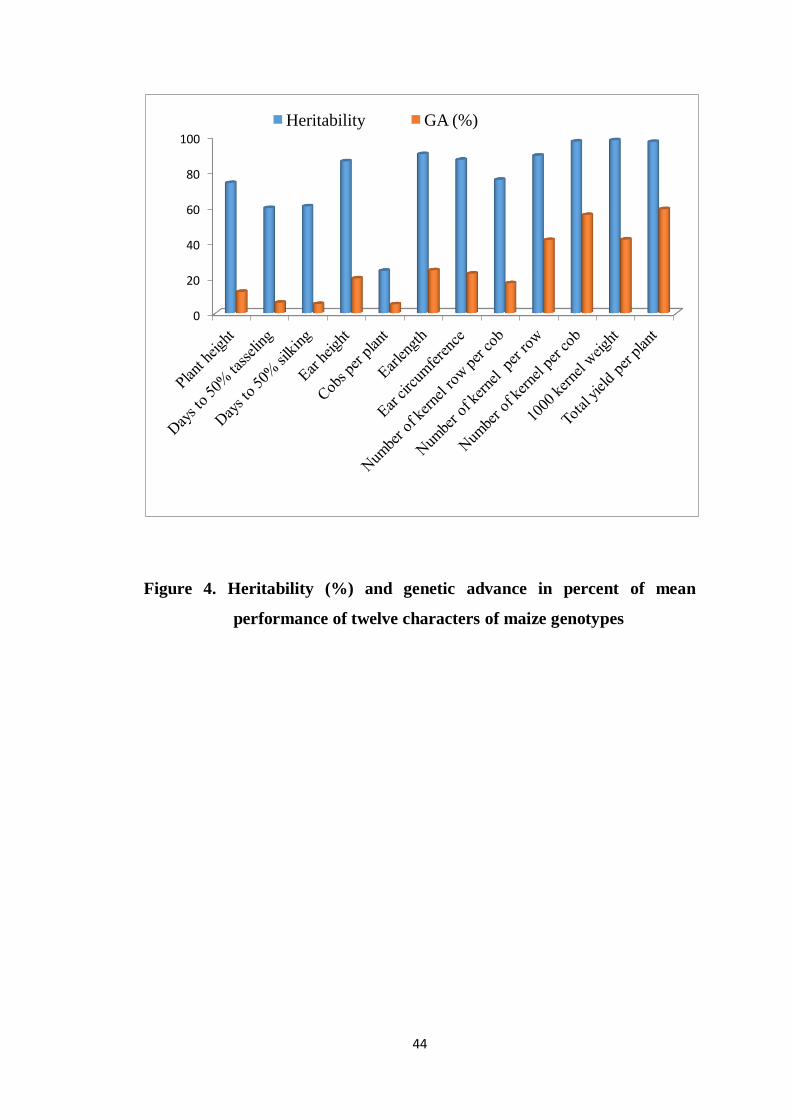
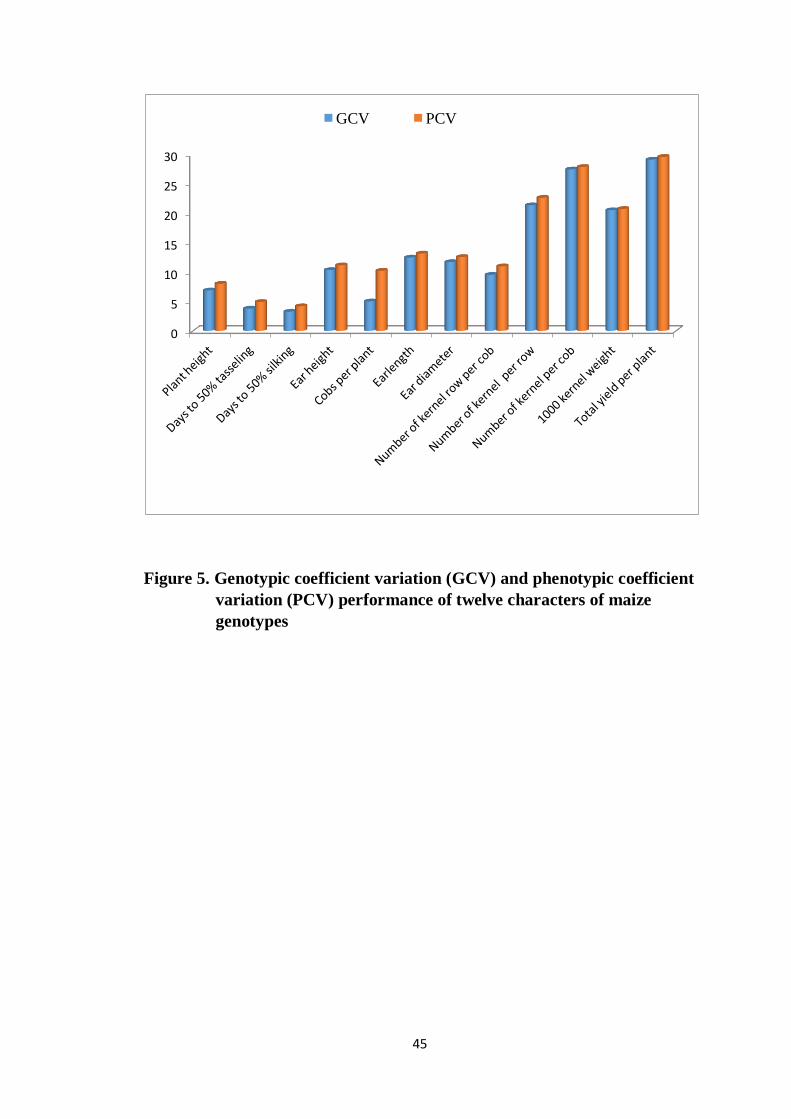
4.1.2.5 Cobs per plant 48
4.1.2.6 Ear length (cm) 48
4.1.2.7 Ear circumference (cm) 49
4.1.2.8 Number of kernel row per cob 49
4.1.2.9 Number of kernel per row 52
4.1.2.10 Number of kernel per cob 52
4.1.2.11 1000 kernel weight 53
4.1.2.12 Total yield per plant 54
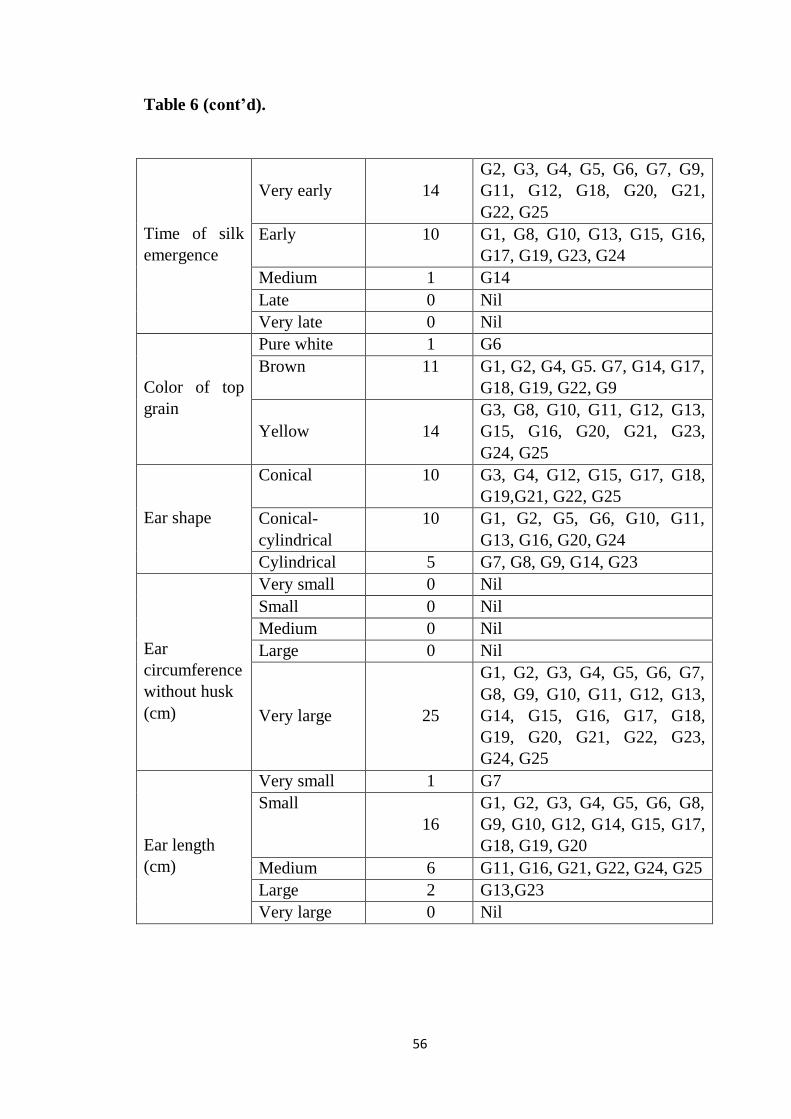
4.1.3 Categorization of genotypes based on morphological traits 54
4.2 Correlation coefficients analysis 58
4.2.1 Days to 50% tasseling 58
4.2.2 Days to 50% silking 60
4.2.3 Plant height (cm) 60
4.2.4 Ear height (cm) 61
4.2.5 Cobs per plant 61
4.2.6 Ear length (cm) 61
4.2.7 Ear circumference (cm) 62
4.2.8 Number of kernel row per cob 62
4.2.9 Number of kernel per row 63
Page 11
vii
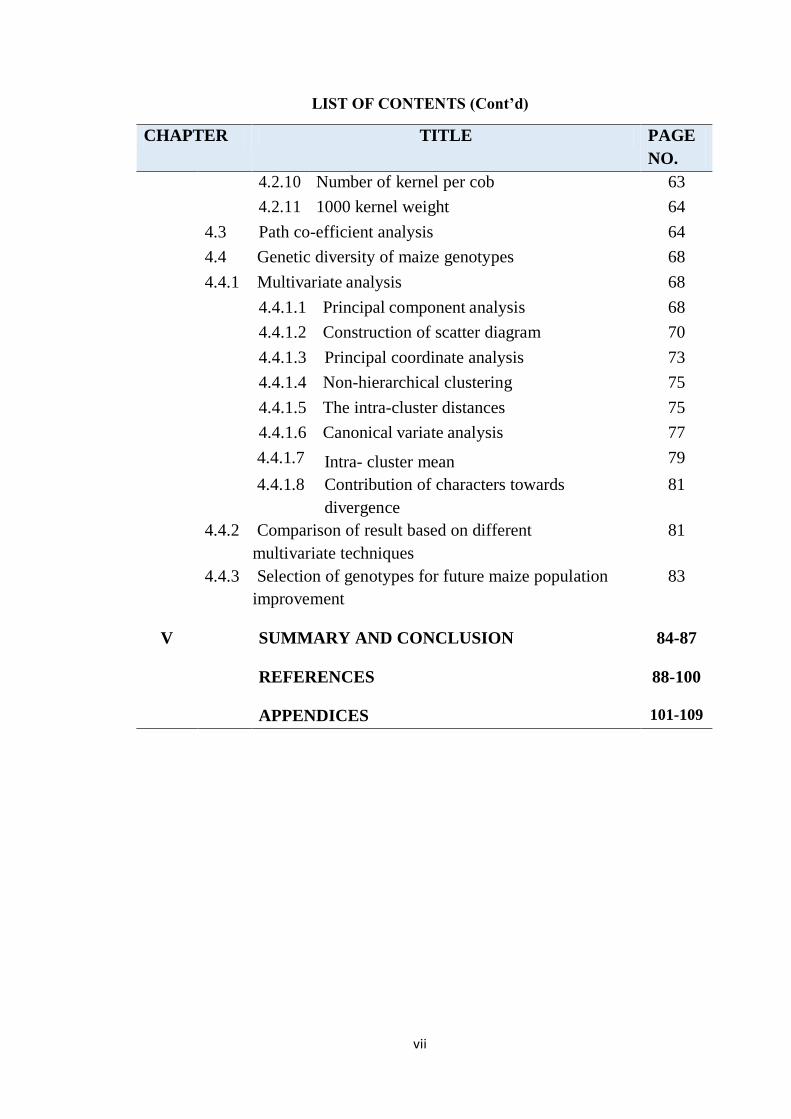
LIST OF CONTENTS (Cont’d)
CHAPTER TITLE PAGE
NO.
4.2.10 Number of kernel per cob 63
4.2.11 1000 kernel weight 64
4.3 Path co-efficient analysis 64
4.4 Genetic diversity of maize genotypes 68
4.4.1 Multivariate analysis 68
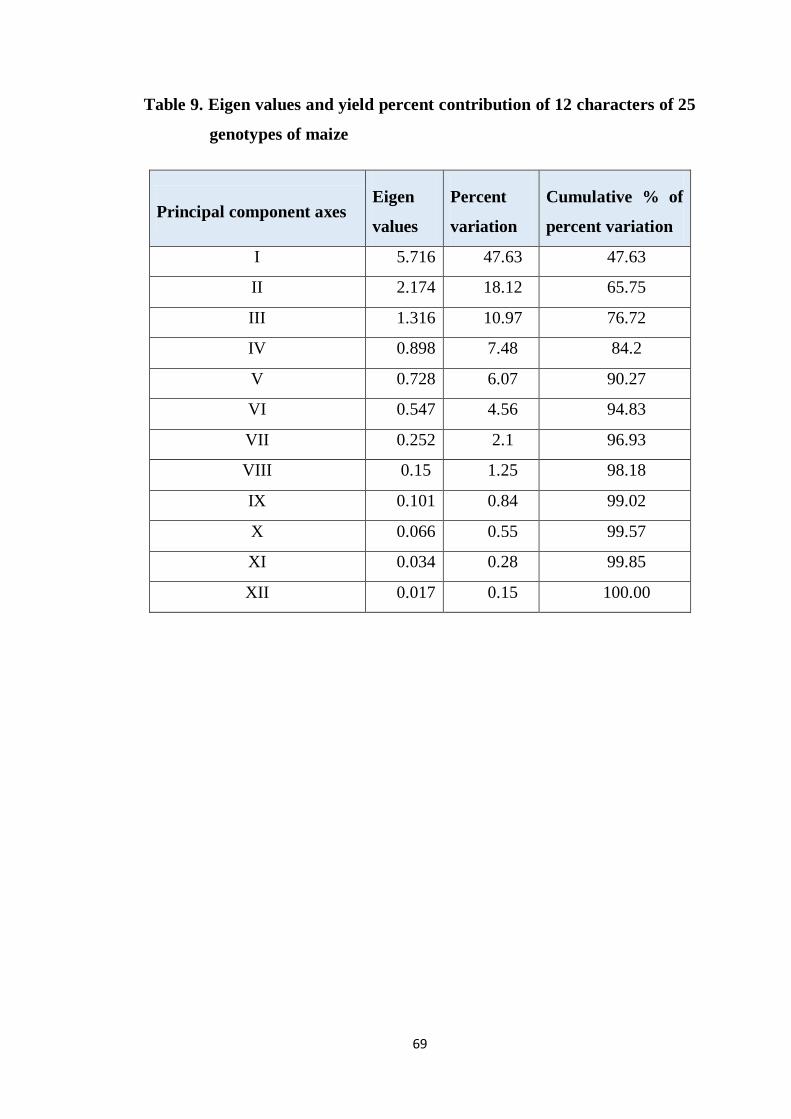
4.4.1.1 Principal component analysis 68
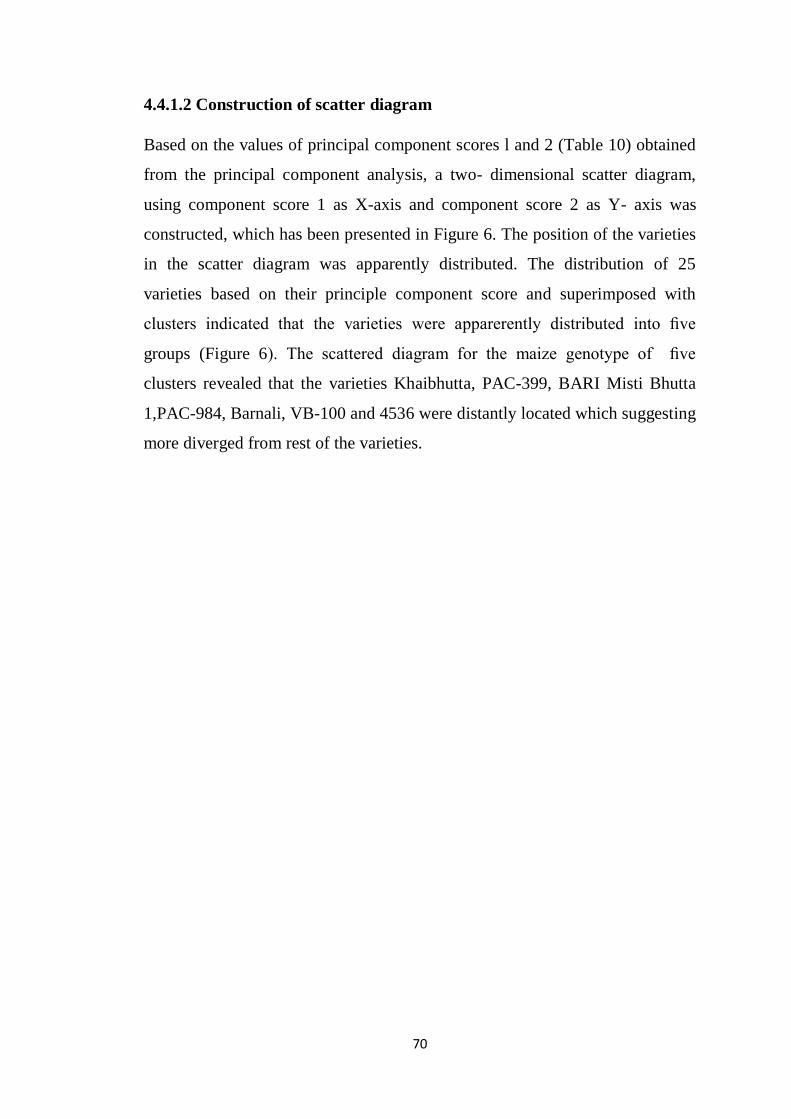
4.4.1.2 Construction of scatter diagram 70
4.4.1.3 Principal coordinate analysis 73
4.4.1.4 Non-hierarchical clustering 75
4.4.1.5 The intra-cluster distances 75
4.4.1.6 Canonical variate analysis 77
4.4.1.7 Intra- cluster mean 79
4.4.1.8 Contribution of characters towards
divergence
81
4.4.2 Comparison of result based on different
multivariate techniques
81
4.4.3 Selection of genotypes for future maize population
improvement
83
V SUMMARY AND CONCLUSION 84-87
REFERENCES 88-100
APPENDICES 101-109
Page 12
viii
LIST OF TABLES
TABLE
NO.
TITLE PAGE
NO.
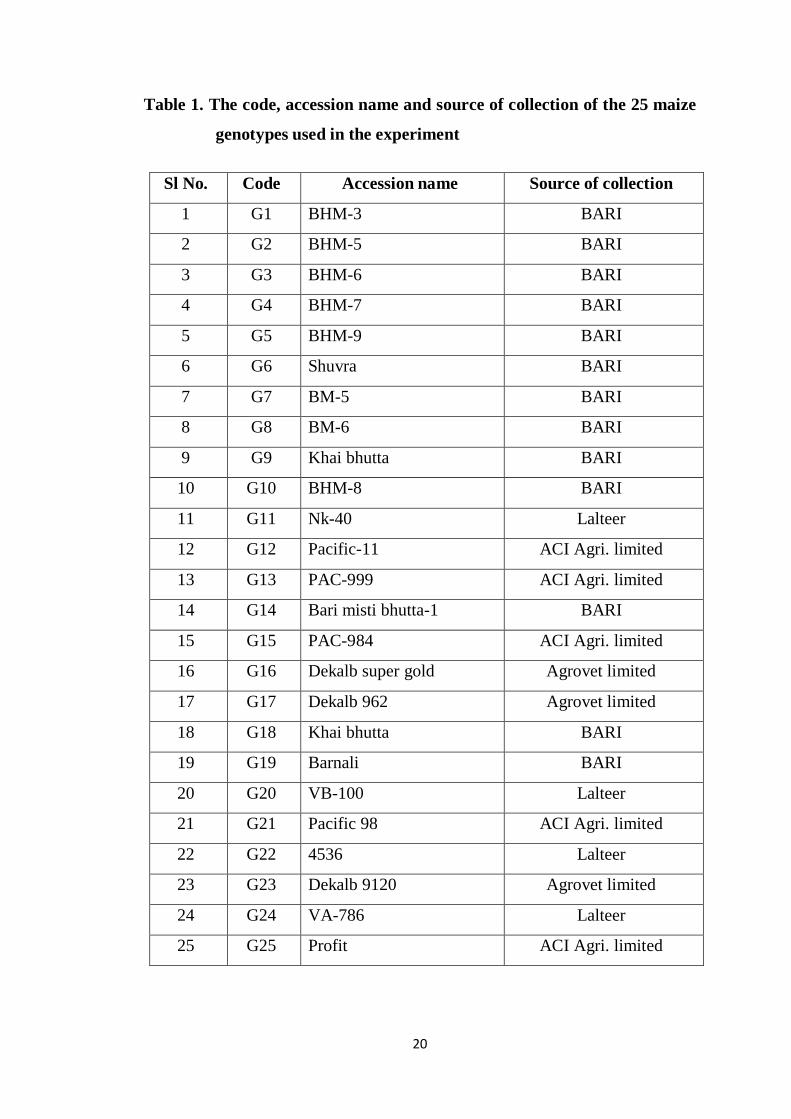
1 The code, accession name and source of collection of the 25
genotypes of maize used in the experiment
20
2 Doses of different fertilizers and manures applied in the
experimental field
24
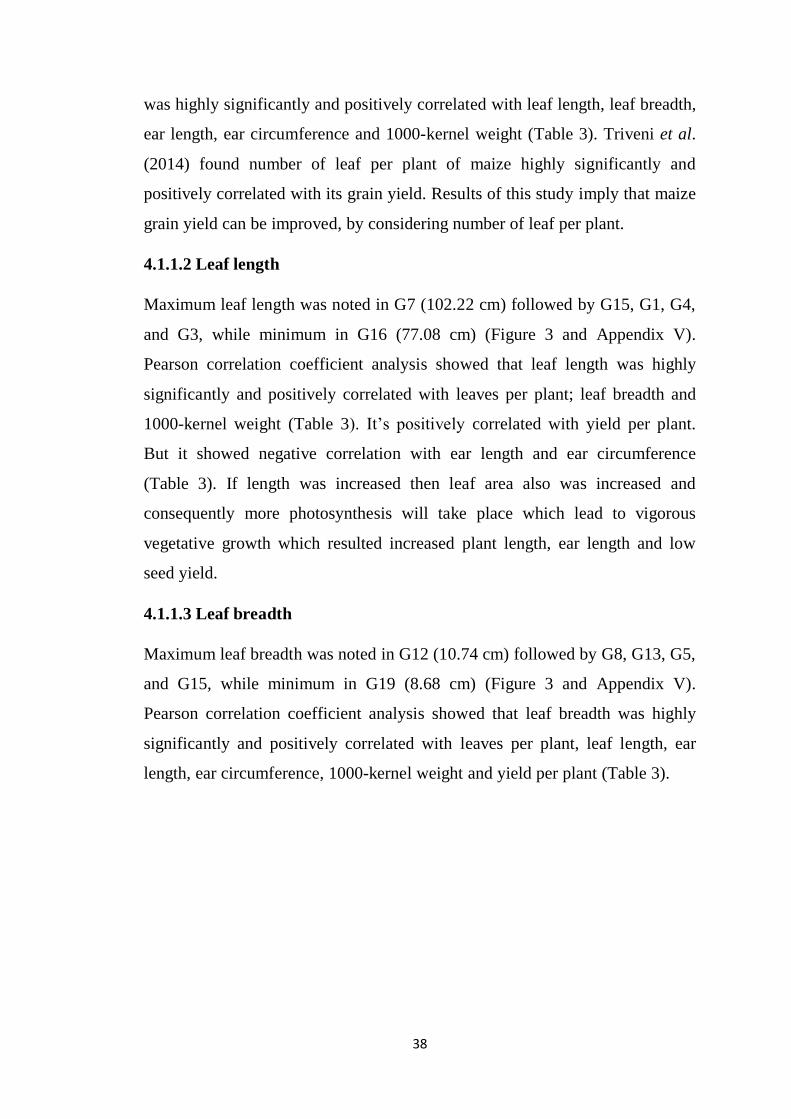
3 Pearson correlation coefficient between yield and yield
contributing characters for different genotypes of maize
40
4 Mean sum of square from the ANOVA of 25 maize
genotypes in respect of 12 characters
42
5 Variability, genetic parameter, heritability (h2
b), genetic
advance (GA) and GA in percent of mean for 12 yield and its
related characters in maize
47
6 Frequency distribution of genotypes belonging to different
phenotypic classes
55-57
7 Genotypic (rg) and phenotypic (rp) correlation coefficients
among different pairs of yield and yield contributing
characters for different genotypes of maize
59
8 Path coefficient analysis showing direct and indirect effects
of different characters on yield of maize
66
9 Eigen values and percent contribution on yield of 12
characters of 25 genotypes of maize
69
10 Principal component scores of 25 genotype 72
11 Ten of each lower and higher inter genotypic distances (D2)
between pairs of maize varieties
74
12 Distribution of 25 maize genotypes into five different
clusters
76
13 Average inter cluster distance (D2) and intra-cluster distance
(bold) of 25 varieties of maize
76
14 Cluster mean values of 12 different characters of 25 maize
genotypes
80
15 Relative contributions of the ten characters of 25 maize
varieties to the total divergence
82
Page 13
ix
LIST OF FIGURES
FIGURE
NO.
TITLE PAGE
NO.
1 Descriptors of the ear 29
2 Kernel row arrangement 29
3 Performance of different maize genotype in respect of leaf
length and leaf breadth
40
4 Heritability (%) and genetic advance in percent of mean
performance of twelve characters of maize genotypes
44
5 Genotypic coefficient variation (GCV) and phenotypic
coefficient variation (PCV) performance of twelve
characters of maize genotypes
45
6 Scatter distribution of 25 maize varieties based on their
principal component scores superimposed with clusters
71
7 Diagram showing intra and inter cluster distances of
twenty five maize varieties
78
Page 14
x
LIST OF PLATES
PLATES
NO.
TITLE PAGE
NO.
1 Photograph showing differences of line of 25 maize
genotypes in the experimental plot
21-22
2 Photograph showing differences of leaves of 25 maize
genotypes
39
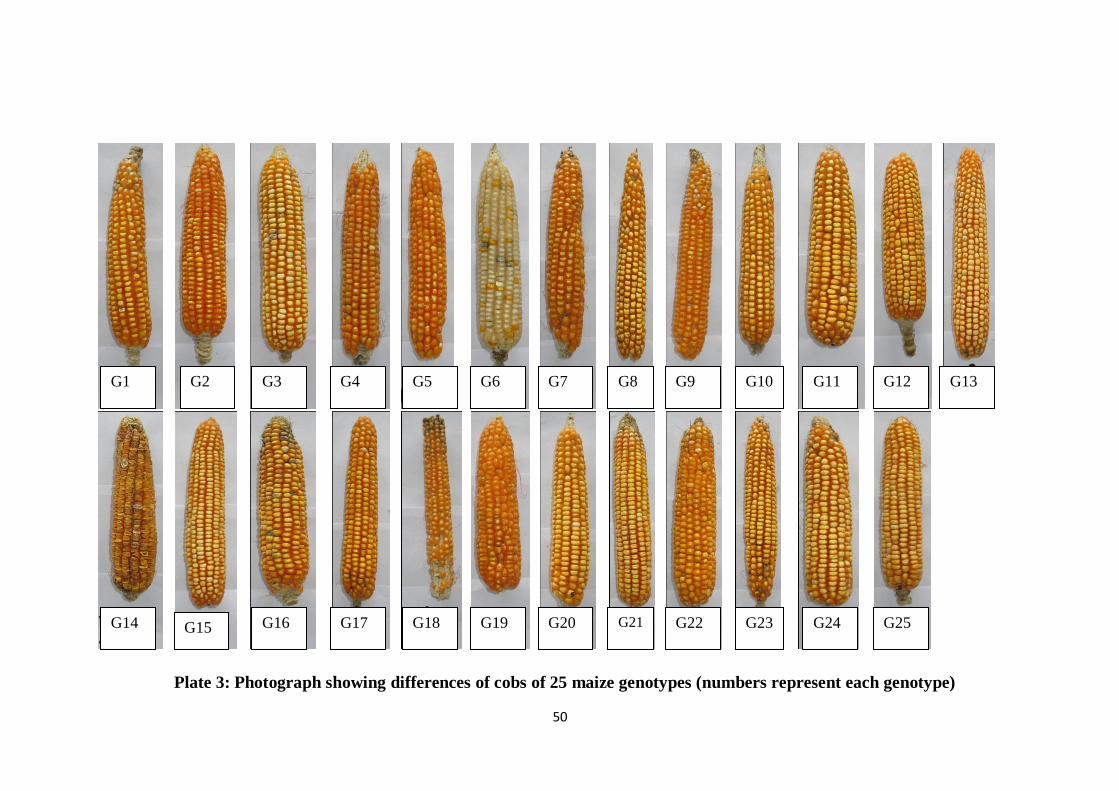
3 Photograph showing differences of cobs of 25 maize
genotypes (numbers represent each genotype)
50
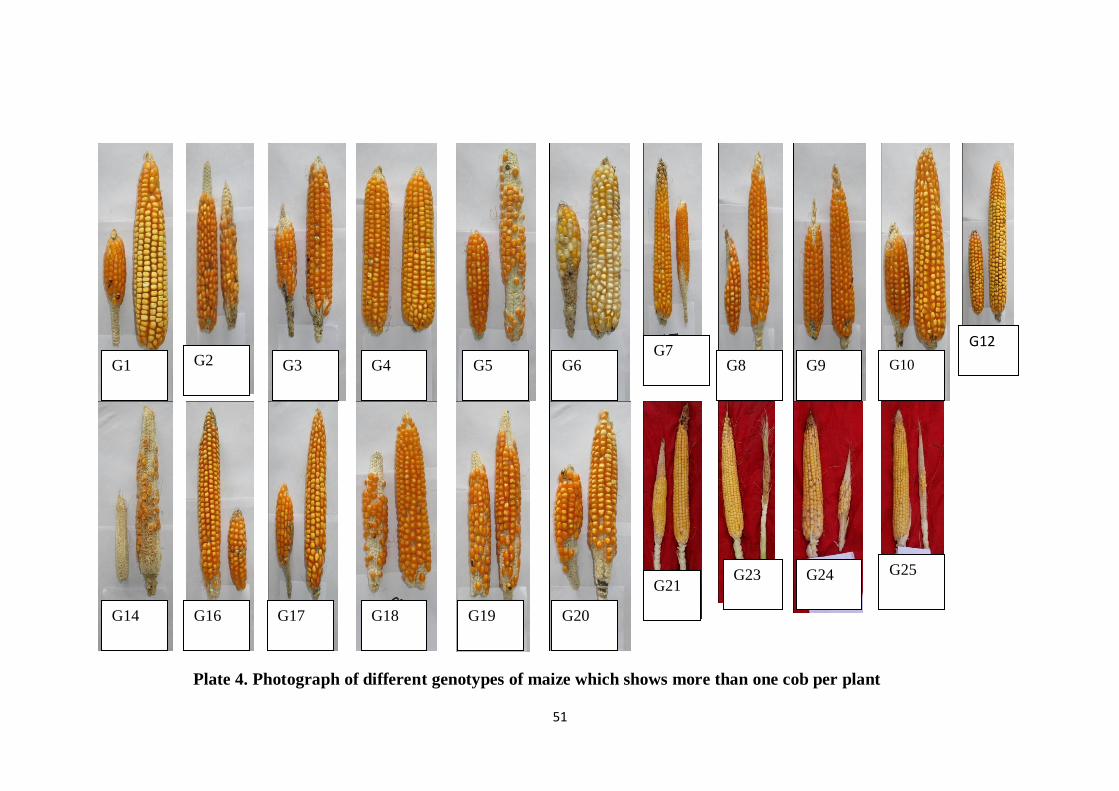
4 Photograph of different genotypes of maize which
shows more than one cob per plant
51
Page 15
xi
LIST OF APPENDICES
APPENDIX TITLE PAGE
NO.
I Map showing the experimental site 102
II Monthly average temperature, relative humidity and
total rainfall of the experimental site during the
period from June, 2014 to January, 2015
103
III Soil test result of the experimental filed reported by
Soil Resources Development Institute (SRDI),
Khamarbari, Farmgate, Dhaka
103
IV Descriptors with codes for qualitative characteristics 104-105
V Mean performance of characters of 25 genotypes of
maize
106
VI Mean performance of characters of 25 genotypes of
maize
107-108
VII Photograph showing field view of experimental plot
in different dimension
109-110
Page 16
xii
CHARACTER ASSOCIATION AND GENETIC DIVERSITY
ANALYSIS OF MAIZE (Zea mays L.) VARIETIES IN
BANGLADESH
ABSTRACT
An experiment was carried out at the experimental field of Sher-e-Bangla
Agricultural University, Dhaka-1207, Banladesh during the period of Kharif-1
season in 2014 with 25 maize genotypes to study on character association,
genotypic and phenotypic variance, heritability, genetic advance, genotypic and
phenotypic co-efficient of variation, correlation co-efficient effect, path co-
efficient effect and the genetic divergence considering different important yield
and yield contributing characters. Analysis of variance showed the presence of
significant variation among the tested genotypes for all the characters studied.
Minimum differences of genotypic and phenotypic variances as well as high
heritability coupled with high genetic advance in percent of mean were
observed for almost all the traits of genotypes indicated additive gene effects of
these traits. Correlation studies revealed highly significant positive association
of total yield per plant with ear length, ear circumference, number of kernel
row per cob, number of kernel per row, number of kernel per cob and 1000
kernel weight. Path analysis showed that day to 50% tasseling, ear length, ear
circumference, number of kernel per cob and 1000 kernel weight had positive
direct effect on the yield per plant. The genotypes were grouped into five
different clusters. Cluster IV consist of highest 10 genotypes and cluster II had
only two genotypes. The highest intra- cluster distance was computed for
cluster II. The maximum inter cluster divergence was observed between cluster
II and III and the lowest was between cluster I and IV. Considering diversity
pattern and genetic status Barnali and VB-100 from cluster II; PAC-399 and
4536 from cluster III; BHM-9, Dekalb Super Gold, Dekalb 962 and Dekalb
9120 from cluster IV might be considered better parents for future
hybridization programme.
Page 18
CHAPTER I
INTRODUCTION
Maize belongs to the tribe Maydeae of the grass family Poaceae. The genus
Zea consists of four species of which Zea mays L. is economically important.
The term “Zea” (zela) was derived from an old Greek name for a food grass.
The number of chromosomes in Zea mays is 2n= 20. Maize is a tall,
determinate annual C4 plant varying in height from 1 to 4 meters producing
large, narrow, opposing leaves (about a tenth as wide as they are long),
alternately along the length of a solid stem. The center of origin for Zea mays
has been established as the Mesoamerican region, i.e. Mexico and Central
America (Matsuoka et al., 2002). Maize is a cross pollinated crops particularly
geitonogamy. Therefore, pollination mechanism is major constraint for hybrid
development.
Maize is a versatile crop grown over a range of agro climatic zones. In fact, the
suitability of maize to diverse environments is unmatched by any other crop. It
is grown from 58º N to 40
º S, from below sea level to altitudes higher than 3000
m, and in areas with 250 mm to more than 5000 mm of rainfall per year (Shaw,
1988; Dowswell et. al., 1996) and with a growing cycle ranging from 3 to 13
months (CIMMYT, 2000). However the major maize production areas are
located in temperate regions of the globe. The United States, China, Brazil and
Mexico account for 70% of global production. India has 5% of corn acreage
and contributes 2% of world production. Like as India, climate condition of
Bangladesh favors maize cultivation. Maize acreage and production have an
increasing tendency with the introduction of hybrid since 1993 in Bangladesh.
Area, production, and yield of maize have increased by 17%, 33% and 16%,
respectively, which reflect the effect of adopting improved technology
(Saleque, 2005). In Bangladesh it is the third most important crop after rice and
wheat and it accounts for 4.8% of the total cropped land area and 3.5% of the
value of agricultural output (Ahmad et al., 2011). Since the early 1990s, the
Page 19
2
Bangladesh maize area has increased at an average rate of 20% per year to
reach 338973 ha with production 812949 million ton in 2009-10 (BBS, 2011
and CIMMYT, 2008). Moreover, population of Bangladesh is growing very
fast and this situation necessitated producing more food. In addition, the
country is losing about 200 hectares of cropland everyday owing to
industrialization, urbanization and river erosion. Therefore to face this
challenge, cultivation of high productive crop like maize, breeding is
necessary. Besides higher demand of maize grains in poultry industry has
opened up an ample opportunity to cultivate hybrid maize throughout the
whole country. Maize is an important feed for all classes of livestock and is
widely used all over the world.
Today, the variability of the agricultural crops has been massively lost as a
result of the commercial varieties use. For example, only about 5% of maize
germplasm is used for commercial purposes (Hoisington et al., 1999).
Preservation of the genetic resources in the country is associated with rigorous
characterization and evaluation of the genetic diversity (Salillari et al., 2007).
However, due to the continuous regeneration and the limited number of the
individuals for accessions as well as genetic erosion, the collection is damaged
(Fetahu et al., 2005). The plant genetic resources are considered as the main
source for the conservation of the biological diversity and long-term
sustainability of human life. Identification of the genetic variability by means
of the morphological indicators also helps for the determination of the
duplicate accessions.
Characterization of morphological variability allows breeders to identify
accessions with desirable characteristics such as earliness, disease resistance, or
improved ear morphology. Characterization and grouping of germplasms allow
breeders to avoid duplication in sampling populations. Also, in the absence of
pedigree records or information on combining ability it would be useful to
organize the collection based on morphology. This may allow breeders to
identify potential combining ability groups. The variance component is derived
Page 20
3
from further partitioning of genotypic differences into phenotypic, genotypic
and environmental coefficient of variation and heritability are good index of
transmission of characters from parents to their off springs (Falconer, 1960).
Genetic diversity values (GDVs) calculated from field data have been
suggested as measures of genetic diversity (Williams and Hallauer, 2000).
Better knowledge on genetic diversity or genetic similarity could help to
sustain long term selection gain (Chowdhury et al., 2002 and Belaj et al.,
2002). Because, genetically diverse parents are known to produce high
heterotic effects and wide segregates for developing high yielding varieties or
vice versa. Moreover, evaluation of genetic divergence is important to know
the source of genes for a particular trait within the available germplasm
(Tomooka, 1991). In general, genetic diversity among and within cultivars of
our major crop species is desirable to reduce potential impact of economic
losses due to environmental and biological stresses. Knowledge of genetic
diversity among plant population and quantitative assessment usually helps a
breeder in choosing desirable parents for breeding programs.
We therefore in the present study used 25 promising maize varieties for
characterization to determine genetic diversity and to identify potential
genotype from the breeding point of view. To achieve these goals the research
work was conducted specifically for the following objectives:
To estimate the nature and magnitude of genetic variations among
the maize genotype in respect of different morphological characters
To determine the nature of relationship between yield and yield
contributing characters
To estimate diversity among genotypes and to find out diverse
germplasm suitable for the utilization in varietal improvement and
future hybridization programme
Page 22
4
CHAPTER II
REVIEW OF LITERATURE
Maize is the third important cereal crop which has received much attention of
research workers throughout the world. Various investigators at home and
abroad worked with different maize lines and studied their performance
regarding the characterization and diversity of maize. The information
available on this subject from different studies by various workers at home and
abroad has been reviewed in this chapter with following heading:
2.1 Taxonomy and Geographic Origin
Maize belongs to the tribe Maydeae of the grass family Poaceae. The genus
Zea consists of four species of which Zea mays L. is economically important.
The other zea sp., referred to as teosintes, is largely wild grasses native to
Mexico and Central America (Doeblay, 1990). The number of chromosomes in
Zea mays is 2n= 20. Tribe Maydeae comprises seven genera which are
recognized, namely old and new world groups. Old world comprises Coix (2n
= 10/20), Chionachne (2n = 20), Sclerachne (2n = 20), Trilobachne (2n = 20)
and Polytoca (2n = 20), and new world group has Zea and Tripsacum. It is
generally agreed that maize phylogeny was largely determined by the
American genera Zea and Tripsacum, however it is accepted that the genus
Coix contributed to the phylogenetic development of the species Zea mays
(Radu et al., 1997).The closest wild relatives of maize are the teosintes which
all belong to the genus Zea outside the Zea genus, the closest wild relatives are
from the genus Tripsacum. (CFIA, 1994 and OECD, 2006)
The center of origin for Zea mays has been established as the Mesoamerican
region, i.e. Mexico and Central America (Watson and Dallwitz, 1992).
Archaeological records suggest that domestication of maize began at least 6000
years ago, occurring independently in regions of the southwestern United
States, Mexico, and Central America (Mangelsdorf, 1974). In India, Portuguese
Page 23
5
introduced maize during the seventeenth century. From India it went to China
and later it was introduced in Philippines and the East Indies. Various
hypotheses have been proposed on the origin/domestication of maize (OECD,
2006). Teosintes (Z. diploperennis and Z. mays sp. mexicana) and Tripsacum
species are often described as having roles in the domestication process of
maize (Mangelsdorf, 1974 and Galinat, 1988).
The possibility of inter-generic hybridization of either Z. diploperennis or
Tripsacum with extinct wild maize has also been proposed as the ancestral
origin of Z. mays (Radu et al., 1997 and Purseglove, 1972). Eubanks (1993,
1997) suggests that domesticated maize may have arisen via human selection
of natural hybrids between Tripsacum and perennial teosinte.
Maize is a cultivated crop throughout the world and accordingly germplasm
resources are preserved ex-situ in many parts of the world. The great diversity
of environments and conditions have created the basis for the development of
maize varieties well adapted to harsh conditions of soil and climate as well as
to biotic stresses. There is a close correlation among community culture,
production system and the type of consumption of maize, with the
diversification and variation of maize (Aguirre et al., 1998 and Louette and
Smale, 1998).
2.2 Reproductive biology
Maize is a tall, determinate, monoecious, annual plant. It produced large,
narrow, opposite leaves, borne alternatively along the length of stem. All maize
varieties follow same general pattern of development, although specific time
and interval between stages and total number of leaves developed may vary
between different hybrids, seasons, time of planting and location.
Silking stage involving the formation of the female flowers or cobs is the first
reproductive stage and occurs 2-3 days after tasseling stage. This stage begins
when any silks are visible outside the husk. These are auxillary flowers unlike
tassels that are terminal ones. Pollination occurs when these new moist silks
Page 24
6
catch the falling pollen grains. Maize is a monoecious plant, that is, the sexes
are partitioned into separate pistillate (ear), the female flower and staminate
(tassel), the male flower. It has determinate growth habit and the shoot
terminates into the inflorescences bearing staminate or pistillate flowers
(Dhillon and Prasanna, 2001).
Maize is generally protandrous, that is, the male flower matures earlier than the
female flower. Within each male flower spikelet, there are usually two
functional florets, although development of the lower floret may be delayed
slightly in comparison to the upper floret. Each floret contains a pair of thin
scales i.e. lemma and palea, three anthers, two lodicules and rudimentary pistil.
Pollen grains per anther have been reported to range from 2000 to 7500
(Kiesselbach, 1949). Kiesselbach (1949) estimated that 42,500 pollen grains
are produced per square inch of cornfield. The pollen grains are very small,
barely visible to the naked eye, light in weight, and easily carried by wind. The
wind borne nature of the pollen and protandry lead to cross-pollination, but
there may be about 5 per cent self-pollination. In maize, the pollen shed is not a
continuous process and usually begins two to three days prior to silk emergence
and continues for five to eight days. The silks are covered with fine, sticky
hairs which serve to catch and anchor the pollen grains. Pollen shed stops when
the tassel is too wet or too dry and begins again when temperature conditions
are favourable. Under favourable conditions, pollen grain remains viable for
only 18 to 24 hours. Cool temperatures and high humidity favor pollen
longevity. Under optimal conditions the interval between anthesis and silking is
one to two days. Fertilization occurs after the pollen grain is caught by the silk
and germinates by growth of the pollen tube down the silk channel within
minutes of coming in contact with a silk and the pollen tube grows the length
of the silk and enters the embryo sac in 12 to 28 hours. Pollen is light and is
often carried considerable distances by the wind. Under field conditions 97% or
more of the kernels produced by each plant are pollinated by other plants in the
field. Fertilization of ovules begins about one third of the way up from the base
of the ear.
Page 25
7
2.3 Studies on morphological characterization
Plant height is the function of cell growth and vertical cell enlargement (Hsiao
et al., 1976). Chowdhury and Islam (1993), reported that maize varieties
Barnali. Khoibhutta, Mohor and Shuvra were 200, 160, 210 and 175 cm tall
respectively.
Akhtar and Mitra (1990), found that plant height was significantly different
among the 6 CIMMYT entries and one local cheek. Jotshi et al. (1988)
working with 25 varieties of maize and observed that leaves per plant differed
significantly among the varieties. Lee et al. (1986) studying with 28 maize
hybrids also observed significant differences in number of leaves per plant
among the varieties.
Mei et al. (1983); reported that there was no significant difference between the
spring crop and the autumn crop in the number of days to silking and the
autumn crop showed higher grain yield and potential ear dry weight than the
spring crops.
Okigbo (1973), showed that maize planted on ridge produced more than one
ear per plant. Grain yield depends on what extent of dry matter accumulated in
the ears (Allison and Watson, 1966).
Singh et al. (1991); conducted an experiment with varieties Ganga 5 and HLL
and found that Ganga 5 was significantly superior to HLL with regard to
growth and yield which was due to ear length. In an experiment with 5 maize
cultivars (R2, Ganga 5, Ganga 11, HH 216 and D765), Paradkar and Sharma
(1993) found that Ganga 11 gave more ear length followed by Gonga 5 and D
7654.
Ear length is an important yield component for maize and had a direct effect on
grain yield (Sehata, 1975; Jha et al., 1979 and Subramanin et al., l98l). BARI
(1990), reported that cv. Bamali gave more ear per plant than Khaibhutta.
Page 26
8
Paradkar and Sharma (1993) observed that out of 5 maize varieties (R1, Ganga
5, Ganga ll, HH2l6 and D765), Ganga ll gave increased grain rows per ear.
Kamen (1983), observed that early maturity hybrids had fewer grain rows per
ear than late maruriting hybrids. Number of grains per row may differ among
the varieties. Grains per ear, one of the important yield contributing characters,
varied with variety. Khaibhutta produced significantly higher (432.5) number
of grains per ear than Barnali (343.5) as reported by Anonymous (1988). On
the other hand, Khoibhutta produced the highest number of grains per ear when
compared with variety Pirsabak 8l46, Lamaquina 7827 and Guaira 8045
(Anonymous, l987).
Number of grain-rows per ear is variable within and among the varieties of
maize (Evans, l975). Begum and Roy (1987), reported that yield variation
among the varieties were due to varietal characteristics. Guaria 8045 gave
significantly higher grain yield (5.15 t/ha), whereas Pirsabak 8146, LaMaquina
and Khoibhutta produced grain yields of 4.50, 5.07 and 4.00 t/ha respectively
(Anonymous 1987).
Pavlov et al. (2003); used a half diallel cross to evaluate combining abilities of
six maize inbred lines and their hybrid combinations. General and specific
combining ability (GCA and SCA) mean squares were significant for all traits.
GCA/SCA ratios revealed that additive gene effects had larger importance in
inheritance of all of investigated traits than non-additive effects. The hybrid
combinations those exhibited significant SCA effects involved low x high,
average x high and high x high GCA parents.
Viola et al. (2004); reported that maize display an orderly sequence of
development of yield components namely number of ear per plant, number of
kernel per row, number of kernel row per ear and hundred kernel weights.
Grzesiak (2001), observed considerable genotypic variability among various
maize genotypes for different traits. Ibsan et al. (2005) also reported significant
genetic differences for morphological parameter for maize genotypes.
Page 27
9
Shanthi et al. (2011); found that grain yield and its component characters viz.,
total anthers dehiscence period, total period of silk appearance, active
pollination period, number of seeds per cob, cob weight, protein yield and oil
yield had expressed high estimates of GCV and PCV and high heritability
(more than 85%) coupled with high genetic advance, indicating the genetic
variances for these traits probably owing to their high additive gene effects and
hence, it was inferred that there was a better scope for improvement of these
traits through direct selection.
Naushad et al. (2007); conducted an experiment to assess the magnitude of
genetic variability in maize genotypes for yield and yield components and
significant variability was observed for ear length, grains rows per cob, fresh
cob weight, grain moisture content, 300-grains weight and grain yield.
Farhan et al. (2012); revealed that testcrosses differed significantly for all the
characters studied except days to 50% anthesis, days to 50% silking, and ASI.
The Genotype x Location interaction was also significant for all the traits
except for ear length. Mean values for days to 50% tasseling, anthesis and
silking, anthesis silking interval (ASI), plant and ear height were 55.3, 58.2,
59.9, 1.69, 157.7 and 72.1, respectively.
Praveen et al. (2014); revealed that the mean sum of squares due to genotypes
showed significant differences for all the 12 characters studied. Traits yield per
plant, plant height, ear height, number of kernels per row, 100-kernel weight
were showed high heritability accompanied with high to moderate genotypic
and phenotypic coefficient of variation and genetic advance which indicates
that most likely the heritability is due to additive gene effects and selection
may be effective in early generations for these traits. Whereas high to moderate
heritability along with low estimates of genetic advance were observed for days
to 50 per cent tasseling, days to 50 per cent silking, shelling percentage, ear
length and days to maturity ear girth and number of kernel rows per ear.
Page 28
10
Abel and Pollak (1991), evaluated test crosses of exotic maize accessions with
several testers and found highly significant variations among test crosses for
ear height. While Genter and Alexander (1965) results after testcross
evaluation are in disagreement with this results. In their study test crosses of
Va31xHy with CBS were not significantly different for ear height.
Wannows et al. (2010); obtained that all estimates of additive (VA) and
dominance (VD) variance were significant for all characteristics with exception
of additive variance for specific leaf weight also, dominance variance for leaf
area index, plant and ear height, ear length, and number of kernel per row.
However the magnitude of VA was consistently larger than that of VD for all
characteristics with exception of specific leaf weight, silking date, stay green,
100- kernel weight and grain yield where VD values were larger than VA
values.
Amer and Mosa (2004), reported that heritability estimates in narrow sense
were 44% for silking date, 39% for plant height, 44% for ear height, 27% for
ear length, 31% for ear circumference, 29% for number of rows per ear, 23%
for number of kernel per row and 36% for grain yield.
Ogunniyan and Olakojo (2014), found significant variation existed in all the
characters. The coefficients of variation were low except for ear weight and
grain yield that were relatively higher. The anthesis silking interval was highest
in lines TZEI 124 and TZEI 16. The characters were less influenced by the
environment thus the traits can be used for selection. Heritability was greater
than 80% for all characters studied whereas expected genetic advance ranged
from low (8.91) in days to silking to high (72.03) in number of ear per plant.
Days to anthesis and silking, plant height and number of leaf per plant were
positively correlated. Grain yield was positively correlated with ASI, plant and
ear heights, number of leaf per plant and leaf area.
Breeders are interested in screening and development of open pollinated
population in maize. Ishaq et al. (2015); showed highly significant differences
Page 29
11
(P≤ 0.01) for all the traits. The highest values for plant height (169.1 cm), ear
height (75.13 cm), leaves per plant (11.33), flag leaf area (106.5 cm), grain
rows per ear (13.67) and grain yield (5927 kg ha-1
) were recorded for Jalal-
2003. Broad sense heritability (h2
b) ranged from 0.29 to 0.95 for various traits.
Among the tested populations Jalal-2003 proved to be superior for most of the
traits studied. The study revealed a considerable amount of genetic variation
and heritability estimates that could be manipulated for further improvement in
maize breeding.
2.4 Studies on correlation co-efficient and path co-efficient
Determination of genotypic and phenotypic correlation is very fundamental
step in the formulation and implementation of various breeding programs and
activities. The correlations between the traits is also of great importance for
success in selections to be conducted in breeding programs, and analysis of
correlation coefficient is the most widely used one among numerous methods
that can be used (Yagdi and Sozen, 2009).
Two types of correlations, phenotypic and genetic, are commonly discussed in
plant breeding. Phenotypic correlation (rp) involves both genetic and
environmental effects. Genetic correlation is the association of breeding values
(i.e., additive genetic variance) of the two characters. Both measure the extent
to which degree the same genes or closely linked genes cause co-variation in
two different characters (Hallauer and Miranda, 1988)
Kumar et al. (2014); revealed that positive and significant phenotypic
correlations were recorded for grain yield with plant and ear height, ear length
and diameter, number of kernel row per ear and kernels per row and 100
kernels weight except maturity traits which, showed negative association with
grain yield. The result obtained from path analysis showed that, days to 50%
tassel had highest magnitude of direct effect on grain yield per plant followed
by ear height, 100 kernels weight and ear circumference.
Page 30
12
When there is positive association of major yield characters component
breeding would be very effective but when these characters are negatively
associated, it would be difficult to exercise simultaneous selection for them in
developing a variety reported by Nemati et al. (2009).
AL-Ahmad (2004); Aydin et al. (2007) and Najeeb et al. ( 2009) found positive
and significant correlation between grain yield and each of plant height,
number of rows per ear, number of kernel per row and 100-kernel weight and
emphasized the role of these traits in selection of high grain yield in corn. Also,
indicated that the correlation values were positive and significant between grain
yield and each of ear circumference, ear length and number of kernels per row.
It also revealed that the most sources of variation in plant yield were the direct
effects of number of kernels per row and both number of kernels per row and
ear circumference.
Ahemed et al. (1978); reported that both ear length and ear circumference were
positively correlated with 1000-kernel weight and grain yield. A positive
correlation between number of kernels per row and kernel rows per ear was
observed by Zuzulya (1979). Jha et al. (1979); described that number of rows
per ear had little direct effect on grain yield.
Singh and Nigam (1977), found that 1000-kernel weight and kernel rows per
ear had positive direct effect on grain yield. Pande et al. (1971), observed that
100-seed weight was positively correlated with grain yield. Onn (1988),
observed plant height significantly correlated with cultivar.
Bikal and Deepika (2015), showed that traits plant height, ear height, ear
length, ear girth, ear weight, no. of kernel row per ear, no. of kernel per row
exhibited positive and highly significant correlation with grain yield per hectare
and five hundred kernel weight given significant correlation. The analysis also
indicated that days to 50% tasseling and days to 50% silking explained
negative and highly significant correlation with grain yield per hectare.
Page 31
13
Similarly, days to maturity showed negative and non significant correlation
with grain yield per hectare.
Bahoush and Abbasdokht (2008), showed that number of grains per ear and
100 grain weights had high and positive direct effects and ear length had
positive and moderate direct effect on yield. Furthermore, ear height had low
and negative direct effect on grain yield.
According to Kwaga (2014), maize grain yield correlated positive with plant
height, ear length, cob diameter and 100 grains weight; but related negatively
with days to 50% tasseling. The four characters that correlated positively to
grain yield also associated positively to each other throughout the study.
Garcia et al. (2003); revealed that correlation coefficient measures the mutual
association only between a pair of variables, when more than two variables are
involved; the correlations may not provide a clear picture of the importance of
each component in determining grain yield. Path coefficient analysis provides
more information among variables than do correlation coefficients since this
analysis provides the direct effects of specific yield components on yield, and
indirect effects via other yield components.
Mohan et al. (2002); studied path analysis on corn cultivars (169 cultivars) for
grain yield and oil content and resulted that number of seed per row, 100 seed
weight, number of seed row and ear, length had direct effect on grain yield and
ear height, plant height and number of days until 50% tasseling had most minus
direct effect on grain yield. Devi et al. (2001); reported that ear length, number
of seed rows per ear, number of seeds per row and 100-seed weight positively
influenced the yield directly and also indirectly through several components.
Mohammadi et al. (2003); reported that 100-grain weight and total number of
kernels per ear revealed highest direct effects on total grain weight, while ear
length, ear circumference, number of kernel rows, and number of kernels per
row were found to fit as second-order variables. Geetha and Jayaraman (2000),
Page 32
14
reported that number of grains per row exerted a maximum direct effect on
grain yield. Hence, selection of number of grains per row will be highly
effective for improvement of grain yield.
Khazaei et al. (2010); reported that 100-grains weight and number of kernel
had the highest direct effecton grain yield. However, the study carried out by
Selvaraj and Nagarajan (2011) revealed that direct selection for ear length and
numbers of rows per ear are effective for yield improvement. The same author
stated that, the positive direct and indirect effects of a trait on grain yield make
it possible for its exploitation in selection under specific conditions.
Mustafa et al. (2014); revealed that the fresh shoot length had maximum direct
effect on fresh root length followed by root density, dry shoot weight, leaf
temperature and dry root weight. It may be concluded that fresh root length,
dry shoot weight, root density, leaf temperature and dry root weight are the
characters which contribute largely to the fresh shoot length of maize seedlings.
These traits had reasonable heritability estimates, thus selection could be made
for high yielding maize genotypes on the basis of these traits.
In an experiment carried out by Bello et al. (2010) positive and significant
phenotypic and genotypic correlations were found for days to 50% tasselling
with plant and ear height, and grain yield with plant height, number of grains
per ear and ear weight. Positive and significant environmental correlation was
also recorded for grain yield with plant and ear height, and ear weight. The path
analysis revealed that, days to 50% silking, ear weight and number of grains
per ear had the highest direct effect on grain yield, while number of grains per
ear had the highest moderate indirect negative effects on grain yield. Days to
flowering, plant and ear height, number of grains per ear and ear weight could
be the important selection criteria in improving open pollinated maize varieties
and hybrids for high grain yield.
Days to 50% tassel and number of kernel rows per ear showed negative indirect
association with all traits towards grain yield. Study revealed that direct
Page 33
15
selection for these traits would be effective. Days to 50% silk exhibited
negative direct effect on grain yield indicated that selection for high yield could
be done by indirect selection through yield components. (Pavan et al., 2011;
Venugopal et al., 2003)
2.5 Studies on genetic divergence
The importance of genetic diversity in selecting genetically diverse parents
either to exploit heterosis or to get desirable recombinants has been stressed
upon by many researchers (Murthy, 1966; Joshi and Dhawan, l966). It is a
powerful tool in quantifying the degree of divergence among biological
population based on multiple characters. Genetic diversity is essential to meet
the diverse goals of plant breeding such as producing cultivars with increased
yield (Joshi and Dhawan, 1966), wider adaptation, desirable quality, pest and
disease resistant (Nevo et al., 1982). In most of the cases genetic divergence
analysis is attempted to identify specific parents for realizing heterosis and
recombination in breeding program.
Singh and Chaudhari (2001), evaluated fifty-five inbred lines for genetic
divergence. The 55 inbreds were grouped into 5 clusters. Among these, cluster
II had the maximum number of 16 inbreds followed by clusters IV and V with
ll and 10 inbreds, respectively. Clusters I and II consisted of 9 inbreds each.
The highest inter-cluster distance was observed between clusters I and IV,
indicating wide genetic diversity between them. The least inter-cluster distance
was between clusters III and V, indicating the genetic closeness between the
inbreds of these clusters.
A study was conducted by Rafalski et al. (2001) with the help of PCR to
evaluate the genetic diversity of maize germplasm. Twenty-two inbred lines
representing early flint and dent types were evaluated for genetic distance
based on analysis of 554 DNA fragments amplified using 25 primers from 10
to 18 bases in length. Cluster analysis based on above data resulted in a
Page 34
16
separate grouping of flint and dent inbreds. Based on the result of cluster
analysis, 5 dent and 4 flint inbreds were selected for evaluation of the
performance of 36 single crosses.
Khumkar and Singh (2002), observed significant diversity among the inbred
lines developed from the same or different source populations. The inbred lines
were grouped into six clusters. The greatest intra-cluster distance was recorded
for cluster IV, whereas the greatest inter-cluster distance was observed between
cluster III and V. Among the characters evaluated peduncle length, plant height
and number of primary branches, 100-kernel weight, ear circumference and
number of kernels per row had the greatest contribution towards genetic
divergence.
Drinic et al. (2002); used twelve maize inbred lines by simple sequence repeats
(SSR) as molecular markers to analyze the genetic relationship among inbred
lines and to predict heterosis in their crosses. Genetic distance for 66 crosses
among l2 inbred lines ranged from 0.123 between pairs M017 and ZPL7O/9 up
to 0.064 between B84 and LI55. The UPGMA clustering grouped the inbreds
into three clusters. Cluster I consisted of inbred lines derived from BSSS
germplasm or germplasm related to it. Cluster II contained the Lancaster lines,
while cluster III included two independent lines. Data showed that inbreds most
closely related by their pedigree were also closely related based on marker
intonations.
On the basis of D2 statistics analysis, the genotypes were grouped into 16
clusters by Singh et al. (2003). Cluster I comprised the maximum number of
genotypes (18) whereas, cluster XIII to XVI comprised a single genotype in
each, indicating that there was wide range of variations amongst the genotypes.
Clustering pattern indicated that the genetic diversity was due to genetic
distance. As cluster XIII to XVI considered only genotypes in each, the intra-
cluster distance of these groups was zero. The highest intra-cluster distance was
observed in cluster II, which had 6 genotypes. The inter-cluster distance was
observed highest (26.4) between cluster V and IX, and the lowest between III
Page 35
17
and XIV (5.3), respectively. The highest inter-cluster distance suggested that
the genetic recombination between genotypes of these two clusters would result
in considerable heterosis.
Brkic et al. (2003); used one hundred simple sequence repeats (SSR) as
molecular markers to analyze the genetic relationship among 9 maize inbred
lines. Genetic variation was also examined between the inbred lines B73 and
M017 obtained from two different sources. Genetic dissimilarity ranged from 8
(between the M017 lines obtained from different sources) to 92 (between M017
and Os438-95). Mean heterozygosity values within samples were relatively low
(with an average of 2.l8% across all samples), however, B73 from the
Agrogene source showed a much higher level of within sample heterozygosity
at 14%. The relationship among samples determined by the SSR markers and
UPGMA clustering agreed with the pedigree of these lines. The results showed
that different seed sources of the same inbred line did not vary considerably.
Different sources of the same lines were tightly clustered in the UPGMA
dendogram.
Li et al. (2004); showed that the accessions assessed could be clustered into a
few groups. This was mostly in accordance with the heterotic groupings
previously assigned based on conventional methods, although some notable
differences were detected. The results indicated that most of the Italian maize
inbreds used in the study were mainly related to the RYD background and most
of the Chinese inbreds were associated more with the Huangzaosi (HZS)
background. In addition, the results supported the establishment of a new
heterotic group, that is, the PN group derived from Pioneer hybrids, in Chinese
maize breeding programmes. The study indicated that AFLP markers were
suitable for the assessment of genetic diversity in maize germplasm because of
its high polymorphism and for the identification of pedigrees of those
germplasm with unknown or uncertain genetic background.
Page 36
18
Characterization of genetic diversity of maize (Zea mays L.) germplasm is of
great importance in hybrid maize breeding (Melchinger et al., 2005). Inbreds
included in the study were assayed with 79 SSR markers. The CIMMYT inbred
lines originated from 35 mostly broad-based populations and pools with mixed
origins. A total of 566 alleles were scored, (averaging 7.2 and ranging from 2
to 16 alleles per locus).
An experiment was conducted by Singh et al. (2005) to study genetic
divergence of 23 genotypes of maize using D2 analysis. The genotypes fell into
6 clusters. The inter-cluster distances were higher than intra-cluster distances,
suggesting wide genetic maximum distance between clusters III and VI and the
lowest distance between clusters I and IV. The cluster means were higher for
50% tasselling, 50% silking, plant height, cob height, ear length, number of
grains per row and I00- grain weight in cluster IV; for cob girth, days to
maturity and number of rows per cob in cluster II; and for grain yield per plant
in cluster III followed by cluster II. The genotypes of these clusters would offer
a good scope for the improvement of this crop through selection and
hybridization.
More et al. (2006); grouped forty five diverse genotypes into 7 clusters using
Mahalanobis D2 statistics. Cluster II was the largest with 25 genotypes
followed by cluster III with ll genotypes and cluster I with 5 genotypes. The
clusters IV, V, VI and VII were mono-genotypic. The maximum inter-cluster
distance was observed between clusters I and VI followed by distance between
clusters I and IV and clusters I and V. Clusters V and VI exhibited the
minimum inter-cluster distance.
Cluster analysis based on these quantitative characters assigned the test inbred
lines into five major with minor grouping within the major clusters indicating
the importance of phenotypic descriptors and were able to differentiate between
them reported by Singh et al. (2005).
Page 38
19
CHAPTER III
MATERIALS AND METHODS
A field experiment was conducted at the experimental field of Genetics
and Plant Breeding department of Sher-e- Bangla Agricultural University,
Dhaka-1207, Bangladesh during March 2014 to July 2014 to study the genetic
variation, genetic divergence and correlation and path coefficient in yield
contributing characters of maize (Zea mays L.). The materials and methods
of this experiment are presented in this chapter under these following headings:
3.1 Site of experiment
The research work was conducted at the experimental farm of Sher-e-Bangla
Agricultural University, Dhaka- 1207. The experimental site was at 90º22′ E
longitude and 23º41′ N latitude at an altitude of 8.6 meters above the sea level
(Appendix I).
3.2 Soil and climate of the experimental site
The experimental area was under the sub-tropical monsoon climate zone,
which is characterized by heavy rainfall, high humidity, high temperature and
relatively long day during the Kharif season. The land belongs to agro-
ecological region of ‘Madhupur Tract’ (AEZ 28) of Nodda soil series. The
soil was sandy loam in texture having pH 5.47-5.63. The mean temperature
of the growing period was 26.43°C with average maximum and minimum
being 36ºC and 20.54ºC, respectively. Details of the meteorological data in
respect of temperature, rainfall, relative humidity, total sunshine and soil
temperature during the period of experiment were collected from the weather
station, Dhaka, Bangladesh (Appendix II & III)
3.3 Genetic materials used for the experiment
Twenty five (25) genotypes were used in the study. The seeds of 25
accession lines were collected from Bangladesh Agricultural Research
Institute (BARI) and other different sources. Descriptions of the genotypes are
given in Table 1.
Page 39
20
Table 1. The code, accession name and source of collection of the 25 maize
genotypes used in the experiment
Sl No. Code Accession name Source of collection
1 G1 BHM-3 BARI
2 G2 BHM-5 BARI
3 G3 BHM-6 BARI
4 G4 BHM-7 BARI
5 G5 BHM-9 BARI
6 G6 Shuvra BARI
7 G7 BM-5 BARI
8 G8 BM-6 BARI
9 G9 Khai bhutta BARI
10 G10 BHM-8 BARI
11 G11 Nk-40 Lalteer
12 G12 Pacific-11 ACI Agri. limited
13 G13 PAC-999 ACI Agri. limited
14 G14 Bari misti bhutta-1 BARI
15 G15 PAC-984 ACI Agri. limited
16 G16 Dekalb super gold Agrovet limited
17 G17 Dekalb 962 Agrovet limited
18 G18 Khai bhutta BARI
19 G19 Barnali BARI
20 G20 VB-100 Lalteer
21 G21 Pacific 98 ACI Agri. limited
22 G22 4536 Lalteer
23 G23 Dekalb 9120 Agrovet limited
24 G24 VA-786 Lalteer
25 G25 Profit ACI Agri. limited
Page 40
21
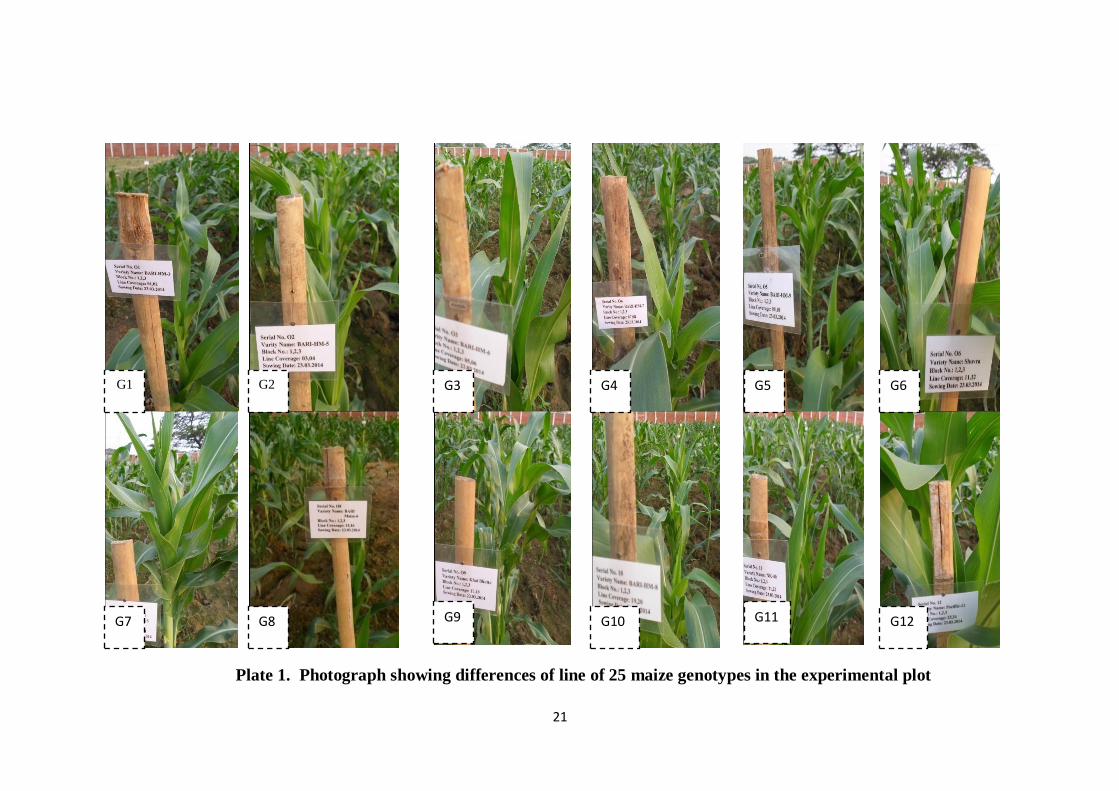
Plate 1. Photograph showing differences of line of 25 maize genotypes in the experimental plot
G1 G6 G5 G4 G3 G2
G7 G10 G11 G9 G8 G12
Page 41
22
Plate 1(Cont’d).
G13 G17 G16 G15 G14
G23 G22 G21 G20
G19 G18
G25 G24
Page 42
23
3.4 Design and layout of the experiment
The experiment was laid out in randomized complete block design (RCBD)
with 3 replications. The field was divided into 3 blocks. The individual block
size was 3.5 cm × 20 cm. Block to block distance was 1 m, plant to plant
distance was 20 cm and row to row distance was 75 cm. The genotypes were
distributed to each row in each block randomly.
3.5 Preparation of the experimental field
The selected field for growing maize was first opened with power tiller and
was exposed to the sun for a week. Then the land was prepared to obtain good
tilth by several ploughing, cross ploughing and laddering. Subsequent
operations were done with harrow, spade and hammer. Weeds and stubbles
were removed; larger clods were broken into small particles and finally
attained into a desirable tilth to ensure proper growing conditions. The plot was
partitioned into the unit blocks according to the experimental design as
mentioned earlier. Recommended doses of well decomposed cow dung,
manure and chemical fertilizers were applied and mixed well with the soil each
blocks. Proper irrigation and drainage channels were also prepared around the
blocks. Each unit blocks was prepared keeping 5 cm height from the drains.
The bed soil was made friable and the surface of the bed was leveled.
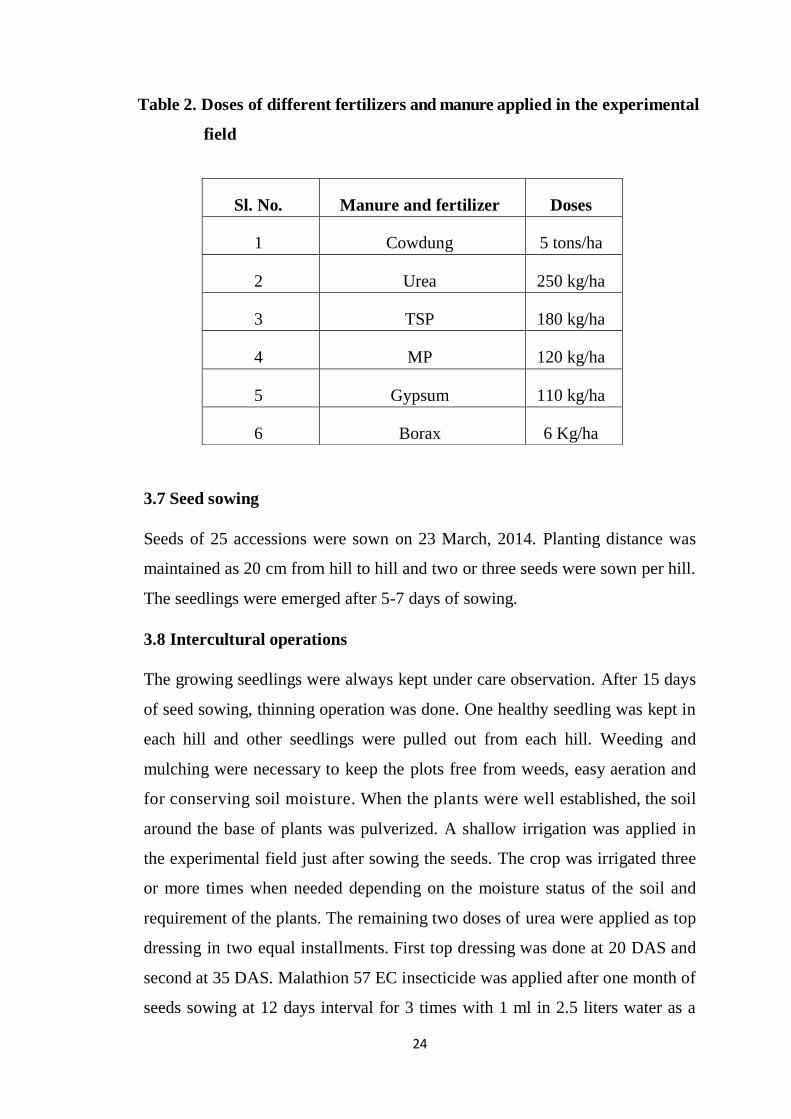
3.6 Manures and fertilizer application
Manures and fertilizers such as cow dung, urea, triple super phosphate (TSP),
muriate of potash (MP), gypsum and borax were applied at the rate shown in
Table 2. Urea was applied by three installments. The entire cow dung, TSP,
MP, gypsum, borax and half of the urea was applied at the time of final land
preparation. The remaining half of urea was applied as top dressing in two
installments. First top dressing was done at 20 days after and second at 35 days
after sowing. In this study fertilizer was applied as per the recommendation of
Bangladesh Agricultural Research Institute (BARI).
Page 43
24
Table 2. Doses of different fertilizers and manure applied in the experimental
field
3.7 Seed sowing
Seeds of 25 accessions were sown on 23 March, 2014. Planting distance was
maintained as 20 cm from hill to hill and two or three seeds were sown per hill.
The seedlings were emerged after 5-7 days of sowing.
3.8 Intercultural operations
The growing seedlings were always kept under care observation. After 15 days
of seed sowing, thinning operation was done. One healthy seedling was kept in
each hill and other seedlings were pulled out from each hill. Weeding and
mulching were necessary to keep the plots free from weeds, easy aeration and
for conserving soil moisture. When the plants were well established, the soil
around the base of plants was pulverized. A shallow irrigation was applied in
the experimental field just after sowing the seeds. The crop was irrigated three
or more times when needed depending on the moisture status of the soil and
requirement of the plants. The remaining two doses of urea were applied as top
dressing in two equal installments. First top dressing was done at 20 DAS and
second at 35 DAS. Malathion 57 EC insecticide was applied after one month of
seeds sowing at 12 days interval for 3 times with 1 ml in 2.5 liters water as a
Sl. No. Manure and fertilizer Doses
1 Cowdung 5 tons/ha
2 Urea 250 kg/ha
3 TSP 180 kg/ha
4 MP 120 kg/ha
5 Gypsum 110 kg/ha
6 Borax 6 Kg/ha
Page 44
25
preventative measure against different insects. Birds are severe pest for maize
during fruiting time. So, the field was covered with net over the plant to protect
from the birds.
3.9 Harvesting
Different genotypes matured at different times. Ten plants from each genotype
from every plot were randomly selected to collect data and these were
harvested by uprooting. Border plants were discarded to avoid border effect.
3.10 Data collection
In order to study the genetic divergence among the genotypes, the data were
collected in respects of three qualitative and seventeen quantitative traits and
recorded. Data of tasseling and data of silking were recorded on whole plant
basis. The other parameters were noted on individual plant basis from ten
randomly selected competitive plants.
3.11 Method of data collection
To study the stable diagnostic characteristics, data on the morphological
characters were collected from ten randomly selected plants from each
replicated plot. The plants were selected from middle of the plot to avoid
border effect and portion of the plot. In addition to prepare the descriptors, the
test genotypes were classified according to Suresh et al. (2013). The
descriptors are appended in the Appendix III. The observations for
characterization were recorded under field condition as follows:
3.11.1 Number of leaves per plant
The total number of leaves was counted from each of the sample plants and the
average was taken.
3.11.2 Leaf length
It was measured in centimeter scale from the jointing point of leaf and to the tip
point of leaf.
Page 45
26
3.11.3 Leaf breadth
Leaf breadth was measured in cm scale at the middle of leaf and categorized by
following groups as per descriptors.
1- Very small
2- Small
3- Medium
4- Large
5- Very large
3.11.4 Days to 50% tasseling
Data regarding days to 50% tasseling were recorded by regular visits to the
field and days were counted from sowing to the day when 50% of the plants
produced tassels in a block.
3.11.5 Days to anthesis
The number of days required from planting till 50% of plants was shedding
pollen in a plot. The days were counted from date of sowing. According to days
required, the test genotypes were classified into three different categories as per
descriptors.
1- Medium
2- Late
3- Very late
3.11.6 Days to silk emergence
The number of days required from planting till first of the plants showed silks.
The days were counted from date of sowing. According to their days required,
the test genotypes were classified into five different categories as per
descriptors.
1- Very early
2- Early
3- Medium
4- Late
5- Very late
Page 46
27
3.11.7 Days to 50% silking
Silking data were recorded as the number of days from sowing until 50% of the
plants in each plot showed silks.
3.11.8 Plant height (cm)
The average height of the 10 plants from the plant base to the tip of the tassel
was measured in centimeters. According to their length, the test genotypes
were classified into five different categories as per descriptors.
1- Short
2- Medium
3- Medium long
4- Long
5- Very long
3.11.9 Ear height (cm)
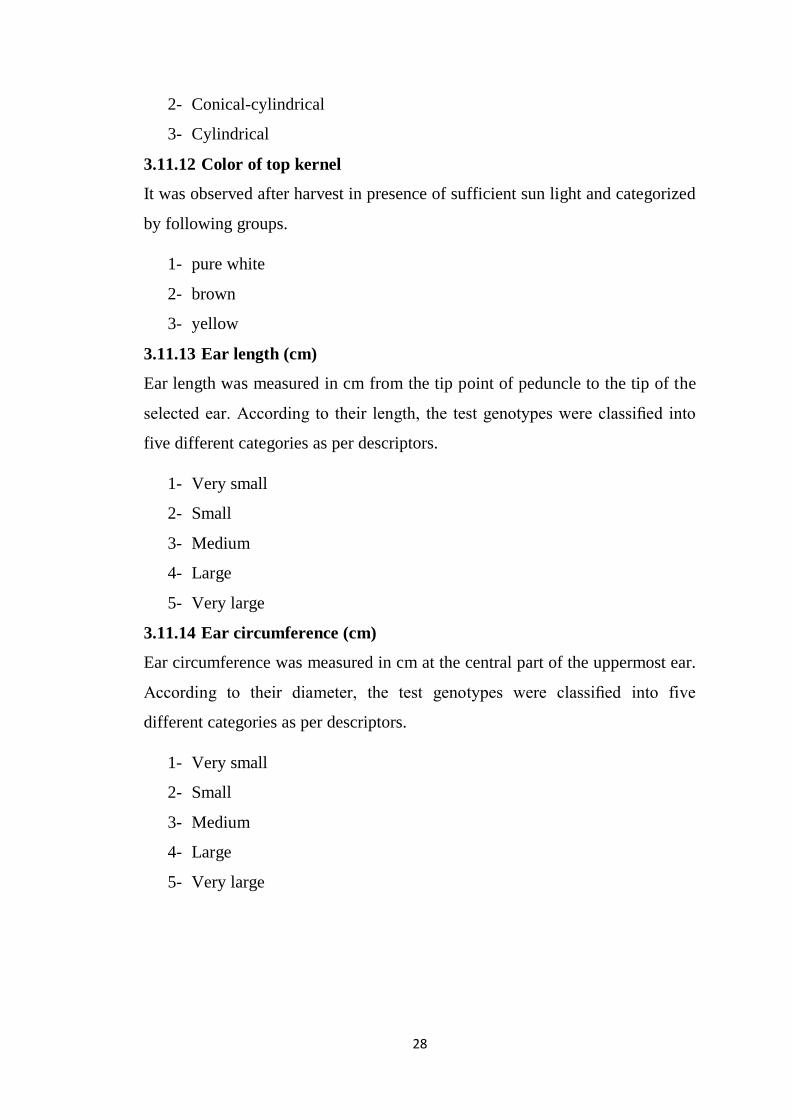
Ear height was measured in cm from ground level to node bearing the upper
most ears. Ten randomly selected plants were averaged for each genotype from
each block. According to ratio height of insertion of upper ear to plant length
(ear placement), the test genotypes were classified into five different categories
as per descriptors.
1- Short
2- Medium
3- Medium long
4- Long
5- Very long
3.11.10 Cobs per plant
Number of cobs per plant was counted during the harvesting time.
3.11.11 Ear shape
Shape of the ear was observed and the genotypes were categorized as
following.
1- Conical
Page 47
28
2- Conical-cylindrical
3- Cylindrical
3.11.12 Color of top kernel
It was observed after harvest in presence of sufficient sun light and categorized
by following groups.
1- pure white
2- brown
3- yellow
3.11.13 Ear length (cm)
Ear length was measured in cm from the tip point of peduncle to the tip of the
selected ear. According to their length, the test genotypes were classified into
five different categories as per descriptors.
1- Very small
2- Small
3- Medium
4- Large
5- Very large
3.11.14 Ear circumference (cm)
Ear circumference was measured in cm at the central part of the uppermost ear.
According to their diameter, the test genotypes were classified into five
different categories as per descriptors.
1- Very small
2- Small
3- Medium
4- Large
5- Very large
Page 48
29
Figure 1. Descriptors of the ear
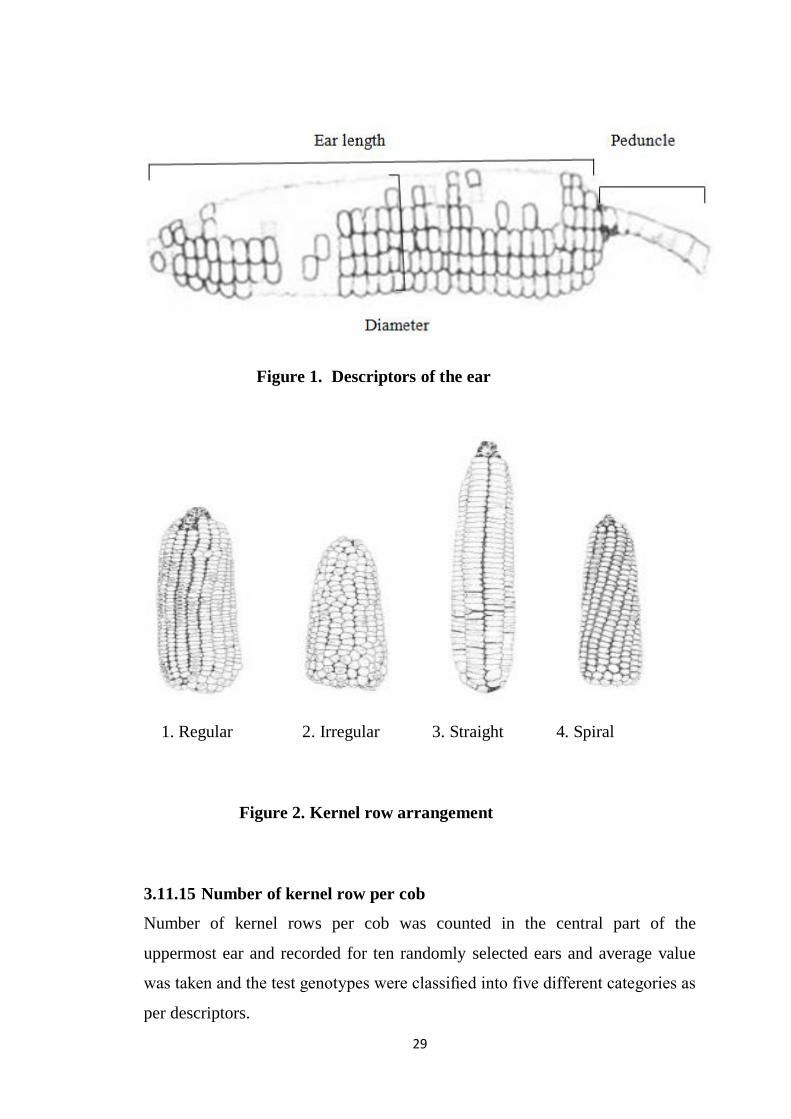
1. Regular 2. Irregular 3. Straight 4. Spiral
Figure 2. Kernel row arrangement
3.11.15 Number of kernel row per cob
Number of kernel rows per cob was counted in the central part of the
uppermost ear and recorded for ten randomly selected ears and average value
was taken and the test genotypes were classified into five different categories as
per descriptors.
Page 49
30
1- Very few
2- Few
3- Medium
4- Many
5- Very many
3.11.16 Kernel row arrangement
The uppermost ear was used to show kernel row arrangement. The test
genotypes were classified into three different categories as per descriptors
(Figure 2)
1- Straight
2- Spiral
3- Irregular
4- Regular
3.11.17 Number of kernels per row
Number of kernels per row was counted and recorded for ten randomly selected
ears and average value was taken.
3.11.18 Number of kernel per cob
Number of kernels per ear was counted and recorded for ten randomly selected
ears and average value was taken.
3.11.19 1000-kernel weights (g)
1000 kernel weights of samples was recorded along with their moisture
content by using moisture meter and then it was converted to fourteen percent
(14%) moisture content.
3.11.20 Total yield per plant
Randomly selected plants per replication were harvested, seeds were sun dried
for few days and weighed and then averaged. Seed yield was adjusted at 14%
moisture content.
Page 50
31
3.12 Statistical analysis
The genetic variability was computed based on the grand mean, mean squares
and error variances of the traits evaluated. An analysis of variance according to
randomized complete block design model was computed to derive mean
squares and their interaction with location using computer package
‘MSTATC’. LSD was applied at both 1% and 5% level of significance.
Heritability (h2) was calculated from the mean squares obtained from ANOVA.
3.12.1 Estimation of phenotypic and genotypic variance
Formula given by Chaudhary and Prasad (1968) was used to calculate
phenotypic and genotypic variance.
Genotypic variance (σ 2
g) = (TMSS – EMSS) / R
Error variance = σ 2
e
Phenotypic variance = σ 2
p = σ 2
g + σ 2
e
Where, TMSS is treatment mean sum of square
EMSS is error mean sum of square
R is number of replication
3.12.2 Estimation of genotypic and phenotypic coefficient of variation
(GCV and PCV)
They are expressed as percentage according to Burton & Devane (2008).
Genotypic coefficient of variation (GCV) = (σg/ X) × 100
Phenotypic coefficient of variation (PCV) = (σp/ X) × 100
Where, σg = Genotypic standard deviation
σp = Phenotypic standard deviation
= General mean of the trait
Page 51
32
As indicated by Sivasubramanjan & Menon (1973), GCV and PCV are
categorized as follows:
0 – 10 %: Low
10 – 20 %: Moderate
>20 %: High
3.12.3 Estimation of broad sense heritability (h2
b)
Hanson et al. (1956) estimated broad sense heritability as the ratio of genotypic
variance (Vg) to the phenotypic variance (Vp) and expressed in percentage.
Broad sense heritability (h2
b) = (V g /V p)
Robinson et al. (1949) categorized broad sense heritability as follows:
0 – 0.30: Low
0.30 – 0.60: Moderate
> 0.60: High
3.12.4 Estimation of genetic advance (GA)
It was calculated by using the following formula given by Robinson et al.
(1949).
GA = i. σp. h2b
Where, i = Efficacy of selection (2.06 at 5% selection intensity)
σp = Phenotypic standard deviation
h2
b = Broad Sense Heritability
3.12.5 Estimation of genetic advance as percent of means (GAM)
GA as per cent of mean (GAM) = (GA/ X) × 100
GA = Genetic advance; X =General mean of the trait
Johnson et al. (1955) categorized GAM as follows:
Page 52
33
0 - 10 %: Low
10 -20 %: Moderate
> 20 %: High
3.12.6 Estimation of genotypic and phenotypic correlation co-efficient
For calculating the genotypic and phenotypic correlation coefficient in all
possible combination the formula suggested by Johnson et al. (1955) and
Hanson et al. (1956) were adopted. The genotypic covariance components
between two traits and of the phenotypic covariance component were derived
in the same way as for the corresponding variance components. The covariance
components were used to compute genotypic and phenotypie correlation
between the pairs of the characters as follows:
Genotypic correlation =σ2
gxy/√σ2
gx+σ2
gy
Where, σ2
gxy= Genotypic covariance between the traits x and y.
σ2
gx= Genotypic variance of the trait x
σ2
gy= Genotypic variance of the trait y
Thus, Phenotypic correlation (rphxy) =σ2
phxy/√σ2
phx+σ2
phy
Where, σ2
phxy= Phenotypic covariance between the traits x and y.
σ2
phx= Phenotypic variance of the trait x
σ2
phy= Phenotypic variance of the trait y
3.12.7 Path co-efficient analysis
Path co-efficient analysis was done according to the procedure employed by
Dewey and Lu (1959) and Dabholkar (1992), using simple correlation values.
In path analysis, correlation co-efficient was partitioned into direct and indirect
effects of independent variables on the dependent variable.
Page 53
34
In order to estimate direct and indirect effect of the correlated characters, say
x1, x2, and x3 yield y, a set of simultaneous equations (three equations in this
example) is required to be formulated as shown below:
ryx1= Pyx1+ Pyx2rx1x2+Pyx3rx1x3
ryx2= Pyx1rx1x3+ Pyx2+ Pyx3rx2x3
ryx3= Pyx1rx1x3+ Pyx2rx2x3+ Pyx3
Pyx1= the direct effect of x1 on y
Pyx2rx1x2=the indirect effect of x1 via x2 on y
Pyx3rx1x3= the indirect effect of x1 via x3 on y
After calculating the direct effect and indirect effect of the characters, residual
effect (R) was calculated by using the formula given below:
P2
RY= 1-∑Piy.riy
Where, P2
RY= (R2) and hence residual effect, R= (P
2RY) 1/2
Piy= direct effect of the character on yield
riy= correlation of the character with yield
3.13. Multivariate analysis
Mean data for each character was subjected to multivariate analysis methods
viz, principal component analysis (PCA), principal coordinate analysis (PCO),
canonical variate analysis (CVA) and cluster analysis (CLSA) using
GENSTAT 4.2 program.
3.13.1 Principal component analysis (PCA)
Principal component analysis is one of the multivariate techniques to know
the interrelationships among several characters and can be done from the sum
of squares and product matrix for the characters. Principal components were
computed from the correlation matrix and genotypic scores obtained for the
Page 54
35
first component and succeeding components with latent roots greater than
unity (Jager et al., 1983).
3.13.2 Principal coordinates analysis (PCO)
Principal coordinate analysis is equivalent to PCA but it is used to
calculate inter-unit distances. Through the use of all dimensions of p it gives
the minimum distances between each pair of n points using similarity
matrix (Digby et al., 1989). Inter-distances between genotypes were studied
by PCO.
3.13.3 Canonical variate analysis (CVA)
The canonical variate analysis is based upon the roots and vectors of W-IB,
where W is the pooled within groups covariance matrix and B is the among
groups covariance matrix. It provides two-dimensional plots that helped in
separating different populations involved.
3.13.4 Cluster analysis (CLSA)
Genotypes were divided into groups on the basis of a data set into some
number of mutually exclusive groups. The clustering was done using non-
hierarchical classification. In GENSTAT, the algorithm is used to search for
optical values of the chosen criterion. The optimal values of the criteria
followed by some initial classification of the genotypes into required number of
groups, the algorithm repeatedly transfers genotypes from one group to
another so long as such transfer improved the value of the criterion. When no
further transfer can be found to improve the criterion, the algorithm switches to
second stage that examine the effect of two genotypes of different classes and
so on.
Page 55
36
3.13.5 Computation of average intra-cluster distance
Computation of average intra-cluster distance for each cluster was calculated
by taking possible D2 values within the members of a cluster obtained from the
PCO after the clusters are formed. The formula utilized was ∑ D2/n, where ∑
D2 is the sum of distances between all possible combinations (n) of the
genotypes included in a cluster. The square root of the average D2 values
represents the distance (D) within cluster.
3.13.6 Computation of average inter-cluster distances
The procedures of calculating inter-cluster distance between cluster II and I and
between cluster III and I and between I and IV, between II and IV and so on.
The clusters were taken one by one and their distances from other clusters were
calculated.
3.13.7 Cluster diagram
It was drawn using the values between and within clusters distances, which
presents a momentary idea of the pattern of diversity among the genotypes
included in a cluster.
Page 57
37
CHAPTER IV
RESULTS AND DISCUSSION
This chapter comprises the presentation and discussion of the findings obtained
from the study. The data pertaining to different qualitative and quantative traits
were recorded, computed and statistically analyzed and thus results are
described below under the following heads:
4.1 Characterizations of yield and yield contributing traits of maize genotypes
4.2 Correlation co-efficient analysis
4.3 Path co-efficient analysis
4.4 Genetic diversity of maize genotypes
4.1 Characterizations of yield and yield contributing traits of maize
genotypes
4.1.1 Variability in maize genotypes in respect of leaf number, length and
breadth
In case of leaves per plant, leaf length and leaf breadth; ANOVA were not
performed. For these three characters; mean value and pearson correlation were
performed and are described based on mean and correlation coefficients.
Differences of leaves of 25 maize genotypes are showed in Plate 2.
4.1.1.1 Leaves per plant
Maximum leaves per plant (24) were observed in G9 followed by G1, G7, G8,
G16 and G21, while minimum in G2 and G23 (20.67) (Appendix V). These
results are in line with those of Dijk et al. (1999) who observed significant
differences while evaluating maize genotypes for different morphological and
yield traits. Pearson correlation coefficient analysis showed that leaf per plant
Page 58
38
was highly significantly and positively correlated with leaf length, leaf breadth,
ear length, ear circumference and 1000-kernel weight (Table 3). Triveni et al.
(2014) found number of leaf per plant of maize highly significantly and
positively correlated with its grain yield. Results of this study imply that maize
grain yield can be improved, by considering number of leaf per plant.
4.1.1.2 Leaf length
Maximum leaf length was noted in G7 (102.22 cm) followed by G15, G1, G4,
and G3, while minimum in G16 (77.08 cm) (Figure 3 and Appendix V).
Pearson correlation coefficient analysis showed that leaf length was highly
significantly and positively correlated with leaves per plant; leaf breadth and
1000-kernel weight (Table 3). It’s positively correlated with yield per plant.
But it showed negative correlation with ear length and ear circumference
(Table 3). If length was increased then leaf area also was increased and
consequently more photosynthesis will take place which lead to vigorous
vegetative growth which resulted increased plant length, ear length and low
seed yield.
4.1.1.3 Leaf breadth
Maximum leaf breadth was noted in G12 (10.74 cm) followed by G8, G13, G5,
and G15, while minimum in G19 (8.68 cm) (Figure 3 and Appendix V).
Pearson correlation coefficient analysis showed that leaf breadth was highly
significantly and positively correlated with leaves per plant, leaf length, ear
length, ear circumference, 1000-kernel weight and yield per plant (Table 3).
Page 59
39
Plate 2. Photograph showing differences of leaves of 25 maize genotypes
Page 60
40
Table 3. Pearson correlation coefficient among different pairs of yield and
yield contributing characters for different genotypes of maize
Leaf
length
Leaf
breadth L/P EL EC TKW TYP
Leaf length 1
Leaf breadth 0.152** 1
L/P 0.236** 0.185** 1
EL -0.013 0.112** -0.119** 1
EC -0.012 0.192** -0.174** 0.666** 1
TKW 0.148** 0.355** 0.154** 0.440** 0.776** 1
TYP 0.079 0.338** 0.047 0.685** 0.850** 0.824** 1
** Significant at the 1% level of probability, * Significant at the 5% level of probability
L/P=Leaves per plant, EL=Ear length, EC=Ear circumference, TKW=1000-kernel weight and
TYP=Total yield per plant
Figure 3. Diagram shows the performance of different maize genotype in
respect of leaf length and leaf breadth
0
50
100
150
200
250
G1
G2
G3
G4
G5
G6
G7
G8
G9
G1
0
G1
1
G1
2
G1
3
G1
4
G1
5
G16
G1
7
G1
8
G19
G2
0
G2
1
G2
2
G2
3
G2
4
G2
5
Plant height Ear height
Page 61
41
4.1.2 Genetic variability, heritability and genetic advance in maize
genotypes
The genotypes differed significantly for all the characters (Table 4). The extent
of variation among the genotypes in respect of other 12 characters were studied
and mean value, range, genotypic variance (ơ2g), phenotypic variance (ơ
2p),
genotypic coefficient variation (GCV), phenotypic coefficient variation (PCV),
genetic advance (GA) and genetic advance in percent of mean have been
presented in Table 5 and Figure 4 & 5. The mean values of all genotypes for
each character are also shown in Appendix VI. Performances of the genotypes
are described below for each character.
4.1.2.1 Days to 50% tasseling
The analysis of variance showed that the genotypes varied significantly for
days to 50% tasseling (Table 4). The minimum and maximum duration for 50%
tasseling was observed in the genotype G5 (55.33 days) and G14 (63.33 days),
respectively (Appendix VI). The estimates of GCV (3.78) and PCV (4.18) were
low with very little difference which suggesting that the genotypes were less
variable for this trait (Table 5 and Figure 5). Heritability (59.46%) of this trait
was moderate; genetic advance (3.51) and GA% of mean was also low (6.00)
(Table 5 and Figure 4). It revealed non-additive gene action involved in the
maintenance of this trait and almost high heritability was exhibited due to
influence of favorable environment rather than genotypes, so selection may not
be rewarded. Grzesiak (2001) reported high heritability for days to 50%
tasseling and days to 50% silking. But Mohar et al. (1999) reported that days to
50% flowering showed higher estimates of heritability along with genetic
advance in lentil.
Page 62
42
Table 4. Mean sum of square from the ANOVA of 25 maize genotypes in respect of 12 characters
Characters
Mean sum of square
Degrees of
freedom
Co-variance
(%) Genotype Replication Error
Plant height (cm) 523.450** 107.062 79.546 48 4.10
Days to 50% tasseling 13.114** 0.973 3.334 48 3.12
Days to 50% silking 10.303** 5.293 2.543 48 2.63
Ear height (cm) 134.520** 11.640 10.223 48 4.18
Cobs per plant 0.015** 0.003 0.009 48 8.88
Ear length (cm) 9.851** 0.399 0.521 48 4.15
Ear circumference (cm) 5.827** 0.027 0.415 48 4.57
Number of kernel row per cob 4.025** 0.053 0.564 48 5.42
Number of kernel per row 76.086** 0.190 4.385 48 7.45
Number of kernel per cob 23476.690** 254.209 352.199 48 4.78
1000-kernel weight (g) 6839.250** 44.333 76.625 48 3.08
Total yield per plant (g) 2297.910** 104.460 36.889 48 5.24
** Significant at the 1% level of probability * Significant at the 5% level of probability
Page 63
43
4.1.2.2 Days to 50% silking
Days required to 50% silking along with other maturity traits are commonly
used by plant breeders as basis of determining maturity of maize. The mean
square due to genotypes differed significantly for days to 50% silking (Table
4). The mean for this character was 60.69 days, which ranged from 57 -
65.33 days. The minimum days required for 50% silking was in G5 (57 days)
and maximum days were for G14 (65.33 days) (Appendix VI). The phenotypic
variance (6.42) was higher than genotypic variance (3.88). So, environment
plays an important role for the expression of this trait. The genotypic (3.25)
and phenotypic (4.18) coefficient of variation were low with a little difference
indicates that environment had a little effect on the expression of this character
and genotypes were less variable (Table 5 and Figure 5). The heritability
(60.41%) of this trait was high and GA% was low (5.25) but genetic advance
(3.15) was also low (Table 5 and Figure 4). It revealed non-additive gene
action involved in the maintenance of this trait and high heritability was
exhibited due to influence of favorable environment, so selection may not be
rewarded. Neguly et al. (1983) observed that yield was indirectly affected by
days to 50% silking via ear height. High heritability (0.85) for the same was
recorded by Mulamba et al. (1983).
4.1.2.3 Plant height
Plant height is an important agronomic character for selecting desirable
genotype for breeding program (Ali et al., 2012). Significant mean sum of
square for plant height indicated considerable difference among the genotypes
studied (Table 4). Plant height ranged from 191.3 cm (G17) to 237.7 cm (G8)
with mean value 217.56 (Table 5 and Appendix VI). The phenotypic and
genotypic variances for this trait were comparatively high (301.50 and 221.95)
(Table 5). The phenotypic variance appeared to be higher than the genotypic
variance, suggested considerable influence of environment on the expression of
the genes controlling traits. The phenotypic coefficient of variation (7.98) was
higher than the genotypic coefficient of variation (6.85) (Table 5 and Figure 5),
Page 64
44
Figure 4. Heritability (%) and genetic advance in percent of mean
performance of twelve characters of maize genotypes
0
20
40
60
80
100
Heritability GA (%)
Page 65
45
Figure 5. Genotypic coefficient variation (GCV) and phenotypic coefficient
variation (PCV) performance of twelve characters of maize
genotypes
0
5
10
15
20
25
30
GCV PCV
Page 66
46
which indicated the environment has a significant role on the expression of
this trait. Heritability estimates was high (73.62%) with high genetic advance
(26.33) and moderate genetic advance in percent of mean (12.10) (Table 5 and
Figure 4) was considerable for this trait indicating apparent variation was due
to genotypes. So, selection based on this trait would be effective. Similar
findings were also reported by Alvi et al. (2003). Mihaljevic et al. (2005)
obtained high heritability values (0.90) for plant height. The greater the
heritability of a particular trait, the lesser will be the environmental effect on its
expression.
4.1.2.4 Ear height
Highly significant variations were observed among genotypes for ear height
(Table 4). Our results were in agreement with those of Abel and Pollak (1991).
While Genter and Alexander (1965) results after testcross evaluation are in
disagreement with our results. Ear height ranges from 60.67 cm (G16) to 89.33
cm (G7) with mean value 76.56 cm (Table 5 and Appendix VI). The
phenotypic and genotypic variance for this trait was comparatively high (72.37
and 62.15) (Table 5). The difference between variance suggested considerable
influence of environment on the expression of the genes controlling traits. The
phenotypic coefficient of variation (11.11) was higher than the genotypic
coefficient of variation (10.30) (Table 5 and Figure 5), which indicated the
environment has a significant role on the expression of this trait. Heritability
value for ear height in our experiment was moderately high (85.87%) with high
genetic advance (19.66) and moderate genetic advance in percent of mean
(15.06) (Table 5 and Figure 5) was considerable for this trait indicating
apparent variation was due to genotypes. Due to its high heritability it can
easily be improved by selection (Ali et al., 2011 and Alam, 1999). Similarly,
Ajmal et al. (2000) reported moderate heritability for ear height which is in line
with our finding.
Page 67
47
Table 5. Variability, heritability (h2
b), genetic advance (GA) and GA in percent of mean for 12 yield and its related characters
of maize
Traits Minimum Maximum Mean Genotypic
variance
(ơ2
g)
Phenotypic
variance
(ơ2
P )
GCV
(%)
PCV
(%)
Heritability
(h2
b)
GA GA
(%)
PH 191.3 237.7 217.56 221.95 301.50 6.85 7.98 73.62 26.33 12.10
D50T 55 63.33 58.51 4.89 8.22 3.78 4.90 59.46 3.51 6.00
D50S 57 65.33 60.69 3.88 6.42 3.25 4.18 60.41 3.15 5.20
EH 60.67 89.33 76.56 62.15 72.37 10.30 11.11 85.87 15.05 19.66
CPP 1 1.21 1.08 0.00 0.01 4.99 10.19 23.97 0.05 5.03
EL 15.07 21.67 17.38 4.67 5.19 12.43 13.10 89.95 4.22 24.28
EC 9.99 15.7 14.11 2.71 3.12 11.66 12.52 86.71 3.16 22.36
NKRC 11.04 15.6 13.85 1.73 2.29 9.50 10.94 75.43 2.35 16.99
KKR 16.27 40.4 28.12 35.85 40.24 21.29 22.56 89.10 11.64 41.40
NKC 216.7 591.4 392.94 11562.25 11914.44 27.36 27.78 97.04 218.21 55.53
TKW 143.3 340 284.53 3381.31 3457.94 20.44 20.67 97.78 118.45 41.63
TYP 47.1 153.4 115.85 1130.51 1167.40 29.02 29.49 96.84 68.16 58.84
PH= Plant height (cm), D50T= Days to 50% tasseling, D50S= Days to 50% silking, EH= Ear height (cm), CPP= Cobs per plant, EL=
Ear length (cm), EC= Ear circumference (cm), NKRC= Number of kernel row per cob, NKR= Number of kernel per row, NKC=
Number of kernel per cob, TKW=1000 kernel weight (g), TYP=Total yield per plant (g).
Page 68
48
4.1.2.5 Cobs per plant
Statistically cobs per plant showed significant variation in case of genotype
mean square (Table 4) but mean performance of genotypes showed almost
similar results (Appendix V). The phenotypic and genotypic variance for this
trait was minimum (0.00 and 0.01) (Table 5). The phenotypic coefficient of
variation (10.19) was higher than the genotypic coefficient of variation (4.99)
(Table 5 and Figure 5) which indicated that the environment has a significant
role on the expression of this trait. Heritability value for this trait in our
experiment was low (23.97%) with minimum genetic advance (0.05) and low
genetic advance in percent of mean (5.03) (Table 5 and Figure 4) which
indicating non additive gene action controlling this trait. So, selection based on
this trait would not be effective. Similar results were reported by Amer and
Mosa (2004) and Yassien (1993).
4.1.2.6 Ear length
There were significant variations among the genotypes based on the ear length
(Table 4). Ear length ranged from 15.07 cm to 21.67 cm which was observed
in G13 and G18, respectively. Average value for ear length was 17.38 cm
(Appendix V). Phenotypic variance (5.19) was higher than the genotypic
variance (4.67) as well as the phenotypic and genotypic coefficient of
variations was 13.10 and 12.43 (Table 5 and Figure 5 ) respectively, which
differed very little with each other indicating less influence of environment
on this trait. Heritability of this trait was high (89.95%) but genetic
advance was low (4.22) along with high genetic advance as a percentage of
mean (24.28) (Table 5 and Figure 4). The high heritability was exhibited due to
additive gene action involved in controlling for this trait and less influence of
environment that means selection may be effective. Naushad et al. (2007) was
observed significant variation in maize genotypes for ear length.
Page 69
49
4.1.2.7 Ear circumference
Ear circumference showed significant differences among the genotypes (Table
4). The highest ear circumference was found in G23 (15.70 cm) and lowest ear
circumference was found in G18 (9.99 cm) with mean value of 14.11 (Table 5
and Appendix VI). The phenotypic variance (3.12) was little different with
genotypic variance (2.71) (Table 5). The phenotypic coefficient of variance
(12.52) and the genotypic coefficient of variance (11.66) (Table 5 and Figure 5)
were moderate. Heritability estimates was high (86.71%), genetic advance was
very low (3.16) but genetic advance in percent of mean (22.36) was high
(Table 5 and Figure 4) which indicated a character was less influenced by
environmental effects and additive gene controlling the expression of this traits
and selection may be effective in early generations for these traits. Similar
results were reported by Ojo et al. (2006).
4.1.2.8 Number of kernel row per cob
Significant differences among the genotypes were observed due to number of
kernel row per cob (Table 4). The highest number of kernel row per cob was
15.6, produced by the G22 and the lowest number of number of kernel row
per cob was 11.04, produced by G18 and mean of this character was 13.85
(Appendix VI and Table 5). The phenotypic variance (2.29) was slightly
higher than genotypic variance (1.73) (Table 5 and Figure 5). Moderate
genotypic coefficient of variation (9.50) and phenotypic coefficient of
variation (10.94) (Table 5 and Figure 4) were found for this trait with a non-
significant difference which indicated that there was little environmental effect
on the expression of character.
Page 70
50
Plate 3: Photograph showing differences of cobs of 25 maize genotypes (numbers represent each genotype)
G1 G4 G5 G3 G2 G6 G7 G8
G25
G13 G12 G11 G10 G9
G20 G21 G22 G23 G24 G14 G15 G16 G17 G18 G19
Page 71
51
Plate 4. Photograph of different genotypes of maize which shows more than one cob per plant
G1 G2 G3 G4 G5 G6 G7
G8 G9 G10
G12
G14 G16 G19 G18 G17 G20
G21 G23 G24 G25
Page 72
52
The heritability was very higher (75.43%) together with low genetic advance
(2.35) and moderate genetic advance in percent of mean (16.99) indicating the
selection for this character would be effective (Table 5 and Figure 4). Similar
results were reported by Chen et al. (1996), Satyanarayan and Kumar (1995)
and Ojo et al. (2006). High heritability accompanied with moderate GA, GCV
and genetic advance in percent of mean indicates that most likely the
heritability is due to additive gene effects.
4.1.2.9 Number of kernel per row
Significant differences among the genotypes were observed due to number of
kernel per row (Table 4). The maximum number of kernel per row were found
(40.4) in the genotype G13 and minimum number of kernel per row were found
(16.27) in the genotype G18, (Appendix VI). The phenotypic variance (40.24)
was higher than genotypic variance (35.85) and the PCV (22.56) was also a
little greater than GCV (21.29) (Table 5 and Figure 5) indicating the role of
environment on the expression of this trait. The genetic advance was moderate
(11.64) with high genetic advance in percent of mean (41.40) for this trait
(Table 5 and Figure 4). Similar results were reported by Rather et al. (2003)
and Rajesh et al. (2013). Heritablity was found to be highest for this trait
(89.10%) (Table 5 and Figure 4), which indicated this character was less
influenced by environmental effects. High heritability accompanied with high
to moderate GCV and high genetic advance in percent of mean indicated that
most likely the heritability was due to additive gene effects and selection may
be effective in early generations for these traits. High heritability estimates for
number of kernel per row were also reported by Abd El-Sattar (2003).
4.1.2.10 Number of kernel per cob
Significant differences among the genotypes were observed for number of
kernel per cob (Table 4). The highest and the lowest number of kernel per cob
were produced by the G13 (591.3) and G18 (216.67) respectively and mean of
this character was 392.94 (Appendix VI). The phenotypic and genotypic
variance were high and the difference between the phenotypic variance
Page 73
53
(11914.44) and the genotypic variance (11562.25) were significant (Table 5).
High genotypic coefficient of variation (27.78) and phenotypic coefficient of
variation (27.36) (Table 5 and Figure 5) were found for this trait with a non-
significant difference which indicated that there was little environmental effect
on the expression of the character. This character showed high heritability
(97.04%) along with high genetic advance (218.21) and high genetic advance
in percent of mean (55.53) (Table 5 and Figure 4) indicated that the heritability
was due to additive gene effect and phenotypic selection might be effective.
Similar results were reported by Mahmud et al. (2004), Hemavathy et al.
(2008), and Anshuman et al. (2013).
4.1.2.11 1000-kernel weight
Significant differences among the genotypes were observed due to 1000-kernel
weight (Table 4). Maximum number of 1000-kernel weight was found in G11
(340.00 g) and minimum in G18 (143.33 g) with a mean value of 284.53
(Appendix VI). The phenotypic and genotypic variance was high and the
difference between the phenotypic variance (3457.94) and the genotypic
variance (3381.31) was not significant. Little influence of environment upon
this trait was reported due to difference between the estimation of GCV (20.44)
and PCV (20.67) which suggesting existing of sufficient variability and offers
scope for selection (Table 5 and Figure 5). High heritability (97.78%), high
genetic advance (118.45) and high genetic advance in percent of mean (41.63)
were found for this trait (Table 5 and Figure 4) which indicating very low or no
influence of environment and apparent variability due to additive gene and
selection may be effective in early generations for this trait 1000-kernel weight.
Similar results were reported by Anshuman et al. (2013). Similar results of
PCV and GCV values for this trait were reported by Abirami et al. (2005).
Page 74
54
4.1.2.12 Total yield per plant
The genotypes varied significantly for total yield per plant (Table 4). The
highest total yield per plant was observed in the genotype G13 (153.38 g) and
the lowest total yield per plant was observed in the genotype G14 (47.07 g)
(Appendix VI). The phenotypic variance (1167.40) differed slightly from
genotypic variance (1130.51) for this trait. Moderate genotypic (29.02) and
phenotypic (29.49) coefficient of variation and high heritability (96.84%) along
with high genetic advance (68.16) and high genetic advance in percent mean
(58.84) were estimated for this character (Table 5 and Figure 4 &5). All these
value of statistical analysis indicated that the characters were less influenced by
environment and additive gene involved in the expression and selection may be
effective in early generations for these traits. Similar results were reported by
Chen et al. (1996), Ojo et al. (2006), Mahmood et al. (2004), Hemavathy et al.
(2008) and Anshuman et al. (2013).
4.1.3 Categorization of genotypes based on morphological traits
In the present investigation different phenotypic traits were studied for 25
genotypes of maize according to the guidelines for the conduct of DUS test
(distinctiveness, uniformity, stability) and characterized (Table 6). All the
genotypes showed diversity among them indicating number of phenotypic
descriptors was able to discriminate between them. However, as reported by
Kumar et al. (2003) and Rana et al. (2005) in cotton and Kwon et al. (2005) in
pepper, the genetic diversity estimates were found to be of high magnitude for
maize.
Page 75
55
Table 6. Frequency distribution of genotypes belonging to different
phenotypic classes
Traits
Category
Total
genotypes
Genotype
Width of the leaf
blade (cm)
Very small 0 Nil
Small 0 Nil
Medium 4 G3, G18, G19, G23
large
21
G1, G2, G4, G5, G6, G7, G8,
G9, G10, G11, G12, G14, G15,
G16, G17, G20, G21, G22,
G24, G25
Plant height(cm)
Short 0 Nil
Medium 0 Nil
Medium long 4 G16, G17, G18, G22
Long 13 G1, G2, G3. G6, G9,G11 G12,
G13, G19, G20,G21,G23, G25
Very long 8 G4,G5, G7,G8, G10, G14, G15,
G24
Ear placement
(cm)
Short
23
G1, G2, G3, G4, G5, G6, G7,
G8, G9, G10, G11, G12, G14,
G15, G16, G17, G19, G20,
G21, G22, G23, G24, G25
Medium 2 G13 and G18
Medium long 0 Nil
Long 0 Nil
Very long 0 Nil
Time of anthesis
Very early 0 Nil
Early 3 G18, G5, G7
Medium
22
G1, G2, G3, G4, G6, , G8, G9,
G10, G11, G12, G13, G14,
G15, G16, G17, , G19, G20,
G21, G22, G23, G24, G25
Late 0 Nil
Very late 0 Nil
Page 76
56
Table 6 (cont’d).
Time of silk
emergence
Very early
14
G2, G3, G4, G5, G6, G7, G9,
G11, G12, G18, G20, G21,
G22, G25
Early 10 G1, G8, G10, G13, G15, G16,
G17, G19, G23, G24
Medium 1 G14
Late 0 Nil
Very late 0 Nil
Color of top
grain
Pure white 1 G6
Brown 11 G1, G2, G4, G5. G7, G14, G17,
G18, G19, G22, G9
Yellow
14
G3, G8, G10, G11, G12, G13,
G15, G16, G20, G21, G23,
G24, G25
Ear shape
Conical 10 G3, G4, G12, G15, G17, G18,
G19,G21, G22, G25
Conical-
cylindrical
10 G1, G2, G5, G6, G10, G11,
G13, G16, G20, G24
Cylindrical 5 G7, G8, G9, G14, G23
Ear
circumference
without husk
(cm)
Very small 0 Nil
Small 0 Nil
Medium 0 Nil
Large 0 Nil
Very large
25
G1, G2, G3, G4, G5, G6, G7,
G8, G9, G10, G11, G12, G13,
G14, G15, G16, G17, G18,
G19, G20, G21, G22, G23,
G24, G25
Ear length
(cm)
Very small 1 G7
Small
16
G1, G2, G3, G4, G5, G6, G8,
G9, G10, G12, G14, G15, G17,
G18, G19, G20
Medium 6 G11, G16, G21, G22, G24, G25
Large 2 G13,G23
Very large 0 Nil
Page 77
57
Table 6 (cont’d).
Number of
rows of
kernel per
cob
Very few 0 Nil
Few 0 Nil
Medium 10 G1,G2, G3,G7, G8, G9, G14,
G18, G19, G20
Many
15
G4, G5, G6, G10,G11, G12,
G13, G15, G16, G17, G21,
G22, G23, G24, G25
Very many 0 Nil
Kernel row
arrangement
Straight
18
G2, G3, G4, G5, G6, G9, G10,
G11, G12, G13, G15, G16,
G17, G20, G21, G22, G24, G25
Spiral 3 G1, G7, G14
Irregular 4 G8, G18, G19, G23
1000-kernel
weight (g)
10-15g 1 G18
15.1-20g 2 G9. G14
20.1-25g 0 Nil
25.1-30g 10 G2, G3, G4, G5, G7, G8, G15,
G16, G23, G24
30.1-35g 12 G1, G6, G10, G11, G12, G13,
G17,G19, G20, G21, G22, G25
35.1-40g 0 Nil
Page 78
58
4.2 Correlation coefficients analysis
Yield is a complex character and associated with several yield contributing
characters. Selection for yield may not be effective unless other yield
components influencing it directly or indirectly are taken into consideration.
When selection pressure is exercise for improvement of any character highly
associated with yield, it simultaneously affects a number of other correlated
traits. Hence knowledge regarding association of characters with yield and
among themselves provides guideline to the plant breeder for making
improvement through selection. Genotypic and phenotypic correlations
between pairs of characters are presented in Table 7. The genotypic correlation
coefficients were higher than the corresponding phenotypic correlation
coefficients in most of the cases indicating the association is largely due to
genetic reason. The results are discussed character wise as follows:
4.2.1 Days to 50% tasseling
Days to 50% tasseling showed highly significant positive correlation with days
to 50% silking at both the genotypic and phenotypic level. It showed non-
significant positive correlation with cobs per plant, ear length, ear
circumference, number of kernel per row and number of kernel per cob for both
genotypic and phenotypic levels (Table 7). Non-significant negative
phenotypic and genotypic correlation was also observed with ear height,
number of kernel row per cob, 1000-kernel weight and total yield per plant
(Table 7). Similar findings were reported by Kumar et al. (2014). This means
with more days to 50% tasseling and silking there will be more vegetative
growth and less time for reproductive growth which consequently results in
fewer yields. Similar observation was noted by Kwaga (1994). This is
somewhat in disagreement with the findings of Sumathi et al. (2005) who
reported highest significant positive correlation between grain yield and days to
anthesis in maize.
Page 79
59
Table 7. Genotypic (rg) and phenotypic (rp) correlation coefficients among different pairs of yield and yield contributing
characters for different genotypes of maize
Ch D50T D50S EH CPP EL EC NKRC NKR NKC TkW TYP
PH
rg 0.469 0.378 0.430* -0.514 -0.059 0.162 0.093 0.119 0.053 0.065 -0.029
rp 0.379 0.304 0.416* -0.283 -0.021 0.152 0.076 0.116 0.054 0.058 -0.015
D50T
rg 0.924** -0.003 -0.068 0.065 0.107 -0.063 0.013 -0.002 -0.087 -0.018
rp 0.863** -0.004 0.035 0.048 0.086 -0.043 0.030 0.015 -0.073 -0.026
D50S
rg
0.047 -0.205 0.078 -0.005 -0.171 -0.127 -0.124 -0.319 -0.230
rp 0.018 -0.036 0.056 -0.004 -0.103 -0.086 -0.095 -0.281 -0.209
EH
rg 0.086 -0.157 -0.362 -0.302 -0.145 -0.218 -0.213 -0.358
rp 0.041 -0.143 -0.336 -0.275 -0.127 -0.200 -0.200 -0.342
CPP
rg
-0.832** -0.859** -0.643* -0.581 -0.688* -0.327 -0.539
rp
-0.532** -0.613** -0.494* -0.388 -0.444* -0.211 -0.352
EL
rg 0.695** 0.681** 0.581** 0.671** 0.450* 0.706**
rp 0.666** 0.634** 0.559** 0.652** 0.440* 0.686**
EC
rg 0.801** 0.726** 0.702** 0.810** 0.879**
rp
0.757** 0.677** 0.680** 0.776** 0.851**
NKRC
rg
0.908** 0.975** 0.606** 0.853**
rp 0.839** 0.909** 0.557** 0.800**
NKR
rg 0.966** 0.647** 0.853**
rp 0 .944** 0.625** 0.829**
NKC
rg 0.526** 0.827**
rp 0.523** 0.819**
TKW
rg 0.834**
rp
0.824** **Significant at the 1% level of probability.*Significant at the 5% level of probability. rg= genotypic correlation, rp= phenotypic correlation
PH= Plant height (cm), D50T= Days to 50% tasseling, D50S= Days to 50% silking, EH= Ear height (cm), CPP= Cobs per plant, EL= Ear length (cm), EC= Ear
circumference (cm), NKRC= Number of kernel row per cob, NKR=Number of kernel per row, NKC=Number of kernel per cob, TKW=1000-kernel weight (g), TYP=Total
yield per plant (g).
Page 80
60
4.2.2 Days to 50% silking
Days to 50% silking did not showed any significant positive correlation for all
characters at both the genotypic and phenotypic level (Table 7). But it showed
non-significant positive correlation with ear height, ear length for both
genotypic and phenotypic levels. Non-significant negative phenotypic and
genotypic correlation was also observed with cobs per plant, ear circumference,
number of kernel row per cob, number of kernel per cob, number of kernel per
row, 1000-kernel weight and total yield per plant (Table 7). Similar findings
were reported by Kumar et al. (2014). This means with least days to 50%
tasseling and silking there will be less vegetative growth and more time for
reproductive growth which consequently results in higher yields. But Afzal et
al. (2005) reported that days to silking showed positive correlation with grain
yield per plant.
4.2.3 Plant height
Plant height showed highly significant positive correlation with ear height at
both the genotypic and phenotypic level (Table 7). It showed non-significant
positive correlation with days to 50% tasseling, days to 50% silking, ear
circumference, number of kernel row per cob, number of kernel per row,
number of kernel per cob and 1000-kernel weight for both genotypic and
phenotypic levels. Non-significant negative phenotypic and genotypic
correlation was also observed with cobs per plant, ear length and total yield per
plant (Table 7). Mohammadi et al. (2003); Ojo et al. (2006); Sadek et al.
(2006) and Abou-Deif (2007) reported that plant height was significantly and
positively correlated with each of number of rows per ear and ear height.
However, Srekove et al. (2011) reported negative correlation between grain
yield and plant height.
Page 81
61
4.2.4 Ear height
Ear height showed highly significant positive correlation with plant height at
both the genotypic and phenotypic level (Table 7). But it showed non-
significant positive correlation with days to 50% silking, cobs per plant for
both genotypic and phenotypic levels. Non-significant negative phenotypic and
genotypic correlation was observed with days to 50% tasseling, ear length, ear
circumference, number of kernel row per cob, number of kernel per cob,
number of kernel per row, 1000-kernel weight and total yield per plant (Table
7). Lackney and Russell (1971) observed that ear height was significantly
correlated with yield at low, intermediate and high plant densities. Burgess and
West (1993) reported that for low ear height, grain yield had declined 29% in
Tennesse Late Low-Ear synthetic. Ear height showed significant and positive
phenotypic correlations with each of number of rows per ear and ear
circumference; on the other hand, it was significantly and negatively correlated
with number of kernel per row (Amin et al. 2003; Sadek et al. 2006 and Abou-
Deif 2007).
4.2.5 Cobs per plant
Cobs per plant showed highly significant negative correlation with ear length,
ear circumference, number of kernel row per cob and number of kernel per cob
at both the genotypic and phenotypic level (Table 7). It did not showed any
significant positive correlation for both genotypic and phenotypic levels. Non-
significant negative phenotypic and genotypic correlation was also observed
with plant height, days to 50% tasseling, days to 50% silking, number of kernel
per row, 1000 kernel weight and total yield per plant (Table 7).
4.2.6 Ear length
Ear length showed highly significant positive correlation with cobs per plant,
ear circumference, number of kernel row per cob, number of kernel per row,
number of kernel per cob, 1000-kernel weight and total yield per plant at both
the genotypic and phenotypic level (Table 7). It showed non-significant
Page 82
62
positive correlation with days to 50% tasseling and days to 50% silking for
both genotypic and phenotypic levels. Non-significant negative phenotypic and
genotypic correlation was also observed with ear height and plant height (Table
7). Rafique et al. (2004) reported positive correlations of ear length with grain
yield per ha. EL-Beially, (2003); Mohammadi et al. (2003) and Sadek et al.
(2006) found significant and positive correlations with 100-kernel weight and
number of kernel per row while negative correlations with number of rows per
ear and ear circumference with ear length.
4.2.7 Ear circumference
Ear circumference showed highly significant positive correlation with cobs per
plant, ear length, number of kernel row per cob, number of kernel per row, and
number of kernel per cob, 1000-kernel weight and total yield per plant at both
the genotypic and phenotypic level (Table 7). It showed non-significant
positive correlation with plant height and days to 50% tasseling for both
genotypic and phenotypic levels (Table 7). Non-significant negative
phenotypic and genotypic correlation was also observed with days to 50%
silking and ear height (Table 7). Such results were in harmony with those
obtained by Salama et al., (1994) and Yasien (2000).
4.2.8 Number of kernel row per cob
Number of kernel row per cob showed highly significant positive correlation
with ear length, ear circumference, number of kernel per row, number of kernel
per cob, 1000-kernel weight and total yield per plant at both the genotypic and
phenotypic level (Table 7). It showed highly significant negative correlation
with cobs per plant at both the genotypic and phenotypic level (Table 7). It
showed non-significant positive correlation with plant height for both
genotypic and phenotypic levels. Non-significant negative phenotypic and
genotypic correlation was also observed with days to 50% tasseling, days to
50% silking and ear height (Table 7). Our results disagree with EL-Hosary et
al. (1989); Amin et al. (2003); EL-Beially (2003) and Mohammadi et al.
Page 83
63
(2003) who found number of rows per ear showed significant and negative
correlations with 1000-kernel weights and number of kernel per row.
4.2.9 Number of kernel per row
Number of kernel per row showed highly significant positive correlation with
ear length, ear circumference, number of kernel row per cob, number of kernel
per cob, 1000-kernel weight and total yield per plant at both the genotypic and
phenotypic level (Table 7). It showed non-significant positive correlation with
plant height and days to 50% tasseling for both genotypic and phenotypic
levels. Non-significant negative phenotypic and genotypic correlation was also
observed with days to 50% silking, ear height and cobs per plant (Table 7).
Amin et al. (2003) indicated that number of kernels per row and 100- kernel
weight were the highest contributors to variation in grain yield directly or
indirectly.
4.2.10 Number of kernel per cob
Number of kernel per cob showed highly significant positive correlation with
ear length, ear circumference, number of kernel row per cob, number of kernel
per row, number of kernel per cob, 1000-kernel weight and total yield per plant
at both the genotypic and phenotypic level (Table 7). It showed highly
significant negative correlation with cobs per plant at both the genotypic and
phenotypic level (Table 7). It showed non-significant positive correlation with
plant height and days to 50% tasseling for both genotypic and phenotypic
levels. Non-significant negative phenotypic and genotypic correlation was also
observed with days to 50% silking and ear height (Table 7). Alvi et al. (2003)
and Sofi and Rather (2007) also found strong association between grain yield
and kernel row number.
Page 84
64
4.2.11 1000-kernel weight
Highly significant positive correlation were observed between 1000-kernel
weight with ear length, ear circumference, number of kernel row per cob,
number of kernel per row, number of kernel per cob and total yield per plant at
both the genotypic and phenotypic level (Table 7). It showed non-significant
positive correlation with plant height for both genotypic and phenotypic levels.
Non-significant negative phenotypic and genotypic correlation was also
observed with days to 50% tasseling, days to 50% silking, ear height and cobs
per plant (Table 7). Grain yield is considered to have positive correlation with
plant height and hundred kernel weight (Ajmal et al., 2000). Sumathi et al.
(2005) also found medium strong correlative relation between these two traits,
but that relation was negative, while the majority of authors (Alvi et al. 2003;
Sofi and Rather 2005; Bocanski et al. 2009) who studied relation between these
two traits established strong correlations between grain yield and 100-kernel
weight.
4.3 Path co-efficient analysis
Association of character determined by correlation co-efficient might not
provide an exact picture of the relative importance of direct and indirect
influence of each of yield components on total yield per plant. As a matter of
fact, in order to find out a clear picture of the inter-relationship between total
yield per plant and other yield attributes, direct and indirect effects were
worked out using path analysis at genotypic level which also measured the
relative importance of each component. Total yield per plant was considered as
reluctant (dependent) variable and plant height, days to 50% tasseling, days to
50% silking, ear length, ear circumference, number of kernel row per cob,
number of kernel per row, number of kernel per cob, 1000-kernel weight were
casual (independent) variables. Estimation of direct and indirect effect of path
co-efficient analysis for maize was presented in Table 8.
Days to 50% tasseling, ear length, ear circumference, number of kernel per cob,
1000-kernel weight showed positive direct effect and plant height, days to 50%
Page 85
65
silking, number of kernel row per cob, number of kernel per row showed
negative direct effect on total yield per plant (Table 8). Zarei et al. (2012)
reported similar result.
Plant height showed positive indirect effects on ear length but it showed
negative indirect effect on days to 50% tasseling, days to 50% silking, ear
circumference, number of kernel row per cob, number of kernel per row,
number of kernel per cob and 1000-kernel weight (Table 8). Plant height is an
important trait that effect grain yield. Taller plants need more plant nutrients to
complete more vegetative growth than reproductive phase that results in late
maturation of cob. The results indicated that plant height had negative direct
effect (-1.7514) on yield because of its negative indirect effect through ear
length and grain weight (Emer, 2011 and Mohan et al. 2002)
Path analysis showed that days to 50% tasseling had positive indirect effects on
plant height, days to 50% silking, ear length, ear circumference and number of
kernel per row (Table 8). It showed negative indirect effect on number of
kernel per cob and 1000-kernel weight. Days to 50% silking showed positive
indirect effects on ear circumference, number of kernel row per cob, number of
kernel per row, number of kernel per cob and 1000-kernel weight (Table 8).
It was found that ear length had positive indirect effect on days to 50%
tasseling, days to 50% silking, ear circumference, number of kernel row per
cob, number of kernel per row, number of kernel per cob and 1000-kernel
weight (Table 8). Its indirect effects via plant height and grain weight were also
negative (Parh et al., 1986). Ear circumference had positive indirect effects on
plant height, days to 50% tasseling, ear length, number of kernel row per cob,
number of kernel per row, number of kernel per cob and 1000-kernel weight
and it showed negative indirect effect on days to 50% silking (Table 8).
Wannows et al. (2010) reported similar findings. These results coincide with
those obtained by Amin et al. (2003); AL-Ahmad, (2004) and Sadek et al.
(2006).
Page 86
66
Table 8. Path coefficient analysis showing direct and indirect effects of different characters on yield of maize
Characters
Indirect effect Genotypic
correlation
with yield PH D50T D50S EL EC NKRC NKR NKC TKW
PH -0.099 -0.047 -0.038 0.006 -0.016 -0.009 -0.011 -0.005 -0.006 -0.015
FDT 0.379 0.808 0.747 0.052 0.087 -0.051 0.011 -0.002 -0.070 -0.026
FDS -0.389 -0.952 -0.103 -0.080 0.005 0.176 0.131 0.128 0.329 -0.209
EL -0.010 0.011 0.013 0.171 0.118 0.116 0.099 0.115 0.077 0.685**
EC 0.140 0.092 -0.004 0.602 0.866 0.693 0.628 0.608 0.701 0.851**
NKRC 0.089 0.061 0.165 -0.656 -0.772 -0.963 -0.875 -0.939 -0.584 0.800**
NKR -0.007 -0.001 0.008 -0.036 -0.045 -0.056 -0.062 -0.060 -0.040 0.829**
NKC 0.056 -0.002 -0.130 0.703 0.736 0.102 0.101 0.104 0.550 0.819**
TKW -0.008 0.011 0.039 -0.055 -0.099 -0.075 -0.079 -0.065 0.532 0.824**
Residual effect = 0.063 ** Significant at the 1% level of probability.
PH=Plant height (cm) , D50T= Days to 50% tasseling, D50S= Days to 50% silking, EL=Ear length (cm), EC= Ear circumference
(cm), NKRC= Number of kernel row per cob, NKR=Number of kernel per row, NKC=Number of kernel per cob, TKW=1000-kernel
weight (g), TYP=Total yield per plant (g).
Page 87
67
Path analysis revealed that kernel row per cob had positive indirect effect on
days to 50% tasseling, days to 50% silking and it showed negative indirect
effect on plant height, ear length, ear circumference, number of kernel per row,
number of kernel per cob and 1000-kernel weight (Table 8). These results were
in agreement with results which Ahmad and Saleem (2003) and Najeeb et al.
(2009) found in their research. Rafiq et al. (2010) also found positive direct
effect of kernel row number on grain yield, but it wasn’t significant.
Number of kernel per row showed positive indirect effects on days to 50%
silking but it showed negative indirect effect on plant height, days to 50%
tasseling, ear length, ear circumference, number of kernel row per cob, number
of kernel per row, number of kernel per cob and 1000-kernel weight (Table 8).
Number of kernel per cob showed positive indirect effects on plant height, ear
length, ear circumference, number of kernel row per cob, number of kernel per
row and 1000-kernel weight (Table 8). But it showed negative indirect effect
on days to 50% tasseling, days to 50% silking (Table 8). Nemati et al. (2009)
reported that ear weight has direct effect on grain yield.
Path analysis showed that 1000-kernel weight had positive indirect effects on
days to 50% tasseling and days to 50% silking (Table 8). It showed negative
indirect effect on plant height, ear height, ear length, ear circumference,
number of kernel row per cob, number of kernel per row and number of kernel
per cob (Table 8).
Page 88
68
4.4 Genetic diversity of maize genotypes
Diversity is the function of parent selection and also heterosis. The availability
of transgressive segregants in a breeding programme depends upon the
divergence of parents. Thus, the accurate information on the nature and degree
of diversity of the parents is the pre-requisite of an effective breeding
programme. The knowledge of genotypic variation within genotypes in relation
to morphology, phenology and yield would help to screen better genotypes for
hybridization programme.
4.4.1 Multivariate analysis
Genetic diversity of 25 maize varieties was determined by using the
multivariate analysis and the result are presented in Table 9 to Table 15 and
Figure 6 & 7 and discussed under the following headings:
4.4.1.1 Principal Component Analysis
Eigen values and latent vectors of corresponding twelve principal component
axes and percentage of total variation accounting for them obtained from the
principal component analysis are presented in Table 9. Eigen values represents
that the cumulative eigen values of first six principal components accounted for
96.93 per cent of the total variation among the varieties. The first principal
component accounted for 47.63% of the total variation, the second, third,
fourth, fifth and sixth components accounted for 18.12%, 10.97%, 7.48%,
6.07% and 4.56% of the total variation respectively. The rest of the
components accounted for only 3.07% of the total variation.
Page 89
69
Table 9. Eigen values and yield percent contribution of 12 characters of 25
genotypes of maize
Principal component axes Eigen
values
Percent
variation
Cumulative % of
percent variation
I 5.716 47.63 47.63
II 2.174 18.12 65.75
III 1.316 10.97 76.72
IV 0.898 7.48 84.2
V 0.728 6.07 90.27
VI 0.547 4.56 94.83
VII 0.252 2.1 96.93
VIII 0.15 1.25 98.18
IX 0.101 0.84 99.02
X 0.066 0.55 99.57
XI 0.034 0.28 99.85
XII 0.017 0.15 100.00
Page 90
70
4.4.1.2 Construction of scatter diagram
Based on the values of principal component scores l and 2 (Table 10) obtained
from the principal component analysis, a two- dimensional scatter diagram,
using component score 1 as X-axis and component score 2 as Y- axis was
constructed, which has been presented in Figure 6. The position of the varieties
in the scatter diagram was apparently distributed. The distribution of 25
varieties based on their principle component score and superimposed with
clusters indicated that the varieties were apparerently distributed into five
groups (Figure 6). The scattered diagram for the maize genotype of five
clusters revealed that the varieties Khaibhutta, PAC-399, BARI Misti Bhutta
1,PAC-984, Barnali, VB-100 and 4536 were distantly located which suggesting
more diverged from rest of the varieties.
Page 91
71
Figure 6. Scatter distribution of 25 maize varieties based on their principal
component scores superimposed with clusters
Page 92
72
Table 10. Pricipal component scores of 25 genotype
Genotype
number Genotype name PC1 PC2
G1 BHM-3 -3.83 25.37
G2 BHM-5 28.44 10.05
G3 BHM-6 2.25 -6.15
G4 BHM-7 4.05 1.76
G5 BHM-9 -22.18 -4.09
G6 SHUVRA 27.79 28.67
G7 BM-1 49.65 21.79
G8 BM-6 9.38 9.48
G9 KHAIBHUTTA 122.38 -63.08
G10 BHM-8 -17.87 19.65
G11 NK-40 -35.97 50.82
G12 PACIFIC11 -52.79 21.54
G13 PAC-399 -196.21 -52.28
G14 BARI MISTI BHUTTA-1 184.5 -59.2
G15 PAC-984 -114.76 -44.53
G16 DEKALB SUPER GOLD -47.04 -12.97
G17 DEKALB 962 -27.38 13.39
G18 KHAI BHUTTA 224.71 -72.76
G19 BARNALI 117.68 65.88
G20 VB-100 93.69 85.93
G21 PACIFIC 98 -82.72 15.77
G22 4536 -157.79 -36.21
G23 DEKALB 9120 -27.29 -36.7
G24 VA-786 -31.72 5.25
G25 PROFIT -46.97 12.63
Page 93
73
4.4.1.3 Principal coordinate analysis
Principal coordinate analysis (PCO) was performed on auxiliary principal
component analysis. This analysis helps in estimating distances (D2) for all
combinations between pairs of varieties. The highest inter genotype distance
(2.001) was observed between the genotype G13 and G18 followed by the
genotype G18 and G22 (1.841). The tenth highest pair distance was (1.629)
observed between genotype G14 and G22. The lowest distance (0.135) was
observed between the genotypes G24 and G25 followed by the varieties
genotype G21 and G25 (0.153). The tenth lowest distance (0.187) was
observed between the genotype G4 and G10. The difference between the
highest and the lowest inter-genotypes distance indicated the prevalence of
variability among the 25 varieties of maize (Table 11).
Page 94
74
Table 11. Ten of each lower and higher inter genotypic distances (D2)
between pairs of maize varieties
10 highest inter genotypic distances 10 lowest inter genotypic distances
Sl Genotypes Genotypes Values Sl Genotypes Genotypes Values
1 G13 G18 2.001 1 G24 G25 0.135
2 G18 G22 1.841 2 G21 G25 0.153
3 G13 G14 1.785 3 G11 G25 0.154
4 G15 G18 1.755 4 G4 G5 0.162
5 G18 G21 1.744 5 G6 G7 0.168
6 G11 G18 1.684 6 G11 G24 0.169
7 G18 G25 1.679 7 G5 G10 0.174
8 G12 G18 1.647 8 G11 G21 0.179
9 G18 G24 1.632 9 G11 G12 0.185
10 G14 G22 1.629 10 G4 G10 0.187
Page 95
75
4.4.1.4 Non-hierarchical clustering
With the application of co-variance matrix for non-hierarchical clustering, 25
maize genotypes were grouped into 5 different clusters (Table 12), Cluster IV
had maximum 10 genotypes (G5, G10, G11, G12, G16, G17, G21, G23, G24
and G25) followed by cluster I which had 7 genotypes (G1, G2, G3, G4, G6,
G7 and G8). Cluster III and Cluster V which had 3 genotypes of each (G13,
G15, and G22) and (G9, G14 and G18) respectively, Cluster II comprises with
two genotypes (G 19 and G 20). These results confirmed the clustering pattern
of the genotypes according to the principal component analysis. Composition
of different clusters with their corresponding genotypes and collection site
included in each cluster are presented in Table 12. Results of different
multivariate techniques were superimposed in Figure 6. The clustering pattern
obtained coincided with the apparent grouping patterns performed by PCA. It is
clear from the above that the results obtained through PCA were supported by
non-hierarchical clustering.
4.4.1.5 The intra-cluster distances
The intra-cluster distances were computed by the values of intra-genotypic
distance matrix of PCO according to Singh and Chowdhury (2001). There were
marked variations in intra-cluster distances, which ranged from 0.760 to 2.184
(Table 13). The magnitudes of the intra-cluster distances were not always
proportional to the number of genotypes in the clusters. In the present study it
was found cluster IV composed of the largest number of genotypes (10) and
their intra-cluster distances were 1.471 among the five clusters (Table 13 and
Figure 7). The intra-cluster distances in all the 5 clusters were more or less low
which indicated the genotypes within the same cluster were closely related. The
highest intra-cluster distances was computed for cluster II (2.184) composed of
2 genotypes followed by the cluster I (2.031) composed of 7 genotypes.
However the lowest value (0.760) of intra-cluster distance in cluster V
indicated three genotypes constituted this cluster might have diverged
characters. This contributed to the formation of this cluster (Table 13 and
Figure 7).
Page 96
76
Table 12. Distribution of 25 maize genotypes into five different clusters
Cluster Population
size
Genotype number Genotype name
I
7
G1, G2, G3, G4,
G6, G7 and G8
BHM-3, BHM-5, BHM-6, BHM-7,
SHUVRA, BM-1 and BM-6
II 2 G19 and G20 BARNALI and VB-100
III 3 G13, G15 and G22 PAC-399, PAC-984 and 4536
IV
10
G5, G10, G11,
G12, G16, G17,
G21, G23, G24 and
G25
BHM-9, BHM-8, NK-40, PACIFIC11,
DEKALB SUPER GOLD, DEKALB
962, PACIFIC 98, DEKALB 9120,
VA-786 and PROFIT
V 3 G9, G14 and G18 KHAIBHUTTA, BRRI MISTI
BHUTTA-1 and KHAI BHUTTA
Table 13. Average inter cluster distance (D2) and intra-cluster distance
(bold) for 25 varieties of maize
Cluster I II III IV V
I 2.031 6.478 9.463 2.870 8.498
II 2.184 15.662 8.685 11.458
III 1.726 6.981 14.060
IV 1.471 10.522
V 0.760
Page 97
77
4.4.1.6 Canonical variate analysis
Canonical variate analysis was performed to obtain the inter-cluster distances.
These values of inter-cluster distance (D2) are presented in Table 13. Statistical
distances represent the index of genetic diversity among the clusters. The inter-
cluster distances were bigger than the intra-cluster distances suggesting wider
genetic diversity among the varieties of different groups. The inter-cluster
distance was maximum between cluster II and III (15.665) followed by the
distance between cluster III and V (14.060), II and V (11.458), IV and V
(10.522), I and III (9.463), I and V (8.498). The distance was minimum
between cluster I and IV (2.870) followed by cluster I and II (6.478), whereas a
similar distance was found between II and IV (8.685) and III and IV (8.685),
suggesting a close relationship among those clusters (Figure 7). The maximum
values of inter-cluster distance indicated that the varieties belonging to cluster
II were far diverged from those of cluster III. Similarly, the higher inter-cluster
values between clusters III and V, II and V, IV and V, I and III, I and V,
indicated the varieties belonging to each pair of clusters was far diverse. These
relations were also reflected in the scatter diagram (Figure 6). The varieties
belonging to the distant clusters could be used for further base population
improvement. Similar reports were also made by Mokate et al. (1998). The
varieties belonging to cluster II and III having greater inter-cluster distance are
recommended for inclusion in a hybridization program as they are expected to
produce good segregant. Thus it could be suggested that crosses should be
made between varieties belonging to the distant clusters for higher heterotic
response.
Page 98
78
Figure 7. Diagram showing intra and inter cluster distances of twenty five
maize varieties
Page 99
79
4.4.1.7 Intra-cluster mean
An attempt was made to characterize the individual genotype in respect of their
mean values for different characters with a view to get idea that weather
genotypes having similar characteristics could be disseminated. The mean
values for all the characters along with the marking of the highest (H) and
the lowest (L) for each of the cluster are presented in Table 14. The data
revealed that different clusters exhibited different mean values for almost all
the characters.
Cluster I (constituted 7 genotypes) produced the highest mean for plant height
(222.5 cm) and ear height (80 cm) (Table 14).
Cluster II produced the highest mean for 1000-kernel weight (316.7 g). But the
lowest mean for days to 50% tasseling (57.5 days) and days to 50% silking
(59.8 days), plant height (208.7 cm) and ear height (72.5 cm). That means the
genotypes of this cluster were early maturing genotype with short plant (Table
14).
It was observed that cluster III produced the highest mean for ear length (19
cm), ear circumference (15 cm), number of kernel row per cob (15.3), number
of kernel per row (36.7), number of kernel per cob (552.4) and total yield per
plant (142.4 g). But the lowest mean for cobs per plant (1). Cluster IV
comprising 10 genotypes scored the second highest mean for plant height
(217.5 cm), days to 50% tasseling (59 days), ear length (18.3 cm), ear
circumference (14.9 cm), number of kernel row per cob (14.5), number of
kernel per row (29.4), number of kernel per cob (424.6), 1000 kernel weight
(304 g) and total yield per plant (131.1 g) (Table 14).
Cluster V produced the highest mean for days to 50% tasseling (59.3 days) and
days to 50% silking (62 days) and the lowest mean ear length, ear
circumference, number of kernel row per cob, number of kernel per row,
number of kernel per cob, 1000 kernel weight and total yield per plant. That
means the genotypes of this cluster were late maturing genotypes with lower
yield (Table 14).
Page 100
80
Table 14. Cluster mean values of 12 different characters of 25 genotypes
Parameters I II III IV V
Plant height (cm) 222.5 208.7 215.1 217.5 214.5
Days to 50% tasseling 57.8 57.5 58.3 59 59.3
Days to 50% silking 60.6 59.8 60.4 60.6 62
Ear height (cm) 80 72.5 75.7 74.2 79.8
Cobs per plant 1.1 1.1 1 1.1 1.1
Ear length (cm) 16.5 16.7 19 18.3 15.2
Ear circumference (cm) 13.9 14.2 15 14.9 11.1
Number of kernel row per cob 13.6 12.3 15.3 14.5 11.9
Number of kernel per row 27.8 23.3 36.7 29.4 19.2
Number of kernel per cob 373.3 267.2 552.4 424.6 257.6
1000-kernel weight (g) 291.9 316.7 297.8 304 167.8
Total yield per plant (g) 110.5 107.8 142.4 131.1 56.3
Page 101
81
4.4.1.8 Contribution of characters towards divergence
Contribution of characters towards divergence obtained from CVA is presented
in Table 15. The values of vector-1 and vector-2 revealed that both the vectors
had positive values for plant height, cobs per plant, ear length, number of
kernel per row and 1000-kernel weight. These results indicated that these
characters had the highest contribution towards the divergence among the 25
maize varieties. In vector-1 the other important characters responsible for the
genetic divergence are days to 50% silking and total yield per plant having
positive vector values. While in vector-2 (the second axis of differentiation) ear
circumference and kernel row per plant were important. Negative values in
both vectors for days to 50% tasseling, ear height and number of kernel per cob
had the lowest contribution to the divergence. From the above results it was
revealed that the characters plant height, cob per plant, ear length, number of
kernel per row and 1000-kernel weight contributed maximum total divergence
in maize.
4.4.2 Comparison of result based on different multivariate techniques
Results obtained from different multivariate techniques were super imposed in
Figure 6 from which it was concluded that all techniques gave more or less
similar results and one technique supplemented and confirmed the results of the
other. The cluster pattern of D2 analysis through non-hierarchical clustering has
been taken care of simultaneous variation in all the characters under study.
However the distribution of varieties in different clusters of the D2 analysis has
followed more or less similar trend of the principal component score 1 and
component score 2 of the principal component analysis. The D2 and principal
component analysis were found to be alternative methods in giving the
information regarding the clustering pattern of varieties. Nevertheless, the
canonical variate analysis (CVA) provides the information regarding the
contribution of characters towards divergence of maize varieties.
Page 102
82
Table 15. Relative contributions of the tweelve characters of 25 varieties to
the total divergence
Parameters Vector-1 Vector-2
Plant height (cm) 0.0345 0.0124
Days to 50% tasseling -0.5397 -0.244
Days to 50% silking 0.5368 -0.0844
Ear height (cm) -0.0538 -0.0417
Cobs per plant 5.2016 9.2827
Ear length (cm) 0.0636 0.3053
Ear circumference (cm) -0.1529 1.4005
Number of kernel row per cob -0.3342 0.2967
Number of kernel per row 0.0166 0.3372
Number of kernel per cob -0.0451 -0.0445
1000-kernel weight (g) 0.0012 0.0407
Total yield per plant (g) 0.0175 -0.0158
Page 103
83
4.4.3 Selection of genotypes for future base population development
Selection of genetically diverse parents is an important step for hybridization
program. Multivariate analysis is a useful tool to quantify the degree of
divergence among biological population at genotypic level and in assessing
relative contribution of different components to the total divergence both at
intra and inters cluster levels (Sudre et al. 2005; Majnu et al. 2004 and
Senapoti et al. 2003). Based on the study of genetic diversity of maize, the
genotypes having the different performance and located in the distant clusters
could be utilized for hybridization program to develop desired high yielding
varieties. Clusters by D2
statistics are useful in this matter. The genotypes
grouped together are less divergent than the ones which into different clusters.
Three important points are considered while selecting the genotypes- 1) choice
of the particular cluster from which genotypes are to be used as parents; 2)
selection of particular genotype from the selected cluster and 3) relative
contribution of characters to total divergence (Singh and Chaudhury, 1985).
Contribution of individual characters towards divergence was also observed in
this study. In respect of cluster mean performance of different cluster revealed
that cluster III can be selected for high performance for ear length, ear
circumference, number of kernel row per cob, number of kernel per row,
number of kernel per cob and total yield per plant; cluster II are important for
low plant height, low ear height, minimum days for 50% tasseling and silking
and high 1000-kernel weight. Considering the magnitude of genetic distance,
contribution of character towards divergence, magnitude of cluster mean and
agronomic performance the genotypes G13 for higher ear length, highest
number of kernel per row, number of kernel per cob, highest value for total
yield per plant and G22 for highest number of kernel row per cob from cluster
III; G2 for lowest days to 50% tasseling from cluster I; G5 for lowest days to
50% silking, G11 for highest 1000-kernel weight, G16 for shortest ear height,
G17 for shortest plant height and G23 for high ear circumference from cluster
IV were found promising.
Page 105
84
CHAPTER V
SUMMARY AND CONCLUSION
In order to observed character association and genetic diversity among maize
entries, the present experiment was carried out during March to July, 2014 at
the experimental farm of Department of Genetics and Plant Breeding, Sher-e-
Bangla Agricultural University, Dhaka. The experiment was conducted with 25
varieties of maize of different source for characterization in aspect of
variability, heritability, genetic advance, genotypic and phenotypic co-efficient
of variation, genotype and phenotypic variation, correlation co-efficient effect,
path co-efficient effect and the genetic divergence considering different
important yield and yield contributing characters. The experiment was laid out
in randomized complete block design (RCBD) with 3 replication and seeds of
the different genotypes were sown in separate lines. The result of this study is
summarized as follows:
Analysis of variance revealed highly significant difference among the
accessions for all the characters. The maximum number of leaves per plant was
24 recorded in the genotype khaibhutta and minimum was 20.67 recorded in
the genotype BHM-1 and Dekalb 9120. The maximum leaf length was
recorded in BM-1 (102.22 cm) and minimum in Dekalb super gold (77.08 cm).
Maximum leaf breadth was noted in Pacific 11 (10.74 cm) while minimum in
Barnali (8.68 cm). The minimum and maximum duration for 50% tasseling
was observed in the genotype BHM-9 (55.33 days) and BARI Misti bhutta
(63.33 days), respectively. The minimum days required for 50% silking was in
BHM-9 (57 days) and maximum days were for BARI Misti bhutta (65.33
days). The shortest plant was observed in genotype Dekalb 962 (191.3 cm)
while longest was BM-8 (237.7 cm). The shortest ear height was observed in
genotype Dekalb Super Gold (60.67 cm) while longest was BM-1 (89.33 cm).
Ear length ranged from 15.07 cm to 21.67 cm which was observed in PAC-
399 and Khaibhutta, respectively. The highest ear circumference was found in
Page 106
85
Dekalb 9120(15.70 cm) and lowest ear circumference was found in Khaibhutta
(9.99 cm). The highest number of kernel row per cob was 15.6, produced by
the 4536 and the lowest number of number of kernel row per cob was 11.04,
produced by Khaibhutta. The maximum number of kernel per row were found
(40.4) in the genotypes PAC-399 and minimum number of kernel per row were
found (16.27) in the genotype Khaibhutta. The highest and the lowest number
of kernel per cob were produced by the PAC-399 (591.3) and Khaibhutta
(216.67) respectively. Maximum number of 1000-kernel weight was found in
NK-40 (340.00 g) and minimum in Khaibhutta (143.33 g). The highest total
yield per plant was observed in the genotype PPAC-399 (153.38 g). The lowest
total yield per plant was observed in the genotype BARI Misti bhutta 1 (47.07
g).
Characters like ear height, ear length, ear circumference, number of kernel row
per cob, number of kernel per row, number of kernel per cob, 1000-kernel
weight and total yield per plant exhibited high genotypic and phenotypic co-
efficient of variation. The phenotypic co-efficient of variation was higher than
the genotypic co-efficient of variation for all characters which indicated greater
influence of environment for the expression of these characters. The maximum
differences between phenotypic and genotypic co-efficient of variation were
10.19 and 4.99 respectively, which indicated that cob per plant was mostly
dependent on the environment condition. Amongst the characters, the highest
genotypic co-efficient of variation was recorded for total yield per plant (29.02
g) followed by number of kernel per cob (27.36), number of kernel per row
(21.29) and 1000-kernel weight (20.44 g). The maximum genotypic and
phenotypic variations were 11562.25 and 11914.44 respectively in number of
kernel per cob.
The highest estimated heritability amongst twelve characters of maize was
97.78% for 1000-kernel weight and the lowest was 23.97% for cobs per plant.
The highest genetic advance amongst twelve characters was found in number
of kernel per cob is 218.21 and the lowest genetic advance was carried out in
Page 107
86
cob per plant (0.05). The maximum genetic advance in percent of mean was
observed for total yield per plant (58.84 g), followed by number of kernel per
cob (55.53), 1000 kernel weight (41.63 g) and number of kernel per row
(41.40). High heritability accompanied with high to moderate GCV and genetic
advance indicates that most likely the heritability is due to additive gene
effects.
Again, considering both genotypic and phenotypic correlation co-efficient
among twelve yields contributing characters of 25 maize genotypes, total yield
per plant was positively and significantly correlated with ear length, ear
circumference, number of kernel row per cob, number of kernel per row,
number of kernel per cob and 1000-kernel weight. Path analysis revealed that
days to 50% tasseling, ear length, ear circumference, number of kernel per cob
and 1000-kernel weight showed positive direct effects on yield per plant. On
the other hand plant height, days to 50% silking, number of kernel per row and
number of kernel per row showed negative direct effects on yield per plant.
To estimate genetic diversity, multivariate analysis was performed through
principal component analysis, principal coordinate analysis, cluster analysis
and canonical variate analysis. As per principal component analysis, D2
statistics and cluster analysis, the genotypes were grouped into five different
clusters. Cluster IV consist of highest 10 genotypes viz BHM-9, BHM-8, NK-
40, Pacific 11, Dekalb Super Gold, Dekalb 962, Pacific 98, Dekalb 9120, VA-
786 and Profit. Followed by cluster I which had 7 genotypes viz BHM-3,
BHM-5, BHM-6, BHM-7, Shuvra, BM-1 and BM-6. Cluster III and Cluster V
which had 3 genotype of each viz PAC-399, PAC-984 and 4536 and
Khaibhutta, Brri Misti Bhutta-1 and Khai Bhutta respectively, Cluster II
comprises with two genotypes viz Barnali and VB-100.
The maximum inter-cluster divergence was observed between cluster II and III
(15.665) followed by cluster III and V (14.060), II and V (11.458), IV and V
(10.522), I and III (9.463), I and V (8.498). ) The maximum values of inter-
Page 108
87
cluster distance indicated that the varieties belonging to cluster II were far
diverged from those of cluster III. The distance was minimum between cluster I
and IV (2.870) followed by cluster I and II (6.478), whereas a similar distance
was found between II and IV (8.685) and III and IV (8.685), suggesting a close
relationship among those clusters. The highest intra-cluster distances was
computed for cluster II (2.184) composed of 2 genotypes followed by the
cluster I (2.031) composed of 7 genotypes. However the lowest value (0.760)
of intra-cluster distance in cluster V indicated three genotypes constituted this
cluster might have diverged characters.
In respect of cluster mean performances of different cluster revealed that
cluster III can be selected for yield per plant, ear length, ear circumference,
number of kernel row per cob, number of kernel per row, and number of kernel
per cob. Cluster II were remarkable due to lowest plant height, ear height, days
to 50% tasseling and silking and highest value for 1000-kernel weight.
Considering diversity pattern, genetic status and other agronomic performance,
Barnali and VB-100, from cluster II; PAC-399 and 4536, from cluster III;
Dekalb Super Gold, Dekalb 962 and Dekalb 9120, from cluster IV might be
considered better parents for efficient hybridization programme. Result of
present study revealed that the characters; plant height, cobs per plant, ear
length, number of kernel per row and 1000-kernel weight contributed
maximum divergence among the maize genotypes. Involvement of such diverse
genotypes in crossing programme may produce desirable sergeants. So,
divergent genotypes are recommended to use as parent in hybridization
programme.
Page 110
88
REFERENCES
Abd El-Sattar, A.A. (2003). Genetic parameters estimation from design-1 and
S1 lines in maize. Minufiya J. Agric. Res. 28(5): 1387-1402.
Abel, B.C. and Pollak, L.M. (1991). Rank comparisons of unadapted maize
populations by testers and per se evaluation. Crop Sci. 31: 650-656.
Abirami, S., Vanniarajan, C and Armugachamy, S. (2005). Genetic variability
studies in maize (Zea mays L.) germplasm. Plant Archeives. 5(1): 105-
108.
Abou-Deif, M.H. (2007). Estimation of gene effects on some agronomic
characters in five hybrids and six population of maize (Zea mays L.).
World J. Agric. Sci. 3(1): 86-90.
Afzal, S., Vannirajan, C., and Arumigachamy, S. (2005). Genetic variability
studies in maize germplasm. Plant Arch. 5(1): 105-108.
Aguirre, G., Bellon, M.R. and Smale, M. (1998). A regional analysis of maize
biological diversity in Southeastern Guanajuato, Mexico. CIMMYT
Economics Working Paper. 98-06.
Ahmad, S.Q., Khan, S., Ghaffar, M. and Ahmad, P. (2011). Genetic diversity
analysis for yield and other parameters in maize ( Zea mays L.)
genotype. Asian J. Agril. Sci. 3(5): 385-388.
Ahmad, A. and Saleem, M. (2003). Path coefficient analysis in Zea mays L. Int.
J. Agril. Biol. 5(3): 245-248.
Ahmed, M., Mian, M.A. and Chowdhury, M.A. (1978). Correlation study in
maize. J. Agril. Res. Pakistan. 16: 399-405.
Allison, J.C.S. and Watson, D.J. (1966). The production and distribution of dry
matter in maize afterr flowering. Ann. Bot. 30: 365-38.
Anonymous. (1987). Annual Report. Plant Breeding Division, Maize Section
Bangladesh Agril. Res. Inst. Joydevpur. Gazipur.
Anonymous. (1988). Annual Report. Plant Breeding Division, Maize Section
Bangladesh Agril. Res. Inst. Joydevpur. Gazipur.
Ajmal, S.U., Sohail, K., Saleem, M., and Haq, M.I. (2000). Association
analysis for grain yield and yield components in maize. Pakstan J. Plant
Sci. 6: 12-17.
Page 111
89
Akhter, M.I. and Mittra, B.N. (1990). Advanced yield trial on maize. Proc. 14th
Ann. Bangladesh Sci. Cont. Bangladesh Assoc. Advt. Sci. ohm. p. 45.
AL-Ahmad, A.S. (2004). Genetic parameters for yield and its components in
some new yellow maize crosses. Ph.D. Thesis, Fac. of Agric., Ain
Shams Univ., Egypt.
Alam, B. (1999). Comparison of S1 and testcross evaluation after a cycle of S1
selection in maize (Zea mays L.). M.Sc thesis, NWFP Agricultural
University Peshawar, Pakistan.
Ali, F., Rahman, H., Durrishahwar, Nawaz, I., Muneer, M., Noor, M. and
Ullah, H. (2011). Genetic analysis of maturity and morphological traits
under maydis leaf blight (MLB) ephiphytotics in maize (Zea mays L.).
ARPN J. Agril. Biol. Sci. 6: 13-19.
Ali F., Shah, I.A., Rahman, H., Noor, M., Durrishahwar, Khan, M.Y., Ullah, I.
and Yan, J.B. (2012). Heterosis for yield and agronomic attributes in
diverse maize germplasm. Australian J. Crop Sci. 6: 455-462.
Alvi, M.B., Rafique, M., Shafique, M., Hussain, A., Mohommad, T. and
Sarwar, M. (2003). Characters association and path analysis of grain
yield and yield components in maize. Pakstan J. Biol. Sci. 6(2): 136-
138.
Amer, E.A. and Mosa, H.E. (2004). Gene effects of some plant and yield traits
in four maize crosses. Minofiya J. Agric. Res. 1(29): 181-192.
Amin, A.Z., Khalil, H.A. and Hassan, R.K. (2003). Correlation studies and
relative importance of some plant characters and grain yield in maize
single crosses. Arab Univ. J. Agric. Sci. 11(1): 181-190.
Anshuman, V., Dixit, N.N., Sharma, S.K and Marker, S. (2013). Studies on
heritability and genetic advance estimates in Maize genotypes.
Bioscience Discovery. 4(2):165-168.
Aydin, N., Gökmen, S., Yildirim, A., Öz, A., Figliuolo, G. and Budak, H.
(2007). Estimating genetic variation among dent corn inbred lines and
top crosses using multivariate analysis. J. Appl. Bio. Sci. 1(2): 63-70.
Bahoush, M. and Abbasdokht, H. (2008). Correlation coefficient analysis
between grain yield and its components in corn (Zea mays L.) hybrids.
International meeting on soil fertility land management and
Agroclimatology. Turkey. pp: 263-265
BARI, (1990). A Decade of agronomic research (1978-88). Div. Agron.
Bangladesh Agril. Res. lnst. Gazipur. pp. 29-34.
Page 112
90
BBS (Bangladesh Bureau of Statistics). (2011). Agriculture crop cutting.
estimation of maize 2019-2010. Government of the people’s Republic of
Bangladesh.
Begum, S.N. and Roy, A.K. (1987). Proc. 12"‘ Bangladesh Sci. Conf. Sec. l. p.
58.
Belaj, A., Satovic, L., Rallo, L and Trujillo, R. (2002). Genetic diversity and
relationship in olive germplasm collection as detcnnined by RAPD.
Theory Appl. Genet. 105: 638-644.
Bello, O.B., Abdulmaliq, S.Y., Afolabi, M.S., and Ige, S.A. (2010). Correlation
and path coefficient analysis of yield and agronomic characters among
open pollinated maize varieties and their F1 hybrids in a diallel cross.
African J. Biot. 9(18): 2633-2639.
Bikal, G. and Deepika, T. (2015). Analysis of yield and yield attributing traits
of maize genotypes in Chitwan, Nepal. World J. Agril. Res. 3(5): 153-
162.
Bocanski, J., Sreckov, Z., Nastasic, A. (2009). Genetic and phenotypic
relationship between grain yield and components of grain yield of maize
(Zea mays L.). Genetika. 41(2): 145-154.
Brkic, I., Simic, D., Jambrovic, A., Zdunic, Z. and Ledencan, T. (2003).
Genetic diversity among and within maize inbreds as revealed by 100
SSR markers. Sjemenarstvo. 20(l & 2): 5-14.
Burgess, J.C. and West, D.R. (1993). Selection for grain yield following
selection for ear height in maize. Crop Sci. 33: 679-682.
Canadian Food Inspection Agency (CFIA). (1994). The Biology of Zea mays
(L.) (maize). BIO1994. 11.
Chaudhary, L.B., and Prasad, B. (1968). Genetic variation and heritablity of
quantitative characters in Indian mustard (Brassica Juncea). Indian
J.Agril. Sci. 38: 820-825.
Chen, L., Cui, A.P and Sun, Y.B. (1996). Analysis of the gene effect on ear
characters in maize. Acta Agril. Bareli Sinica. 11(2): 28-32.
Chowdhury, M.A., Vanderberg, L. and Warkentin, T. (2002). Cultiver
identification and genetic relationship among selected breeding lines and
cultivar in chickpea. Euphytica. 127(3): 317-325.
Chowdhury, M.K. and Islam, M.A. (1993). Production and uses of maize.
Bangladesh Agril. Res. Inst. Joydevpur. Gazipur.
Page 113
91
CIMMYT (International Maize and Wheat Improvement Centre). (2008).
Achievement of the Bangladesh -CIMMYT partnership for agricultural
research and development. pp. 1-9.
CIMMYT. (2000). CGIAR Research, Areas of research: maize (Zea mays L.).
Mysore J. Agril. Sci. 29(3): 213-218.
Dabholkar, A.R. (1992). Elements of biometrical genetics. Concept Publishing,
New Dhelhi, India.
Devi, K.T., Mayo, M.A., Reddy, G., Emmanuel, K.E., Larondelle, Y. and Reddy,
D.V.R. (2001). Occurrence of Ochratoxin A inblack pepper, coriander, ginger
and turmeric in India. Food Additives Contamination. 18: 830-835.
Dewey, D.R. and Lu, K.H. (1959). A correlation and path co-efficient analysis
of components of crested wheat grass seed production. Agron. J. 51:
515-518.
Dhillon, B.S. and Prasanna, B.M. (2001). Maize; In "Breeding Food Crops."
Ed. Chopra V.L. Oxford and IBH, New Delhi. Pp: 147-185.
Digby, P., Galway, N. and Lane, P. (1989). Genstat 5: A second course.
Oxford.
Dijak, M., Modarres, A.M. and Hamilton, R.I. (1999). Leafy reduced-stature
maize hybrids for short-season environments. Crop Sci. 39: 1106-1110.
Doebley, J. (1990). Molecular evidence for gene flow among Zea species.
BioScience. 40(6): 443-448.
Dowswell, C.R., Paliwal, R.L. and Cantrell, R.P. (1996). Maize in the third
world. Westview Press, Boulder, USA.
Drinic, S.M., Trifunovic, S., Drinic, G. and Konstantinov, K. (2002). Genetic
divergence and its correlation to heterosis in maize as revealed by SSR-
based markers. Maydica. 47(1): 1-8.
El-Beially, I.E.M.A. (2003). Genetic analysis of yield characters in yellow
maize inbred lines. Zagazig. J. Agric. Res. 30(3): 677-689.
El-Hosary, A.A., Sedhom, S.A. and Mohamed, S.A. (1989). Correlation and
path coefficient studies in maize. Ann. Agric. Sci. 27(3): 1517-1525.
Emer, I. (2011). Correlation and path coefficient analysis in sweet corn Turk. J.
Field Crops. 16(2): 105-107.
Eubanks, M.W. (1993). A cross between Tripsacum dactyloides and Zea
diploperennis. Maize Newsletter. 67: 39.
Page 114
92
Eubanks, M.W. (1997). Further evidence for two progenitors in the origin of
maize. Maize Newsletter. 71: 35-36.
Evans, L.T. (1975). The physiological basis of crop yield. In: Crop Physiology.
Camb. Univ. Press. Cambridge. pp. 327-355.
Falconer, D.S. (1960). Introduction to quantitative genetics. Oliver Boyd,
Edinburg and London. pp. 312-19.
Farhan, A., Muneer, M., Hassan, W., Rahman, H.U., Noor, M.,Tariq Shah, T.,
Ullah, I., Iqbal, M., Afridi, K. and Ullah, H. (2012). Heritability
estimates for maturity and morphological traits based on testcross
progeny performance of maize. ARPN J. Agric. Bio. Sci. 7(5).
Fetahu, S.h., Aliu, S. and Kaçiu, S. (2005). Variability and genetic erosion of
white landrace of Maize (Zea mays L.) in Kosova. Eucarpia,
Proceedings of the XVII Eucarpia Genetic Resources Section Meeting.
Plant Genetics Resources of Geographical and “other” Island.
(Conservation, evaluation and use for plant breeding. Pp: 265-269.
Galinat, W.C. (1988). The origin of corn. In sprague, G.F. and Dudley, J.W.
Eds. Corn and corn improvement. Agronomy Monographs. 18: 1-31.
Garcia Del Moral, L.F., Rharrabti, Y., Villegas, D. and Royo, C. (2003).
Evaluation of grain yield and its components in durum wheat under
Mediterranean conditions. An ontogenic approach. Agron. J. 95:266–
274.
Geetha, K. and Jayaraman, N. (2000). Path analysis in maize (Zea mays L.).
Agric. Sci. Digest. 20:60-106.
Genter, C.F. and Alexander, M.W. (1965). Testcross variability of samples
from a broad based population of maize. Crop Sci. 5: 355-358.
Grzesiak, S. (2001). Genotypic variation between maize (Zea mays L.) single-
cross hybrids in response to drought stress. Act a Physiologiae
Plantarum, 23(4): 443-456.
Hallauer, A.R. and Miranda, J.B. (1988). Quantitative genetics in maize
breeding (2nd ed.). Iowa, Ames. USA: Iowa State University Press.
Hanson, G.H., Robinson, H.F. and Comstock, R.E. (1956). Biometrical studies
of yield in segregating populations of Korean hespedeza. Agron. J. 48:
267-282.
Hemavathy, T.A., Balaji, K., Ibrahim, S.M., Anand, G. and Sankar, D. (2008).
Genetic variability and correlation studies in maize (Zea mays L.).
Agric. Sci. Digest. 28(2): 112-114.
Page 115
93
Hoisington, D., Khairallah, M., Reeves, T. and Ribaut, J.M. (1999). Plant
genetic resources: what can they contribute toward increased crop
productivity. Proc. Natl. Acad. Sci. USA. 96: 5937-5943.
Hsiao, T.C., Acevedo, E., Fereres, E. and Henderson, W.D. (l976). Phil. Trans.
R. Soc. Bot. 273: 475-500.
Ihsan, H., Khalil, I.H., Rehman, H. and Iqbal, M. (2005). Genotypic variability
for morphological traits among exotic maize hybrids. Sarhad J. Agric.
21(4): 599-602.
Ishaq, M., Rahman, H., Hassan, G., Iqbal, M., Khalil, I.A., Khan, S.A., Khan,
S.A., Rafiullah, M. and Hussain, J. (2015). Genetic potential, variability
and heritability of various morphological and yield traits among maize
synthetics. Elect. J. Bio. 11(4): 187-191.
Jager, M.I., Gerethojones, D. and Griffiths, E. (1983). Components of partial
resistance of wheat seedlings to Seporianodrom. Euhpytica. 32: 575-
585.
Jha, P.B., Singh, T.P. and Aktar, S.A. (1979). Analysis of yield components in
early maize germplasm complexes. The Madras Agril. J. 66(9): 56l-564.
Johnson, H.W., Robinson, H.F., and Cornstock, R.E. (1955). Estimates of
environmental variability in soyabeans. Agron. J. 47: 314-318.
Joshi, A.B. and Dhawan, N.L. (1966). Genetic improvement of yield with
special reference to self-fertilizing crops. Indian J. Genet. 26: 101-113.
Jotshi, P.N., Bhat, B.K., and Bhan, M.K. (1988). Genetic variability and
character association in maize grown in Jammu province. Maize Genetic
Cooperation Newsletter, 62: 105-106.
Kamen, J.T. (1983). Plant density, maturity and prolificacy effects on maize
production. Dissertation Abst. Int. 44(2): 3798.
Khazaei, F., Alikhani, M.A., Yari, L. and Khandan, A. (2010). Study the
correlation, regression and path coefficient analysis in sweet corn (Zea
mays var. saccharata) under different levels of plant density and nitrogen
rate. ARPN J. Agric. Biol. Sci. 5: 14-19.
Khumkar, M.S. and Singh, R.D. (2002). Divergence analysis of elite inbred
lines of maize (Zea mays L.). Ann. Agril. Res. 23(4): 595-601.
Kiesselbach, T.A. (1949). The structure and reproduction of corn. Bull
Nebraska Agric. Expt. Sta. Res.161: 1-96.
Page 116
94
Kumar, P., Singh, K., Vikal, Y., Randhawa, L.S. and Chahal, G.S. (2003).
Genetic diversity studies of elite cotton germplasm lines using RAPD
markers and morphological characteristics. Indian J. Genet. 63(1): 5-10.
Kumar, P.G., Prashanth, Y., Kumar, S.S., Reddy, N.V., and Rao, V.P. (2014).
Character association and path coefficient analysis in maize (Zea mays
L.). Int. J. Appl. Bio. Pharm. Tech. 5(1): 257-260
Kumar, S., Shahi, J.P., Singh, J., and Singh, S.P. (2006). Correlation and path
analysis in early generation inbreds of maize (Zea mays L.). Crop
Improvement. 33(2): 156-160.
Kwaga, Y.M., (2014). Correlation coefficients between grain yield and other
characters of maize (Zea mays L.) grown at Mubi in Northern Savanna,
Nigeria. Int. J. Farm Alli. Sci. 3(2): 220-224.
Kwaga, Y.M. (1994). Effects of nitrogen and phosphorus fertilization on
maize/groundnut mixture. M.S. Thesis. Ahmadu Bello University, Zaria.
Pp. 38-39.
Kwon, Y.S., Lee, J.M., Yi, G.B., Yi, S.I., Kim, K.M., Soh, E.H., Bae, K.M.,
Park, E.K., Song, I.H. and Kim, B.D. (2005). Use of SSR markers to
complement tests of Distinctiveness, Uniformity and Stability (DUS) of
pepper (Capsicum annuum L.) varieties. Molecules and Cells 19(3):
428-435.
Lacknay, M.A.E. and Russell, W.A. (1971). Relationship of maize characters
with yield in testcrosses of inbreeds at different plant densities. Crop
Sci. 11: 698-701.
Lee, T.C., Shich, G.J., Ho, C.L. and Juang, J.R. (1986). Analysis of diallel set
of dent and flint maize inbrids for combining ability and heteroses. J.
Agric. Res. 35:145-164.
Li, Y., Shi, Y.S., Song, Y.C., Du, J.Y., Tuberosa, R. and Wang, T.Y. (2004).
Analysis of genetic diversity in maize inbred lines based on AFLP
markers. Maydica. 49(2): 89-95.
Louette, D. and Smale, M. (1998). Farmers' seed selection practices and maize
variety characteristics in a traditionally-based Mexican community.
CIMMYT Economics Working Paper No. 98-04.
Mahmood, Z., Mailk, S.R., Akthar, R. and Rafique, T. (2004). Heritability and
genetic advance estimates from maize genotypes in Shishi Lusht a
valley of Krakurm. Int. J. Agri. Bio. 2(2): 253-257.
Majnu, P.R. and Sreelanthakumary, I. (2004). Genetic divergence in hot chili
(Capsicum chinence Jacq.). Capsicum and Eggplant Newsletter. 23: 69-72.
Page 117
95
Manglesdorf, P.C. (1974). Corn: Its origin, evolution and improvement.
Harvard University Press; Cambridge, Massachusetts. Pp: 1-262.
Matsuoka, Y., Vigouriux, Y., Goodman, M.M., Sanchez, G.J. Buckler, E. and
Doebley, J. (2002). A single domestication for maize shown by
multilocus microsatellite genotyping. Proceeding of the national
academy of sciences 99: 6080-6084.
Mei, C.H., Hsun, T. and Fu, S.T. (1983). Variation of yield formation of maize
in spring and full cropping season. J. Agril. Assoc. China. l25: 6l-71.
Melchinger, A.E., Reif, J.C., Frisch, M., Hoisington, D.A., Beck, D., Pixley, K.
and Warbunon, M.L. (2005). Genetic diversity among CIMMYT maize
inbred lines investigated with SSR markers. Crop Sci. 44(6): 2230-2237.
Mihaljevic, R.C., Schoon, C.C., Utz, H.F. and Melchinger, A.E. (2005).
Correlation and QTL correspondence between line per se and testcross
performance for agronomic traits in four populations of European maize.
Crop Sci. 45: 114-112.
Mohammadi, S.A., Prasanna, B.M. and Singh, N.N. (2003). Sequential path
model for determining inter-relationships among grain yield and related
characters in maize. Crop Sci. 43: 1690–1697.
Mohan, Y.C., Singh, D.K. and Rao, N.V. (2002). Path coefficient analysis for
oil and grain yield in maize (Zea mays L.) genotypes. National J. Plant
Improvement. 4 (1): 75-76.
Mohar, S., Maheshwari, D.K., Mittal, R.K., Sharma, S.K. and Singh, M.
(1999). Genetic variability and correlations of grain yield and other
quantitative characters in lentil (Lens culinaris Medik). Ann. Agric.
Bio. Res. 4(1): 121-124.
Mokate, A.S., Mehetre, S.S., Bendale, V.W. and Birari, S.P. (1998). Genetic
divergence in rice. Adv. Sci. 11(2): 189-192.
More, A.J., Bhoite, K.D. and Pardeshi, S.R. (2006). Genetic diversity studies in
forage maize (Zea muys L.). Res. Crops. 7(3): 728-730.
Mulamba, N.N., Hallauer, A.R. and Smith, O.S. (1983). Recurrent selection for
grain yield in a maize population. Crop Sci. 23: 536-540.
Murthy, R. (1966). Heterosis and combining ability in relation to genetic
divergence in flue cured tobacco. lndian J. Genet. 25: 46-56.
Mustafa, H.S.B., Aslam, M., Ejaz-ul-Hasan., Hussain, F. and Farooq, J. (2014)
Genetic variability and path coefficient in maize (Zea mays L.)
genotypes. J. Agric. Sci. 9:1
Page 118
96
Najeeb, S., Rather, A.G., Parray, G.A., Sheikh, F.A. and Razvi, S.M. (2009).
Studies on genetic variability, genotypic correlation and path coefficient
analysis in maize under high altitude temperate ecology of Kashmir.
Maize Genetics Cooperation Newsletter. 83: 46-47.
Naushad, A.T., Shah, S.S., Ali, S., Rahman, H., Ali, T. and Sajjad, M. (2007).
Genetic variability for yield parameters in maize (zea mays l.)
genotypes. J. Agri. Bio. Sci. 2: 4-5.
Neguly, O., Haidi, M., Ismail, A. and Khamis, M.N. (1983). Genotypic and
phenotypic correlation and path analysis in maize and their implication
in selection. J. Agron. 54: 886-890.
Nemati, A., Sedghi, M., Sharifi, R.S. and Sieedi, M.N. (2009). Investigation of
correlation between traits and path analysis of corn (Zea mays L.) Grain
yield at the climate of Ardabil region (Northwest Iran). Notulae Botanicae
Horti Agrobotanici Cluj-Napoca. 37(1): 194-198.
Nevo, E., Golenberg, E., Beilies, A., Brown, A.H.D. and Zohary, D. (1982).
Genetic diversity and environmental association of wild wheat, Tritium:
in Israel. Theory Appl. Genet. 62: 241-254.
Ogunniyan, D.J. and Olakojo, S.A. (2014). Genetic variation, heritability,
genetic advance and agronomic character association of yellow elite
inbred lines of maize (Zea mays L.). Nigerian J. Genet. 28: 24-28.
Ojo, D.K., Omikunle, O.A., Oduwaye, O.A. Ajala, M.O. and Ogunbayo, S.A.
(2006). Heritability, character correlation and path coefficient analysis
among six inbred- lines of maize (Zea mays L.). World. J. Agric. Sci.
2(3): 352-358.
Okigbo, B.N. (1973). Effect of fertilizer placement on maize development and
yield. Maize experiments on the Nsukka plains (Nigeria). Field crop
Abst. 27(7): 331.
Onn, L.C. (1988). Maximum yield research towards predicting high yields of
maize in Malaysia. Proc. Symposium on maximum yield research Nov.
16-18. New Delhi. India. Field Crop Abst. 43(4): 305-990.
Organisation for Economic Co-operation and Development (OECD). (2006)
Safety Assessment of Transgenic Orgainsms. Consensus document on
the biology of Zea mays sub sp., mays (maize). Pp: 47-71.
Pande, R.C., Rajput, U.S., and Tawari, R.C. (1971). Studies on the yield and
yield components in different hybrids, composites and local variety of
maize (Zea mays L). Mysore J. Agri. Sci. 5(2): 181-186.
Page 119
97
Paradkar, V.K. and Sharma, R.K. (1993). Response of improved maize (Zea
mays L) varieties to nitrogen during the winter season. Indian J. Agron.
38(4): 650-652.
Parh, D.K., Hossain, M.A. and Uddin, M.J. (1986). Correlation and path
coefficient analysis in open pollinated maize (Zea mays L.). Bangladesh
J. Agri. 11: 11-14.
Pavan, R., Lohithaswa, H.C, Wali, M.C., Prakash, G. and Shekara, B.G.
(2011). Correlation and path analysis of grain yield and yield
contributing traits in single cross hybrids of maize (Zea maya L.).
Electron J. Plant Breed. 2: 253-257.
Pavlov, J., Delic, N., Stevanovic, M., Camdzija, Z and Grcic, N. (2003).
Population in high altitude temperate conditions in Kashmir. Indian J.
Agric. Sci. 79(3): 179-180.
Praveen, K.G., Reddy, V.N., Kumar, S.S. and Rao, P.V. (2014). Genetic
variability, heritability and genetic advance studies in newly developed
maize genotypes (Zea mays L.). Int. J. Pure Appl. Biosci. 2(1): 272-275.
Purseglove, J.W. (1972). Tropical Crops: Monocotyledons -1. Longman Group
Limited, London.
Radu, A., Urechean, V., Naidin, C. and Motorga, V. (1997). The theoretical
significance of a mutant in the phylogeny of the species Zea mays L.
Maize Newsletter. 71: 77-78.
Rafalski, A., Wisniewska, J., Adamczyk, M., and Krolikowski, Z. (2001).
Molecular analysis of genetic diversity among maize inbred lines.
Biuletyn-1nstytutu-Hodowli-i- Aklimatyzacji-Roslin. 217: 127-137.
Rafiq, M., Rafique, M., Hussain, A. and M. Altaf, M. (2010). Studies on
heritability, correlation and path analysis in maize (Zea mays L.). J.
Agric. Res. 48(1): 35-38.
Rafique, M., Hussain, A., Mahmood, T., Alvi, A.W. and Alvi, M.B. (2004).
Heritability and inter-relationships among grain yield and yield
components in maize (Zea mays L.). Int. J. Agric. Biol. 6(6): 1113-1114.
Rajesh, V., Kumar, S., Reddy, N.V. and Sanker, S.A. (2013). Studies on
genetic variability, heritability and genetic advance estimates in newly
developed maize genotypes (Zea mays L.). Int. J. Appl. Bio. Pharm.
Tech. 4(4): 242-245.
Rana, M.K., Singh, V.P. and Bhat, K.V. (2005). Assessment of genetic
diversity in upland cotton (Gossypium hirsutum L.) breeding lines by
Page 120
98
using amplified fragment length polymorphism (AFLP) markers and
morphological characteristics. Genet. Resour. Crop Evol. 52: 989–997.
Rather, A.G., Bhatt, M.A. and Zargar, M.A. (2003). Genetic variation in maize
(Zea mays L.) population,in high altitude temperate conditions in
Kashmir. Indian J. Agril. Sci. 79(3): 179-180.
Robinson, H.F., Cornstock, R.E. and Harvey, P.H. (1949). Estimates of
heritability and degree of dominance in corn. Agron. J. 41: 353-359.
Sadek, S.E., Ahmed, M.A. and Abd El-Ghaney, H.M. (2006). Correlation and
path coefficient analysis in five parents inbred lines and their six white
maize (Zea mays L.) single crosses developed and grown in Egypt. J.
Appl. Sci. Res. 2(3): 159-167.
Salama, F.A., Gado, H,E., Goda, A.S and Sadek, S.E. (1994). Correlation and
path coefficient analysis in eight white maize (Zea mays L.) hybrid
characters. Minufiya J. Agric. Res. 19(6): 3009-3020.
Saleque, M.A. (2005). Poultry industries in Bangladesh: Current status and its
future. A BRAC Powerpoint presentation at www.
Poultry.life.ku.dk/4th— saleque.pdf.
Salillari, A., Hyso, M., Faslia, N., Rusinovci, I. (2007). Resurset Gjenetike.
ESHFF, . Tiranë. Pp.269-276.
Satyanarayana, E. and Kumar, R.S. (1995). Genetic variability and per se
performance of non-conventional hybrids in maize. Mysore J. Agric.
Sci. 29(3): 213-218
Sehata, A.H. (1975). Association among metric attributes in varietial maize
populations in relation to their future improvement. Egyptian J. Genet.
Cytology. 4(1): 66-89.
Selvaraj, C.I., Nagarajan, P. (2011). Inter-relationship and path coefficient
studies for qualitative traits, grain yield and other yield related attributed
among maize (Zea mays L.). Int. J. Plant Breed. Genet. (In Press).
Senapati, B.K., Sadu, P.K. and Sarkar, G. (2003). Genetic divergence in chili.
Crop Res. Hisar. 26(2): 314-317.
Shaw, R.H. (1988). Climate requirement. In: Sprague G.F., Dudly J.W eds.
Corn and Corn Improvement. 3rd ed. Madism, WI:ASA p.609.
Shanthi, P.E., Satyanarayana, G., Babu, S. and Kumar, R.S. (2011). Studies on
genetic variability for phenological, yield and quality parameters in
quality protein maize (QPM) (Zea mays L.). Crop Res. 41(1, 2 & 3):
188-191.
Page 121
99
Singh, P., Sain, D., Dwivedi, V.K., Kumar, Y and Sangwan, O. (2005). Genetic
divergence studies in maize (Zea mays L.). Ann. Agric. Biol. Res. 10:
43-46.
Singh, P.K., Jha, P.B. and Kumar, P. (2003). Genetic divergence in fodder
maize. J. Appl. Biol. 13(1-2): 24-28.
Singh, P.K. and Chaudhari, L.B. (2001). Genetic divergence in maize (Zea
mays L.). J. Res. Birsa Agricultural University. 13(2): 193-195.
Singh, D., Jain, G.L. and Gupta, M.L. (1991). Effect of triacontanol based
growth substances on production of rabi maize. Indian J. Agron. 36(2):
267-272.
Singh, R.K. and Chaudhary, B.D. (1985). Biometrical methods in quantitative
genetic analysis. Kalyani Publishers, New Delhi, Ludhiana, India. Pp.
39-78.
Singh, S.P. and Nigam, H.K. (1977). Path co-efficient analysis for yield
components in maize. Allahabad Farmer. 48: 163-165.
Subramanian, P.S., Kolandaiswamy, S. and Subramanian, S. (1981). Path co-
efiicient study in maize. The Madras Agril. J. 68: 61-64.
Sivasubramanjan, S. and Menon, M. (1973). Heterosis and inbreeding
depression in rice. Advances in Agronomy . 47: 85-140.
Sofi, P. and Rather, A.G. (2007). Studies on genetic variability, correlation and
path analysis in maize (Zea mays L.). MNL. 81: 27.
Sreckov, Z.A., Nastasic, J., Bocanski, I., Djalovic, M., Vukosavljev, and
Jockovic, B. (2011) Correlation and path analysis of grain yield and
morphological traits in test-cross population of maize. Pakistan J. Bot.
43(3): 172-173.
Sudre, C.P., Rodrigues, R. and Riva, E.M. (2005). Genetic divergence between
chili and sweet pepper acc. Using multivariate techniques. Horticutura
Brasileir. 23(1): 22-27.
Sumathi, P.A., Kumara, N. and Moharaj, K. (2005). Genetic variability and
traits Inter-relationship studies in inheritability utilized oil rich
CYMMFT Maize (Zea mays L.). Madras Agric. J. 92(10-12): 612-617.
Suresh, H., Sasidharan, N., Chakraborty, S., Macwana, S., Trivedi, R., Punwar,
V.S and Ashish, G. (2013). Genetic diversity among maize varieties
revealed by phenotypic descriptors and RAPD profiles. J. Agric. Sci.
8(2).
Page 122
100
Tomooka, N. (1991). Genetic diversity and Landrace differentiation of
mungbean (Vigna radiate L.). Wilczek and evaluation of its wild
relatives as breeding materials. Tech. Bull. Res. Centre, Japan No.28.
Ministry of Agriculture, Forestry and Fisheries. Japan. 10(4): 15-20.
Triveni, S.A. Kumar, S.C. and Dwivedi, R.P. (2014). Traits based on testcross
progeny performance of maize. ARPN J. Agril. Biol. Sci. 7: 5.
Venugopal, M., Ansari, N.A. and Rajani, K.T. (2003) Correlation and path
analysis in maize. Crop Res. Hisar 25: 525-529.
Viola, G., Reddy, S.S. and Kumar, C.V. (2004). Study on heritability and
genetic advances in elite baby corn (Zea mays L.) lines. Progressive
Agriculture. 3(2): 127-128.
Wannows, A.K., Azzam, H.K. and AL-Ahmad, S.A. (2010). Genetic variances,
heritability, correlation and path coefficient analysis in yellow maize
crosses (Zea mays L.). Agric. Biol. J. N. Am. 1(4): 630-637.
Watson, L. and Dallwitz, M.J. (1992). Grass Genera of the World: descriptions,
illustrations, identification, and information retrieval; including
synonyms, morphology, anatomy, physiology, photochemistry,
cytology, classification, pathogens, world and local distribution, and
references. Version: 18th August 1999.
Williams, T.R. and Hallauer, A.R. (2000). Genetic diversity among maize
hybrids. Maydica. 45(3): 163-171.
Yagdi, K. and Sozen, E. (2009). Heritability, variance components and
correlations of yield and quality traits in durum wheat (Triticum durum
Desf.). Pakstan J. Bot. 41(2): 753-759.
Yasien, M. (2000). Genetic behavior and relative importance of some yield
components in relation to grain yield in maize (Zea mays L.). Ann.
Agric. Sci. 38(2): 689-700.
Yassien, H.E., (1993). Genetic analysis in three yellow maize (Zea mays L.)
crosses. J. Agric. Mansoura University. 24(10): 5319-5331.
Zarei, B., Kahrizi, D., Aboughadareh, A.P. and Sadeghi, F. (2012). Correlation
and path coefficient analysis for determining inter-relationships among
grain yield and related characters in corn hybrids (Zea mays L.). Int. J.
Agril. Crop Sci. 4(20): 1519-1522.
Zuzulya, A.L. (1979). Correlation between characters reflecting potential yield
in maize. Kukuruza. l2: 27-28.
Page 124
101
APPENDICES
Appendix I. Map showing the experimental site
The
exp
eri
me
nta
l sit
e
Page 125
102
Appendix II. Monthly record of air temperature, relative humidity and
rainfall of the experimental site during the period of March,
2014 to July 2014
Month Air temperature (0C) Relative humidity
(%)
Rainfall
(mm) (total)
Maximum Minimum Maximum Minimum
March, 2014 37.4 20.2 80.2 32.4 3.80
April, 2014 39.4 19.4 80.2 39.2 65.60
May, 2014 38.2 19.3 89.2 40 202
June, 2014 37.2 17.4 88.4 46.3 282.7
July, 2014 35.6 18.2 88.2 55.4 107.8
Source: Bangladesh Meteorological Department (Climate & Weather Division),
Agargoan, Dhaka -1207
Appendix III. Soil test result of the experimental filed reported by Soil
Resources Development Institute (SRDI), Khamarbari,
Farmgate, Dhaka
Element Levels in the soil plot
pH 5.9
N 0.071%
K 0.31 meq/100g soil
Ca 6.36 meq/100g soil
P 14.04 µg/g soil
S 15.16 µg/g soil
B 0.30 µg/g soil
Page 126
103
Appendix IV. Descriptors with codes for qualitative characteristics
Characteristics
Category
State of expression
Leaf width of the blade
Very small <5 cm
Small 5-7 cm
Medium 7.1-9 cm
large 9.1-11 cm
Plant height
Short 125-150 cm
Medium 150-175 cm
Medium long 175-200 cm
Long 200-225 cm
Very long >225 cm
Plant: Ratio height of insertion
of upper ear to plant length (ear
placement)
Short <40%
Medium 40-50%
Medium long 51-60%
Long 61-70%
Very long >70%
Time of anthesis
Very early <40 days
Early 40-45 days
Medium 45-55 days
Late 55-65 days
Very late >65 days
Time of silk emergence
Very early <52 days
Early 52-57 days
Medium 58-62 days
Late 63-67 days
Very late >67 days
Color of top grain
Pure white Pure white
Brown Brown
Yellow Yellow
Ear shape
Conical Conical
Conical-cylindrical Conical-cylindrical
Cylindrical Cylindrical
Page 127
104
Appendix IV (Contn’d).
Characteristics
Category
State of expression
Ear circumference without
husk
Very small <2.5 cm
Small 2.6-3.5 cm
Medium 3.6-5.0 cm
Large 5.1-7 cm
Very large >7 cm
Ear length
Very small 12.6-15 cm
Small 15.1-17.5 cm
Medium 17.6-20 cm
Large 20.1-22.5 cm
Very large >22.5 cm
Number of rows of kernel per
cob
Very few 8 rows
Few 8.1-10 rows
Medium 10.1-14 rows
Many 14.1-16 rows
Very many >16 rows
Kernel row arrangement
Straight Straight
Spiral Spiral
Irregular Irregular
1000-kernel weight
10-15g 10-15g
15.1-20g 15.1-20g
20.1-25g 20.1-25g
25.1-30g 25.1-30g
30.1-35g 30.1-35g
35.1-40g 35.1-40g
40.1-45g 40.1-45g
>45.1g >45.1g
Page 128
105
Appendix V. Mean performance of 12 characters of 25 genotypes of maize
Genotype
Leaf length
(cm)
Leaf breadth
(cm)
Leaves per
plant
Days to
anthesis
Days to
silk
emergence
G1 94.34 10.11 23.33 48.67 52.33
G2 81.11 9.83 20.67 45.67 48.67
G3 91.44 8.85 21.67 47.67 50.67
G4 92.22 9.06 23 46.67 50.00
G5 91.44 10.19 21.33 45 48
G6 88 9.91 22 45.33 49
G7 102.22 9.66 23.67 43 49.67
G8 88.81 10.33 23.33 52 55
G9 88.44 9.46 24 46.33 49.67
G10 89.44 9.66 21.67 51 52.33
G11 92.4 10.05 22 49.67 50.67
G12 82.22 10.74 21.67 47.67 50.33
G13 92.89 10.33 21.33 51 52.67
G14 82.44 9.94 21 53.33 58
G15 100.33 10.16 21.33 52.33 53.67
G16 100.33 10.16 21.33 52.33 55.67
G17 77.08 9.79 23.33 52 54.33
G18 82.33 9.13 21.67 43.67 50.33
G19 83.88 8.93 21 48 50.67
G20 84.11 8.68 21.33 49 50.67
G21 90.89 10.13 22.67 46 51
G22 82 9.94 23.33 49.33 51
G23 84.11 9.79 22.33 50.33 52.67
G24 85.55 8.72 20.67 54 55.67
G25 88 9.72 22.33 48.33 51
Page 129
106
Appendix VI. Mean performance of 12 characters of 25 genotypes of maize
Genotype PH (cm) D50T D50S EH (cm) CPP EL (cm)
G1 214.07a-f 58.33a-c 60.00b-d 77.67b-f 1.20 16.47f-h
G2 201.55c-f 55.00c 58.67cd 75.00c-f 1.08 16.10f-h
G3 222.22a-d 58.33a-c 60.67a-d 73.67def 1.07 16.77e-h
G4 233.33ab 56.67bc 60.00bcd 84.00abc 1.03 15.37gh
G5 229.05a-c 55.33c 57.00d 78.67b-f 1.03 16.98d-h
G6 223.35a-d 56.67bc 59.33bcd 85.00abc 1.07 16.85e-h
G7 225.56a-d 58.33abc 61.33abd 89.33a 1.10 17.63c-h
G8 237.66a 61.33ab 64.00ab 75.67cdef 1.17 15.96fgh
G9 217.91a-f 58.33abc 61.33a-d 73.67def 1.20 15.10h
G10 232.00ab 62.00ab 61.67a-d 80.33a-e 1.10 17.00d-h
G11 217.86a-f 59.67abc 61.00a-d 76.00c-f 1.10 19.15bcd
G12 214.54a-f 59.33abc 59.67bcd 78.00b-f 1.20 16.58fgh
G13 211.19a-f 59.33abc 62.00a-d 86.33ab 1.00 21.67a
G14 231.95ab 63.33a 65.33a 81.00a-d 1.00 15.33h
G15 234.56ab 59.33abc 60.67a-d 77.33b-f 1.00 16.44fgh
G16 198.92def 60.33abc 62.00abcd 60.67h 1.13 18.05cdef
G17 191.33f 59.00abc 61.33a-d 71.33d-g 1.10 16.04fgh
G18 193.78ef 56.33bc 59.33bcd 84.67abc 1.21 15.07h
G19 209.31b-f 57.00bc 59.00bcd 76.33b-f 1.10 16.55fgh
G20 208.17b-f 58.00abc 60.67a-d 68.67fgh 1.07 16.93d-h
G21 222.22a-d 57.00bc 58.33cd 77.00b-f 1.03 19.32bc
G22 199.44def 56.33bc 58.67cd 63.33gh 1.00 18.99bcde
G23 220.00a-e 58.00abc 62.67abc 73.33d-g 1.00 20.80ab
G24 229.55abc 61.67ab 62.67abc 76.33b-f 1.03 19.70abc
G25 219.44a-f 57.67abc 60.00bcd 70.67e-h 1.00 19.59abc
MEAN 217.56 58.51 60.69 76.56 1.08 17.38
LSD5 28.24 5.78 5.05 10.12 0.16 2.28
SE 5.15 1.05 0.92 1.85 0.06 0.42
PH=Plant height (cm), D50T=Days to 50% tasseling, D50S=Days to 50% silking,
EH= Ear height (cm), CPP=Cob per plant, EL=Ear length (cm),
Page 130
107
Appendix VI (cont’d).
Genotype EC (cm) NKRC NKR NKC TKW (g) TYP (g)
G1 13.05cde 12.60c-f 30.33cd 387.25e-g 310.00b-d 117.98d-h
G2 14.08a-e 13.97a-e 26.53c-f 362.93f-h 283.33d-f 113.29e-i
G3 14.92abc 13.61a-e 27.54c-f 390.83efg 273.33ef 128.68b-f
G4 14.53a-e 14.42abc 28.50cde 389.49efg 286.67def 109.49f-j
G5 14.29a-e 14.24a-d 30.12cd 415.52def 290.00de 114.8d-i
G6 13.84a-e 14.06a-d 27.67c-f 359.39fgh 306.67bcd 98.11ij
G7 12.86de 13.36a-f 25.24d-g 340.61gh 290.00de 101.40hij
G8 14.04a-e 13.43a-e 28.70cd 382.36efg 293.33cde 104.77g-j
G9 10.74fg 13.03b-f 22.67e-h 306.00hi 186.67g 73.21k
G10 14.71a-d 14.18a-d 28.59cde 402.46def 310.00bcd 118.82d-h
G11 15.31ab 14.14a-d 28.67cde 404.87def 340.00a 142.11ab
G12 14.54a-e 14.27a-d 29.59cd 431.86de 320.00abc 138.27abc
G13 15.27ab 15.33ab 40.40a 591.37a 303.33bcd 153.38a
G14 12.55ef 11.67ef 18.67gh 250.00ij 173.33g 47.07l
G15 14.32a-e 14.87abc 37.33ab 514.49bc 283.33def 133.00bcd
G16 14.32a-e 14.86abc 30.46cd 439.76de 286.67def 130.00bcde
G17 14.49a-e 14.48abc 30.09cd 413.15def 306.67bcd 122.74c-g
G18 9.99g 11.04f 16.27h 216.67j 143.33h 48.53l
G19 13.41b-e 11.98def 21.40fgh 261.76ij 306.67bcd 93.85j
G20 14.93abc 12.53c-f 25.11d-g 272.68ij 326.67ab 121.67c-g
G21 14.79a-d 14.72abc 30.74bcd 461.37cd 325.00ab 143.54ab
G22 15.40ab 15.60a 32.43bc 551.47ab 306.67b-d 140.89abc
G23 15.70a 15.07ab 28.70cde 431.57de 260.00f 116.66d-i
G24 15.39ab 14.59abc 28.54cde 417.26def 295.00cde 139.33abc
G25 15.22ab 14.33a-d 28.70cde 428.33de 306.67bcd 144.55ab
MEAN 14.11 13.85 28.12 392.94 284.53 115.85
LSD5 2.04 2.38 6.63 59.43 27.72 19.23
SE 0.37 0.43 1.21 10.84 5.05 3.51
EC=Ear circumference (cm), NKRC=Number of kernel row per cob,
NKR=Number of kernel per row, NKC=Number of kernel per cob,
TKW=1000-kernel weight (g), TYP=Total yield per plant (g).
Page 131
108
Appendix VII. Photograph showing different field view of experimental plot
Page 132
109
Appendix VII (Cont’d).