International Journal of Food Microbiology 163 (2013) 80–88
Contents lists available at SciVerse ScienceDirect
International Journal of Food Microbiology
j ourna l homepage: www.e lsev ie r .com/ locate / i j foodmicro
Characterisation of commercial and natural Torulaspora delbrueckiiwine yeast strains
Valmary van Breda a,1, Neil Jolly b,⁎, Jessy van Wyk a
a Cape Peninsula University of Technology, PO Box 1906, Bellville, 7535, South Africab ARC Infruitec-Nietvoorbij, Private Bag X5026, Stellenbosch, 7599, South Africa
Forty-three South African Torulaspora delbrueckii yeast isolates from the ARC Infruitec-Nietvoorbij yeast cul-ture collection, the T. delbrueckii type strain (CBS 1146), one reference T. delbrueckii strain (CBS 4663), twoT. delbrueckii strains isolated from commercial yeast blends (Viniflora® Harmony.nsac and Viniflora®Melody.nsac), and a commercial Saccharomyces cerevisiae yeast (VIN 13) had their identities confirmed andwere characterised using conventional and molecular microbiological techniques. These included a selectionof growth media as well as CHEF electrophoretic karyotyping and PCR-RFLP analyses. Based on the biochem-ical and physiological results the strains were divided into 13 groups. The performances of the yeasts were alsomonitored by means of laboratory-scale fermentations in grape must at 15 °C and 22 °C. The fermentationkinetic data showed that at 22 °C, the yeasts were divided into two distinct groups, a faster and a slowerfermenting group. The fermentation curves of the laboratory-scale study at 15 °C showed that, at this lowertemperature, the yeasts also fermented at different speeds, but the fermentation curves showed greater sep-aration. The biochemical and physiological grouping did not coincide with the fermentation abilities and goodfermenters could be found in more than one group. Chemical analyses of the resultant wines (alcohol, volatileacidity, glycerol, total SO2, residual sugar) were used in Principle Component Analyses. The yeasts thatgrouped close to the S. cerevisiae reference strain (VIN 13) showed more acceptable wine chemical profiles,while those further away displayed less acceptable profiles. Three locally isolated strains and one commercialT. delbrueckii yeast strain, Viniflora® Harmony.nsac. produced wines with acceptable chemical profiles at bothtemperatures. These strains also had comparable fermentation kinetics to the S. cerevisiae reference. Therefore,depending on the fermentation temperature, different T. delbrueckii strains will be suitable for specific winestyles and somemay even be considered for single inoculations without S. cerevisiae in industrial fermentations.
The complex microbial process that constitutes wine-making in-volves the sequential development and interaction of microorgan-isms. These include various species of yeasts, lactic acid bacteria,acetic acid bacteria and filamentous fungi (Combina et al., 2005a,2005b; Dicks et al., 2009; Rainieri and Pretorius, 2000). The yeast pop-ulation found on the grape surface, and on winery equipment, usuallyconsists of a mixture of Saccharomyces and different species of non-Saccharomyces yeasts (Egli et al., 1998; Erten and Campbell, 2001;Holm Hansen et al., 2001; Mortimer and Polsinelli, 1999; Van Keulen etal., 2003). The non-Saccharomyces yeasts are typically from the generaCandida, Hanseniaspora, Pichia (Hansenula), Torulaspora, Issatchenkia,Metschnikowia, Kluyveromyces (Lachancea) and Zygosaccharomyces(Combina et al., 2005a; Hierro et al., 2006).
+27 21 809 3002.
it, Vine and Wine Institute of
l rights reserved.
One non-Saccharomyces yeast that is drawing considerable atten-tion in wine industries is Torulaspora delbrueckii (anamorph Candidacolliculosa). T. delbrueckii is a typical representative of the naturalflora on the grape surface and, just like Saccharomyces cerevisiae,can be found in most wine producing regions (Benda, 1982; Jolly etal., 2006). T. delbrueckii, formerly known as Saccharomyces rosei orSaccharomyces delbrueckii is an ascomycetous yeast, that has beenre-classified many times which resulted in the description of numer-ous taxa that are now known as synonyms (Kurtzman and Fell, 1998;Kurtzman et al., 2011; Kreger-van Rij, 1984; Lodder, 1970; Oda et al.,1997; Yarrow, 1984). Currently there are six accepted speciesassigned to the Torulaspora genus, T. delbrueckii, Torulaspora globosa,Torulaspora franciscae, Torulaspora microellipsoides, Torulaspora maleeaeand Torulaspora pretoriensis (Kurtzman, 2003; Kurtzman et al., 2011).However, strains of T. delbrueckii show variation in their ability to fer-ment and assimilate carbon compounds, thus contributing to the uncer-tain description of this species (Limtong et al., 2008; Lodder, 1970; Vander Walt, 1970; Van der Walt and Johansen, 1975; Vaughan–Martini etal., 1999). T. delbrueckii has previously been suggested for vinification ofmusts low in sugar and acid, and has been used for the production of red
81V. van Breda et al. / International Journal of Food Microbiology 163 (2013) 80–88
and roséwines in Italy (Castelli, 1948) and for Sauvignon Blanc in SouthAfrica (Jolly et al., 2003b).
Studies conducted by Bely et al. (2008) recently showed thatT. delbrueckii has high fermentation purity and produces very lowlevels of volatile acidity and acetaldehyde. As a result, T. delbrueckiispecies may contribute positively to the flavour of alcoholic beverageswhile producing lower levels of volatile acidity than S. cerevisiae (CianiandMaccarelli, 1998; Ciani and Picciotti, 1995). Strains of T. delbrueckiihave also been commercialised by two European and one Canadianyeast manufacturer and are being used under standard conditions, inmixed or sequential cultures with S. cerevisiae (Ciani and Maccarelli,1998; Ciani and Picciotti, 1995; Ciani et al., 2006). The uncertain de-scription of this species in the past together with the natural variationfound amongst yeasts implies that there is potential for strains withimproved performance compared to the commercial strains.
The aim of this studywas therefore to characterise and evaluate a se-lection of South African T. delbrueckii yeast isolates under different con-ditions in comparisonwith thefirst commercialised T. delbrueckii strainsby applying physiological and molecular microbiological techniques.
2. Materials and methods
2.1. Yeast strains
Forty seven T. delbrueckii yeast strains and one S. cerevisiae (strainVIN 13, Anchor Bio-Technologies, Cape Town, South Africa) wereused in this study. Of the 47 T. delbrueckii strains, 43 were obtainedfrom the ARC Infruitec-Nietvoorbij microbiological culture collection.These strains were isolated between 1997 and 2000 from four dif-ferent geographical regions in the Western Cape, South Africa, identi-fied and stored under cryo-preservation at −80 °C (Jolly et al.,2003a). The T. delbrueckii type strain (CBS 1146) and another referencestrain (CBS 4663) were purchased from CBS (Centraalbureau voorSchimmelcultures, The Netherlands). Two commercial T. delbrueckiireference strains were also isolated from commercial active driedyeast blends, Viniflora® Harmony.nsac and Viniflora® Melody.nsac(CHR Hansen, Denmark) and designated HAR and MEL, respectively.All yeasts were maintained on Yeast Peptone Dextrose Agar (YPDagar) (Biolab, Merck, South Africa) plates and slants and stored at4 °C until required.
2.2. Electrophoretic characterisation
Intact chromosomal DNAwas separated using contour-clamped ho-mogeneous electric field electrophoresis (CHEF) (DR II system, Bio-RadLaboratories, Richmond, USA) to confirm the non-Saccharomyces statusof the isolates. Yeast cells were cultured in 100 mLYPD broth for±18 hat 28 °C and harvested by centrifugation at 8000 rpm for 10 min. Thepellets werewashed twice with 10 mMEDTA pH 7.5 buffer and furtherpreparation was according to the methods of Carle and Olson (1985)and Hoff (2012). Separation was carried out in 20 cm, 0.8% Seakem®GTG® agarose (Lonza, USA) gels in a 0.5× TBE buffer at 14 °C. The run-ning conditions of Oda and Tonomura (1995) (Block 1: 72 h, 300 s,300 s, 2.2 V cm−1 at 14 °C and Block 2: 24 h, 480 s, 480 s, 2.2 V cm−1
at 14 °C) were used except that the second block was extended to48 h. Gels were stained with ethidium bromide (Promega, Madison,WI, USA) and visualized using theMolecular Imager® Gel Doc™ XR sys-tem with FPQuest™ software (Bio-Rad Laboratories, USA).
Polymerase chain reaction restriction fragment length polymor-phism (PCR-RFLP) analyses were also conducted on yeast cells grownon YPD agar plates for 48 h at 30 °C. Single yeast colonies were selectedand suspended in 10 μL sterile distilled water. Flocculating yeasts weregrown in 5 mL YPD broth for 24 h, suspensions were mixed well and2 μL was added to 10 μL de-ionised water.
The amplification of the ITS1-5.8S-ITS2 region was carried out usingthe forward and reverse primers ITS1 (5′-TCCGTAGGTGAACCTGCGG-3′)
and ITS4 (5′-TCCTCCGCTTATTGATATGC-3′) (Metabion, Germany)(White et al., 1990). Amplifications were carried out in final volumesof 50 μL of reaction mixture containing 2 μL DNA, 10 μL PCR reactionbuffer (5×) (Promega, Madison, WI, USA), 0.5 μL dNTP (2.5 mM)(TaKaRa, Japan), 3.5 μL MgCl2 (Promega, Madison, WI, USA), 0.5 μL ofthe ITS1 and ITS4 primers (100 mM) (Metabion, Germany), 0.1 μLGoTAQ (Promega, Madison, WI, USA) and 23.9 μL of sterile de-ionisedwater. Amplifications were performed in an iCycler (Bio-Rad laborato-ries, USA) (initial denaturing cycle at 94 °C for 4 min followed by 36 cy-cles of amplification; denaturing at 94 °C for 1 min; annealing at 48 °Cfor 2 min; extension at 72 °C for 20 s; elongation step at 72 °C for4 min). Amplified samples were frozen until used. Restriction of thePCR product was performed in 30 μL reaction volumes consisting of15 μL of the PCR amplifiedmixture and 15 μL of restriction enzymemix-ture. The restriction enzymes BamHI, EcoRI and HinfI (Roche, Germany)were applied according to the manufacturer's instructions.
The amplified PCR product and restriction fragment products wereseparated in a 1.5% (w/v) agarose gel (SeaKem® LE, Lonza, USA)containing 10 μL GelRed™ nucleic acid stain 10,000× (Biotium, USA)in 0.5% TBE buffer at 100 V for 120 min and 100 V for 80 min, respec-tively. Approximate sizes of amplicons were determined using amolecular weight marker (100-bp plus O'GeneRuler™ DNA ladder,Fermentas). Visualization was under UV transillumination using thepreviously mentioned Gel Doc™ XR system with FPQuest™ software.
2.3. Biochemical and physiological characterisation
Lysine medium (Biolab) was prepared according to the manufac-turer's instructions and used for confirmation of the Saccharomycesor non-Saccharomyces status, respectively. Selective carbon sourcemedia were also used in spot-plate studies according to the methodsof Van der Walt and Yarow (1984). An agar base was prepared usingAgar Technical (Difco, Becton Dickinson and Company) and yeast ni-trogen base (Difco, Becton Dickinson and Company) and supple-mented with the following filter-sterilised carbon sources at 20 g/L:sorbitol (BDH, England); glycerol (Saarchem, Merck, South Africa);mannitol (Kimix, South Africa); sucrose (Scienceworld, South Africa);galactose (Sigma-Aldrich, South Africa); maltose (Saarchem); and2-gluconate (Sigma-Aldrich). Sporulation ability of the yeasts wastested on sporulation media prepared according to the method ofSherman et al. (1986) and visually inspected under 400× magnifica-tion. Morphological appearance was investigated on Chromagar™Candida (Chromagar, Anatech, South Africa), prepared according tothe manufacturer's instructions.
Biochemical profiles of each of the isolates were generated usingthe ID 32 C AUX system (BioMérieux, South Africa). The results gen-erated were interpreted using the apiweb™ identification software.The results of the biochemical and physiological characterisationwere used to group the South African isolates into 13 groups.
2.4. Laboratory-scale fermentations
Laboratory-scale fermentations were conducted in duplicate at22 °C and 15 °C, respectively. A previously frozen, clarified CheninBlanc/Chardonnay blend (1:1 ratio) grape must was used. The mustwas divided into 450 mL aliquots and autoclaved at 121 °C for15 min. The yeasts used in the study were pre-cultured in 10 mLYeast Peptone Dextrose broth (YPD broth) (Biolab), and incubated at20 °C overnight. The grape must aliquots were subsequently inoculat-ed at a concentration of 2%. Fermentation caps filled with distilledwater were placed on each bottle and held in place with parafilm®to ensure anaerobic conditions. The fermentations were conductedon a Gyrotory® shaker (G10, New Brunswick Scientific) at 121 rpm.The bottles were weighed daily for the first three days and every sec-ond day thereafter to monitor the CO2 weight loss. These data wereused to plot fermentation curves. Total sugar, total acidity, pH (Central
1 2 3 4 5 6 7 8 9 10 11
82 V. van Breda et al. / International Journal of Food Microbiology 163 (2013) 80–88
Analytical Laboratories, Stellenbosch University) and total SO2 (Aspi-ration method, Integral Laboratories, Stellenbosch) were measuredon the autoclaved must. The resultant wine was analysed for: alcohol,volatile acidity (VA) and glycerol (Central Analytical Laboratories).Total SO2 (Rippermethod) and residual sugar (RS) (Rebeleinmethod)analyses were done using the methods described in the South AfricanWine Laboratories Association (SAWLA) manual (Anonymous, 2002).
2.5. Statistical analysis
Alcohol, total SO2, RS, VA and glycerol concentrations were sub-jected to principal component analysis (PCA) using XLStat software(XLStat, Version 2011, Addinsoft, New York, USA) to examine the rela-tionships amongst and between the variables and observations.
Fig. 1. CHEF profiles showing the difference in banding pattern between Torulasporadelbrueckii and Saccharomyces cerevisiae (lanes 1 & 11: S.cerevisiae; 2–5 & 7–9:T. delbrueckii isolates; 6: HAR; 10: T. delbrueckii type strain).
3. Results and discussion
In comparison to S. cerevisiae, the deliberate use of non-Saccharomycesyeast in wine production is in its infancy. While there are over 200 com-mercial S. cerevisiae yeasts available world-wide, only three T. delbrueckiicommercial strains are available to wine industries. Although the num-ber of commercial T. delbrueckii strainswill probably never reach that ofS. cerevisiae, there is undoubtedly scope for more strains.
The natural T. delbrueckii isolates used in this study were previous-ly identified by using a combination of karyotyping by CHEF gel elec-trophoresis and ID 32 C biochemical profiles to group similar yeasts(Jolly et al., 2003a). Representative yeasts were identified by CBS(The Netherlands).
Fig. 2. RFLP patterns of Torulaspora delbrueckii and Saccharomyces cerevisiae strains(lanes M: DNA ladder; 2: S cerevisiae; 3: type strain; 4: Y0185; 5 & 8–14: T. delbrueckiiisolates; 6: MEL; 7: HAR) with restriction enzyme HinfI (Roche, Germany).
3.1. Electrophoretic characterisation
Modernmolecular techniques are now replacing older microbiolog-ical techniques in identifying organisms across various industries. Inthis study the non-Saccharomyces status and identity of the naturalisolates were confirmed by CHEF gel electrophoresis, polymerase chainreaction and restriction fragment length polymorphism (PCR-RFLP) anal-ysis of the ITS1–ITS2 region (5.8S-ITS).
The banding pattern of Saccharomyces and T. delbrueckii isolatesdiffered significantly, with the Saccharomyces having 14 chromosomalbands and the T. delbrueckii varying from 4 to 6 (Fig. 1). Standard CHEFrunning conditions for non-Saccharomyces yeasts were first applied to1.2% agarose gels (Jolly et al., 2003a), but did not result in good sepa-ration. To improve separation of the bands, the running conditions ofOda and Tonomura (1995) for T. delbrueckii yeasts were then applied.Further improvements in separation were achieved by increasing therunning time to 48 h in the second block of the conditions of Odaand Tonomura (1995).
The PCR-RFLP analysis of the ITS1–ITS2 region (5.8S− ITS) did notshow high length variation between these regions for the S. cerevisiaeand T. delbrueckii yeasts (810 bp for the T. delbrueckii strain and880 bp for the S. cerevisiae yeast strain). Subsequently, RFLP analyseswere performed to further digest these ITS regions.
The restriction endonucleases showed identical restriction pat-terns amongst strains of the same species, including the type strain.When the PCR products were digested with the BamHI restrictionendonuclease, no digestion was observed. However, when the rRNAgene region was digested with HinfI (Fig. 2) and EcoRI restrictionendonucleases, each species showed specific restriction patternsmaking it possible to differentiate between, and to confirm identityof the Saccharomyces and non-Saccharomyces yeast species successfully(Esteve-Zarzoso et al., 1999; Fernández et al., 1999; Guillamón et al.,1998; Šuranská et al., 2012). Data for the BamHI and EcoRI restrictionendonucleases are not shown.
3.2. Biochemical and physiological characterisation
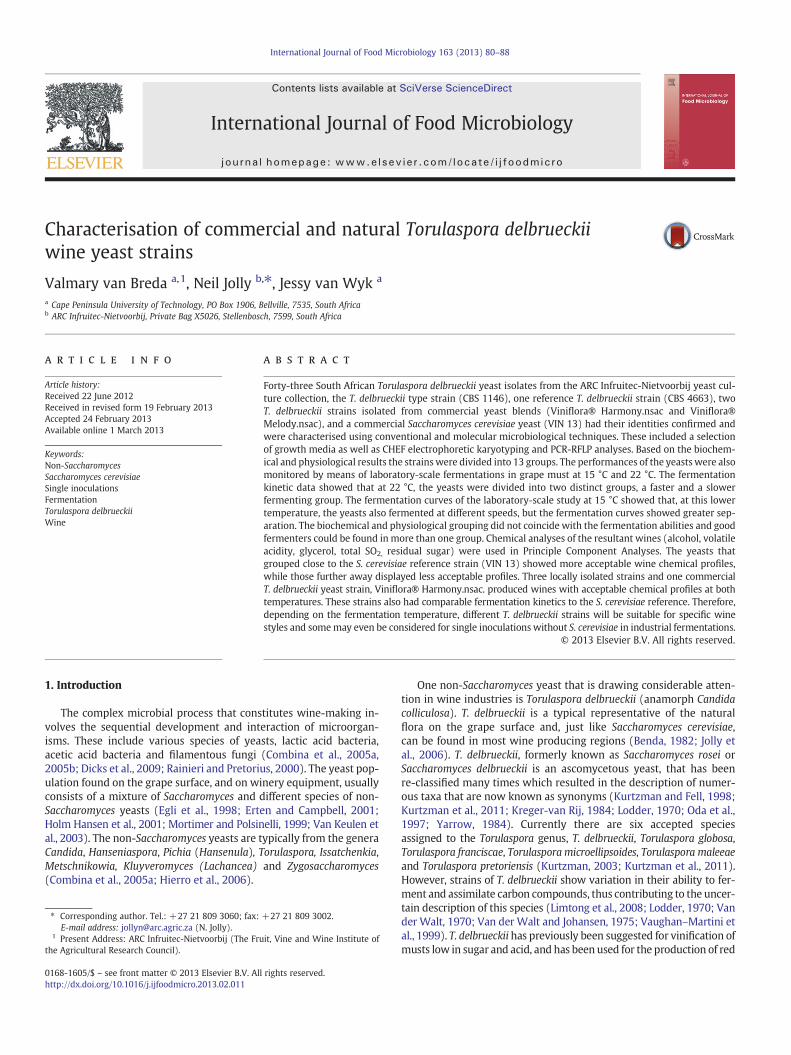
The growth profiles observed on the various media are shown inTable 1. The ability or inability of the yeast strains to grow on the se-lected media and morphological appearance enabled the division ofthe South African strains into 13 groups. The largest group contained17 strains, followed by groups of seven, six, three and two strains, re-spectively. The remaining eight groups contained one strain each.None of the groups matched that of the profiles of the T. delbrueckiireference strains, underlining the wide diversity amongst the isolates.All the T. delbrueckii yeasts showed growth on Lysine medium, whilethe S. cerevisiae reference strain (VIN 13) did not, again confirm-ing the non-Saccharomyces and Saccharomyces status of the yeasts, re-spectively. The single carbon sources were originally chosen based ondifferences and/or similarities between T. delbrueckii and S. cerevisiae,as shown in the yeast taxonomic manual (Kurtzman and Fell, 1998;Kurtzman et al., 2011). Most strains grew on sorbitol, except theS. cerevisiae reference strain and the single yeast strain in group VIII(Table 1). The T. delbrueckii yeasts also showed growth on glycerol, man-nitol and sucrose media. S. cerevisiae showed no growth on the mannitolmedia, butwas able to utilise the sucrosemedia. Thiswas in linewith tax-onomic data (Kurtzman and Fell, 1998). The yeast isolates were generallynot able to grow on the galactose and maltose media, with a few excep-tions, including the S. cerevisiae strain. These results agree with the find-ings of Kreger-van Rij (1984). Growth for the T. delbrueckii strains onthe 2-gluconate medium varied considerably, from good growth (+),through weak growth (±) to no growth (−) (Table 1). However,as expected, no growth was observed for S. cerevisiae on this
Table 1Characterisation of natural South African Torulaspora delbrueckii isolates compared to commercial and reference strains.
Groups No ofstrains
Biochemical and physiological characterisation ID 32C
1 Centraalbureau voor Schimmelcultures.2 Viniflora® Harmony.nsac and Viniflora® Melody.nsac.3 + good growth.4 ± weak growth.5 No growth.6 Anamorphic form of T. delbrueckii.
83V. van Breda et al. / International Journal of Food Microbiology 163 (2013) 80–88
medium. Considering all the results depicting the ability or inabili-ty of the strains to utilise the various carbon sources (Table 1), thisfurther confirms the non-Saccharomyces and Saccharomyces statusof the yeast strains.
The Chromagar™ Candida, containing various chromogenic compo-nents which lead to the yeast colonies assuming a specific colour, isaimed at differentiating major clinical Candida species. According tothe manufacturer's specifications the specified morphological colourchanges for these species range from ‘green’ and ‘metallic blue’ to‘fuzzy pink’, while for other species it ranges from ‘white’ to ‘mauve’.The majority of the T. delbrueckii isolates appeared cream/yellow, withthe exception of a few which appeared yellow, white or cream on theagar. However, contrary to expectations, they did not exactly matcheither the type strain (CBS 1146) or the other T. delbrueckii reference
0
5
10
15
20
25
30
35
40
45
50
0 5
CO
2W
eig
ht L
oss
(g
)
Time
South African Isolates CBS 1
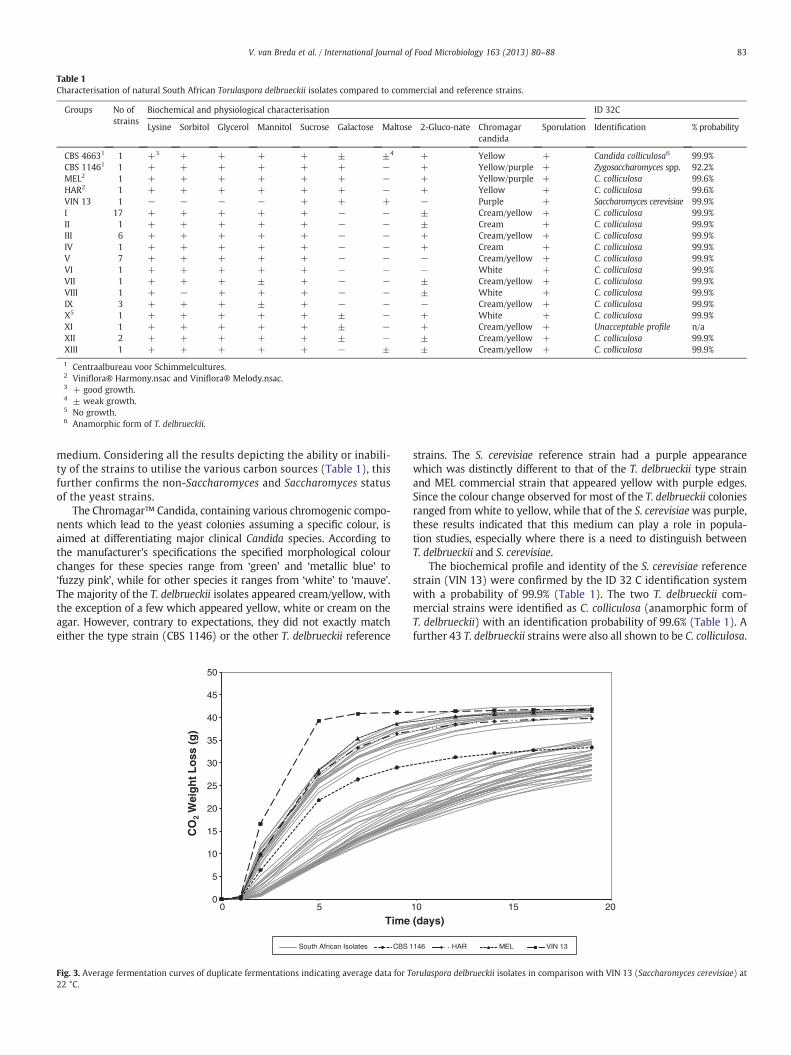
Fig. 3. Average fermentation curves of duplicate fermentations indicating average data for T22 °C.
strains. The S. cerevisiae reference strain had a purple appearancewhich was distinctly different to that of the T. delbrueckii type strainand MEL commercial strain that appeared yellow with purple edges.Since the colour change observed for most of the T. delbrueckii coloniesranged from white to yellow, while that of the S. cerevisiaewas purple,these results indicated that this medium can play a role in popula-tion studies, especially where there is a need to distinguish betweenT. delbrueckii and S. cerevisiae.
The biochemical profile and identity of the S. cerevisiae referencestrain (VIN 13) were confirmed by the ID 32 C identification systemwith a probability of 99.9% (Table 1). The two T. delbrueckii com-mercial strains were identified as C. colliculosa (anamorphic form ofT. delbrueckii) with an identification probability of 99.6% (Table 1). Afurther 43 T. delbrueckii strains were also all shown to be C. colliculosa.
10 15 20
(days)
146 HAR MEL VIN 13
orulaspora delbrueckii isolates in comparison with VIN 13 (Saccharomyces cerevisiae) at
Fig. 4. Average fermentation curves of duplicate fermentations indicating average data for Torulaspora delbrueckii isolates in comparison with VIN 13 (Saccharomyces cerevisiae) at15 °C.
84 V. van Breda et al. / International Journal of Food Microbiology 163 (2013) 80–88
The identification probability for these yeasts was 99.9%. The CBS 1146type strain was identified as a Zygosaccharomyces spp. with a 92.2%probability and the single representative of Group XI could not beidentified. The test was repeated several times to validate the results.The apparent anomaly in the result for the type strain could be linkedto the unknown origin of this strain (DrMarizeth Groenewald, CuratorYeast Division, CBS, personal communication, 2011), and it may nothave been a wine isolate. As already mentioned, there has been con-troversy and confusion as to what genus T. delbrueckii should beclassified as. This could be a possible explanation for the misidenti-fication of the type strain by the ID 32 C system. Although the identi-fication profile of the South African isolates did not match that ofthe type strain, their ID 32 C profiles did match that of the commercialT. delbrueckii yeast strains. This underlines the necessity of alwaysusing the ID 32 C system in conjunction with other techniques forthe identification of T. delbrueckii yeasts. All the isolates showedgrowth on the sporulation media with the characteristic ascosporeshape under magnification. This further confirmed their identity asT. delbrueckii.
Table 2Average values of the slope over 17 days of fermentations for Torulaspora delbrueckii isolat
1 n = number of fermentations.2 The higher the slope value, the faster the fermentation speed.3 Centraalbureau voor Schimmelcultures.4 Viniflora® Harmony.nsac and Viniflora® Melody.nsac.
3.3. Laboratory-scale fermentations
Chenin Blanc is the most widely planted white grape variety inSouth Africa and is often blended with Chardonnay for a specificwine style. A representative blend of this must was therefore chosenfor the laboratory-scale fermentations (total sugar: 21.5 ºB; totalacidity: 7.0 g/L; pH: 3.69; total SO2: 10.4 mg/L). The fermentationability of all the yeasts was monitored by measuring CO2 weight lossat 22 °C and 15 °C, respectively. The average data was used to drawthe fermentation curves (Figs. 3 and 4). Fig. 3 shows that at 22 °Cthe yeasts were divided into two distinct groups, a faster and a slowerfermenting group where 18 natural isolates fermented at a faster rateand 25 fermented at a slower rate. The CBS 1146 type strain did notperformwell in terms of its fermentation ability and fell in the middleof the two groups while clustering with the slower-fermenting yeastsat the end of fermentation. The two commercial strains (MEL andHAR) were part of the group of strains that included S. cerevisiae andfermented at a faster rate. A number of the South African T. delbrueckiistrains were also included in this group and showed potential to be
es compared to commercial and reference T. delbrueckii strains.
85V. van Breda et al. / International Journal of Food Microbiology 163 (2013) 80–88
used in further fermentation studies. Moreover, one natural isolate,from group V (strain 654), finished the fermentation at a similar rateto the S. cerevisiae reference strain.
The fermentation curves of the laboratory-scale study at 15 °C(Fig. 4) showed that, at this lower temperature, the yeasts alsofermented at different rates. Fourteen isolates fermented at a fasterrate and 29 fermented at a slower rate (compared to the type strain),but the spread between the fermentation curves was greater than at22 °C. As at 22 °C, the S. cerevisiae reference strain fermented fasterthan the T. delbrueckii strains. The CBS 1146 type strain again dis-played an average performance, while the two commercial referencestrains (MEL and HAR) showed relatively good fermentation abilities,but not as high as at 22 °C. The same strain in group V (strain 654) thatperformed well at 22 °C, again performed well at 15 °C with an endpoint very close to the S. cerevisiae fermentation curve, closer thanboth commercial T. delbrueckii strains (MEL and HAR).
T. delbrueckii yeasts took longer to ferment (26 days) at 15 °Ccompared to 22 °C (19 days). The total CO2 weight loss at the differ-ent temperatures was the same for the S. cerevisiae reference strain
Table 3Average data of chemical analyses of laboratory-scale fermentations at 22 °C.
and the T. delbrueckii strains that fermented at a similar rate (Figs. 3and 4).
The slope of the logarithmic phase (seventeen days of active fer-mentation) (Table 2) showed that the biochemical and physiologicalgrouping (groups I to XIII) did not coincide with the fermentationabilities of the T. delbrueckii yeasts. Strains with rapid fermentationabilities were found in many groups.
Chemical analyseswere performed on thewines resulting from thelaboratory-scale fermentations (Tables 3 and 4). The VA values formost of the yeast strains were similar (0.3–0.5 g/L) at 15 °C and22 °C. Only one T. delbrueckii strain from group III produced higherlevels of VA, namely 0.7 g/L at 15 °C and 1.0 g/L at 22 °C. Althoughthese VA levels were more than double that produced by the otherT. delbrueckii yeast strains and the S. cerevisiae reference strain, itstill fell within the permissible limit for South African wines (1.2 g/L)(Anonymous, 1989). Alcohol production by the South AfricanT. delbrueckii strains at 15 °C and 22 °C also fell within the acceptablelegal limit forwines, namely≤15%. Itwas also observed that the alcoholproduction for all yeast strains was lower at 15 °C than at 22 °C.
86 V. van Breda et al. / International Journal of Food Microbiology 163 (2013) 80–88
The concentration of glycerol produced was generally higher formost of the South African T. delbrueckii yeast strains at 22 °C (5.0–13 g/L) than at 15 °C (5.0–7.9 g/L) (Tables 3 and 4). Glycerol is amajor product of alcoholic fermentation and although it has no directimpact on the aromatic characteristics of wine, it can have a notableeffect on sweetness and mouth-feel (Swiegers et al., 2005). Glycerolis normally present in dry and semi-sweet wines in concentrationsranging from 5 to 14 g/L and it has been shown that at concentrationsof 5.2 g/L it imparts sweetness in dry white wines (Swiegers et al.,2005). Although the concentration of glycerol produced by theS. cerevisiae reference strain (VIN 13) was lower than that producedby most T. delbrueckii strains at both temperatures, all glycerol levelswere well within the normal range for dry and semi-sweet whitewines (Swiegers et al., 2005) (Tables 3 and 4).
The RS analyses at 22 °C supported the fermentation curve trendswith ten T. delbrueckii yeasts that fermented to RS levels below 10 g/L;three with RS between 10 and 30 g/L and the remainder with RSabove 30 g/L (Table 3).
The best performing isolate, strain 654 from group V (Fig. 3) wasable to ferment the must to dryness (5 g/L RS) (Table 3) as defined
by South African legislation (Anonymous, 1989). Although this winehad a higher total SO2 level than the reference strain (Table 3), itwas still within acceptable limits.
The RS analyses at 15 °C also supported the fermentation curvetrends with six T. delbrueckii yeasts that fermented to RS levelsbelow 10 g/L, nine with RS between 10 and 30 g/L and the remainderwith RS above 30 g/L. The same strain in group V (strain 654) wasonce again able to ferment the must to dryness (b5 g/L RS), but thewine again had a higher total SO2 level than the reference strains(Table 4). This was similar to those recorded for the fermentations at22 °C. This is not desirable in wines as the high levels of SO2 couldnegatively affect the wine fermentation and quality, and could also in-hibit sensitive co-inoculant wine yeasts and malolactic bacteria (Jolly etal., 2003b). Although the SO2 levels were higher, all except one fell with-in the legal permissible limits for South African wines (≤160 mg/L)(Anonymous, 1989).
The PCA bi-plots (Figs. 5 and 6) showed the spatial relationshipbetween better and poorer performing yeasts with regards to thechemical analyses. The commercial reference strains, HAR and MELclustered near the S. cerevisiae reference strain (VIN 13) and had
I
III
VII
V
V
III
V (654)
V
VIII
VI
III
III
HARIII
IX
II
V
IX
VII I
I
V
I
I
IIII
I
I
I
X
XII
XII
I
XIIX
I
I
II
IV I
XIII
MEL
CBS 1146
VIN 13
CBS 4663
Volatile acidity (g/L)
Alcohol (% v/v)
Glycerol (g/L)
Residual sugar (g/L)
Total SO2 (mg/L)
-3
-1
1
3
5
-6 -4 -2 0 2 4 6
F2
(22.
20 %
)
F1 (55.84 %)F1
First Principal ComponentF2Second Principal Component
Fig. 5. Principal component analysis of the chemical analysis at 22 °C illustrating where the yeasts grouped together for specific compounds. Strains that cluster around Saccharomycescerevisiae are included in the circle.
87V. van Breda et al. / International Journal of Food Microbiology 163 (2013) 80–88
similar chemical analyses at both fermentation temperatures for VA(0.3–0.4 g/L), alcohol (12–13%), glycerol (5–6 g/L), and total SO2
(31–43 mg/L), but higher RS values (Tables 3 and 4).Natural isolates that clustered close to the aforementioned reference
strainswere three representatives from groups V and III with the best, agroup V strain (strain 654). This strain performed well at both temper-atures and, apart from having similar volatile acidity, alcohol and glyc-erol to that of the S. cerevisiae reference strain, as already mentioned,were also able to ferment to dryness at 15 °C (Table 4).
4. Conclusions
The application of the CHEF karyotyping and PCR-RFLP of the5.8S-ITS region in this study allowed the differentiation betweenSaccharomyces and non-Saccharomyces yeast strains and confirmationof the identity of the T. delbrueckii strains. Nonetheless, it was evidentfrom the limited characterisation of the South African strains that a
F1First Principal Component
F2Second Principal Component
I
III
VV
III
V (654)
V
III
HAR III
I
V
X
XII XII
I
I IV
MEL
CBS 11
VIN 13
CBS 4663
Volatile acidity (g
Alcohol (% v/v)
Glycerol (g/L)
-3
-1
1
3
5
-6 -4 -2
F2
(24.
14 %
)
F1 (50
Fig. 6. Principal component analysis of the chemical analysis at 15 °C illustrating where the yecerevisiae are included in the circle.
large diversity is found within the strains investigated. None of themmatched the biochemical profiles of the type strain and commercialstrains.
The laboratory-scale fermentations showed that not all theT. delbrueckii yeast strains were suitable for use in wine production.However, three T. delbrueckii strains from groups III and V showed po-tential for wine production as single inoculants or as co-inoculantswith a S. cerevisiae yeast strain. In addition, the commercial T. delbrueckiiyeast strain (MEL) also showed potential to be used as a single inoculantfor wine production at 22 °C. Although the manufacturer's technicaldata suggest that the optimal temperature for the commercial refer-ence strain HAR is 15–28 °C, the T. delbrueckii component was foundto perform better at 22 °C than 15 °C. Therefore, depending on thefermentation temperature, different T. delbrueckii strains will besuitable for specific wine styles. Further studies with these yeaststrains should be performed to validate their performance under in-dustry conditions.
VIIVIII
VIIII
IXI
I
VIX
V
II
II I
I
IIII
I
IXI
IX
III
I
XIII46
/L)
Residual sugar (g/L)Total SO2 (mg/L)
0 2 4 6
.56 %)
asts grouped together for specific compounds. Strains that cluster around Saccharomyces
88 V. van Breda et al. / International Journal of Food Microbiology 163 (2013) 80–88
Acknowledgements
The authors wish to thankWinetech, the ARC and CPUT for the finan-cial support, the ARC Biometry Unit for statistical assistance and the ARCInfruitec-Nietvoorbij Post Harvest and Wine Technology division for theuse of their laboratories and facilities as well as the Microbiology teamfor technical assistance.
References
Anonymous, 1989. The Liquor Products Act, Regulation no 60 of 1989. URL http://www.sawis.co.za (accessed on 27 June 2011).
Anonymous, 2002. Methods of Analyses for Wine Laboratories. South African WineLaboratories Association (SAWLA), HEH signs, Bellville.
Bely, M., Stoeckle, P., Masneuf-Pomarède, I., Dubourdieu, D., 2008. Impact of mixedTorulaspora delbrueckii–Saccharomyces cerevisiae culture on high-sugar fermenta-tion. International Journal of Food Microbiology 312–320.
Benda, I., 1982. Wine and brandy, In: Reed, G. (Ed.), Prescott and Dunn's IndustrialMicrobiology, fourth ed. The AVI Publishing Company, USA, pp. 293–402.
Carle, G.F., Olson, M.V., 1985. An electrophoretic karyotype for yeast. Proceedings of theNational Academy of Sciences 82, 3756–3760.
Castelli, F., 1948. Yeasts of wine fermentations from various regions of Italy. Rivista diViticoltura e di Enologia 1, 258–264.
Ciani, M., Maccarelli, F., 1998. Oenological properties of non-Saccharomyces yeasts as-sociated with wine-making. World Journal of Microbiology and Biotechnology14, 199–203.
Ciani, M., Picciotti, G., 1995. The growth kinetics and fermentation behaviour of somenon-Saccharomyces yeasts associated with wine-making. Biotechnology Letters17, 1247–1250.
Ciani, M., Beco, L., Comitini, F., 2006. Fermentation behaviour and metabolic interac-tions of multistarter wine yeast fermentations. International Journal of FoodMicrobiology 108, 239–245.
Combina, M., Elía, A., Mercado, L., Catania, C., Ganga, A., Martinez, C., 2005a. Dynamicsof indigenous yeast populations during spontaneous fermentation of wines fromMendoza, Argentina. International Journal of Food Microbiology 99, 237–243.
Combina, M., Mercado, L., Borgo, P., Elia, A., Joofre, V., Ganga, A., Martinez, C., Catania, C.,2005b. Yeasts associated to Malbec grape berries fromMendoza, Argentina. Journalof Applied Microbiology 98, 1055–1061.
Dicks, L.M.T., Todorov, S., Endo, A., 2009. Microbial interactions. In: König, H., Unden, G.,Fröhlich, J. (Eds.), Biology ofMicroorganisms on Grapes. Must and inWine. Springer–Verlag, Berlin, pp. 335–347.
Egli, C.M., Edinger, W.D., Mitrakul, C.M., Henich-Kling, T., 1998. Dynamics of indigenousand inoculated yeast populations and their effect on the sensory character ofRiesling and Chardonnay wines. Journal of Applied Microbiology 85, 779–789.
Erten, H., Campbell, I., 2001. The production of low-alcohol wines by aerobic yeasts.Journal of the Institute of Brewing 107, 207–215.
Esteve-Zarzoso, B., Belloch, C., Uruburu, F., Querol, A., 1999. Identification of yeasts byRFLP analysis of the 5.8S rRNA and the two ribosomal internal transcribed spacers.International Journal of Systematic Bacteriology 49, 329–337.
Fernández, M.T., Ubeda, J.F., Briones, A.I., 1999. Comparative study of non-Saccharomycesmicroflora of musts in fermentation, by physiological and molecular methods. FEMSMicrobiology Letters 173, 223–229.
Guillamón, J.M., Sabaté, J., Barrio, E., Cano, J., Querol, A., 1998. Rapid identification ofwine yeast species based on RFLP analysis of the ribosomal internal transcribedspacer (ITS) region. Archives of Microbiology 169, 387–392.
Hierro, N., Gonzalez, A., Mas, A., Guillamón, J.M., 2006. Diversity and evolution of non-Saccharomyces yeast populations during wine fermentation: effect of grape ripe-ness and cold maceration. FEMS Yeast Research 6, 102–111.
Hoff, J.W., 2012. Molecular typing of wine yeasts: Evaluation of typing techniques andestablishment of a database. Master's Thesis, Stellenbosch University, Private BagX1, 7602 Matieland (Stellenbosch), South Africa.
Holm Hansen, E., Nissen, P., Sommer, P., Nielsen, J.C., Arneborg, N., 2001. The effect of ox-ygenon the survival of non-Saccharomyces yeasts duringmixed culture fermentations
of grape juice with Saccharomyces cerevisiae. Journal of Applied Microbiology 91,541–547.
Jolly, N.P., Augustyn, O.P.H., Pretorius, I.S., 2003a. The occurrence of non-Saccharomycesyeast species over three vintages in four vineyards and grape musts from four pro-duction regions of theWestern Cape, South Africa. South African Journal of Enologyand Viticulture 24, 35–42.
Jolly, N.P., Augustyn, O.P.H., Pretorius, I.S., 2003b. The effect of non-Saccharomycesyeasts on fermentation and wine quality. South African Journal of Enology andViticulture 24, 55–62.
Jolly, N.P., Augustyn, O.P.H., Pretorius, I.S., 2006. The role and use of non-Saccharomycesyeasts in wine production. South African Journal of Enology and Viticulture 27,15–39.
Kreger-van Rij, N.J.W., 1984. In: Kreger-van Rij, N.J.W. (Ed.), The Yeasts — a TaxonomicStudy, third ed. Elsevier Science Publishers, Groningen: Netherlands.
Kurtzman, C.P., 2003. Phylogenetic circumscription of Saccharomyces, Kluyveromycesand other members of the Saccharomycetaceae, and the proposal of the new gen-era Lanchancea, Nakaseomyces, Naumovia, Vanderwaltozyma and Zygotorulaspora.FEMS Yeast Research 4, 233–245.
Kurtzman, C.P., Fell, W.F., 1998. In: Kurtzman, C.P., Fell, W.F. (Eds.), The Yeasts — a Tax-onomic Study, fourth ed. Elsevier Science Publishers, Amsterdam, pp. 404–410.
Kurtzman, C.P., Fell, J.W., Boekhout, T., 2011. In: Kurtzman, C.P., Fell, W.F., Boekhout, T.(Eds.), fifth ed. The Yeasts — a Taxonomic Study, vol. 2. Elsevier Science Publishers,Amsterdam, pp. 471–481 (867–874).
Limtong, S., Imanishi, Y., Jindamorakot, S., Ninomiya, S., Yongmanitchai, W., Nakase, T.,2008. Torulaspora maleeae sp. nov., a novel ascomycetous yeast species from Japanand Thailand. FEMS Yeast Research 8, 337–343.
Lodder, J., 1970. The Yeasts — a Taxonomic Study. Northern-Holland Publishing Com-pany, Amsterdam.
Mortimer, R.K., Polsinelli, M., 1999. On the origins of wine yeast. Research in Microbi-ology 150, 199–204.
Oda, Y., Tonomura, K., 1995. Electrophoretic karyotyping of the yeast genus Torulaspora.Letters in Applied Microbiology 21, 190–193.
Oda, Y., Yabuki, M., Tonomura, K., Fukunaga, M., 1997. Re-examination of yeast strainsclassified as Torulaspora delbrueckii (Lindner). International Journal of SystematicBacteriology 47, 1102–1106.
Rainieri, S., Pretorius, I.S., 2000. Selection and improvement of wine yeasts. Annals ofMicrobiology 50, 15–31.
Sherman, F., Fink, G.R., Hicks, J.B., 1986. Laboratory Course Manual in Yeast Genetics.Cold Spring Harbour Laboratory, New York.
Šuranská, H., Vránová, D., Omelková, J., Vadkertiová, R., 2012. Monitoring of yeast pop-ulation isolated during spontaneous fermentation of Moravian wine. Chemical Pa-pers 66, 861–868.
Swiegers, J.H., Bartowsky, E.J., Henschke, P.A., Pretorius, I.S., 2005. Yeast and bacterialmodulation of wine aroma and flavour. Australian Journal of Grape and Wine Re-search 11, 139–173.
Van der Walt, J.P., 1970. Criteria and methods used in classification, In: Lodder, J.(Ed.), The Yeasts — a Taxonomic Study, second ed. Elsevier Science Publishers,Amsterdam, pp. 34–113.
Van der Walt, J.P., Johansen, E., 1975. The genus Torulaspora Lindner. Council of Scien-tific and Industrial Research Rep. Pretoria, 325, pp. 1–23.
Van der Walt, J.P., Yarow, D., 1984. Methods for the isolation, maintenance, classifica-tion and identification of yeasts, In: Kreger-van Rij, N.W.J. (Ed.), The Yeasts — aTaxonomic Study, third ed. Elsevier Science Publishers, Amsterdam, pp. 45–104.
Van Keulen, H., Lindmark, D.G., Zeman, K.E., Gerlosky, W., 2003. Yeasts present duringspontaneous fermentation of Lake Erie Chardonnay, Pinot Gris and Riesling.Antonie Van Leeuwenhoek 83, 149–154.
Vaughan-Martini, A., Pollacci, P., Barcaccia, S., 1999. A reconsideration of species desig-nations of some strains of the Industrial Yeasts Collection DBVPG assigned to thegenus Torulaspora. Annali di Microbiologica ed Enzimologia 49, 67–77.
White, T.J., Bruns, T., Lee, S., Taylor, J., 1990. PCR protocols. A guide to methods and ap-plications. In: Innis, M.A., Felfand, D.H., Sninsky, J.J., White, T.J. (Eds.), Amplificationand Direct Sequencing of Fungal Ribosomal RNA Genes for Phylogenetics. ElsevierAcademic Press, San Diego, pp. 315–322.
Yarrow, D., 1984. Torulaspora Lindner. In: Kreger-van Rij, N.J.W. (Ed.), The Yeasts — aTaxonomic Study. Elsevier Science Publishers, Amsterdam, pp. 434–448.